Mitigation of the Variability of a PV Fleet via ...
6
HAL Id: hal-02369219 https://hal.univ-reunion.fr/hal-02369219 Submitted on 18 Nov 2019 HAL is a multi-disciplinary open access archive for the deposit and dissemination of sci- entific research documents, whether they are pub- lished or not. The documents may come from teaching and research institutions in France or abroad, or from public or private research centers. L’archive ouverte pluridisciplinaire HAL, est destinée au dépôt et à la diffusion de documents scientifiques de niveau recherche, publiés ou non, émanant des établissements d’enseignement et de recherche français ou étrangers, des laboratoires publics ou privés. Mitigation of the Variability of a PV Fleet via Geographical Dispersion and Energy Storage Systems on the Reunion Island Non-Interconnected Grid Emeric Tapaches, Richard Perez, Philippe Lauret, Marc Perez, Mathieu David To cite this version: Emeric Tapaches, Richard Perez, Philippe Lauret, Marc Perez, Mathieu David. Mitigation of the Variability of a PV Fleet via Geographical Dispersion and Energy Storage Systems on the Reunion Island Non-Interconnected Grid. PVSC 46, 46th IEEE Photovoltaic Specialists Conference, Jun 2019, Chicago, United States. hal-02369219
Transcript of Mitigation of the Variability of a PV Fleet via ...

HAL Id: hal-02369219https://hal.univ-reunion.fr/hal-02369219
Submitted on 18 Nov 2019
HAL is a multi-disciplinary open accessarchive for the deposit and dissemination of sci-entific research documents, whether they are pub-lished or not. The documents may come fromteaching and research institutions in France orabroad, or from public or private research centers.
L’archive ouverte pluridisciplinaire HAL, estdestinée au dépôt et à la diffusion de documentsscientifiques de niveau recherche, publiés ou non,émanant des établissements d’enseignement et derecherche français ou étrangers, des laboratoirespublics ou privés.
Mitigation of the Variability of a PV Fleet viaGeographical Dispersion and Energy Storage Systems on
the Reunion Island Non-Interconnected GridEmeric Tapaches, Richard Perez, Philippe Lauret, Marc Perez, Mathieu David
To cite this version:Emeric Tapaches, Richard Perez, Philippe Lauret, Marc Perez, Mathieu David. Mitigation of theVariability of a PV Fleet via Geographical Dispersion and Energy Storage Systems on the ReunionIsland Non-Interconnected Grid. PVSC 46, 46th IEEE Photovoltaic Specialists Conference, Jun 2019,Chicago, United States. �hal-02369219�

Mitigation of the Variability of a PV Fleet via Geographical Dispersion and Energy Storage Systems on the Reunion Island Non-Interconnected
Grid Emeric Tapachèsa, Richard Perezb, Philippe Laureta, Marc Perezc, and Mathieu Davida
a PIMENT Laboratory, University of Reunion Island, Tampon, La Réunion, 97400, France b Atmospheric Sciences Research Center, State University of New York at Albany, Albany, New York, 12207, USA
c Clean Power Research, Napa, California, 94559, USA
Abstract — In this paper, the geographical dispersion of
PV installations and Energy Storage System (ESS) are studied to smooth PV production on Reunion Island. Despite the small area of the Island, the results show that with dispersion at the total grid scale, the variability driven by weather conditions (unpredictable variability) is almost removed. Then a centralized EES management at grid scale and a few large EES units could mitigate the variability even further with a relative low cost.
I. INTRODUCTION
In 2017, the share of renewables in the electricity generation of Reunion Island was 32.4%. The rest comes from imported fossil energies (coal, fuel and diesel) which negatively impact both the local environment and the economy. In order to be no longer dependent on imported fossils fuels, the local authorities have the ambition to become self-sufficient for the production of electricity by 2030. To achieve this goal, a mix of available local renewable energies (i.e. biomass, hydro, solar, wind, geothermal, wave, OTEC) will probably be realized. Whatever the future energy mix, it will still have to provide inertia and frequency control reserves to the grid, and having a part of dispatchable generation in order to balance electricity supply and demand at any time.
The authors of this paper will focus on the photovoltaic
(PV) and the penetration of this production into the island grid. PV has many advantages : more and more cost-effective, free energy source, easy to install, very low maintenance and operations, good life cycle, can be distributed on the grid and installed on roofs, parking, along roadsides, on greenhouse or over water bodies. This last point is attractive for Reunion Island because land pressure is high. On the other hand, a few drawbacks limit the high penetration of PV because the current production is: intermittent (driven by solar path), highly variable (affected by the weather), partially controllable (e.g. only curtailment is possible), difficult to forecast. PV changes the grid architecture and its regulation in comparison with the conventional generation means (e.g. nuclear, coal or hydro). As explained by [1] and [2], PV could negatively
impact the grid balance/management. These impacts concern: planing the supply-demand balance (i.e. regulation of the grid frequency), voltage regulation, reverse power flow, inertia, frequency control reserve, protection of people and property, unintentional islanding and other. In Reunion Island, by experience and at the moment, the electric system operator cares mainly about grid frequency stability and therefore the aggregated PV production is a major concern. Concerning the local voltage fluctuations, they are contained by limiting the power factor of each installation having more than 36 kVA.
To secure the injection of PV on the grid, some operators
limit the maximum instantaneous penetration rate of intermittent productions (e.g. about 30% for the non-interconnected grids in France) and/or limit the rate ramp of these productions (e.g. 10% of rated capacity per minute in Puerto Rico [3]). Some approaches to mitigate PV production variability (i.e. to limit its ramp rate) exist: geographical dispersion, curtailment (only for positive ramp rate) or storage. Several papers have shown the smoothing effect of PV dispersed generation for different locations like Ontario [4], Andalusia [5], Hawaii [6] and Reunion [7]. Energy Storage System (ESS) to smooth PV production is also largely investigated in the literature. [8] represents a deep review of these approaches and classify three types of methods: (i) moving average and exponential smoothing based methods, (ii) filter based methods, and (iii) ramp-rate based algorithms. They found that moving average is a simple method largely used by researchers, however this method overbuild the capacity of the ESS and decrease its lifetime. Filter based methods and ramp-rate based algorithms have better performances. [9] arrived at similar findings and also showed that ESS sized for power variability mitigation can also provide inertia emulation and primary control reserve, which increase the value of ESS for the grid.
This paper presents a first investigation of possible solutions
to mitigate aggregated PV production variability on Reunion Island in order to facilitate its large-scale integration. To this end, geographical dispersion and smoothing of aggregated PV output with ESS are applied at different spatial scale. The aim
is to quantify the spatial footprint and the ESS size needed to limit the variability.
The paper is organized as follows: Section II presents the
electrical grid of Reunion island while section III describes the methods and result of the mitigation of PV output variability. Section IV closes the paper with some conclusions, recommendations and perspectives.
II. CASE STUDY: REUNION ISLAND GRID
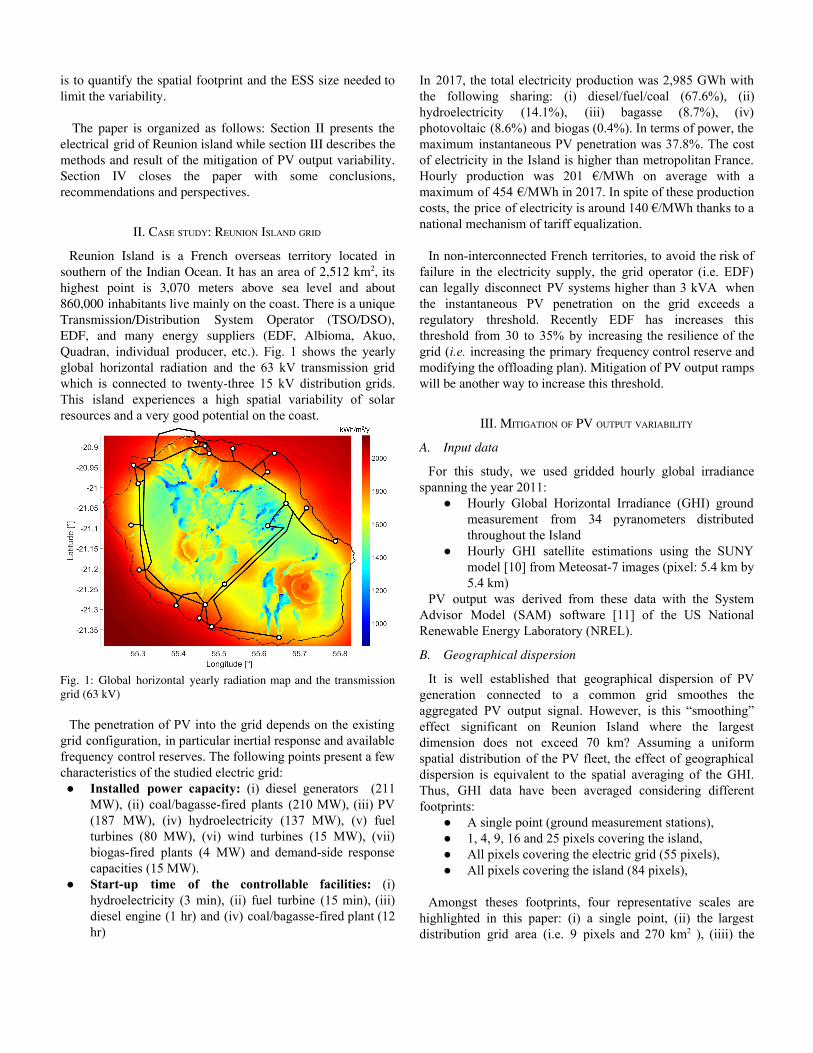
Reunion Island is a French overseas territory located in southern of the Indian Ocean. It has an area of 2,512 km2, its highest point is 3,070 meters above sea level and about 860,000 inhabitants live mainly on the coast. There is a unique Transmission/Distribution System Operator (TSO/DSO), EDF, and many energy suppliers (EDF, Albioma, Akuo, Quadran, individual producer, etc.). Fig. 1 shows the yearly global horizontal radiation and the 63 kV transmission grid which is connected to twenty-three 15 kV distribution grids. This island experiences a high spatial variability of solar resources and a very good potential on the coast.
Fig. 1: Global horizontal yearly radiation map and the transmission grid (63 kV)
The penetration of PV into the grid depends on the existing grid configuration, in particular inertial response and available frequency control reserves. The following points present a few characteristics of the studied electric grid: ● Installed power capacity: (i) diesel generators (211
MW), (ii) coal/bagasse-fired plants (210 MW), (iii) PV (187 MW), (iv) hydroelectricity (137 MW), (v) fuel turbines (80 MW), (vi) wind turbines (15 MW), (vii) biogas-fired plants (4 MW) and demand-side response capacities (15 MW).
● Start-up time of the controllable facilities: (i) hydroelectricity (3 min), (ii) fuel turbine (15 min), (iii) diesel engine (1 hr) and (iv) coal/bagasse-fired plant (12 hr)
In 2017, the total electricity production was 2,985 GWh with the following sharing: (i) diesel/fuel/coal (67.6%), (ii) hydroelectricity (14.1%), (iii) bagasse (8.7%), (iv) photovoltaic (8.6%) and biogas (0.4%). In terms of power, the maximum instantaneous PV penetration was 37.8%. The cost of electricity in the Island is higher than metropolitan France. Hourly production was 201 €/MWh on average with a maximum of 454 €/MWh in 2017. In spite of these production costs, the price of electricity is around 140 €/MWh thanks to a national mechanism of tariff equalization.
In non-interconnected French territories, to avoid the risk of failure in the electricity supply, the grid operator (i.e. EDF) can legally disconnect PV systems higher than 3 kVA when the instantaneous PV penetration on the grid exceeds a regulatory threshold. Recently EDF has increases this threshold from 30 to 35% by increasing the resilience of the grid (i.e. increasing the primary frequency control reserve and modifying the offloading plan). Mitigation of PV output ramps will be another way to increase this threshold.
III. MITIGATION OF PV OUTPUT VARIABILITY
A. Input data
For this study, we used gridded hourly global irradiance spanning the year 2011:
● Hourly Global Horizontal Irradiance (GHI) ground measurement from 34 pyranometers distributed throughout the Island
● Hourly GHI satellite estimations using the SUNY model [10] from Meteosat-7 images (pixel: 5.4 km by 5.4 km)
PV output was derived from these data with the System Advisor Model (SAM) software [11] of the US National Renewable Energy Laboratory (NREL).
B. Geographical dispersion
It is well established that geographical dispersion of PV generation connected to a common grid smoothes the aggregated PV output signal. However, is this “smoothing” effect significant on Reunion Island where the largest dimension does not exceed 70 km? Assuming a uniform spatial distribution of the PV fleet, the effect of geographical dispersion is equivalent to the spatial averaging of the GHI. Thus, GHI data have been averaged considering different footprints:
● A single point (ground measurement stations), ● 1, 4, 9, 16 and 25 pixels covering the island, ● All pixels covering the electric grid (55 pixels), ● All pixels covering the island (84 pixels),
Amongst theses footprints, four representative scales are
highlighted in this paper: (i) a single point, (ii) the largest distribution grid area (i.e. 9 pixels and 270 km2 ), (iiii) the

total grid area (about 1,650 km2) and (iv) the area of the island (2,520 km2).
Solar variability was evaluated thanks to the standard
deviation of the hourly ramps of the GHI ( ). The ramp is 2 defined as follow:
GHI where i ε Ω (1) ΔGHI i1hr = GHI i −
i−1
where is the set of diurnal hours of the year and N the Ω
number of elements of . It is also interesting to evaluate the Ω “smoothing” effect for the extreme ramps because the power size of ESS depends on these rare events. Thus, we also computed the maximum (3) and the 99th percentile (4) of the ramps .ΔGHI 1hr
(ΔGHI ) (2) σ 1hr = √ 1N ∑
iεΩΔGHI( i
1hr − ΔGHI 1hr)
ax (ΔGHI ) (3)m iεΩ
i1hr
99 (ΔGHI ) (4)P iεΩ
i1hr
Fig. 2. presents the maximum values of these three metrics
for each footprint, and also the theoretical ramps of GHI under clear sky conditions ( ). As shown by Fig. 2, ΔGHI cs,1hr geographical dispersion has no effect on ramps observed under clear sky.
Fig. 2: Mitigation effect of spatial averaging on maximum hourly GHI ramps, associated P99 and standard deviation of hourly GHI ramps, 2011, Reunion Island.
It seems that despite the small area of the island, the total PV production can benefit from geographical dispersion of PV installations. This is related to the high diversity of microclimates due to the specific relief of the island. The variability (i.e. standard deviation) and the extreme ramps decrease rapidly with the footprint. For a footprint of 270 km2 (i.e. the largest distribution grid area of the island), the measured ramps are close to those observed under clear sky conditions which are totally predictable. Unpredictable ramps are almost removed except a low percentage of extreme events which occur when large clouds passe over the island.
C. Energy Storage System (ESS)
Some ESS with short time response (~milliseconds) like flywheels or Li-ion batteries can be used to smooth PV output ramps. Trivially, more important the “smoothing” is, more important the size and the cost of batteries are. Thus, as previously, it is interesting to study the size/cost of ESS as a function of the footprint of dispersed PV fleet (still under uniform spatial distribution hypothesis). To this end, the approach used by Perez et al. [12] was implemented in this work. Briefly, they calculate the PV clearness index defined as the ratio of actual PV output to PV output under clear sky conditions. Then, simple moving average (SMA) method is applied on the PV clearness index for a given time window. The result is multiplied by the PV output under clear sky conditions to obtain the “smoothed” PV output. This loop is repeated by increasing the time windows until the largest ramp of the “smoothed” PV output is lower than a given ramp limitation. Therefore, the mitigation is applied only to the unpredictable ramps. Namely, ramps driven by weather conditions. At the end, the power that passes through the ESS (PESS) is calculated as the difference between the actual and the “smoothed” PV outputs divided by the square root of the ESS efficiency. The ESS power and energy capacity are chosen respectively as is the maximum absolute value of PESS and the maximum daily amplitude of the cumulative energy in the ESS.
A control of the ESS considering ideal perfect PV output forecast was also considered in this work. To this end, centered moving average method is applied instead of the SMA method in the algorithm described above. Indeed, anticipation of future ramps allows reducing the ESS size. Fig. 3 shows the result of both approaches (i.e. with and without forecasts) and for different footprints. The PV outputs were normalized to the installed PV capacities, the ESS efficiency was set to 90% and the hourly ramp limitation was fixed at 25% of the installed PV capacity. As ESS investment cost is almost proportional to the energy capacity, the cost is also evaluated assuming Li-ion batteries with a unit cost of 250 €/kWh.
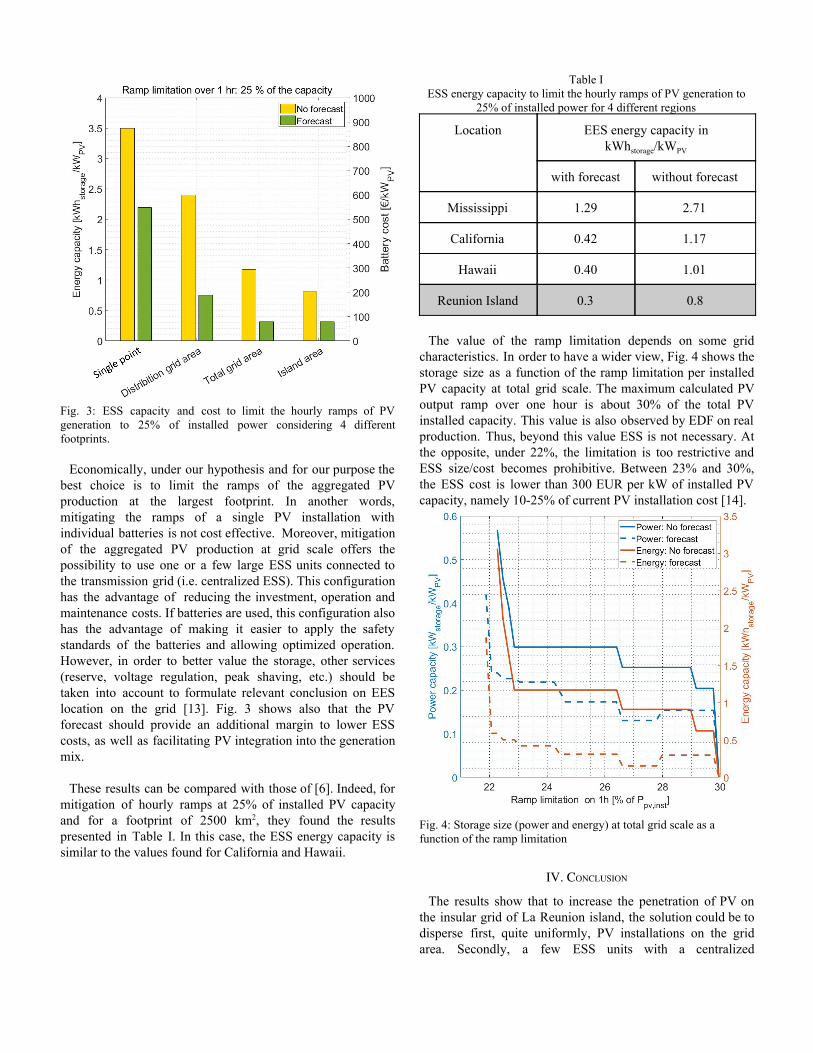
Fig. 3: ESS capacity and cost to limit the hourly ramps of PV generation to 25% of installed power considering 4 different footprints.
Economically, under our hypothesis and for our purpose the best choice is to limit the ramps of the aggregated PV production at the largest footprint. In another words, mitigating the ramps of a single PV installation with individual batteries is not cost effective. Moreover, mitigation of the aggregated PV production at grid scale offers the possibility to use one or a few large ESS units connected to the transmission grid (i.e. centralized ESS). This configuration has the advantage of reducing the investment, operation and maintenance costs. If batteries are used, this configuration also has the advantage of making it easier to apply the safety standards of the batteries and allowing optimized operation. However, in order to better value the storage, other services (reserve, voltage regulation, peak shaving, etc.) should be taken into account to formulate relevant conclusion on EES location on the grid [13]. Fig. 3 shows also that the PV forecast should provide an additional margin to lower ESS costs, as well as facilitating PV integration into the generation mix.
These results can be compared with those of [6]. Indeed, for mitigation of hourly ramps at 25% of installed PV capacity and for a footprint of 2500 km2, they found the results presented in Table I. In this case, the ESS energy capacity is similar to the values found for California and Hawaii.
Table I ESS energy capacity to limit the hourly ramps of PV generation to
25% of installed power for 4 different regions
Location EES energy capacity in kWhstorage/kWPV
with forecast without forecast
Mississippi 1.29 2.71
California 0.42 1.17
Hawaii 0.40 1.01
Reunion Island 0.3 0.8
The value of the ramp limitation depends on some grid
characteristics. In order to have a wider view, Fig. 4 shows the storage size as a function of the ramp limitation per installed PV capacity at total grid scale. The maximum calculated PV output ramp over one hour is about 30% of the total PV installed capacity. This value is also observed by EDF on real production. Thus, beyond this value ESS is not necessary. At the opposite, under 22%, the limitation is too restrictive and ESS size/cost becomes prohibitive. Between 23% and 30%, the ESS cost is lower than 300 EUR per kW of installed PV capacity, namely 10-25% of current PV installation cost [14].
Fig. 4: Storage size (power and energy) at total grid scale as a function of the ramp limitation
IV. CONCLUSION
The results show that to increase the penetration of PV on the insular grid of La Reunion island, the solution could be to disperse first, quite uniformly, PV installations on the grid area. Secondly, a few ESS units with a centralized

management by the grid operator would allow a further mitigation of the variability. That would lead to almost remove the unpredictable ramps (driven by weather). In addition, the forecast of the total PV production could both reduce ESS cost and anticipate the grid management by the operator. This last point shows that the challenge of forecasting of PV connected to the grid is not at a single plant scale, but at grid scale. Moreover, forecast at grid scale should be more reliable.
Based on this work, further improvements will be carried out. Firstly, time and space resolution of GHI data will be improved. Indeed, in March 2017 the satellite Meteosat-7 was replaced by Meteosat-8. This satellite offers a time and space resolution respectively of 15 min and 1 km. Thus, ramp mitigation over shorter time step will be studied. Secondly, regarding the geographical dispersion of PV generation, non-uniform spatial distribution will be investigated. The challenge is to optimize the distribution of PV systems in order to both minimize the variability and maximize the total production. Thirdly, regarding the smoothing of PV output with ESS, as explained in the introduction, other methods, like filter based methods, will be implemented. These improvements should reduce further unpredictable variability and the ESS cost.
ACKNOWLEDGMENTS
This work was supported by the European Regional Development Fund, the Regional Council of Reunion Island, EDF-SEI and ADEME through the PEPS project.
REFERENCES
[1] R. Passey, T. Spooner, I. MacGill, M. Watt, and K. Syngellakis, “The potential impacts of grid-connected distributed generation and how to address them: A review of technical and non-technical factors,” Energy Policy, vol. 39, no. 10, pp. 6280–6290, Oct. 2011.
[2] B. Palmintier, R. Broderick, B. Mather, M. Coddington,
K. Baker, F. Ding, M. Reno, M. Lave, and A. Bharatkumar, “On the Path to SunShot: Emerging Issues and Challenges in Integrating Solar with the Distribution System,” 2016.
[3] G. Vahan and S. Booth, “Review of PREPA technical
requirements for interconnecting wind and solar generation,” 2013.
[4] J. Marcos, L. Marroyo, E. Lorenzo, and M. García,
“Smoothing of PV power fluctuations by geographical dispersion,” Prog. Photovoltaics Res. Appl., 2012.
[5] I. Santiago, D. Trillo-Montero, E. J. Palacios-Garcia, I. M. Moreno-Garcia, and A. Moreno-Munoz, “Influence of photovoltaic installation angles and geographical dispersion in the smoothing of photovoltaic fleet power fluctuations,” in EEEIC 2016 - International Conference on Environment and Electrical Engineering, 2016.
[6] R. Perez and T. E. Hoff, “Mitigating Short-Term PV
Output Intermittency,” 28th Eur. Photovolt. Sol. Energy Conf. Exhib., 2013.
[7] M. David, F. H. R. Andriamasomanana, and O. Liandrat,
“Spatial and Temporal Variability of PV Output in an Insular Grid: Case of Reunion Island,” Energy Procedia, vol. 57, pp. 1275–1282, 2014.
[8] S. Sukumar, M. Marsadek, K. R. Agileswari, and H.
Mokhlis, “Ramp-rate control smoothing methods to control output power fluctuations from solar photovoltaic (PV) sources—A review,” Journal of Energy Storage. 2018.
[9] C. Gavriluta, I. Candela, J. Rocabert, I. Etxeberria-Otadui,
and P. Rodriguez, “Storage system requirements for grid supporting PV-power plants,” in 2014 IEEE Energy Conversion Congress and Exposition, ECCE 2014, 2014.
[10] R. Perez, J. Schlemmer, D. Renne, S. Cowlin, R. George,
and B. Bandyopadhyay, “Validation of the SUNY Model in a Meteosat Environment,” in ASES Annual Conference, Buffalo, 2009
[11] P. Gilman, “SAM Photovoltaic Model Technical
Reference Update,” Natl. Renew. Energy Lab. NREL P-6A20-64102, 2018.
[12] R. Perez, T. Hoff, J. Dise, D. Chalmers, and S. Kivalov,
“The Cost of Mitigating Short-term PV Output Variability,” Energy Procedia, vol. 57, pp. 755–762, Jan. 2014.
[13] G. M. A. Delille, “Participation of Energy Storage in the
Advanced Management of Power Systems : organizational, Technical and Economic Approaches in Distribution Grids”, [Thesis], Ecole Centrale de Lille, 2010.
[14] Fu, Ran, David Feldman, and Robert Margolis. 2018.
U.S. Solar Photovoltaic System Cost Benchmark: Q1 2018. Golden, CO: National Renewable Energy Laboratory. NREL/TP-6A20-72399.