Mitigation of Preferential Concentration due to electric charge in the dispersed phase.
27
Mitigation of Preferential Concentration due to electric charge in the dispersed phase
-
Upload
mabel-hopkins -
Category
Documents
-
view
221 -
download
4
Transcript of Mitigation of Preferential Concentration due to electric charge in the dispersed phase.

Mitigation of Preferential Concentration due to electric charge in the
dispersed phase

2
Overview
• Introduction
• Simplifying assumptions / Numerical method
• Measures of preferential accumulation
– Stokes number dependence
– Dependence on Re ?
• Charged particle simulations
• Conclusions

3
The problem in physical space
• Dispersed phase flows
– continuous phase (fluid)
– dispersed phase (particles)

4
Dispersed phase flows
• Incompressible, homogeneous, isotropic
• Stationarity obtained using artificial forcing
• One-way coupling
– Particles do not influence fluid motion
• Point particles
– Particle wakes are not resolved
– Particle diameter << kolmogorov length scale
• Particle motion is governed only by “drag”
– Gravitational force not modelled
– Particle collisions not modelled (dilute suspension)
– Particle density >> fluid density
• Particles are “stochastic” for the purpose of charged particle simulations
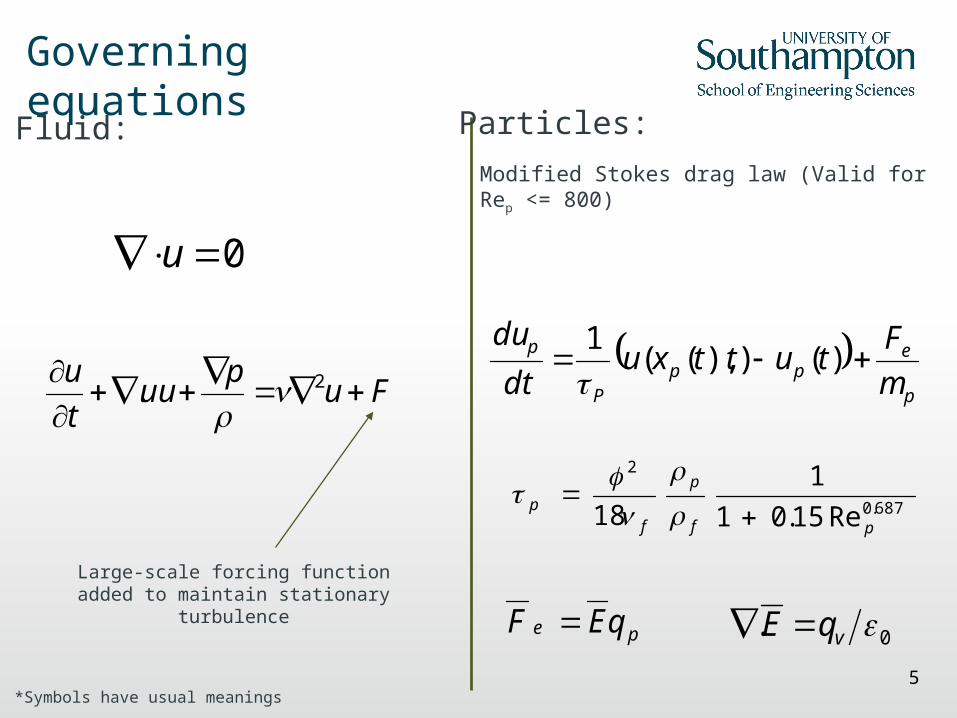
Fluid: Particles:
5
Governing equations
0 u
p
epp
P
p
m
Ftuttxu
dt
du )()),((
1
687.0
2
Re15.01
1
18 pf
p
fp
pe qEF 0. vqE
Fluid: Particles:
*Symbols have usual meanings
Fup
uut
u
2.
Large-scale forcing function added to maintain stationary
turbulence
Modified Stokes drag law (Valid for Rep <= 800)
6
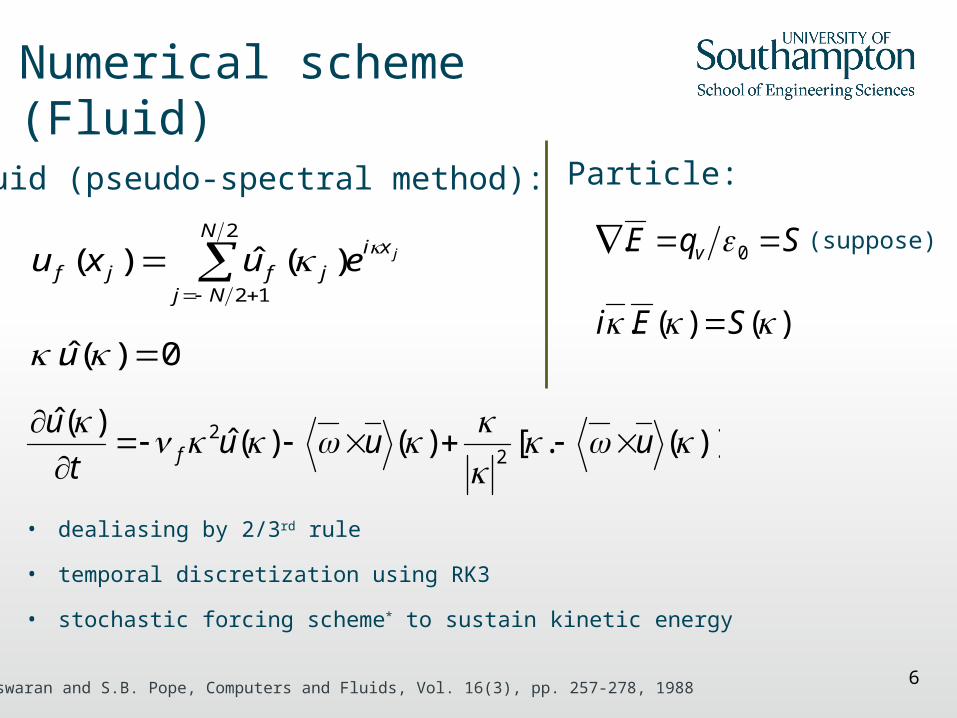
Numerical scheme (Fluid)
jxij
N
Njfjf euxu )(ˆ)(
2
12
)](.[)()(ˆ)(ˆ
22
uuut
uf
0)(ˆ. u
*V. Eswaran and S.B. Pope, Computers and Fluids, Vol. 16(3), pp. 257-278, 1988
Fluid (pseudo-spectral method):
• dealiasing by 2/3rd rule
• temporal discretization using RK3
• stochastic forcing scheme* to sustain kinetic energy
)()(. SEi
SqE v 0. (suppose)
Particle:
7
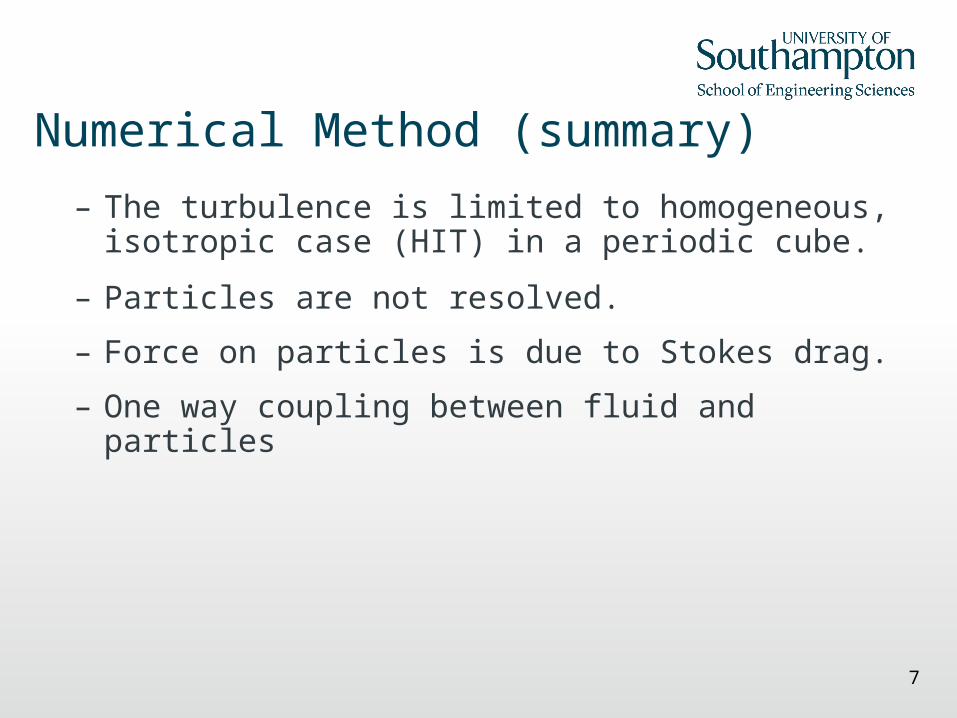
Numerical Method (summary)
– The turbulence is limited to homogeneous, isotropic case (HIT) in a periodic cube.
– Particles are not resolved.
– Force on particles is due to Stokes drag.
– One way coupling between fluid and particles

8
Simulation parameters
k
pkSt
308 pray rQ
ray
p
Q
QRa
• Mono-sized particles
• number of particles (Np): 100000
• particle stokes numbers
– Stk :0.2 - 20
• Same charge on all particles (Ra = 0.8, γ = 0.05)
• space charge densities (μC/m3): 5, 10, 25, 50, 100
Stokes Number
Rayleigh Number
where,

9
Points to note -
• All simulations for a given Re, are restarted from same fluid realisation.
• Statistics are collected only after fluid has reached stationary state.
• Particle distribution is assumed to reach stationary state when the positions are completely de-correlated from initial position.
Tu
rbu
len
t kin
eti
c en
erg
y
Part
icle
rm
s ve
loci
ty

10
Evidence of preferential concentration
Reλ = 24.24, St = 0.25
*S. Scott, Ph.D. thesis, Imperial College London, 2006
Reλ = 24.24, St = 4.00

11
Clustering at different scales• Clustering occurs broadly at 2 scales –
– Dissipative scales
• particles are centrifuged out of coherent eddies and accumulate in low-vorticity regions.
– Inertial range
• clustering is a multi-scale phenomenon.
• Eddies larger than Kolmogorov length scale play a part in clustering.

12
Measures of Accumulation• Dissipative range measures
– D ( Fessler et al., 1994 )
– Dc ( Wang and Maxey, 1993 )
– Dn
• Inertial (multi-scale) measures
– RDF ( Sundaram and Collins, 1997 )
– D2
• Fluid-particle correlation measures
– <n’e’>, correlation between number density and enstrophy
– ln, number density correlation length scale
13
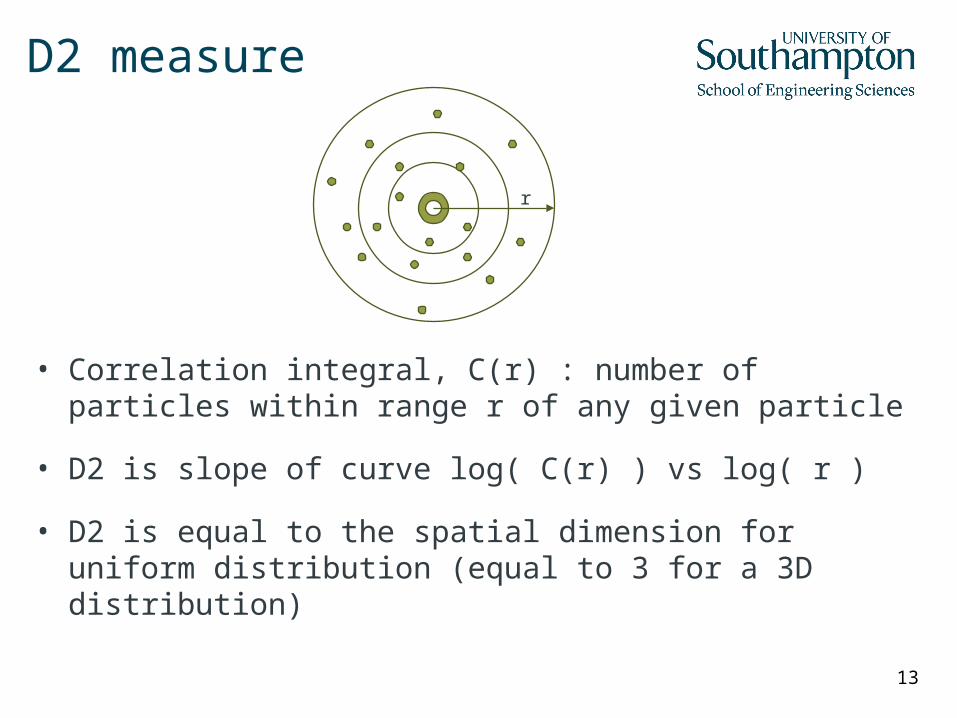
D2 measure
• Correlation integral, C(r) : number of particles within range r of any given particle
• D2 is slope of curve log( C(r) ) vs log( r )
• D2 is equal to the spatial dimension for uniform distribution (equal to 3 for a 3D distribution)
r

14D2 data for different cases compared to literature
D2 – probability to find 2 particles at a distance less than a given r: P(r) ~ rD2

15
Binning of particles
h
h – scale used for binning particles
n – number density i.e no. of particles / bin volume
<nc> – mean number density i.e total particles / volume of cube

16
D, Dc : deviation from poisson distribution• Dc*, D** : Deviation from
poisson distribution
Pc: probability of finding cells with given number of particles
k : number of particles in a cell
pN
k
uc kPkPD
0
2))()((
nc
D poisson
*L.P. Wang and M.R. Maxey, J. Fluid Mech., Vol. 256, pp. 27-68, 1993
**J.R. Fessler, J.D. Kulick and J.K. Eaton, Phys. Fluids, Vol. 6(11), pp. 3742-3749, 1994
knc
u nck
ekP
!)(

17
‘D’ measure of accumulation
• Bin size used is corresponding to peak value of ‘D’.
Re = 24

18
<n’e’> – correlation between number density and enstrophy

19
Observations
• D and Dc measures clearly depend on bin-size
– Dependence of Re is attributed to less number of ‘smaller particle structures’ at higher Re.
• D2 measure looks at probability of finding particles in shells around a given particle
– Shows nearly no dependence on Re
• <n’e’> and ‘ln’ capture distribution of particle number density
– Show dependence on Re

Destruction using Lorentz forces*
*A. Karnik and J. Shrimpton, ILASS 2008, Sept 8-10, 2008
21
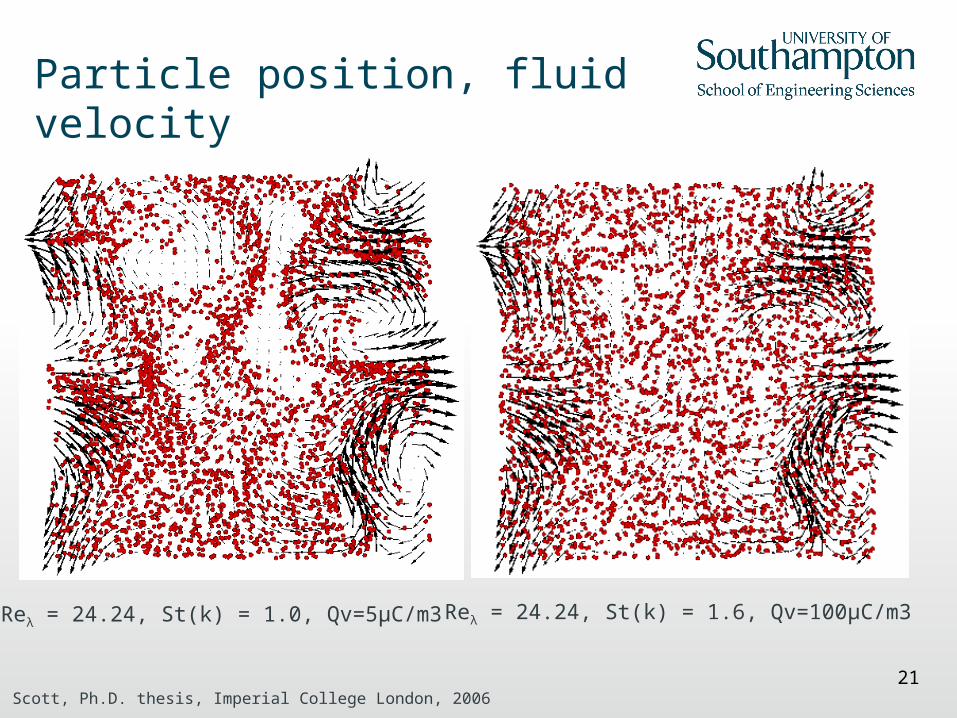
Particle position, fluid velocity
Reλ = 24.24, St(k) = 1.0, Qv=5μC/m3
*S. Scott, Ph.D. thesis, Imperial College London, 2006
Reλ = 24.24, St(k) = 1.6, Qv=100μC/m3
22
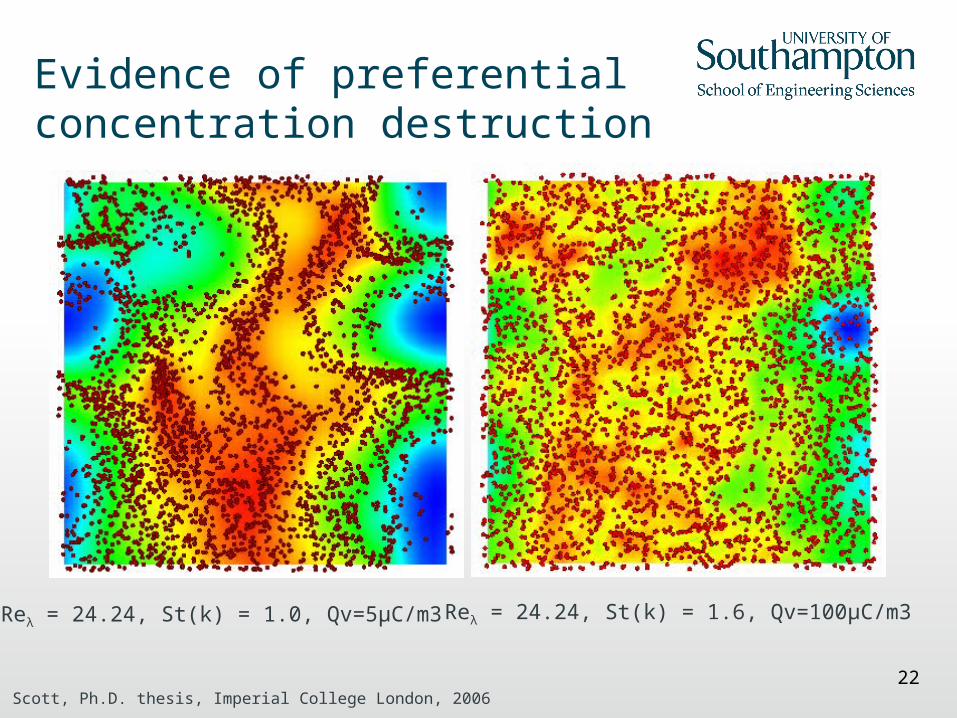
Evidence of preferential concentration destruction
Reλ = 24.24, St(k) = 1.0, Qv=5μC/m3
*S. Scott, Ph.D. thesis, Imperial College London, 2006
Reλ = 24.24, St(k) = 1.6, Qv=100μC/m3

23
Evidence of preferential concentration destruction
Reλ = 24.24, St(k) = 1.0, Qv=5μC/m3
*S. Scott, Ph.D. thesis, Imperial College London, 2006
Reλ = 24.24, St(k) = 1.6, Qv=100μC/m3

24
Parametric study of bulk charge density levels
*St = 0.25 for all plots
• Space charge density of 25-50 µC/m3 is sufficient to destroy preferential accumulation
• With increasing Reynolds number, greater charge density is required to significantly destroy accumulation

25
Effect of Stokes Numbers
Reλ = 24.2 Reλ = 81.1
• Charged particle systems continue to exhibit same trends with Reynolds and Stokes numbers as the charge-free case.

26
Schematic of a spray released from a charged injection atomizer
20
22
0
0
tan4tan41
d
z
d
z
QQz
tan20 zd
rz
• The charge level found in this study (50 μC/m3) corresponds to an area about 2 cm from the nozzle tip
• d0= 500 μm, Q0= 0.5 C/m3, θ = 45o

27
Conclusions
• Preferential accumulation is maximum at St ~ 1.0 based on kolmogorov scale, for all the measures used in this study.
• While ‘ln’ shows clear dependence on Re, D2 is insensitive to Re.
• Bulk charge density level of 50 μC/m3 is sufficient to significantly destroy preferential accumulation. This has been consistently observed using different sensors for preferential accumulation.
– The required charge density level mentioned above is attainable within 2 cms from tip of a nozzle in practical charge injection atomizers.