Mitigating Tropospheric Propagation Delay Errors in...
8
1 Mitigating Tropospheric Propagation Delay Errors in Precise Airborne GPS Navigation ‡ J.P. Collins and R.B. Langley Geodetic Research Laboratory, Department of Geodesy and Geomatics Engineering University of New Brunswick, P.O. Box 4400, Fredericton, N.B. E3B 5A3 Canada ‡ Presented at the IEEE Position, Location and Navigation Symposium, Atlanta, Georgia, USA, 22nd - 26th April, 1996 ABSTRACT The high spatial and temporal variability of the troposphere is well known, as is its effect - through propagation delays - on GPS positioning. This effect can be particularly problematical in airborne kinematic differential positioning where the altitude difference between reference station and aircraft is typically quite large. The use of zenith delay models and mapping functions at ground stations is fairly well understood, however their use for processing data collected on board aircraft is less well understood. Previous tests have indicated that some of the models often used for navigation purposes (e.g. Altshuler, NATO and the proposed WAAS model) perform poorly compared to those generally used for static positioning. These tests were not done under kinematic conditions however, but as comparisons with ray tracing through radiosonde data. This paper outlines the work recently done at UNB on testing the reliability of tropospheric models in precise airborne GPS navigation. Particular attention has been paid to the performance of the currently proposed WAAS model. The data used to test the models is from an adverse weather flight dynamics experiment undertaken off Newfoundland, Canada, in March 1995. The paper includes an analysis of the GPS flight data to determine the influence of different tropospheric models on the reliability and accuracy of the solutions. INTRODUCTION With the increasing use of the Global Positioning System (GPS) as a primary navigation aid for aircraft of all types, it is important to understand all the potential error sources of the system. These sources are generally well understood after many years of geodetic GPS positioning, however special considerations may exist for airborne positioning. One of the most significant problems is the effect of the neutral-atmosphere on the electromagnetic signal propagated by a GPS satellite. The effect is to both retard the velocity of the signal and to refract (bend) its raypath. The resulting delay is generally referred to as the tropospheric delay because most of the signal delay occurs in the lowest 10 km or so of the atmosphere. The effects on geodetic-type static positioning are generally well known, however this is the special case of a signal arriving at an antenna located on the earth's surface. The more general effect on a GPS receiver at arbitrary height above the earth’s surface must be considered for airborne positioning. The particular problems in airborne GPS positioning are: 1) the change of the tropospheric delay with a change in height, and 2) the usual lack of direct meteorological measurements to help quantify the state of the atmosphere. The mitigation of the tropospheric effects will increase the prospect of more accurate and precise airborne GPS positioning. The effects can be two-fold, that is a direct impact on the position calculated from the GPS range measurements and then indirect effects, for example through the incorrect solving of carrier phase ambiguities which then degrades position accuracy. Another possible indirect effect is the contamination of corrections calculated for differential GPS (DGPS) positioning by a reference station. A primary DGPS-type service that is currently planned for the continental United States and Canada is the Federal Aviation Administration's (FAA) Wide Area Augmentation System (WAAS). Consisting, in its initial phase, of 24 ground reference stations, 2 master stations, 6 ground earth stations and 3 geostationary Inmarsat satellites to broadcast both DGPS corrections and additional GPS-like signals, it represents a considerable investment in the large-scale use of GPS for aircraft positioning [11]. The primary aim of this paper is to examine the potential impact on an aircraft's position caused by using different tropospheric delay models. The models tested are the Altshuler [1], NATO [15] and the currently proposed
-
Upload
phungkhuong -
Category
Documents
-
view
219 -
download
1
Transcript of Mitigating Tropospheric Propagation Delay Errors in...

1
Mitigating Tropospheric Propagation Delay Errors in Precise Airborne GPS Navigation‡
J.P. Collins and R.B. LangleyGeodetic Research Laboratory, Department of Geodesy and Geomatics EngineeringUniversity of New Brunswick, P.O. Box 4400, Fredericton, N.B. E3B 5A3 Canada
‡ Presented at the IEEE Position, Location and Navigation Symposium, Atlanta, Georgia, USA, 22nd - 26th April, 1996
ABSTRACT
The high spatial and temporal variability of thetroposphere is well known, as is its effect − throughpropagation delays − on GPS positioning. This effect canbe particularly problematical in airborne kinematicdifferential positioning where the altitude differencebetween reference station and aircraft is typically quitelarge. The use of zenith delay models and mappingfunctions at ground stations is fairly well understood,however their use for processing data collected on boardaircraft is less well understood.
Previous tests have indicated that some of the modelsoften used for navigation purposes (e.g. Altshuler, NATOand the proposed WAAS model) perform poorly comparedto those generally used for static positioning. These testswere not done under kinematic conditions however, but ascomparisons with ray tracing through radiosonde data.
This paper outlines the work recently done at UNB ontesting the reliability of tropospheric models in preciseairborne GPS navigation. Particular attention has beenpaid to the performance of the currently proposed WAASmodel. The data used to test the models is from an adverseweather flight dynamics experiment undertaken offNewfoundland, Canada, in March 1995. The paperincludes an analysis of the GPS flight data to determine theinfluence of different tropospheric models on the reliabilityand accuracy of the solutions.
INTRODUCTION
With the increasing use of the Global Positioning System(GPS) as a primary navigation aid for aircraft of all types,it is important to understand all the potential error sourcesof the system. These sources are generally well understoodafter many years of geodetic GPS positioning, howeverspecial considerations may exist for airborne positioning.
One of the most significant problems is the effect of theneutral-atmosphere on the electromagnetic signal
propagated by a GPS satellite. The effect is to both retardthe velocity of the signal and to refract (bend) its raypath.The resulting delay is generally referred to as thetropospheric delay because most of the signal delay occursin the lowest 10 km or so of the atmosphere. The effectson geodetic-type static positioning are generally wellknown, however this is the special case of a signal arrivingat an antenna located on the earth's surface. The moregeneral effect on a GPS receiver at arbitrary height abovethe earth’s surface must be considered for airbornepositioning.
The particular problems in airborne GPS positioning are:1) the change of the tropospheric delay with a change inheight, and 2) the usual lack of direct meteorologicalmeasurements to help quantify the state of the atmosphere.The mitigation of the tropospheric effects will increase theprospect of more accurate and precise airborne GPSpositioning. The effects can be two-fold, that is a directimpact on the position calculated from the GPS rangemeasurements and then indirect effects, for examplethrough the incorrect solving of carrier phase ambiguitieswhich then degrades position accuracy. Another possibleindirect effect is the contamination of correctionscalculated for differential GPS (DGPS) positioning by areference station.
A primary DGPS-type service that is currently plannedfor the continental United States and Canada is the FederalAviation Administration's (FAA) Wide AreaAugmentation System (WAAS). Consisting, in its initialphase, of 24 ground reference stations, 2 master stations, 6ground earth stations and 3 geostationary Inmarsatsatellites to broadcast both DGPS corrections andadditional GPS-like signals, it represents a considerableinvestment in the large-scale use of GPS for aircraftpositioning [11].
The primary aim of this paper is to examine the potentialimpact on an aircraft's position caused by using differenttropospheric delay models. The models tested are theAltshuler [1], NATO [15] and the currently proposed

2
WAAS model (which is derived from Altshuler's [4]).This ongoing research is made possible through thegenerous support of Transport Canada Aviation.
TROPOSPHERIC DELAY
An electromagnetic signal propagating through theatmosphere will be affected because the refractive index ofthe constituent gases is slightly greater than unity. Thedecrease in velocity increases the time taken for the signalto reach a receiver’s antenna, thereby increasing theequivalent path length (both often referred to as the"delay"). At low elevation angles refraction bends theraypath, further increasing the delay.
Assuming that the lower atmosphere is azimuthallysymmetric, the effect can be considered in two parts: thedelay experienced in the zenith direction and themagnification of the zenith delay that is experienced atother elevation angles. This leads to the commonformulation of zenith delays and mapping functions seenin the geodetic GPS literature.
The tropospheric delay can be defined at the zenith as[9]:
d n r dr N drtropz
r
r
r
r
s
a
s
a
= − = − ∫∫ [ ( ) ] ,1 10 6 (1)
where n is the refractive index, N is the refractivity, rs isthe height of the user’s antenna and ra is the height of the“top” of the neutral-atmosphere. The refractivity can bewritten in two parts, that due to the dry atmospheric gasesand that due to water vapour pressure [22]:
N kP
TZ k
e
Tk
e
TZd
d w=
+ +
− −1
12 3 2
1, (2)
where Pd is the partial pressure of dry air (mbar), T is theabsolute temperature (K), e is the partial pressure of watervapour (mbar) and Zd and Zw are compressibility factors toaccount for non-ideal gas behaviour [18]. Constants k1, k2
and k3 are empirically derived. The first term in equation(2) is the so-called “dry” component of refractivity. Usingthe equation of state, equation (2) can be recast as afunction of the total atmospheric density, ρ, namely:
N kR
Mk
e
Tk
e
TZ
dw= + ′ +
−1 2 3 2
1ρ , (3)
where, k'2 = (k2 - k1 [ Mw / Md ] ), Mw and Md are the molarmasses of water and dry air respectively and R is the molargas constant. The first term in equation (3) represents thehydrostatic component of refractivity. Combining
equations (1) and (3) and ignoring the compressibilityfactors (which differ from unity by a few parts perthousand at most), we get [7]:
d d dtropz
hydz
wetz= +
=
+ ′ +
− ∫10 6 12 3 2
k R
g MP k
e
Tk
e
Tdr
m d r
r
s
a
, (4)
whereby the assumption of hydrostatic equilibrium in theatmosphere has allowed the integration of the hydrostaticcomponent. Gravity acceleration at the atmosphericcolumn centroid is given by gm, a function of latitude andheight of the antenna. The hydrostatic zenith delayaccounts for about 90% of the total zenith delay and can bemodelled with submillimetre accuracy provided accuratepressure measurements (P) are available [5].
What remains in equation (4) is usually termed thezenith wet delay and can also be integrated after specifyingsuitable relationships for temperature and water vapourpressure with height. The problem lies in the fact thatwater vapour is rarely in hydrostatic equilibrium and variessignificantly throughout the troposphere. Hence theaccuracy of the zenith wet delay as computed by modelsusing surface meteorological measurements is typically nobetter than several centimetres [8, 13].
It then remains to specify functions to map these zenithdelays to the elevation angle of the raypath of the arrivingsignal. Following [5], the typical formulation is:
d d m d mtrop hydz
hyd wetz
wet= ⋅ + ⋅( ) ( )ε ε , (5)
where the total delay dtrop is a function of the hydrostaticzenith delay dz
hyd and its mapping function mhyd(ε) and thewet zenith delay dz
wet and its mapping function mwet(ε).The elevation angle to the satellite (ε) is the minimumparameter required, although it is possible to parameterisethe mapping functions (as well as the zenith delays) withmeteorological and location parameters. Mappingfunctions derived from ray-tracing inherently take intoaccount the effect of ray bending.
TROPOSPHERIC DELAY MODELS
Some of the first tropospheric delay models developed forspace-based positioning techniques did not explicitlyseparate the zenith delays and mapping functions. TheAltshuler model is an example of this type. Several ofthese models were also constructed to use position and timeinformation only, with no input of meteorologicalparameters, because of their intended use in airborne

3
positioning. Hence both the Altshuler model and theproposed WAAS model derive the tropospheric delay usingthe station height above sea level, latitude, and the day ofyear information as inputs. The NATO model requires theinput of the user’s height.
The NATO model uses an average reference value forsurface refractivity which is input into a three-stageequation to give the total tropospheric zenith delay in threelayers: 0 to 1 km, between 1 and 9 km and from 9 km andabove. Although not stated in the reference for this model[15], this zenith delay model is based on the Central RadioPropagation Laboratory (CRPL) Reference Atmosphere-1958 (RA-1958) [2]. This model represents atmosphericrefractivity as decreasing linearly in the first kilometreabove the earth’s surface, then exponentially to a constantvalue of 105 N units at 9 kilometres and exponentiallyfrom there on up.
In the NATO formulation, the total zenith delay ismapped using the Chao [3] dry delay mapping function.The elevation angle dependence in the Altshuler model ismodelled using a seven coefficient polynomial, while theproposed WAAS model appears to use only the cosecant ofthe elevation angle as its mapping function.
The Altshuler model was originally derived from raytracing through CRPL profiles, including RA-1958, usingseasonal world-wide surface refractivity data [1]. With theproposed WAAS model being derived from the Altshulermodel, all three of the models we have chosen to test havea similar genesis. It would appear that all three models arealso specified with the same mean global surfacerefractivity value of 324.8 N units.
For a standard to which these models can be compared,we have chosen the zenith delay models of Saastamoinen[19], which are generally considered the best available(e.g. see [8] and [13]). The corresponding mappingfunctions we have chosen are those derived by Niell [17]which have been shown to be accurate at very lowelevation angles (see [12] for more details). The functionsrequire position and time information only, however theyhave been shown to perform equally well, and often betterthan, some mapping functions fully parameterised to workwith meteorological values.
The Saastamoinen/Niell model can be driven either withactual measured values of the meteorological parameters orpressure, temperature and water vapour pressure valuesthat are equivalent to the surface refractivity of 324.8 Nunits used by those models. Using the refractivityconstants quoted in Saastamoinen (those of Essen andFroome [6]) and setting pressure and temperature to theStandard Atmosphere [16] values of 1013.25 mbar and288.15 K, we derive a water vapour pressure of 11.691
mbar. These values are then mapped to the antenna heightby the relationships used to formulate the Saastamoinendelays, namely:
T T H= − ⋅0
β , (6a)
P PT
T
g
R=
0
0
β, (6b)
e eT
T
g
R=
0
0
4
β, (6c)
where the subscript “0” denotes the mean sea level valuesquoted above, β is the standard atmosphere lapse rate of0.0065 K/m and H is the antenna height above mean sealevel. For the purposes of this paper, we will designate thisas the UNB1 model. The first two of these relationships(eq. 6a and 6b) are also specified in the StandardAtmosphere. Strictly speaking these equations are onlyvalid in the troposphere itself. From the tropopauseupwards equation (6b) must be used alternately withanother pressure equation from the Standard Atmosphere,along with various lapse rate values, to model pressure tothe top of the neutral atmosphere. The third relationship isalso commonly used in meteorology (see e.g. [21] and [7]).
FLIGHT DATA DESCRIPTION AND PROCESSING
We are continuing to use the flight data describedpreviously [14] which was collected by the NationalResearch Council of Canada, at and around St. John's,Newfoundland, in March 1995. The GPS data we haveprocessed consists of 12 days of dual-frequencymeasurements recorded by Ashtech Z-12 receivers locatedonboard a highly-instrumented Convair-580 aircraft and ata ground reference station in St. John’s. The data fromeach day generally consists of that obtained during onethree-to-five hour flight and recorded at a two secondsampling interval. Meteorological data was recorded atboth the ground station and the aircraft. The groundmeteorological data is available at one minute intervalsand the airborne data every second.
The flight paths consisted of repeated horizontal andvertical profiles through cloud layers up to heights ofapproximately 8 km to investigate the effects of freezingprecipitation on aircraft dynamics. Frontal zones andtemperature inversions are often associated with potentialcauses of freezing precipitation and along with thegeographic location and unpredictable weather conditionsit is expected that the data will provide a good test of thetropospheric delay models.
4
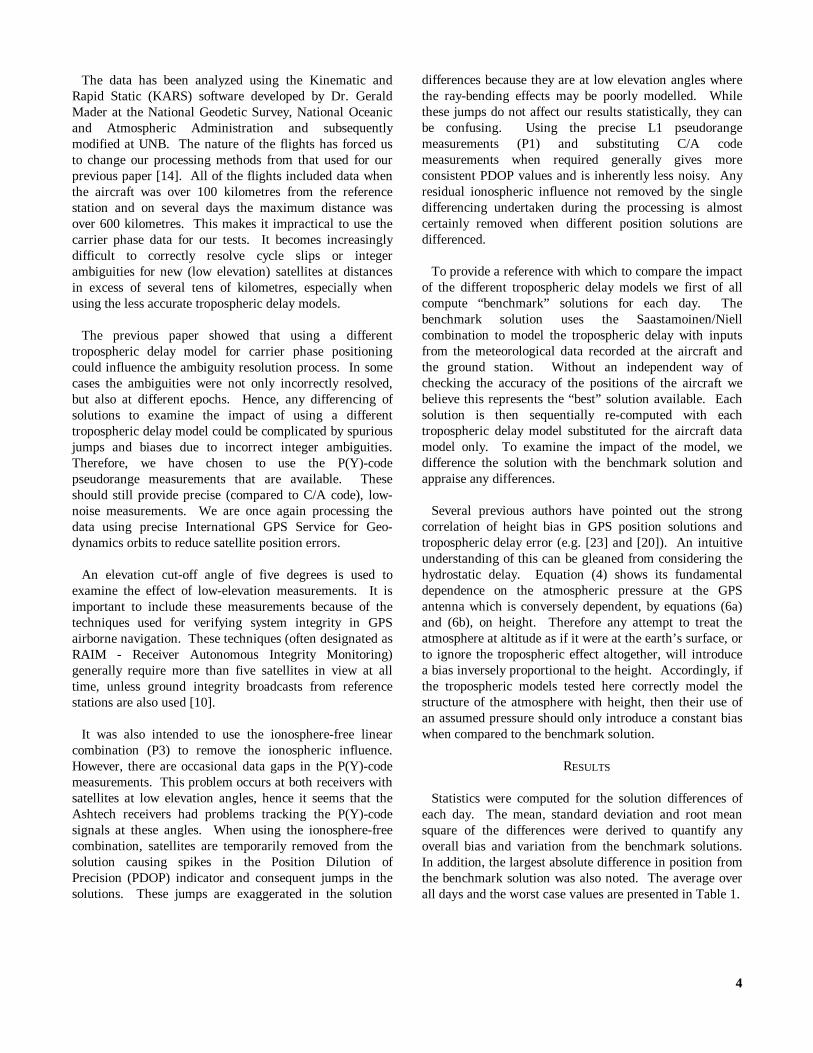
The data has been analyzed using the Kinematic andRapid Static (KARS) software developed by Dr. GeraldMader at the National Geodetic Survey, National Oceanicand Atmospheric Administration and subsequentlymodified at UNB. The nature of the flights has forced usto change our processing methods from that used for ourprevious paper [14]. All of the flights included data whenthe aircraft was over 100 kilometres from the referencestation and on several days the maximum distance wasover 600 kilometres. This makes it impractical to use thecarrier phase data for our tests. It becomes increasinglydifficult to correctly resolve cycle slips or integerambiguities for new (low elevation) satellites at distancesin excess of several tens of kilometres, especially whenusing the less accurate tropospheric delay models.
The previous paper showed that using a differenttropospheric delay model for carrier phase positioningcould influence the ambiguity resolution process. In somecases the ambiguities were not only incorrectly resolved,but also at different epochs. Hence, any differencing ofsolutions to examine the impact of using a differenttropospheric delay model could be complicated by spuriousjumps and biases due to incorrect integer ambiguities.Therefore, we have chosen to use the P(Y)-codepseudorange measurements that are available. Theseshould still provide precise (compared to C/A code), low-noise measurements. We are once again processing thedata using precise International GPS Service for Geo-dynamics orbits to reduce satellite position errors.
An elevation cut-off angle of five degrees is used toexamine the effect of low-elevation measurements. It isimportant to include these measurements because of thetechniques used for verifying system integrity in GPSairborne navigation. These techniques (often designated asRAIM - Receiver Autonomous Integrity Monitoring)generally require more than five satellites in view at alltime, unless ground integrity broadcasts from referencestations are also used [10].
It was also intended to use the ionosphere-free linearcombination (P3) to remove the ionospheric influence.However, there are occasional data gaps in the P(Y)-codemeasurements. This problem occurs at both receivers withsatellites at low elevation angles, hence it seems that theAshtech receivers had problems tracking the P(Y)-codesignals at these angles. When using the ionosphere-freecombination, satellites are temporarily removed from thesolution causing spikes in the Position Dilution ofPrecision (PDOP) indicator and consequent jumps in thesolutions. These jumps are exaggerated in the solution
differences because they are at low elevation angles wherethe ray-bending effects may be poorly modelled. Whilethese jumps do not affect our results statistically, they canbe confusing. Using the precise L1 pseudorangemeasurements (P1) and substituting C/A codemeasurements when required generally gives moreconsistent PDOP values and is inherently less noisy. Anyresidual ionospheric influence not removed by the singledifferencing undertaken during the processing is almostcertainly removed when different position solutions aredifferenced.
To provide a reference with which to compare the impactof the different tropospheric delay models we first of allcompute “benchmark” solutions for each day. Thebenchmark solution uses the Saastamoinen/Niellcombination to model the tropospheric delay with inputsfrom the meteorological data recorded at the aircraft andthe ground station. Without an independent way ofchecking the accuracy of the positions of the aircraft webelieve this represents the “best” solution available. Eachsolution is then sequentially re-computed with eachtropospheric delay model substituted for the aircraft datamodel only. To examine the impact of the model, wedifference the solution with the benchmark solution andappraise any differences.
Several previous authors have pointed out the strongcorrelation of height bias in GPS position solutions andtropospheric delay error (e.g. [23] and [20]). An intuitiveunderstanding of this can be gleaned from considering thehydrostatic delay. Equation (4) shows its fundamentaldependence on the atmospheric pressure at the GPSantenna which is conversely dependent, by equations (6a)and (6b), on height. Therefore any attempt to treat theatmosphere at altitude as if it were at the earth’s surface, orto ignore the tropospheric effect altogether, will introducea bias inversely proportional to the height. Accordingly, ifthe tropospheric models tested here correctly model thestructure of the atmosphere with height, then their use ofan assumed pressure should only introduce a constant biaswhen compared to the benchmark solution.
RESULTS
Statistics were computed for the solution differences ofeach day. The mean, standard deviation and root meansquare of the differences were derived to quantify anyoverall bias and variation from the benchmark solutions.In addition, the largest absolute difference in position fromthe benchmark solution was also noted. The average overall days and the worst case values are presented in Table 1.

5
Table 1. Average and worst case values of maximum difference, mean, standard deviation and root-mean-squarestatistics for all solutions. Number in parentheses indicates solution day; omission of number indicates statistic isrepresentative of several days.
LatitudeDifference (m)
LongitudeDifference (m)
HeightDifference (m)
max mean sd rms max mean sd rms max mean sd rms
Alts average 0.33 0.01 0.07 0.07 0.18 -0.01 0.04 0.04 0.99 0.10 0.23 0.26worst 0.62(7) 0.04 0.11 0.11 0.28(7) 0.02 0.05 0.06 1.32(10) 0.24(3) 0.32(10) 0.38(10)
WAAS average 0.35 0.00 0.06 0.06 0.23 0.01 0.04 0.04 0.78 -0.26 0.22 0.35worst 0.58(7) 0.03 0.09 0.09 0.35(7) 0.03 0.05 0.05 0.98(10) 0.47(8) 0.29(10) 0.52(8)
NATO average 0.20 0.01 0.05 0.05 0.11 -0.01 0.03 0.03 0.77 0.24 0.14 0.28worst 0.37(7) 0.03 0.07 0.08 0.15(7) 0.01 0.04 0.04 1.09(10) 0.35(10) 0.22(10) 0.42(10)
UNB1 average 0.10 0.00 0.02 0.03 0.06 0.00 0.02 0.02 0.45 0.08 0.10 0.15worst 0.15(7) 0.02 0.04 0.04 0.10(10) 0.01 0.02 0.03 0.71(10) 0.20(10) 0.16(10) 0.26(10)
As we might expect, we found low biases in the latitudeand longitude components of position for all the models.However the UNB1 solutions show a consistently smallervariation over the other three. The variations, asrepresented by the standard deviation and r.m.s. werelarger for the Altshuler and proposed WAAS model. Thegeneral trends are clearly represented by Table 1. Thelargest latitude and longitude variations almost all occuron 7th March. This is due to data gaps at very lowelevation angles, where the use of the C/A codepseudoranges still results in large PDOP spikes.
The largest effects are seen in the height differences.The NATO and WAAS solutions have an average mean ofsimilar magnitude, but opposite sign. Altshuler and UNB1have similar average means. However, the variations fromthe benchmark solution, as represented by the standarddeviation and r.m.s., are much smaller for UNB1indicating that on average, this model causes the smallestvariations from the benchmark solution.
To get a better understanding of the performance of eachmodel, we need to study an individual solution. Because itrepresents the worst case for the height component we willuse the data from 10th March. Figure 1 shows thevariations with latitude, longitude and height for eachmodel’s solution with reference to the benchmark solution.The latitude and longitude plots use the same scale. Theheight difference is represented on a larger scale(approximately 5 times larger) to indicate the greatervariation seen in the height component.
These figures show the generally poor performance of theAltshuler and proposed WAAS models with height as
compared to the UNB1 and NATO models. The mostimportant point to be made is that there is a “step” visiblein the WAAS solution differences at 1500 metres. Thisappears in all the solutions computed with this model andis due to a discontinuity in the formulation of thealgorithm.
In general the NATO and UNB1 models perform moreconsistently at all altitudes, although a diverging trend isvisible at very low altitudes (below approximately 1 km).The Altshuler model performance is generally poor at alltimes. In the worst case, it is possible to have an error of1.32 m in height by using the Altshuler model. The worstcase for the proposed WAAS and NATO models isapproximately one metre.
The NATO model has a slight bias at all altitudes. Itperforms slightly worse at very low altitudes. Removingthe bias would not necessarily improve its performancecompared to the UNB1 model, because its variation isslightly greater. Close examination of the algorithmsreveals slight discontinuities between the functionscomprising the model, however they do not appear to showup in the solution differences.
The UNB1 model solution more closely approaches thebenchmark solution with increasing height. The NATOmodel performs similarly. This indicates that the StandardAtmosphere more closely approximates the actualatmosphere with increasing height, which is what wewould expect. Any tropospheric delay model shouldtherefore perform better with increasing altitude; the factthat Altshuler and WAAS do not appear to do so is a causefor concern.

6
WA
AS
Lon
gitu
de
Diff
eren
ce
UN
B1
Long
itude
Diff
eren
ce
WA
AS
Lat
itude
Diff
eren
ce
-0.2 0.0 0.2
UN
B1
Latit
ude
Diff
ere
nce
-0.2 0.0 0.2
WA
AS
He
ight
Diff
eren
ce
-1.0 -0.5 0.0 0.5 1.0
UN
B1
Hei
ght
Diff
ere
nce
-1.0 -0.5 0.0 0.5 1.0Figure 1. Solution differences for 10th March plotted against height of aircraft. All x-axis units are metres.
Alts
hul
er H
eig
ht D
iffer
ence
-1.0 -0.5 0.0 0.5 1.0
Hei
ght
(m)
0
1000
2000
3000
4000
5000
6000
NA
TO
Hei
gh
t D
iffer
enc
e
-1.0 -0.5 0.0 0.5 1.0
Alts
hul
er L
ong
itud
e D
iffer
enc
e
Hei
ght
(m)
0
1000
2000
3000
4000
5000
6000
NA
TO
Lo
ngitu
de D
iffe
ren
ce
Alts
hul
er L
atitu
de
Diff
eren
ce
-0.2 0.0 0.2
Hei
ght
(m)
0
1000
2000
3000
4000
5000
6000
NA
TO
Lat
itud
e D
iffer
ence
-0.2 0.0 0.2
"step"

7
Time (minutes)Figure 2. Solution differences for 10th March.
0 10 20 30 40 50 60 70 80 90 100 110 120 130 140 150 160 170
Hei
ght
Diff
ere
nce
(m
)
-1.0-0.50.00.51.0 H
eight (m
)
0100020003000400050006000
Lon
gitu
de
Diff
ere
nce
(m
)
-0.3-0.2-0.10.00.10.20.3
PD
OP
234567Altshuler WAAS NATO UNB1
Latit
ude
Diff
ere
nce
(m
)
-0.3-0.2-0.10.00.10.20.3 B
aseline (km
)100
200
300
400
500
Baseline Length
PDOP
Aircraft Height
All of the solutions suffer to some extent from large stepsand jumps. By considering Figure 2, where the solutiondifferences are plotted against time, we can see that theseare correlated with changes in the solution PDOP value.This indicates the influence of rising and setting satelliteson the modelling of the tropospheric delay. These plotsshow that at low elevation angles, the position errorsincrease until the satellite sets below the elevation anglecut-off (e.g. at approximately 118 minutes in Figure 2)whereupon the solution improves. When a new satelliterises (e.g. at approximately 12 minutes in Figure 2) anerror is introduced into the solution and it jumps awayfrom the benchmark solution. As the satellite continues torise the error decreases and the solution improves. Thejumps between 100 and 120 minutes are complicated bythe fact that satellites are both rising and setting at thesame time and also suffer from data gaps. It should benoted that the largest latitude difference in the WAASsolution is due to a PDOP spike, however there aredifferences of a similar magnitude that are not. Despitethe problems of these jumps they are present in all thesolutions and yet are much less severe in the UNB1solutions. Therefore, given the good performance of theNiell functions, these large trends are almost certainly dueto mapping function errors in the other tested models.
CONCLUSIONS
A comprehensive investigation has been undertaken intothe influence of several tropospheric delay models of thetypes commonly used in airborne GPS navigation. Acomparison has been performed with a geodetic-type model
combination using Standard Atmosphere values ofpressure, temperature and water vapour pressure andstandard algorithms describing their variation with height.
Based on our investigation, it would appear that thecurrently proposed WAAS model performs somewhatpoorly compared to the Altshuler model. This is to beexpected, as it is an approximation to it. Solutionscomputed using the proposed WAAS model with theaircraft data have a step at a height of 1500 metres. This isdue to an over simplification in the formulation of thealgorithm. Otherwise, above 1500 metres it models therate of change of the delay in the atmosphere quite well.
The UNB1 model performs best overall. It consistentlyshows the smallest bias and variation in the solutionscomputed using it. Of all the models examined here, it hasthe most elegant formulation of the algorithms. The delayalgorithms are continuous with height and are notmodelled in layers such as the proposed WAAS or NATOmodels. The Altshuler model is described by severalcomplex polynomials and does not accurately model thechange of the atmosphere with height.
An important error source in the tested models is in themapping functions. These are significant in Altshuler andthe proposed WAAS models; the NATO model performsslightly better because of its use of the Chao mappingfunction. Because the same mapping functions are used inboth the UNB1 and the benchmark solutions, the errorsseen in these differences are the errors in the zenith delaysmapped to the lower elevation angles.

8
The high variation in values of the meteorologicalparameters close to the earth’s surface are likely to be thelimiting factors in mitigating the tropospheric delay errorsin precise airborne GPS navigation. However, the use ofstandard geodetic-type zenith delay models and mappingfunctions, coupled with suitable surface-meteorologicalvalues should, based on our investigation, perform betterthan the other tropospheric delay models discussed here.
REFERENCES
[1] Altshuler, E.E. and P.M. Kalaghan (1974).“Tropospheric range error corrections for theNAVSTAR system.” Interim scientific report, AirForce Cambridge Research Laboratories, Bedford,Mass., 16 April, AFCRL-TR-74-0198, 13 pp.
[2] Bean, B.R. and G.D. Thayer (1959). “Models of theatmospheric radio refractive index.” Proceedings ofthe IRE, Vol. 47, No. 5, May, pp. 740-755.
[3] Chao, C.C. (1972). “A model for troposphericcalibration from daily surface and radiosonde balloonmeasurements.” JPL Technical Memorandum 391-350, Jet Propulsion Laboratory, Pasadena, CA.
[4] DeCleene, B. (1995). Personal communication, FederalAviation Administration, May 1995.
[5] Davis, J.L., T.A. Herring, I.I. Shapiro, A.E.E. Rogersand G. Elgered (1985). “Geodesy by radiointerferometry: Effects of atmospheric modellingerrors on estimates of baseline length.” Radio Science,Vol. 20, No. 6, pp. 1593-1607.
[6] Essen, L. and K.D. Froome (1951). “The refractiveindices and dielectric constants of air and its principalconstituents at 24,000 Mc/s.” Proceedings of theRoyal Society B, Vol. 64, pp. 862-875.
[7] Ifadis, I.M. (1993). “Space to earth techniques: Someconsiderations on the zenith wet path delayparameters.” Survey Review, Vol. 32, No. 249, pp.130-144.
[8] Janes, H.W., R.B. Langley and S.P. Newby (1991).“Analysis of tropospheric delay predicition models:Comparisons with ray-tracing and implications forGPS relative positioning.” Bulletin Géodésique, Vol.65, pp. 151-161.
[9] Langley, R.B. (1996). “Propagation of the GPSSignals.” in GPS for Geodesy, International School,Delft, The Netherlands, 26 March - 1 April, 1995.Springer-Verlag, New York.
[10] Loh, R. (1993). “FAA Wide Area Integrity andDifferential GPS Program.” Proceedings of 2ndInternation Symposium on Differential SatelliteNavigation Systems (DSNS 93), 29 March - 2 April.
[11] Loh, R., V. Wullschleger, B. Elrod, M. Lage, F. Haas(1995). “The U.S. Wide-Area Augmentation System(WAAS).” Navigation, Journal of The Institute ofNavigation, Vol. 42, No. 3, Fall 1995.
[12] Mendes, V.B. and R.B. Langley (1994). “Acomprehensive analysis of mapping functions used inmodeling tropospheric propagation delay in spacegeodetic data.” Proceedings of KIS94, InternationalSymposium on Kinematic Systems in Geodesy,Geomatics and Navigation, Banff, Canada, 30 August- 2 September, pp. 87-98.
[13] Mendes, V.B. and R.B. Langley (1995). “Zenith wettropospheric delay determination using predictionmodels: Accuracy analysis.” Cartografia e Cadastro,Instituto Português de Cartografia e Cadastro, No. 2,pp. 41-47.
[14] Mendes, V.B., J.P. Collins and R.B. Langley (1995).“The effect of tropospheric propagation delay errors inairborne GPS precise positioning.” Proceedings ofION GPS-95, Palm Springs, CA, 12 - 15 September1995, pp. 1681-1689.
[15] NATO (1993). Standardization Agreement(STANAG) Doc. 4294 EL (Edition 1), Appendix 6 toAnnex A. pp. A-6-34 - A-6-37. North Atlantic TreatyOrganization, Brussels.
[16] NOAA (1976). “U.S. Standard Atmosphere 1976”.NOAA S/T 76 - 1562, NTIS AD/A035 728, NationalTechnical Information Service, U.S. Dept. ofCommerce, Springfield, VA.
[17] Niell, A.E. (1996). “Global mapping functions for theatmosphere delay at radio wavelengths.” Journal ofGeophysical Research, Vol. 101, No. B2, pp 3227-3246.
[18] Owens, J.C. (1967). “Optical refractive index of air:Dependence on pressure, temperature andcomposition.” Applied Optics, Vol. 6, No. 1, pp. 51-59.
[19] Saastamoinen, J. (1972). “Atmospheric correction forthe troposphere and stratosphere in radio ranging ofsatellites.” in The Use of Artificial Satellites forGeodesy, Geophys. Monogr. Ser., Vol. 15, AGU,Washington, D.C.
[20] Shi, J. and M.E. Cannon (1995). “Critical error effectsand analysis in carrier phase-based airborne GPSpositioning over large areas.” Bulletin Géodésique,Vol. 69, No. 4, pp. 261-273.
[21] Smith, W.L. (1966). “Note on the relationshipbetween total precipitable water and surface dewpoint.” J. Appl. Meteor., Vol. 5, October, pp. 726-727.
[22] Thayer, G.D. (1974). “An improved equation for theradio refractive index of air.” Radio Science, Vol. 9,No. 10, pp. 803-807.
[23] Tiemeyer, B., M.E. Cannon, G. Lachapelle and G.Schänzer (1994). “Satellite navigation for highprecision aircraft navigation with emphasis onatmospheric effects.” Proceedings of PLANS’94,IEEE, Las Vegas, Nevada, 11-15 April, pp. 394-401.

![[UCalgary] Investigation Into Estimation of Tropospheric Delay](https://static.fdocuments.net/doc/165x107/55cf92ab550346f57b9896a1/ucalgary-investigation-into-estimation-of-tropospheric-delay.jpg)