Mitigating Herbicide Impacts to Soybean
143
University of Arkansas, Fayetteville University of Arkansas, Fayetteville ScholarWorks@UARK ScholarWorks@UARK Theses and Dissertations 12-2019 Mitigating Herbicide Impacts to Soybean Mitigating Herbicide Impacts to Soybean Grant Lawson Priess University of Arkansas, Fayetteville Follow this and additional works at: https://scholarworks.uark.edu/etd Part of the Agricultural Science Commons, Agronomy and Crop Sciences Commons, Plant Pathology Commons, and the Weed Science Commons Citation Citation Priess, G. L. (2019). Mitigating Herbicide Impacts to Soybean. Theses and Dissertations Retrieved from https://scholarworks.uark.edu/etd/3480 This Thesis is brought to you for free and open access by ScholarWorks@UARK. It has been accepted for inclusion in Theses and Dissertations by an authorized administrator of ScholarWorks@UARK. For more information, please contact [email protected].
Transcript of Mitigating Herbicide Impacts to Soybean

University of Arkansas, Fayetteville University of Arkansas, Fayetteville
ScholarWorks@UARK ScholarWorks@UARK
Theses and Dissertations
12-2019
Mitigating Herbicide Impacts to Soybean Mitigating Herbicide Impacts to Soybean
Grant Lawson Priess University of Arkansas, Fayetteville
Follow this and additional works at: https://scholarworks.uark.edu/etd
Part of the Agricultural Science Commons, Agronomy and Crop Sciences Commons, Plant Pathology
Commons, and the Weed Science Commons
Citation Citation Priess, G. L. (2019). Mitigating Herbicide Impacts to Soybean. Theses and Dissertations Retrieved from https://scholarworks.uark.edu/etd/3480
This Thesis is brought to you for free and open access by ScholarWorks@UARK. It has been accepted for inclusion in Theses and Dissertations by an authorized administrator of ScholarWorks@UARK. For more information, please contact [email protected].

Mitigating Herbicide Impacts to Soybean
A thesis submitted in partial fulfillment
of the requirements for the degree of
Master of Science in Crop, Soil, and Environmental Sciences
by
Grant Lawson Priess
Stephen F. Austin University
Bachelor of Science in Agronomy, 2016
December 2019
University of Arkansas
This thesis is approved for recommendation to the Graduate Council
______________________________
Jason Norsworthy, Ph.D.
Thesis Director
______________________________ ____________________________
Bob Scott, Ph.D. Trent Roberts, Ph.D.
Committee Member Committee Member
______________________________
Ed Gbur, Ph.D.
Committee Member
_______________________________
Terry Spurlock, Ph.D.
Committee Member
ABSTRACT
The rapidity in evolution of herbicide-resistant weeds and the resulting cost to U.S. farmers
demonstrate the need to responsibly steward the limited number of herbicides available in
agricultural systems. To reduce weed emergence and likewise added selection pressures placed
on herbicides, early-season crop canopy formation has been promoted. However, impacts to
soybean following a potentially injurious herbicide application have not been thoroughly
evaluated. Therefore, field experiments were conducted to determine whether: 1) soybean
injury from metribuzin or flumioxazin delayed canopy formation or changed the incidence of
pathogen colonization; 2) residual herbicides applied preplant reduced the potential for soybean
injury and achieved the same longevity of weed control as herbicides applied at planting; 3)
POST-applied acetolactate synthase (ALS)- and protoporphyrinogen oxidase (PPO)-inhibiting
herbicides alone and in combination with glufosinate delayed canopy formation or impacted
grain yield. Few interactions between herbicides and soil-borne pathogens were observed.
Results from various experiments showed that soybean canopy formation was delayed after an
application of preemergence (PRE)-residual herbicides and postemergence (POST)-foliar-active
herbicides. However, delays in crop canopy formation caused by a PRE application of
metribuzin and flumioxazin were only observed in varieties with sensitivity to the herbicide.
Soybean injury caused by PRE applications were mitigated by applying herbicides 14 days prior
to planting. Treatments that were applied 14 days prior to planting and contained an effective
herbicide with a half-life greater than 70 days suffered no reduction in longevity of Palmer
amaranth control when compared to the same herbicide applied at planting. POST-applied
herbicides delayed soybean canopy formation relative to the amount of injury present following
application. Delays in canopy formation can result in a lengthened period of weed emergence,

subsequently increasing the need for additional weed control and increasing selection pressure on
sequentially applied herbicides.
Nomenclature: Flumioxazin, glufosinate, metribuzin, Palmer amaranth, Amaranthus palmeri
(S.) Wats., soybean Glycine max (L.) Merr.
Key words: Acetolactate synthase (ALS)-inhibiting herbicides, canopy formation, half-life,
herbicide-resistance weeds, POST foliar-active herbicide, preplant, protoporphyrinogen oxidase
(PPO)-inhibiting herbicides, PRE-residual herbicide, soil-borne pathogen, soybean injury

ACKNOWLEDGMENTS
There are numerous people who have invested in my growth and are responsible for my success
and accomplishments. First, I have to thank my parents and brother for their guidance, love and
support throughout my life. I also like to thank my wife for dealing with long hours, nights away,
and for always bringing me so much joy. Without the influence of KC Kemp, Eric Castner, and
Dickie Edmund I am not sure I would be in graduate school; thank you for being great mentors,
teachers, and friends. I would also like to thank my advisor, Dr. Jason Norsworthy for providing
a great opportunity and continuously challenging me to learn, grow professionally, and succeed
at everything I do. The countless hours that Dr. Norsworthy spent teaching and mentoring will
continue to drive my success moving forward. To my weed science colleagues, the work
accomplished in this thesis could not be possible without your help. Thank you for all the fun
times and sweat you poured into this research. In addition, a special thanks to the Arkansas
Soybean Promotional Board for funding this research, and the opportunity to contribute to
science.

TABLE OF CONTENTS
Chapter 1. General Introduction and Review of Literature…………………………………..1
Literature Cited ....................................................................................................................... 16
Chapter 2. Soybean Growth and Incidence of Soil-Borne Pathogens as Influenced by
Metribuzin ................................................................................................................................... 26
Abstract. ................................................................................................................................... 26
Introduction ............................................................................................................................. 28
Materials and Methods ........................................................................................................... 31
Results and Discussion ............................................................................................................ 35
Literature Cited ....................................................................................................................... 40
Apendix……………………………………………………………………………………….43
Chapter 3. Flumioxazin Effects on Soybean Canopy Formation and Soil-borne pathogen
presence ....................................................................................................................................... 54
Abstract. ................................................................................................................................... 54
Introduction ............................................................................................................................. 56
Materials and Methods ........................................................................................................... 58
Results and Discussion ............................................................................................................ 63
Literature Cited ....................................................................................................................... 68
Appendix……………………………………………………………………………………...71
Chapter 4. Weed Control and Soybean Injury from Preplant versus at Planting Herbicide
Applications ................................................................................................................................. 80
Abstract. ........................................................................................ Error! Bookmark not defined.
Introduction ............................................................................................................................. 82
Materials and Methods ........................................................................................................... 84
Results and Discussion ............................................................................................................ 87
Literature Cited ....................................................................................................................... 91
Appendix……………………………………………………………………………...………94
Chapter 5. Impact of Labeled Herbicides on Soybean Injury and Canopy formation ...... 106
Abstract. ................................................................................................................................. 106

Introduction ........................................................................................................................... 107
Material and Methods ........................................................................................................... 110
Results and Discussion .......................................................................................................... 112
Literature Cited ..................................................................................................................... 117
Appendix……………………………………………………………………………………..120
General Conclusion…………………………………………………………………………131

LIST OF TABLES
Chapter 2
Table 1. Results of the ANOVA conducted on soybean injury, soybean density and relative yield are displayed by p-values of all factors initially tested in the analysis. ........................... 43
Table 2. Visible soybean injury (%) 21 days after an application as influenced by the interaction of metribuzin rate by varietal tolerance in 2017 and 2018. ..................................... 44
Table 3. Soybean density relative to the nontreated check, displayed is the significant main effect metribuzin rate averaged over varieties in 2017 and 2018. ............................................ 45
Table 4. Mechanistic growth curve ((y = a (1 – b * EXP (-c*days)), a = asymptote, b = scale, c = growth rate) fit to data from 2017 and 2018; R2 values displays the percentage of variability explained by the fit of the line. .................................................................................................. 46
Table 5. Number of days required after metribuzin application for soybean to reach 1000, 2000, 4000 and 6000 cm3 based on inverse predictions using the mechanistic growth curve fit to soybean volume data. ............................................................................................................ 48
Table 6. Number of days required after herbicide application for soybean to reach 20, 40, 60, 80, and 95% groundcover based on inverse predictions using the mechanistic growth curve fit to percent groundcover data. ..................................................................................................... 50
Table 7. Relative soybean yield displaying the significant main effect of variety, averaged across metribuzin rates .............................................................................................................. 52
Table 8. The effects of variety, metribuzin rate, and variety by metribuzin rate interaction on the incidence of soybean root colonization by soil-borne pathogens in 2017 and 2018. .......... 53
Chapter 3
Table 1. Parameters of the mechanistic growth curve (y = a (1 – b * EXP (-c*days)) where a = asymptote, b = scale, and c = growth, fit to groundcover and soybean volume data from 2017 and 2018; R2 values are present to display the percentage of variability explained by the line fit. .............................................................................................................................................. 71
Table 2. Results of the ANOVA conducted on soybean injury, soybean density and relative yield are displayed by p-values of all factors initially tested in the analysis. ........................... 72
Table 3. Percent visual estimates of injury to soybean 21 days after planting as influenced by the interaction of flumioxazin rate by varietal tolerance. .......................................................... 73
Table 4. Relative soybean density as effected by variety in 2017 and 2018 at Fayetteville, AR. ................................................................................................................................................... 74

Table 5. The number of days predicted for soybean to reach a volume of 1000, 2000, and 5000 cm3. Differences between treatments can be determined if the 95% confidence intervals of the mean do not overlap. ................................................................................................................. 75
Table 6. The number of days predicted for soybean treated with flumioxazin at 0, 70, and 105 g ai ha-1 to reach 20, 40, 60, 80, and 95% groundcover. ........................................................... 76
Table 7. The effects of variety, flumioxazin rate, and the interaction variety X flumioxazin rate on the incidence of soybean root colonization of soil-borne pathogens. .................................. 77
Chapter 4
Table 1. Rates of the herbicides tested as well as the common and product name. .................. 94
Table 2. The p-values from ANOVA (analysis of variance) for soybean injury 21 days after planting and Palmer amaranth density 28 days after planting for five site years. ..................... 95
Table 3. Visible estimates of injury 21 days after planting near Marianna 2017, at Fayetteville 2017, and Fayetteville 2018. ..................................................................................................... 96
Table 4. Regression analysis of quadratic trend at all locations, showing inverse predictions of the number of days that the herbicide achieved 80 percent control of Palmer amaranth relative to the nontreated check; also shown is the mean confidence interval. ...................................... 97
Table 5. Published estimates of KOC (soil and organic carbon sorption ratio) and half-life of herbicides evaluated. ................................................................................................................. 99
Table 6. Density of Palmer amaranth emergence for 28 days after planting at Marianna 2017, Marianna 2018, and Fayetteville 2018. Fayetteville 2017 and Crawfordsville 2018 were not shown due to an insignificant interaction and main effects. ................................................... 100
Chapter 5
Table 1. Herbicides, formulations, and rates evaluated as well as manufacture and address. Herbicides are grouped by treatments as they were applied in experiments. ......................... 120
Table 2. Results of the ANOVA conducted on soybean injury and relative yield are
displayed by p-values of all factors tested in the analysis....................................................... 121
Table 3. Percentage of injury to soybean 2 weeks after application as infuenced by the interaction by of herbicide selection with and without the addition of glufosinate…….....…122
Table 4. Mechanistic growth curve ((y = a (1 – b * EXP (-c*days)), a = asymptote, b = scale, c = growth rate) fit to data from all site years; R2 values indicate the percentage of variability explained by the fit of the line. ................................................................................................ 123

Table 5. Number of days required after herbicide application for soybean to reach volume of 15,000 cm3 based on inverse predictions using the mechanistic growth curve fit to soybean volume data ............................................................................................................................. 124
Table 6. Number of days required after herbicide application for soybean to reach 60 and 80% groundcover based on inverse predictions using the mechanistic growth curve fit to percent groundcover data. ....................................................................................................... 125
Table 7. Soybean yield relative to the nontreated, averaged across all three site years. ......... 126

LIST OF FIGURES
Chapter 3
Figure 1. Soybean volume data from 2017 and 2018 fit with a mechanistic growth curve (y = a (1 – b * EXP (-c*days)) where a = asymptote, b = scale, and c = growth. Inverse prediction were made from the fitted lines giving an accurate representation of the number of days for soybean volume to achieve 1000, 3000, and 5000 cm3. ........................................................... 78
Figure 2. Percent groundcover of tolerant (A) and sensitive (B) varieties in 2017 and 2018 were fit with a mechanistic growth curve (y = a (1 – b * EXP (-c*days)) where a = asymptote, b = scale, and c = growth. Inverse prediction were made from the fitted lines giving an accurate representation of the number of days for soybean to achieve a groundcover of 20, 40, 60, 80, and 95%. ........................................................................................................................ 79
Chapter 4
Figure 1. Cumulative rainfall in Crawfordsville, 2018, starting at time of the preplant application (vertical line shows time of planting/at planting application) and continuing 3 months past planting................................................................................................................ 100
Figure 2. Cumulative rainfall in Marianna, 2018 starting at time of the preplant application (vertical line shows time of planting/at planting application) and continuing 3 months past planting. ................................................................................................................................... 101
Figure 3. Cumulative rainfall- in Marianna, 2017 starting at time of the preplant application (vertical line shows time of planting/at planting application) and continuing 3 months past planting. ................................................................................................................................... 102
Figure 4. Cumulative rainfall in Fayetteville 2017, starting at time of the preplant application (vertical line shows time of planting/at planting application) and continuing 3 months past planting. ................................................................................................................................... 103
Figure 5. Cumulative rainfall in Fayetteville 2018, starting at time of the preplant application (vertical line shows time of planting/at planting application) and continuing 14 days past planting. ................................................................................................................................... 104
Chapter 5
Figure 1. Mechanistic growth curve ((y = a (1 – b * EXP (-c*days)) where a = asymptote, b = scale, and c = growth) to estimate percentage soybean groundcover following fomesafen applied to V2 soybean with and without glufosinate relative to nontreated soybean as a function of days after application over three site years. .......................................................... 127
Figure 2. Mechanistic growth curve ((y = a (1 – b * EXP (-c*days)) where a = asymptote, b = scale, and c = growth) to estimate percentage soybean groundcover following fomesafen + S-metolachlor applied to V2 soybean with and without glufosinate relative to nontreated soybean as a function of days after application over three site years. ................................................... 128

Figure 3. Mechanistic growth curve ((y = a (1 – b * EXP (-c*days)) where a = asymptote, b = scale, and c = growth) to estimate percentage soybean groundcover following fomesafen + S-metolachlor + chlorimuron applied to V2 soybean with and without glufosinate relative to nontreated soybean as a function of days after application over three site years.................... 129
Figure 4. Mechanistic growth curve ((y = a (1 – b * EXP (-c*days)) where a = asymptote, b = scale, and c = growth) to estimate percentage soybean groundcover following acifluorfen applied to V2 soybean with and without glufosinate relative to nontreated soybean as a function of days after application over three site years. .......................................................... 130

1
CHAPTER 1
General Introduction and Review of Literature
Soybean [Glycine (L.) Merr.] has been a staple crop in North America since 1765 when it
was brought over by European settlers to be used as a forage crop. The first time that soybean
production for grain outweighed soybean production for forage was in 1941 (Gibson and Benson
2005). In 2003, the United States (US) produced 34% of the soybean worldwide, making it the
largest producer of soybean, followed by Brazil. The Midwest is responsible for most of the
soybean production in the US. Illinois and Iowa are the biggest state producers followed by
surrounding states and the southern states of the Mississippi delta. Arkansas is the 9th largest
producer of soybean (Gibson and Benson 2005; USDA-NASS 2019). Soybean is the number one
export crop for the US, and soybean production accounts for 80% of edible fats and oils that are
consumed in the US. There are numerous uses for soybean with some consisting of making
lecithin, biofuel, high protein meal, and soy flour and grits (Gibson and Benson 2005).
There has been an evolution of management practices over the decades that have greatly
influenced how soybean is produced worldwide, and these practices continue to change as new
problems arise. An important problem currently faced by soybean producers is herbicide-
resistant (HR) weeds. Palmer amaranth (Amaranthus palmeri S. Wats) is a common and
difficult-to-control weed species in soybean production (Van Wychen 2016) and has a large
economic impact on the cost of soybean production in the southern US.
This study examines the effect of using protoporphyrinogen oxidase (PPO)-inhibitors on
soybean and evaluating the crop response and rate of canopy closure in direct comparison to the
efficacy received from soil- and foliar-applied PPO herbicides on a resistant Palmer amaranth
population. These data will allow producers and consultants to make informed management

2
decisions when contemplating the use of specific herbicides for the control of PPO-resistant
Palmer amaranth populations in soybean.
Herbicide-Resistant Soybean. One step to maximizing yield and lowering input cost in the
production of soybean is choosing a variety that allows high efficacy of preplant (burndown),
preemergence (PRE), and postemergence (POST) applications of herbicides. Before 1996, the
options for POST herbicides in conventional soybean were limited due to the increase of
resistant weeds (Malik et al. 1989; Padgette et. al 1995). In 1996, glyphosate-resistant (GR)
soybean became available to US soybean producers (Dill 2005). Following their introduction,
soybean producers could spray glyphosate as a POST application over the top of soybean
(Padgette et al. 1996). Glyphosate is a nonselective herbicide that is highly effective on annual
and perennial grasses and broadleaf weeds (Padgette et al. 1996).
Glyphosate-Resistant Soybean. Glyphosate inhibits the biosynthesis of aromatic amino acids,
which leads to metabolic disturbances such as cessation of protein synthesis, secondary product
formation, and the lack of regulation in the shikimate pathway ultimately causing plant death
(Duke 1988). Prior to the introduction of GR crops, glyphosate could not be used as a POST
application in cropping systems because of the lack of crop tolerance (Padgette et al. 1995). GR
soybean was engineered by the insertion of a gene from Agrobacterium that codes for a
herbicide-insensitivity to 5-enolpyruvylshikimate-3-phosphate synthase (EPSPS). The
agrobacterium gene that was inserted into GR soybean resulted in the production of an EPSP that
is not naturally present in plants. This altered the shape of the natural occurring EPSP enzyme,
which prevented glyphosate from binding to the ESPS enzyme, allowing the production of
aromatic amino acids to continue and tolerance to occur (Delannay et al. 1995; Padgette et al.
1995).
3
Soybean with GR was first sold commercially under the trade name Roundup Ready® in
1996 (Dill 2005). By 2003, 81% of the soybean grown in the United States had the GR trait
(Norsworthy 2004; USDA-NASS 2019). Reasons for the rapid adoption of GR soybean were the
economic benefits of weed control, increased production efficiency, flexibility for growers, and
the facilitation of conservation tillage (Dill 2005). With the introduction of GR crops, some
scientists thought that the uniqueness of the mode of action (MOA) of glyphosate would not
allow weed species to evolve resistance to the herbicide. Glyphosate applied POST in GR crops
was seen as the cure-all herbicide technology (Bradshaw et al. 1997). However, widespread,
repeated use of one MOA results in heavy selection pressure for resistance.
A weed that quickly evolved resistance to glyphosate is Palmer amaranth (Culpepper et
al. 2006; Norsworthy et al. 2012; Shaw 2016). Palmer amaranth with GR was first found in
Georgia in 2004 (Culpepper et al. 2006). By 2008, Palmer amaranth-resistant biotypes had also
been found in Alabama, Arkansas, Mississippi, North Carolina, South Carolina, and Tennessee
(Nichols et. al 2009). Today, there are 37 weed species worldwide that are resistant to glyphosate
(Heap 2019).
Glufosinate-resistant soybean. Glufosinate is the active ingredient in the herbicide Liberty
(Bayer Crop Science, Research Triangle Park, NC). Similar to glyphosate, glufosinate is a
nonselective, POST herbicide (Coetzer et al. 2001). It controls broadleaf and grass species
(Ahrens 1994). Phosphinothricin [homoalanin-4-yl-(methyl)phosphinic acid] is the active
ingredient of glufosinate that inhibits glutamine synthetase by interacting with the enzyme
responsible for aiding in the conversion of glutamate and ammonia into glutamine (Devine et. al
1993; Hinchee et al. 1993; Culpepper et. al 2000). Glutamine synthetase inhibition can cause a
rapid build-up of ammonia in the plant cells, resulting in disturbance of the chloroplast structure,

4
which halts the process of photosynthesis (Devine et al. 1993; Hinchee et al. 1993; Culpepper et
al 2000). With this MOA, glufosinate can effectively control GR Palmer amaranth and other
amaranth species (Ahrens 1994).
In contrast to glyphosate, glufosinate efficacy is more dependent on environmental
conditions at application. Glufosinate performs better when used in high light-intensity
environments (Ahrens 1994), on a moist soil surface (Anderson et al. 1993), and in a humid
climate (Coetzer et al. 2001) making it a good fit in the Midsouth.
Glufosinate-resistant soybean was produced by incorporating the PAT gene from
Streptomyces viridochromogenes into the soybean genome. This gives the soybean the ability to
produce the enzyme phosphinothricin acetyl transferase, which renders the glufosinate molecule
ineffective by converting the L-phosphinothricin into N-acetyl-L-phosphinothricin (Devine et al.
1993; Hinchee et al. 1993; Culpepper et al. 2000).
Glufosinate-resistant soybean gives producers the ability to use glufosinate as an over-
the-top POST application with little to no soybean injury (Coetzer et al. 2001). With timely
applications of glufosinate, a high level of control of GR Palmer amaranth can be achieved
(Corbett et al. 2004; Culpepper et al. 2000, Everman et al. 2007; Gardner et al. 2006;
Norsworthy et al. 2008; Wilson et al. 2007). Glufosinate also has no known resistant biotypes of
Palmer amaranth or waterhemp (Amaranthus tuberculatus (Moq.) Sauer) (Tranel et al. 2010).
Palmer Amaranth (Amaranthus palmeri S. Wats). Palmer amaranth is a warm-season, annual
plant that can reach 2 m tall and produces many lateral branches. The leaves are suspended by
long petioles, and the immature leaf blades are lanceolate shaped. As leaves mature they take

5
more of an oval shape (Sauer 1957). Ten species of Amaranthus are dioecious and all of these
are native to North America, including Palmer amaranth (Steckel 2007; Ward et al. 2013).
Palmer amaranth is native to northwestern Mexico, Southern California, and Texas
(Sauer 1957). The spread of Palmer amaranth started in the early 20th century. Palmer amaranth
was first discovered in Virginia in 1915, Oklahoma in 1926, and South Carolina in 1957
(Culpepper et al. 2010a; Sauer 1957). Since the start of the spread of Palmer amaranth in 1915, it
has become the most troublesome weed in cotton, the second most troublesome weed in soybean,
and 7th most troublesome weed in corn in the US by 2009 (Webster and Nichols 2012). Palmer
amaranth has the ability to produce large quantities of biomass with a rapid growth rate and
extended emergence throughout the growing season, resulting in a need for season-long control
(Culpeppper et al. 2010a; Jha and Norsworthy 2009). Palmer amaranth without competition
produced over 600,000 seed per female plant, giving a high likelihood of genetic variation of
offspring (Keeley et al. 1987). Due to such prolific seeding characteristics and high genetic
variability, after one plant of GR Palmer amaranth is found in a field it only takes two years for
the population in the field to be considered resistant. High levels of genetic variability in Palmer
amaranth also result in multiple flushes of weeds germinating throughout the growing season.
This necessitates the use of multiple applications of herbicide throughout the year, increasing the
selection pressure for herbicide resistance (Fast et al. 2009).
Along with a high likelihood of genetic variation among offspring, GR Palmer amaranth
can successfully pollinate glyphosate-susceptible female plants 300 m away (Sosnoskie and
Culpepper 2012; Ward et al. 2013), adding to the spread of GR. Palmer amaranth can also
hybridize at low rates with other amaranths, including waterhemp (A. tuberculatus), smooth
pigweed (A. hybridus L.) and spiny amaranth (A. spinosus L.) (Gaines et al. 2011), thus causing

6
even higher risk for spread of HR gene flow among different species of amaranth and between
populations of Palmer amaranth. Palmer amaranth has evolved multiple-resistant mechanisms,
with biotypes in Arkansas having resistance to four MOAs. Palmer amaranth has continued to
prove its resilience and ability to evolve to cause economic impacts to crop producers across the
southern US.
Economic impact of Palmer amaranth. Palmer amaranth is the most economically damaging
GR weed in the U.S. (Beckie 2011). A study conducted by Klingaman and Oliver (1994)
concluded that with Palmer amaranth densities of 0.33, 3.33, and 10 plants m-1 soybean row,
yield was reduced by 17, 64, and 68%, respectively. A Palmer amaranth infestation impacts
more than just yield. According to Price et al. (2011) conservation tillage increased by 49% in
GR soybean and 85% for GR cotton, primarily due to the high level of weed control achieved by
glyphosate before resistant weeds became more prevalent. With the increase of GR Palmer
amaranth populations, conservation tillage declined, and an increase of in-season mechanical
control methods were used to help control emerging Palmer amaranth (Price et al. 2011). This is
another input cost that soybean producers incur due to herbicide-resistant Palmer amaranth.
Herbicide Resistance in Palmer amaranth. Currently there are seven MOAs to which Palmer
amaranth has evolved resistance: acetolactate synthase (ALS) inhibitors, carotenoid biosynthesis
(4-hydroxyphenylpyruvate dioxygenase) inhibitors, enolpyruvyl shikitmate-3-phosphate
synthase inhibitor (glyphosate), mitosis inhibitors (dinitroanilines), photosystem II inhibitors,
protoporphyrinogen oxidase (PPO) inhibitors, and very-long-chain fatty acid (VLCFA) inhibitors
(Heap 2019; Barber et al. 2015). Palmer amaranth and waterhemp have very similar
characteristics (Wetzel et al. 1999). A case of multiple resistance was found in a waterhemp
biotype in Illinois (Bell et al. 2009). The biotype had confirmed resistance to Photosystem II

7
inhibitors, ALS inhibitors, glyphosate, and PPO inhibitors (Bell et al. 2009). Interbreeding
among Amaranthus species can allow gene introduction and contribute to the spread of herbicide
resistance among Amaranthus species (Wetzel et al. 1999; Franssen et al. 2001).
Photosystem II Inhibitor (WSSA Group 5)-Resistant Palmer Amaranth. Populations containing
a biotype of waterhemp resistant to PSII-inhibitors were discovered in 1991 in the Midwest US
and Canada (Anderson et al. 1996; Heap 2019). Palmer amaranth resistance to atrazine, a PSII
herbicide, was confirmed in 1995 in Texas and in Georgia in 2008 (Heap 2019). The exact
mechanism of resistance to atrazine and inheritance of PSII resistance are unknown (Ward et al.
2013).
Acetolactate Synthase Inhibitor (WSSA Group 2)-Resistant Palmer Amaranth. Acetolactate
synthase (ALS)-inhibiting herbicides were first commercialized in 1982 for broadleaf weed
control in small grains (Sprague et al. 1997). In the biosynthesis pathways of branched-chain
amino acids valine, leucine and isoleucine, ALS is an essential enzyme. Disruption of this
pathway results in the reduction of protein synthesis, causing decreased photosynthate
translocation to meristems which leads to cessation of cell division and plant growth, ultimately
resulting in plant death (Sprague et al. 1997). Resistance to chlorimuron-ethyl, diclosulam,
imazaquin, imazethapyr, trifloxysulfuron-sodium, and pyrithiobac-sodium has been confirmed in
Palmer amaranth (Heap 2019). Palmer amaranth biotypes with resistance to ALS inhibitors are
found in North America, Brazil, and Israel (Heap 2019). ALS resistant weeds can be found on
six continents, making it the most widespread and common herbicide resistance seen today
(Heap 2019).

8
ESPS Synthase Inhibitor (WSSA Group 9)-Resistant Palmer Amaranth. In 2002, 83% of
soybean hectares were treated with glyphosate (USDA 2019). After its widespread and repeated
use, the first confirmed case of Palmer amaranth resistant to glyphosate was reported in 2004 in
Georgia (Culpepper et al. 2006). The mechanism used by Palmer amaranth to develop resistance
was an amplification of the 5-enolpyruvylshikimate-3-phosphate synthase (EPSPS) gene (Gaines
et al. 2011). Palmer amaranth had amplified the EPSPS gene as many as or more than 100 times
allowing for an increase in enzyme production to absorb the glyphosate while maintaining
enough EPSPS to allow the plant to continue functioning (Gaines et al. 2011). This mechanism
had not previously been observed (Gaines et al. 2011). GR populations of Palmer amaranth have
spread all over the south and into Illinois, Michigan and Virginia (Heap 2019; Nandula et al
2012). GR Palmer amaranth can be found in North America, Argentina, and Brazil (Heap 2019).
Dinitroaniline (WSSA Group 3)-Resistant Palmer Amaranth. One of the first known resistance
cases in Palmer amaranth was discovered in 1989 in the dinitroaniline family. The first
population resistant to trifluralin was found in South Carolina, and this population also showed
cross resistance to benefin, isopropalin, pendimethalin, and ethalfluralin (Gosset et al. 1992).
Resistance to trifluralin was also reported in Tennessee in 1998 (Heap 2019). Populations of
Palmer amaranth with resistance to the DNA herbicides also exist in Arkansas (Schwartz-Lazaro
et al. 2017).
HPPD Inhibitor (WSSA Group 27)-Resistant Palmer Amaranth. In Kansas, a biotype of
common waterhemp and Palmer amaranth with resistance to the HPPD herbicides mesotrione,
tembotrione, and bicyclopyrone was discovered in 2009 (Heap 2019). The mechanism and
inheritance of this resistance is not yet known; although it is likely metabolic (Jhala et al. 2014).

9
PPO Inhibitor (WSSA Group 14)-Resistant Palmer Amaranth. The widespread resistance to
glyphosate forced growers to increase use of PPO inhibitors in soybean and cotton production.
This increased the likelihood of selecting for PPO resistance to Palmer amaranth and waterhemp
(Salas et al. 2016). A common method of control for Palmer amaranth and waterhemp with
residual herbicides after the evolution of GR weeds included fomesafen and flumioxazin, both
PPO inhibitors (Neve et al. 2011). Flumioxazin used preplant burndown and fomesafen used
PRE were applied to 3% and 8% of the cotton acres in Georgia, respectively, before GR Palmer
amaranth. After widespread occurrence of GR Palmer amaranth, use of these two herbicides
increased tenfold (Sosnoskie and Culpepper 2014). A major issue with using lactofen or
fomesafen as an alternate herbicide option to glyphosate is timing. Palmer amaranth should not
be taller than 8 cm at time of application (Prostko 2012).
Due to the challenges of application timing and overuse of PPO inhibitors, resistance to
this MOA has occurred in six weed species. The first weed to evolve PPO resistance was
waterhemp (Riggins and Tranel 2012; Heap 2019; Sosnoskie and Culpepper 2014). Waterhemp
biotypes resistant to PPO-inhibitors were discovered in Kansas in 2000 (Shoup et al. 2003).
Shortly after this discovery, PPO-resistant biotypes of waterhemp were found in Missouri,
Illinois, and Iowa (Heap 2019). The resistance mechanism was first discovered in an Illinois
biotype of waterhemp. Resistance was found to be a result of a deletion of an amino acid codon
in the glycine residue at position 210 of the PPX2 gene (Patzoldt et al. 2006). This mutation
decreased sensitivity of waterhemp 100-fold to PPO-inhibitors (Gressel and Levy 2006; Patzoldt
et al. 2006; Tranel et al. 2010). PPO-resistant populations of waterhemp continued to increase
despite the decreased use of PPO-inhibitors after the release of GR-crops. (Tranel et al. 2010). A
PPO-resistant Palmer amaranth biotype was detected in Arkansas in samples collected from 2008

10
through 2011 by Salas et al. (2016). These Palmer amaranth populations tested positive for the
glycine 210 deletion (Salas et al. 2016).
Herbicides for GR Palmer amaranth Control. Sulfentrazone. The PPO-inhibiting herbicide
sulfentrazone has excellent soil residual activity and is used primarily to control small-seeded
broadleaf weeds and suppress grasses (Hulting et al. 2001). Soybean tolerance to sulfentrazone
can be measured by the amount of height reduction and rapid appearance of symptomology,
including wilting and necrosis of shoot tissue as well as speckled leaf lesions (Belfry et. al 2016;
Mallory-Smith and Retzinger 2003). The level of tolerance to sulfentrazone varies by variety
(Dayan and Duke et al. 1997; Swantek et al. 1996). Sulfentrazone tolerance is assumed to be
controlled by a single, dominant gene in soybean (Swantek et al. 1998); however, soybean
breeders have not focused efforts on incorporating this trait into commonly used commercial
varieties.
Tolerance levels can also be affected by environmental conditions immediately after
application. For example, cool wet conditions can increase injury (Belfry et al. 2016). Soybean
tolerance can also be amplified by high pH soils, low organic matter (OM), application timings,
delayed activation, and tank-mix partners (Tidemann et al. 2014). Tolerance levels to
sulfentrazone differ from tolerance levels to flumioxazin and other PPO-inhibiting herbicides;
thus, a different mechanism may control the tolerance levels to different PPO-inhibiting
herbicides (Taylor-Lovell et al. 2001). Mahoney et al. (2014) reported that PPO-Inhibitors can
act synergistically with chloroacetamides (VLCFA-inhibitors); however, when sulfentrazone and
saflufenacil, both PPO inhibitors, were tank mixed, the result was an additive effect. When
flumioxazin was applied in a mixture with saflufenacil, a synergistic effect resulted. This further
displays different tolerance mechanisms within soybean to different PPO-inhibiting herbicides.

11
Sulfentrazone application timing can play a big role in the level of soybean injury. Early
preplant (EPP), preplant incorporated (PPI), and preemergence (PRE) applications all have
different effects on degree of soybean injury in the field (Cahoon et al. 2014).
Flumioxazin. Flumioxazin is applied as a preplant or PRE herbicide and can be combined with
POST herbicides before soybean germination to add soil residual activity through crop
emergence (Taylor-Lovell et al. 2002). However, due to the splashing effect of rain and overhead
irrigation, activation of the herbicide before soybean emergence will decrease injury to soybean.
Yoshida et al. (1991) demonstrated when flumioxazin is applied POST after soybean emergence,
despite some foliar activity on weed species, unacceptable soybean injury can occur. Therefore,
flumioxazin is used prior to crop and weed emergence to control small-seeded broadleaves and
some annual grasses (Sakaki et al 1991; Talbert et al. 1990; Yoshida et al. 1991; Taylor-Lovell et
al. 2001, 2002), and is sometimes preferred over sulfentrazone due to the decreased risk for crop
injury (Oliver et al. 1997). Tolerance in soybean to flumioxazin and sulfentrazone are not
synonymous; there are differences; however, more research is needed to pinpoint the
genes/mechanisms that control tolerance to flumioxazin (Taylor-Lovell et al. 2002).
Crop Stress Influencing an Increased Susceptibility to Disease. There is a direct relationship
with abiotic wounding to crops and the response to pathogens (Reymond and Farmer 1998;
Durrant et al. 2000; Reymond et al. 2000). It is also readily hypothesized that plants have
developed mechanisms to integrate wounding and pathogen response (Maleck and Dietrich
1999).
The ability of a plant to cope with chemical and physical stressors relates to the amount
of certain protein molecules that are up- and down-regulated as a result of altered gene
expression (Castro et al. 2005). These protein molecules play two roles acting as a warning
12
system to plant biosynthesis pathways and in the adaption process of enzymes involved in
degradation of damaged cell contents and stress repair. Molecular plant response has been
documented to abiotic stress factors such as temperature fluctuations (Lund et al. 1998; Ukaji et
al. 1999), nutrient deficiency (Suzuki et al. 1998), heavy metals (Hajduch et al. 2001; Fecht-
Chritoffers et al. 2003), salt stress (Salekdeh et al. 2002a), and drought stress (Riccardi et al.
1998; Salekdeh et al. 2002a,b). There is little literature supporting the hypothesis that stress to a
crop caused by herbicide increases the incidence of soil-borne pathogens; however,
transcriptional profiling linking interactions between abiotic stresses, wounding, and pathogens
is leading evidence.
Integrated Palmer Amaranth Management. Palmer amaranth with multiple resistance
mechanisms points to the need for integrated weed management (Schwartz et al. 2016). There
are no effective economic thresholds established for Palmer amaranth and other resistance-prone
weeds. The idea that Palmer amaranth has tolerable to a threshold is a common misconception in
weed science that needs to be addressed. Palmer amaranth requires a zero tolerance policy,
meaning no escapes are allowed to reproduce (Norsworthy et al. 2014).
Mechanical. Mechanical methods for weed control include but are not limited to the use of
tillage, mowing, hoeing, and hand pulling (Schwartz et al. 2016). The use of tillage can be an
effective means for controlling Palmer amaranth (Culpepper et al. 2010b; York 2012). Between
2000 and 2005, an average of 34% of the cotton hectares in Georgia used in-season mechanical
weed management options (usually cultivation, a form of tillage); after the discovery of GR
Palmer amaranth, the percentage of cotton hectares that used in-season tillage increased to an
average of 44% from 2006 through 2010 (Sosnoskie and Culpepper 2014).

13
Hand weeding also increased from 2000-2005, 3 to 5% of cotton hectares in Georgia
were hand weeded; after the spread of GR Palmer amaranth an average of 52 to 66% of the
cotton was hand-weeded. The cost of hand-weeding also increased from $2 ha-1 before GR
Palmer amaranth to an average of $27 ha-1 afterwards (Sosnoskie and Culpepper 2014).
Managing escapes is an important part of the zero tolerance policy; the management of escapes
is often through hand-weeding and spot spraying (Barber et al. 2015).
The inclusion of mechanical weed control practices is essential to a well-developed
integrated weed management program (Barber et al 2015; Schwartz et al. 2016). A classification
of mechanical control is harvest weed seed control (HWSC) (Schwartz et al. 2016). Schwartz et
al. (2016) and Norsworthy et al. (2016) describe multiple options for HWSC including narrow
windrow burning, chaff cart use, and the introduction of the Harrington Seed Destructor (HSD).
These options provide alternate and effective means of preventing viable weed seed from being
reintroduced into the soil seedbank (Schwartz et al. 2016; Schwartz et al. 2015; Walsh and
Powles 2014; Norsworthy et al. 2016)
Chemical. To stop the development of new resistance problems in cropping systems, producers
are encouraged to use multiple MOAs, rotate cropping systems, and integrate herbicide programs
with physical and cultural controls methods (Bagavathiannan et al. 2013; Barber et al. 2015).
Producers should rotate crop and chemical technology every season (Barber et al. 2015).
Cultural. Cultural weed control methods include but are not limited to the use of cover crops,
planting dates, seeding rates, row spacing, canopy closure, and crop rotation (Schwartz et al.
2016). One weakness of Palmer amaranth is the rapid depletion of viable seed from the soil seed
bank; thus, management of the soil seedbank can be a successful management strategy (Jha et al.
2014). On average, 75-80% of Palmer amaranth seed is lost due to predation and winter exposure

14
when seed is left on the soil surface the first winter (Bagavathiannan and Norsworthy 2013;
Barber et al. 2015). Studies conducted by Jha et al. (2014) display that the soil seedbank can be
depleted of Palmer amaranth seed if no Palmer amaranth seed is added to the soil in four
consecutive years. Maintaining clean turnrows and ditch banks is also an essential management
strategy to prevent replenishment of the seed bank by Palmer amaranth (Barber et al. 2015) as
well as ensuring that machinery is not contaminated with weed seed when transporting
equipment.
Canopy closure is a tool that can be utilized in integrated weed management. Crop
canopy closure directly affects the emergence rate of weed seeds (Harder et al. 2007; Burnside
and Moonmaw 1977; Chandler et al. 2001; Dalley et al. 2004; Nelson and Renner 1997; Nice et
al. 2001; Young et al. 2001). An increase in soybean density in a field due to narrow row spacing
or increased seeding rates promotes early canopy closure by increasing leaf area index (LAI)
(Harder et al. 2007; Bertram and Pederson 2004). Full soybean canopy is measured by the
amount of light interception caused by the LAI; an LAI at or greater than 95% is considered a
full canopy (Harder et al. 2007; Gardner et al. 1985; Shibles and Weber 1965). The increase in
LAI of soybean during a growing season allows for more light and solar interception, thus
reducing the temperature of soil and solar radiation that stimulates weed seed germination and
weed growth (Harder et al. 2007; Yelverton and Coble 1991). Water availability also plays a
vital role in soybean vigor and canopy formation. Irrigation or rain events can cause flushes of
weeds but also increase growth rates of soybean (Nelson and Renner 1997).
The variety of soybean depicts how early maturity will be reached. Earlier maturing
soybeans can increase speed of canopy closure, thus reducing weed seed germination more
efficiently than later maturing soybean (Edwards and Purcell 2005).

15
Row spacing between soybean plants can also play a vital role in soybean canopy closure
speeds. Narrower row spacing increase the amount of light intercepted by the soybean canopy,
which reduces germination of some weed seed (Burnside and Colville 1964; Wax and Pendleton
1968; Yelverton and Coble 1991). However, Jha et al. (2008) determined that even when Palmer
amaranth is shaded, up to 87%, growth continues as if the plants were not shaded. Whereas
canopy closure helps with reducing weed seed germination, the competitive nature of Palmer
amaranth can overcome heavily shaded areas through upright growth (Jha et al. 2008).
Palmer amaranth can overcome shaded environments caused by the soybean canopy by
increasing the specific leaf area, which is measured by leaf thickness (Jha et al. 2008). This
allows Palmer amaranth to spread palisade and mesophyll, found in the leaves, over a larger
surface area to compensate for low photosynthetic rates in shaded environments (Jha et. al 2008;
Singh et al. 1974). The importance of an early maturing and well-developed soybean canopy is
essential to utilizing this cultural method of weed control.

16
LITERATURE CITED
Ahrens WH, ed (1994) Herbicide Handbook. 7th edn. Champain, IL: Weed Science Society of
America. Pp 174-149
Anderson DD, Roeth FW, Martin AR (1996) Occurrence and control of atrazine-resistant
common waterhemp (Amaranthus rudis) in field corn (Zea mays). Weed Technol 10:570-
575
Anderson DM, Swanton CJ, Hall JC, Mersey BG (1993) The influence of temperature and
relative humidity on the efficacy of glufosinate-ammonium. Weed Res 33:139-147
Bagavathiannan MV, Norsworthy JK (2013) Post-dispersal loss of important arable weed seeds
in the midsouthern United States. Weed Sci 61:570-579
Bagavathiannan MV, Norsworthy JK, Scott RC, Barber LT (2013) Answers to frequently asked
questions on herbicide resistance management. University of Arkansas Division of
Agriculture Fact Sheet FSA2172 http://www.uaex.edu/publications/pdf/FSA2172.pdf.
Accessed February 3, 2017
Barber LT, Smith KL, Scott RC, Norsworthy JK, Vangilder AM (2015) zero tolerance: a
community-based program for glyphosate-resistant Palmer amaranth management. Little
Rock, AR: University of Arkansas, Division of Agriculture and Natural Research and
Extension FSA2177 http://www.uaex.edu/publications/pdf/FSA2177.pdf. Accessed
February 3, 2017
Beckie HJ (2011) Herbicide resistant weeds: management tactics and practices. Weed Technol
20:793-814
Belfry KD, Shropshire C, Sikkema PH (2016) Identity-preserved soybean tolerance to
protporphyrinogen oxidase-inhibitng herbicides. Weed Technol 30:137-147
Bell MS, Tranel PJ, Hager AG (2009) Introducing quad-stack waterhemp: population containing
individuals resistant to four herbicide mode of action. North Central Weed Sci Soc. Abstr
64, 40.
Bertram MG, Pedersen P (2004) Adjusting management practices using glyphosate-resistant
soybean cultivars. Agron J 96:462-468
Bradshaw LG, Padgette SD, Kimball SL, Wells BH (1997) Perspectives on glyphosate
resistance. Weed Technol 11:189-198
Burnside OC, Colville WL (1964) Soybean and weed yields as affected by irrigation, row
spacing, tillage, and amiben. Weeds 12:109-112

17
Burnside OC, Moomaw RS (1977) Control of weed in narrow-row soybeans. Agron J 69:793-
796
Cahoon CW, York AC, Jordan DL, Everman WJ, Seagroves RW (2014) An alternative to
multiple protoporphyrinogen oxidase inhibitor applications in no-till cotton. Weed
Technol 28:58-71
Castro AJ, Carapito C, Zorn N, Magne C, Leize W, Van Dorsselaer A, Clemente (2005)
Proteomic analysis of grapevine (Vitis vivfera L.) Tissues subjected to herbicide stress. J
Exp Bot 56:2783-2795
Chandler K, Shrestha A, Swanton CJ (2001) Weed seed return as influenced by the critical
weed-free period and row spacing of no-till glyphosate-resistant soybean. Plant Sci
81:877-672
Coetzer EK, Al-Khatib K, Loughin TM (2001) Glufosinate efficacy absorption, and translocation
in Amaranthus species as affected by relative humidity and temperature. Weed Sci 49:8-
13
Corbett JL, Askew SD, Thomas WE, Wilcut JW (2004) Weed efficacy evaluations for
bromoxynil, glufosinate, glyphosate, pyrithiobac, and sulfosate. Weed Technol 18:443-
453
Culpepper AS, Grey TL, Vencill WK, Kichler JM, Webster TM, Brown SM, York AC, Davis
JW, Hanna WW (2006) Glyphosate-resistant Palmer amaranth (Amaranthus palmeri)
confirmed in Georgia. Weed Sci 54:620-626
Culpepper AS, Kilcher J, Sosnoskie L, York A, Sammons D, Nichols B (2010a) Integrating crop
cover residue and moldboard plowing in to glyphosate-resistant Palmer amaranth
management programs. National Cotton council of America. Proceedings of the 2010
Beltwide Cotton Conference. Pp 1650
Culpepper AS, Webster TM, Sosnoskie LM, York AC (2010b) Glyphosate-resistant Palmer
amaranth in the United States. Pages 195-204 in Nandula VK, ed. Glyphosate Resistance
in Crops and Weeds: History, Development and Management 1st edn. Hoboken, NJ: J
Wiley
Culpepper AS, York AC, Batts RB, Jennings KM (2000) Glyphosate- and glufosinate-resistant
soybean (Glycine max) Weed Technol 14(1):77-88
Dally CD, Kells JJ, Renner KA (2004) Effect of glyphosate application timing and row spacing
on corn (Zea mays) and soybean (Glycine max) yields. Weed Technol 18:165-176

18
Dayan FE, Duke SO (1997) Phytotoxicity of protoporphyrinogen oxidase inhibitors:
Phenomenology, mode of action and mechanisms of resistance. Roe RM, Burton JD,
Kuhr RJ, eds. Herbicide activity: Toxicology, Biochemistry and Molecular Biology.
Amsterdam: IOS Press. Pp 11-35
Delannay X, Bauman TT, Beighley DH, Buettner MJ, Coble HD, DeFelice MS (1995) Yield
evaluation of a glyphosate-tolerant soybean line after treatment with glyphosate. Crop Sci
35:1461-1467
Devine MD, Duke SO, Fedtke C (1993) Inhibition of amino acid biosynthesis. In physiology of
herbicide action. Englewood Cliffs, NJ: Prentice Hall, Inc. pp. 252-263
Dill GM (2005) Glyphosate-resistant crops: history, status and future. Pest Manag Sci 62:219-
224
Duke SO, (1988) Glyphosate. IN: Kearney, PC, Kaufman DD, (Eds.), Herbicides: Chemistry,
Degradation, and Mode of Action. Macel Dekker Inc., New York, pp 1-70
Durrant WE, Rowland R, Peidras P, Hammock-Kosack KE, Jones JDG (2000) cDNA-ALFLP
reveals a striking overlap in race-specific resistance and wound response gene expression
profiles. Plant Cell 12:963-977
Edwards JT, Purcell LC (2005) Light interception and yield response of ultra-short-season
soybean to diphenylether herbicides in Midsouthern United States. Weed Technol
19:168-175
Everman WJ, Burke IC, Allen JR, Collins J, Wilcut JW (2007) Weed control and yield with
glufosinate-resistant cotton weed management systems. Weed Technol 21:695-701
Fast BJ, Murdock SW, Farris RL, Willis JB, Murray DS (2009) Critical timing of Palmer
amaranth (Amaranthus palmeri) removal in second-generation glyphosate-resistant
cotton. J Cotton Sci 13:32-36
Fetch-Christoffers MM, Braun HP, Lemaitre-Guillier C, Van Dorsselaer A, Horst WJ (2003)
Effec of manganese toxicity on the proteome of the leaf apoplast in cowpea. Plant
Physiol 133:1935-1936
Frassen AS, Skinner DZ, Al-Khatib, Horak MJ, and Kulakow PA (2001) Interspecific
hybridization and gene flow of ALS resistance in Amaranthus species. Weed Sci 49:598-
606
Gaines TA, Shaner DL, Ward SM, Leach JE, Preston C, Westra P (2011) Mechanism of
resistance of evolved glyphosate-resistance Palmer amaranth (Amaranthus palmeri). J
Agric Food Chem 59:5886-5889
19
Gardner AP, York AC, Jordan DL, Monks DW (2006) Management of annual grasses and
Amaranthus spp. In glufosinate-resistant cotton. J. Cotton Sci 10:428-338
Gardner FP. Pearce RB, Mitchell RL (1985) Physiology of Crop Plants. Ames, Iowa: Iowa State
Press Pp 31-56
Gibson L, Benson G (2005) Origin, history, and uses of soybean (Glycine max). Iowa State
University, Department of Agronomy, Iowa, p 1
Gosset BJ, Murdock EC, Toler JE (1992) Resistance of Palmer amaranth (Amaranthus palmeri)
to the dinitroaniline herbicides. Weed Technol 6:587-591
Gressel J, Levy AA (2006) Agriculture: the selector of improbable mutations. Poc Nat Acad Sci
U.S.A. 103:12215-12216
Hajduch M, Rakwal R, Agrawal GK, Yonekura M, Pretova A (2001) High resolution two-
dimensional electrophoresis separation of proteins from metal-stressed rice (Oryza sativa
L.) leaves drastic reductions/fragmentation of ribulose-1,5-bisphosphate
carboxylase/oxygenase and induction of stress related proteins. Electrophoresis 22:2824-
2831
Harder DB, Sprague CL, Renner KA (2007) Effect of soybean row width and population on
weeds, crop yield, and economic return. Weed Technol 21:744-752
Heap IM (2019). The International Survey of Herbicide Resistant Weeds.
http://www.weedscience.com Accessed January 2, 2019
Hinchee MAW, Padgette SR, Kishore GM, Delannay X, Fraley RT (1993) Herbicide-tolerant
crops. In S. Kung and R, Wu, eds. Transgenic Plants. San Diego CA: Academic Press
Inc. pp. 243-263
Hulting AG, Wax LM, Nelson RL, Simmons FW (2001) Soybean (Glycine max (L.) Merr.)
Cultivar tolerance to sulfentrazone. Crop Protec 20:679-683
Jhala AJ, Sandell LD, Rana N, Kruger GR, Knezevic SZ (2014) Confirmation and control of
triazine and 4-hydroxyphenylpyruvate dioxygenase-inhibiting herbicide-resistant Palmer
amaranth (Amaranthus palmeri) in Nebraska. Weed Technol 28:28–38
Jha P, Norsworthy JK (2009) Soybean canopy and tillage effects on emergence of Palmer
amaranth (Amaranthus palmeri) from a natural seed bank. Weed Sci 57:644-651
Jha P, Norsworthy JK, Garcia J (2014) Depletion of an artificial seed bank of Palmer amaranth
(Amaranthus palmeri) over four years of burial. Amer J Plant Sci 5:1599-1606

20
Jha P, Norsworthy Jk, Riley MB, Bielenberg DG, Briges W Jr (2008) Acclimation of Palmer
amaranth (Amaranthus palmeri) to shading. Weed Sci 56:729-734
Klingaman TE, Oliver LR (1994) Palmer amaranth (Amaranthus palmeri) interference in
soybeans (Glycine max). Weed Sci 42:523-527
Keeley PE, Carter CH, Thullen RJ (1987) Influence of planting date on growth of Palmer
amaranth (Amaranthus palmeri). Weed Sci 35:199–204.
Lund AA, Blum PH, Bhattramakki D, Elthon TE. (1998) Heat stress response of maize
mitochondria. Plant Physiol 116:1097–1110
Mahoney KJ, Tardif FJ, Robinson DE, Nurse RE, Sikkema PH (2014) Tolerance of soybean
(Glycine max L.) to protoporphyrinogen oxidase inhibitors and very long chain fatty
amino acid synthesis inhibitors applied preemergence. Am J Plant Sci 5:1117-1124
Maleck K, Dietrich RA (1999) Defense on multiple fronts: How do plants cope with diverse
enemies? Trends Plant Sci 4:215-219
Malik J, Barry G, Kilshore G (1989) The herbicide glyphosate. Biofactors 2:17-25
Mallory-Smith CA, Retzinger JE (2003) Revised classification of herbicides by site of action for
weed resistance management strategies. Weed Technol 17:605-619
Nandula VK, Reddy KN, Kroger CH, Poston DH, Rimando AM, Duke SO, Bond JA, Ribeiro
DN (2012) Multiple resistance to glyphosate and pyrithiobac in Palmer amaranth
(Amaranthus palmeri) from Mississippi and response to flumiclorac, Weed Sci 60:179-
188
Nelson KA, Renner KA (1997) Weed management in wide- and narrow- row glyphosate-
resistant soybean. J Prod Agric 12:460-465
Neve P, Norsworthy JK, Smith KL, Zelaya IA (2011) Modelling evolution and management of
glyphosate resistance in Amaranthus palmeri. Weed Res. 51:99–112
Nice GR, Buehring NW, Shaw DR (2001) sicklepod (senna obtusifolia) response to shading,
soybean (Glycine max) row spacing, and population in three management systems, Weed
technol 15:155-162
Nichols RL, Bond J, Culpepper AS, Dodds D, Nandula V, Main CL, Marshall MW, Mueller TC,
Norsworthy JK, Prive A, Parrerson M, Scott RC, Smith KL, Steckel LE, Stephenson D,
Wright D, York AC (2009) Glyphosate-resistant Palmer Amaranth (Amaranthus palmeri)
spreads in the southern United States (U.S.) Resistant Pest Management Newsletter 18:8-
10. http://whalonlab.msu.edu/Newsletter/pdf.18_2.pdf. Accessed: February 10, 2017.

21
Norsworthy JK (2004) Broadleaf weed control in wide-row soybean (Glycine max) using
conventional and glyphosate herbicide programs. Crop Prot 23:1229-1235
Norsworthy JK, Ward SM, Shaw DR, Llewellyn R, Nichols RL, Webster TM, Bradley K
W, Frisvold G, Powles SB, Burgos NR, Witt W, Barrett M (2012) Reducing the risks of
herbicide resistance: Best management practices and recommendations. Weed
Sci 60 (Special Issue I):31–62
Norsworthy JK, Griffin G, Griffin T, Bafavathiannan M, Gbur EE (2014) In-field movement of
glyphosate-resistant Palmer amaranth (Amaranthus palmeri) and impact on cotton lint
yield: evidence supporting a zero-threshold strategy. Weed Sci 62:237-249
Norsworthy JK, Griffin GM, Scott RC, Smith KL, Oliver LR (2008) Conformation and control
of glyphosate-resistant Palmer amaranth (Amaranthus palmeri) in Arkansas. Weed
Technol 22:108-113
Norsworthy JK, Korres NE, Walsh MJ, Powles SB (2016) Integrating herbicide programs with
harvest weed seed control and other fall management practices for the control of
glyphosate-resistant Palmer amaranth. Weed Science (in review).
Oliver LR, Swantek JM, Castillo (1997) Soybean cultivar susceptibility to sulfentrazone. Weed
Sci. Soc. Am. Abstr 34:12
Padgette SR, Kolacz KH, Delannay X, DB, LaVallee BJ, Tinius CN, Rhodes WK, Otero YI,
Barry GF, Eichholtz DA, Peschke VM, Nida DL, Taylor NB, Kishore GM (1995)
Development, identification and characterization of a glyphosate-tolerant soybean line.
Crop Sci 35:1451-1461
Padgette SR, Re DB, Barry GF, Eichholtz DE, Delannay X, Fuchs RL, Kishore GM, Fraley RT
(1996) New weed control opportunities: Development of soybeans with a Roundup
Ready gene. In Herbicide-resistant Crops: Agricultural, Environmental, Economic,
Regulatory, and Technical Aspects (Duke SO, ed.), pp. 53–84. CRC Press, Boca Raton,
FL.
Patzoldt WL, Hager AG, McCormick JS, Tranel PJ (2006) A codon deletion confers resistance
to herbicides inhibiting protoporphyrinogen oxidase. Proc Natl Acad. U.S.A. 103:12329-
12334
Price AJ, Balkcom KS, Culpepper JA, Kelton RL, Nichols RL, Schomberg H (2011)
Glyphosate-resistant Palmer amaranth: a threat to conservation tillage. J. Soil Water
Conserv. 66:265–275.

22
Prostko EP (2012) Managing herbicide-resistant Palmer amaranth (pigweed) in field corn, grain
sorghum, peanut and soybean.http://www.gaweed.com/resistance-2012-tables.pdf.
Accessed January, 2019.
Reymond P, Farmer EE (1998) Jasmonate and salicylate as global signals global signals for
defense gene expression. Curr Opin Plant Bio 1:404-411
Reymond P, Weber H, Damond M, Farmer EE (2000) Differential gene expression in response
to mechanical wounding and insect feeding in Arabidopsis, Plant Cell 12:707-719
Riccardi F, Gazeau P, de Vienne D, Zivy M (1998) Protein changes in response to progressive
water deficit in maize. Plant Physiol 117:1253–1263
Riggins CW, Tranel, PJ (2012) Will the Amaranthus tuberculatus resistance mechanism to PPO‐
inhibiting herbicides evolve in other Amaranthus species? Int J Agron Article ID 305764,
p. 7, DOI: 10.1155/2012/305764
Sakaki M, Sato R, Hada T, Nagano E, Oshio H, Kamoshita K (1991) Herbicidal efficacy of S-
53482 and factors affecting the phytotoxicity and the efficacy. Weed Sci Soc Am Abstr
34:12
Salas RA, Burgos NR, Tranel PJ, Singh S, Glasglow L, Scott RC, Nichols RL (2016) Resistance
to PPO-inhibiting herbicides in Palmer amaranth from Arkansas. Pest Mange Sci 72:864-
869
Salekdeh GH, Siopongco J, Wade LJ, Ghareyazie B, Bennett J (2002a) Proteomic analysis of
rice leaves during drought stress and recovery. Proteomics 2:1131–1145
Salekdeh GH, Siopongco J, Wade LJ, Ghareyazie B, Bennett J (2002b) A proteomic approach to
analysing drought- and saltresponsiveness in rice. Field Crops Res 76:199–219
Sauer JD (1957) Recent migration and evolution of the dioecious amaranths. Evolution 11:11-31
Schwartz LM, Gibson DJ, Gage KL, Matheres JL, Jordan DL, Owen MDK, Shaw DR, Weller
SC, Wilson RG, Young BG (2015) Seedbank and field emergence of weeds in
glyphosate-resistant cropping systems in the United States. Weed Sci 63:425-439
Schwartz LM, Norsworthy JK, Barber TL, Scott RC (2016) Harvest weed seed control- an
alternate method for measuring the soil seed bank. University of Arkansas Research and
Extension. FSA2180. http://www.uaex.edu/publications/pdf/FSA-2180.pdf Access date:
February 24, 2017.

23
Schwartz-Lazaro LM, Norsworthy JK, Scott RC, Barber LT (2017) Resistance of two Palmer
amaranth populations to multiple herbicide modes of action in Arkansas. Crop
Prot 96:158-163
Shaw DR (2016) The “Wicked” Nature of the Herbicide Resistance Problem. Weed Sci Special
Issue:552-558
Shibles RM, Weber CR (1965) Leaf area, solar radiation interception and dry matter production
by soybeans. Crop Sci 5:575-578
Shoup DE, Al-Khatib K, Peterson DE (2003) Common Waterhemp (Amaranthus rudis)
resistance to protoporphyrinogen oxidase-inhibiting herbicides. Weed Sci 51:145-150
Singh M, Ogren WL, Widholm JM (1974) Photosynthetic characteristics of several C3 and C4
plant species grown under different light intensities. Crop Sci 14:563-566
Sosnoskie L, Culpepper AS (2012) Changes in cotton weed management practices following the
development of glyphosate-resistant Palmer amaranth. Page 1520 in Proceedings of the
2012 Beltwide Cotton Conference. Cordova. TN: National Cotton Council of America
Sosnoskie L, Culpepper AS (2014) Glyphosate-Resistant Palmer amaranth (Amaranthus
palmeri) increases use of herbicide use, tillage and hand-weeding in Georgia cotton.
Weed Sci 62(2):393-402
Sprague CL, Stroller EW, Wax LM, Horak MJ (1997) Palmer amaranth (Amaranthus palmeri)
and common waterhemp (Amaranthus rudis) resistance to selected ALS-inhibiting
herbicides. Weed Sci 42:192-197
Steckel, LE (2007) The dioecious amaranth spp: here to stay, intriguing world of weeds. Weed
Technol 21:567-570.
Suzuki K, Itai R, Suzuki K, Nakanishi H, Nishizawa NK, Yoshimura E, Mori S (1998) Formate
dehydrogenase, an enzyme of anaerobic metabolism, is induced by iron deficiency in
barley roots. Plant Physiol 116:725–732
Swantek JM, Oliver LR (1996) Influence of application method on soybean cultivar tolerance to
sulfentrazone. Proc. South. Weed Sci Soc 49:194
Swantek JM, Sneller CH, Oliver LR (1998) Evaluation of soybean injury from sulfentrazone and
inheritance of tolerance. Weed Sci 46:271-277
Talbert RE, Oliver LR, Fans RE, Johnson DH, Wichert RA, Kendig JA, Ruff DF, McCarty JT
(1990) Field screening of new chemicals for herbicidal activity. 1989 Res. Series
Arkansas Agric Ecp. Sta. 395:22

24
Taylor-Lovell S, Wax LM, Bollero G (2002) Preemergence flumioxazin and pendimethalin and
post emergence herbicide systems for soybean (Glycine max). Weed Technol 16:502-511
Taylor-Lovell S, Wax LM, Nelson R (2001) Phytotoxic response and yield of soybean (Glycine
max) varieties treated with sulfentrazone or flumioxazin. Weed Technol 15:95-102
Tidemann BD, Hall LM, Johnson EN, Beckie, Sapsfor KL, Willenborg CJ, Raatz LL (2014)
Addictive efficacy of soil applied pyroxasulfone and sulfentrazone combinations. Can J
Plant Sci 94:1245-1253
Tranel PJ, Riggins CW, Bell MS, Hager AG (2010) Herbicide Resistances in Amaranthus
tuberculatus: A Call for New Options. J Agric Food Chem 59 (11), pp 5808–5812
Ukaji N, Kuwabara C, Takezawa D, Arakawa K, Yoshida S, Fujikawa S (1999) Accumulation of
small heat-shock protein homologues in the endoplasmic reticulum of cortical
parenchyma cells in mulberry in association with seasonal cold acclimation. Plant Physiol
120:481–489
(USDA) U.S. Department of Agriculture. National Agricultural Statistics Service (2019)
Agricultural chemical usage 2002 field crop summary. Available at:
http://usda.mannlib.cornall.edu/reports/nassr/other/pcupbb/agcs053.pdf. Accessed
February 2, 2019
Van Wychen L (2016) 2016 Survey of the most common and troublesome weeds in broadleaf
crops, fruits & vegetables in the United States and Canada. Weed science society of
America National Weed Survey Dataset. Available: http:/wssa.net/wp-
content/uploads/2016_Weed_Survey_Final.xlsx Accessed February 7, 2017
Walsh MJ, Prowles SB (2014) High seed retention at maturity of resistant weeds infesting crop
fields highlights the potential for harvest weed seed control. Weed Technol 27:431-436
Ward SM, Webster TM, Steckel LE (2013) Palmer Amaranth (Amaranthus palmeri): A Review.
Weed Technol 27:12-27
Wax LM and Pendlton JW (1968) Effects of row spacing on weed control in soybeans. Weeds
Sci.16:462-465
Webster TM, Nichols RL (2012) Changes in the prevalence of weed species in the major
agronomic crops of the Southern United States 1994/1995 to 2008/2009. Weed Sci
60:145-157
Wetzel DK. Horak MJ, Skinner DZ, and Kulakow PA (1999) Transferal of herbicide resistance
traits from Amaranthus palmeri to Amaranthus rudis. Weed Sci 47:538-543

25
Wilson DG, York AC, Jordan DL (2007) Effect of row spacing on weed management in
glufosinate-resistant cotton. Weed Technol 21:489-495
Yelverton FH, Coble HD (1991) Narrow row spacing and canopy formation reduces weed
resurgence in soybean (Glycine max). Weed Sci 25:73-78
York AC (2012) Weed management in cotton. 2012 cotton information. NCSU Extension Pub.
http:/www.cotton.ncsu.edu/. Raleigh NC: North Carolina State University Press. Pp 66-
123
Yoshida RM, Sakaki R, Sato T, Hada E, Nagano H, Oshio, Kamoshita K (1991) A new N-phenyl
phthalimide herbicide. Crop Prot 1:69-75
Young BG, Young GM, Gonzini LC, Hart SE, Wax LM, Kapusta G (2001) Weed management
in in narrow- and wide-row glyphosate-resistant soybean (Glycine max). Weed Technol
15:112-121

26
CHAPTER 2
Soybean Growth and Incidence of Soil-borne Pathogens as Influenced by Metribuzin
ABSRACT
Soybean injury following an application of metribuzin soon after planting can occur
under cool, wet conditions, especially for varieties that lack a high level of tolerance to the
herbicide. Field experiments were conducted in 2017 and 2018 in Fayetteville, AR, to evaluate
the impacts of metribuzin at 0, 280, 560, 840, and 1,120 g ai ha-1 on soybean growth and
incidence of soil-borne pathogens. Three levels of metribuzin tolerance (sensitive, moderately
tolerant, and tolerant) were evaluated based on a previous screen. In both years, visible injury to
soybean was impacted by varietal tolerance and metribuzin rate. As metribuzin rate and soybean
sensitivity increased, more injury was observed. Metribuzin applied at 280, 840, and 1,120 g ha-1
in 2017 and only 1,120 g ha-1 in 2018 reduced soybean plant population, averaged across
varieties, by 12, 23, 23, and 11%, respectively. Metribuzin at 1,120 g ha-1 delayed the sensitive
soybean cultivars from reaching 20, 40, 60, and 80% groundcover by 11, 12, 9, and 5 days,
respectively, compared to the nontreated. Metribuzin-moderately tolerant and -tolerant varieties
did not suffer any delays in canopy formation. The sensitive variety had a yield loss up to 21%
following metribuzin at 1,120 g ha-1 when compared to the nontreated. Metribuzin did not impact
colonization of soybean in either site year by microorganisms in the genus Acrophilaphora,
Collectotrichum, Didymella, Fusarium, Pythium, Macrophomina, Phomopsis, Rhizoctonia,
Rhizopus, and Trichoderma. Delays in canopy formation can be mitigated through appropriate
variety selection.
Nomenclature: Metribuzin; Acrophilaphora; Collectotrichum; Didymella; Fusarium; Pythium;
Macrophomina; Phomopsis; Rhizoctonia; Rhizopus; Trichoderma; soybean, Glycine max (L.)
Merr.

27
Keywords: Canopy formation, groundcover, metribuzin tolerance, shading, weed emergence,
varietal tolerance

28
INTRODUCTION
Metribuzin is a broad-spectrum preemergence (PRE) soil-residual herbicide that offers an
alternate, effective site of action (photosystem II inhibitor (triazinone)) to control Palmer
amaranth [Amaranthus palmeri (S.) Wats.] biotypes with resistance to acetolactate synthase
(ALS) inhibitors, 4-hydroxyphenylpryuvate dioxygenase inhibitors, enolpyruvyl shikimate-3-
phosphate synthase inhibitor (glyphosate), protoporphyrinogen oxidase (PPO) inhibitors, a long-
chain fatty acid inhibitor (S-metolachlor), microtubule assembly inhibitors (dinitroanilines), and
photosystem II inhibitors (triazines) (Heap 2019). Because of the evolution of multiple resistant
weeds like Palmer amaranth, metribuzin use has increased in soybean in recent years (USDA-
NASS 2017). The increased use of metribuzin warrants a need for evaluating injury to soybean
from the herbicide and subsequent effects on the crop.
Herbicide rate, variety selection, soil texture, soil pH, soil organic matter, and amount of
rainfall or overhead irrigation should all be considered when treating soybean with metribuzin
(Anderson 1970; Coble and Schrader 1973; Hardcastle 1974; Ladlie et al. 1976; Smith and
Wilkinson 1974). Selecting a soybean with adequate metribuzin tolerance is an essential
component of an effective weed control program when using this herbicide. Metribuzin
tolerance in soybean is controlled by a single dominate gene (Kilen and Guohao 1992). In
tolerant varieties, metribuzin is dissociated or detoxified. Therefore, tolerant varieties can reduce
the amount of metribuzin that is acropetally translocated, subsequently reducing visible injury to
the crop (Fedtke and Schmidt 1983; Smith and Wilkinson 1974). However, it is not clearly
known if the herbicide-induced injury resulting from a lack of metabolism has adverse effects on
growth, canopy formation, and/or incidence of infestation by soil-borne pathogens.

29
Rapid crop canopy formation is essential for reducing weed emergence and in turn,
selection for herbicide resistance (Jha and Norsworthy 2009; Norsworthy et al. 2012). Crop
canopy formation impacts weed emergence, reducing the number of weeds that must be
controlled by ensuing herbicide applications (Jha and Norsworthy 2009; Nelson and Renner
1999; Nelson and Renner 2001). Canopy formation decreases weed emergence by decreasing
daily soil thermal amplitude and altering light quality that reaches the soil surface (Harder et al.
2007; Jha and Norsworthy 2009 Yelverton and Coble 1991).
Many factors can influence crop canopy formation including, but not limited to, row
spacing and leaf orientation (Baker and Meyer 1966), planting date (Board and Harville 1992),
fertility (Flenet and Kiniry 1995), insects (Board et al. 1997), and growth stage (Luxmoore et al.
1971). Nelson and Renner (2001) observed that soybean injury from postemergence herbicide
applications can hinder crop growth. Delays in crop canopy formation have the potential to
impact weed emergence and disease presence by altering environmental conditions surrounding
the crop (Jha and Norsworthy 2009; Levene et al. 1998). Delaying soybean canopy formation
with applications of metribuzin may be undesirable in certain soybean production systems where
high populations of herbicide-resistant weeds persist.
The effects of metribuzin and other PRE herbicides on incidence of soybean pathogen
inoculation is not well understood. In some cases, herbicide injury to crops can increase
susceptibility to infection by some pathogens (El-Khadem 1998) or increase plant tolerance to
other pathogens through production of phytoalexins (Dann et al. 1999). Understanding what type
of interaction is taking place within an environment is complex. Many factors that impact
herbicide and disease interactions include herbicide dose, herbicide formulation, tillage systems,

30
environmental conditions, crop, timing of herbicide application, and infection of the pathogen
(Duke et al. 2007).
Direct and indirect interactions occur between herbicides and plant diseases (Duke et al.
2007). Herbicides can have direct adverse effects on individual pathogens. Direct effects are the
ability of a herbicide to illicit a response on the pathogen. Changes in a pathogen caused by a
herbicide include germination, sporulation, and mycelium growth. Indirect interactions between
herbicides and diseases are much less understood or noted in literature. Indirect effects are
defined as changes in plant physiological responses to the herbicide that influence pathogen
colonization or disease severity. Interaction between the two often occur at the molecular level
(Duke et al. 2007).
It has been observed that metribuzin has direct effects on soil-borne pathogens. Casale
and Hart (1986) found metribuzin reduces mycelium growth and the number of sclerotia that
were able to produce stem rot (Sclerotinia sclerotiorum). In another in vitro study, Radkey and
Grau (1986) observed that WSSA Group 5 and 7 herbicides (PSII inhibitors) can have adverse
effects on germination of stem rot sclerotia and can cause malformed apothecia. In other field
studies, metribuzin did not affect Pythium root rot severity (Dissanayake et al. 1998). Changes
in soybean physiological response to metribuzin (indirect interaction) have not been shown to
influence pathogen colonization of soybean. Therefore, experiments were conducted to evaluate
the impact of metribuzin-induced soybean injury on canopy formation, yield, and incidence of
soil-borne pathogens.

31
MATERIALS AND METHODS
Field experiments were conducted in 2017 and 2018 at the University of Arkansas-
Agricultural Research and Extension Center (AAREC) in Fayetteville, AR. The experiments
were planted May 5, 2017 and May 15, 2018. The soil in Fayetteville, was composed of a Leaf
silt loam (Fine, mixed, active, thermic Typic, Albaquults) with 34% sand, 53% silt, 13% clay,
1.5% organic matter, and in 2017 and 2018, a pH of 6.8 and 6.2, respectively. In both years, the
fields were prepared prior to planting by disking and hipping 91-cm-wide beds. The plot sizes
were 7.6 m long and 3.8 m wide. The experiment was conducted in adjacent field sites each year.
Trials were planted in fields where soybean was grown the previous year to increase the likely
presence of soil-borne pathogens.
Prior to field experimentation, varying degrees of metribuzin tolerance in glufosinate-
resistant soybean varieties were determined in the greenhouse. The field experiments were
arranged as a two-factor factorial randomized complete block design with four replications. The
two factors were three levels of soybean varietal tolerance [CDZ 4540LL (tolerant), CDZ
4818LL (moderately tolerant), CDZ 4748LL (sensitive)] and five metribuzin rates applied PRE
at 0, 280, 560, 840, and 1,120 g ai ha-1. To simulate common practice soybean varieties were
treated with commercial seed treatments PONCHO®/VOTiVO® which contains 40.3%
clothianidin, 8.1% Bacillus firmus I-1582, ILeVO® which contain 48.4% of fluopyram, and
REDIGO® 480 which contains 41% prothioconazole and 28.35% metalaxyl also commonly
known as ALLEGIANCE® -FL. Soybean is commonly categorized into medium, medium bushy,
and bushy to correctly describe growing characteristics of varieties. CDZ 4748LL is considered a
medium bushy and CDZ 4540LL and CDZ 4818LL would be considered bushy. Soybean
varieties tested were indeterminate. Soybean varieties were seeded at 346,000 seed ha-1 at a 2.5-

32
cm depth. Irrigation was accomplished with the use of an overhead lateral irrigation system.
Plots were kept weed free with the use of glufosinate, S-metolachlor, and hand weeding.
Herbicide treatments were made with a CO2-pressurized backpack sprayer calibrated to deliver
140 L ha-1 at 4.8 km hr-1 equipped with 110015 AIXR flat fan nozzles (Teejet Technologies,
Springfield, IL, 62703). Treatments were made to all four rows within a plot.
Soybean densities (2 m row-1) were recorded 14 days after planting (DAP) to quantify
any reduced emergence caused by metribuzin. Estimates of visible metribuzin injury to soybean
were rated at 21 days after planting (DAP) on a scale of 0 to 100, with 0 being no crop injury and
100 being complete crop death. To evaluate crop canopy formation, aerial photos using an
unmanned aerial vehicle (DJI Phantom 4 Pro equipped with a 1080p gimbal mounted camera,
Shenzhen, China, 518057), as well as canopy height and canopy width, were taken and measured
weekly after application until canopy closure or crop maturity was achieved. Photos taken were
used to determine soybean groundcover. Photos were imported into Fieldanalyzer
(https://www.turfanalyzer.com/field-analyzer), a software that produced the proportion of green
pixels in each plot, allowing percent groundcover to be calculated for soybean. Five soybean
canopy height and width measurements to the nearest centimeter were taken per plot. Height and
width measurements were imported into an algorithm
(� × ���� ℎ� �ℎ)(���� � �ℎ ÷ 2)2
(Norsworthy 2004) to estimate soybean volume in cm3. Grain yield was determined at maturity
by harvesting the center two rows of the plot with a small-plot combine and correcting to 13%
moisture.

33
When soybean in the nontreated plots reached the V1 growth stage, ten plants, including
the root mass, were collected from the outside two rows from plots treated with metribuzin at 0,
280, and 1,120 g ha-1. Plants from a single plot were placed into a clean bag and labeled by plot.
All samples were transported immediately to the laboratory. Individual plants were then cut 1.5
cm below and above the soil line. The samples remained grouped by plot and were washed with
running water for 20 minutes. Samples were then soaked in a (6%, 87.5 ml L-1) 0.5% sodium
hypochlorite solution (w/v) for 30 seconds. Soybean stems were rinsed, dried, and then
individually placed in large (100 x 15 mm) Petri dishes (part number: 25384-088, VWR
International, Arlington Heights, IL 60004) containing agar (part number: 97064-336,
VWR International, Arlington Heights, IL 60004). Soybean were placed onto the 100 x 15 mm
Petri dishes within 20 hours of removal from each plot and remained there for three to four days.
Emerging colonies of fungi and oomycetes were selected by morphological characteristics where
the selected area was marked and a plug of agar containing the outermost hyphal tips was
removed using a flame sterilized scalpel. One sample of each colony was transferred to 60 x 15
mm Petri dishes (part number, 25384-090 VWR International, Arlington Heights, IL 60004)
filled with an amended potato dextrose agar medium (part number: 95022-794, VWR
International, Arlington Heights, IL 60004) (18g Difco potato dextrose agar, 10 and 250 mg of
the antibiotics rifampicin and ampicillin, respectively), and the miticide fenpropathrin (0.14 mg
ai L-1 (Danitol 2.4 EC, Valent Chemical Co., Walnut Creek, CA 94596-8025)). The completed
isolates were placed in a sterile container at room temperature for seven days. Isolates of similar
morphological characteristics were grouped seven days after the transfers. The number of
isolates per group was recorded and sent for DNA analysis at the University of Arkansas Plant
Pathology Laboratory in Monticello, AR.

34
Representative pure cultures were arbitrarily selected from each group for DNA analysis.
Deoxyribonucleic acid was collected from pure cultures by scraping 0.25 to 0.5 ml of mycelia
and spores from the tops of colonies using a sterile scalpel blade. Mycelia and spores were
placed into a microfuge tube, where 500µL 0.9% (w/v) NaCl prepared with sterile distilled water
was added. Genomic DNA extractions were obtained by using a Norgen Biotek Genomic DNA
Purification kit (Kit # 27300, Norgen Biotek Corp., Ontario, Canada L2V 4Y6). Polymerase
chain reaction was achieved by following the GoTaq Green Master Mix 2X (Promega Corp.,
Madison, WI 53711) using a 25µL reaction and following the accompanying amplification
guidelines. Primers used in reactions were internal transcribed spacer (ITS) 4 (reverse) and ITS-5
(forward) (ThermoFisher Scientific, Waltham, MA 02454). Confirmation of amplification was
determined by gel electrophoresis, followed by soaking in GelRed (Biotium, Freemont, CA
94538) nucleic acid stain for 20 minutes, and viewing the gel on a UV light box. Digestion of
excess nucleotides was achieved by using the ExoSAP-IT protocol (Catolog number 78201,
ThermoFisher Scientific, Waltham, MA 02454). Quantification of DNA concentrations were
achieved by using a micro-volume spectrophotometer (SimpliNano, GE Health Care Life
Sciences, Logan, UT 84321). Samples were sent pre-mixed to Eurofins Genomics (Louisville,
KY 40299) for sequencing in accordance with their protocol. Sequences were trimmed, aligned
using ClustalW in Bio-Edit (version 7.0.5, Ibis Therapeutics, Carlsbad, CA 92008), and
identified using the nucleotide basic local alignment search tool in GenBank (BLASTn, NCBI,
Bethesda, MD 20892).
Data Analysis. Visible injury data were subjected to an analysis of variance (ANOVA) in SAS
version 9.4 (SAS Institute Inc., Cary, NC). Visible injury data collected 21 days after application
were assumed to have a beta distribution (values of 0 were adjusted to 0.005 to avoid exclusion)

35
and analyzed with PROC GLIMMIX. Soybean density, pathology isolate, and yield data were
subjected to ANOVA in JMP 14.1 (SAS Institute Inc., Cary, NC). Visible soybean injury,
soybean density, pathology isolate, and yield data were separated by site year due to a
differences in environmental conditions. Assumptions of normality were met, and means were
separated using Fisher’s protected LSD at P=0.05 where appropriate. P-values from ANOVA are
displayed in Table 1.
Percent groundcover and soybean volume data were entered by days after emergence into
the Fit Curve Platform of JMP 14.1. A mechanistic growth curve (y = a (1 – b * EXP (-c*days))
where a = asymptote, b = scale, and c = growth was the best fit for both the percent groundcover
and soybean volume data base on AICc, weighted AICc, and R-squared values. Inverse
predictions were made for number of days required for soybean to achieve a percent groundcover
of 20, 40, 60, 80, and 95% and soybean volume of 1000, 2000, 4000, and 6000 cm3. Prediction
estimates were compared using mean 95% confidence intervals. Soybean groundcover and
soybean volume data were combined over site year to give an increase in observations.
Combining over site year may have slightly increased variability within the model; however, the
accuracy of the predication was increased and the power to detect differences was improved.
RESULTS AND DISCUSSION
Soybean Injury. A significant interaction between metribuzin rate and varietal tolerance was
observed in the visible injury data collected in 2017 and 2018 (P=0.0381 and P=0.0053) (Table
1). As metribuzin rate and soybean sensitivity to metribuzin increased, likewise visible soybean
injury generally increased (Table 2). Tolerant soybean (CDZ 4540LL) exhibited 2% visible
injury when metribuzin was applied at 560 g ha-1 in both years, whereas the moderately tolerant
(CDZ 4818LL) and sensitive variety (CDZ 4748LL) suffered 6 to 9 and 25 to 16% injury,

36
respectively, at the same rate (Table 2). The sensitive soybean variety suffered 51 and 48%
visible injury from metribuzin at 1,120 g ha-1 at 21 days after application (Table 2). Soybean
injury following metribuzin is common, especially when use rates are at or above 560 g ha-1,
metribuzin is applied to a soil pH above 7, and a sensitive or moderately tolerant variety is
planted (Barrentine et al. 1976; Coble and Scharder 1973; Green et al. 1988; Hardcastle 1974;
Ladlie et al. 1976; Moshier and Rust 1981; Salzman and Renner 1992; Wax et al. 1976).
Soybean Density. For the soybean density data collected in 2017 and 2018, the interaction of
variety by metribuzin rate was not significant (P=0.2885 and P=0.0924, respectively) along with
the main effect of variety (P= 0.1673 and P=0.9945, respectively); however, the main effect of
metribuzin rate was significant in both years (P=0.0495 and P=0.0329, respectively). As soybean
density increases, the amount of time for soybean to reach canopy closure decreases (Norsworthy
and Oliveira 2004). Therefore, any reduction in soybean population due to injury from
metribuzin would be undesired, as a delay in soybean canopy formation may follow. Soybean
density, averaged over variety, generally decreased as metribuzin rate increased both years,
indicating that differences in varietal tolerance are mainly a function of injury following
emergence rather than emergence reduction among varieties (Table 1). At the metribuzin rate of
560 g ha-1, which is slightly higher than a typical field use rate for a silt loam soil, density
averaged across varieties was numerically reduced only 10 and 4% in 2017 and 2018,
respectively, meaning that most of the injury was associated with symptomology on soybean
following emergence (Table 3). The fact that metribuzin did not strongly impact emergence is
not surprising because light is needed for oxidation and destruction of membranes once the D1
protein is inhibited (Pfister and Arntzen 1979).

37
Soybean Volume. Parameter estimates of mechanistic growth curves fit to the two site years of
data are displayed in Table 4. The analysis of five individual plants per plot was not sufficient for
detecting differences among varieties or metribuzin rates because of the variability among plants.
Additional sampling may have improved the prediction of canopy volume and detection of
differences, but use of an aerial image and quantification of groundcover is more efficient,
accurate, and descriptive than the cumbersome measurement of individual plants in a plot. When
measuring soybean volume, the only significant delay detected was when the sensitive variety
(CDZ 4748LL) treated with metribuzin at 1,120 g ha-1 took 4 days longer than the nontreated to
reach 6000 cm3 (Table 5).
Percent Groundcover. Development of soybean groundcover generally differed by variety and
metribuzin rate (Table 6). The sensitive variety (CDZ 4748LL) when treated with metribuzin at
1,120 g ha-1 was delayed from reaching 20, 40, 60, and 80% groundcover by 12, 12, 9, and 5
days, respectively (Table 6). At the same levels of groundcover, the metribuzin-moderately
tolerant and -tolerant varieties suffered no significant delay in canopy formation when compared
to the nontreated (Table 6). At 95% groundcover, no delays among varieties were observed.
These findings show the importance of planting a metribuzin-moderately tolerant or -tolerant
soybean variety. Prolonging canopy formation lengthens the period for weed emergence and in
turn places selection on subsequently applied herbicides (Jha and Norsworthy 2009; Norsworthy
et al. 2012).
Yield. The sensitive variety in 2017 and 2018 had reduced yield when averaged over metribuzin
rates by 2 and 21%, respectively; whereas, yields were not reduced for the moderately-tolerant
and tolerant varieties (Table 7). Similarly, Hardcastle (1974) observed that soybean planted on a
silt loam soil suffered yield loss from an application of metribuzin at 1,120 g ha-1 to sensitive

38
varieties; however, varieties with higher tolerance did not suffer yield loss. The amount of yield
loss from metribuzin was likely impacted by soil texture, soil pH, and soil organic matter. It
would be expected if these trials were conducted on soil with different characteristics the level of
yield loss could vary. Even though yield loss was observed at a metribuzin rate of 1,120 g ha-1,
other monetary expenses may be affected by a delay in canopy formation. An increase in the
number of herbicide applications or weed control measures may contribute to the overall expense
of injuring soybean with metribuzin.
Herbicide Interaction with Pathogen Colonization. Of the isolates collected from soybean
stems in the experiment, ten different genera of fungi and oomycetes were found. These were
Acrophilaphora, Collectotrichum, Didymella, Fusarium, Pythium, Macrophomina, Phomopsis,
Rhizoctonia, Rhizopus, and Trichoderma. Colonization of soybean stems was not affected by
metribuzin rate or soybean variety (Table 8). These findings are similar to those presented by
Dissanayake et al. (1998) in that metribuzin did not affect Pythium root rot severity. Even though
metribuzin tolerance differs among soybean varieties, there was not a linkage between level of
tolerance and risk for colonization from the soil-borne pathogens.
Conclusions and Practical Implications. Selection of herbicides and soybean varieties that
minimize potential crop injury from herbicide applications allows full advantage of crop canopy
formation to be realized when developing a weed control program. Even though yield loss does
not always occur following metribuzin applications, delays in canopy formation may increase the
likelihood that an additional postemergence herbicide application is needed, in turn causing a rise
in overall weed control expenditures. Canopy formation of sensitive soybean was delayed up to
12 days by metribuzin at 1,120 g ha-1. Metribuzin-induced injury to sensitive soybean postpones
canopy formation, with such a delay having been shown to lengthen the potential for new weed
39
emergence (Jha and Norsworthy 2009) and likewise increase selection for resistance on
subsequently applied herbicides (Norsworthy et al. 2012). Therefore, the negative impacts
following a metribuzin application to sensitive soybean of yield loss and a delay in canopy
formation may supersede the benefits of weed control. However, metribuzin moderately-tolerant
and -tolerant soybean did not suffer delays in canopy formation or reductions in yield. Delays in
canopy formation and likewise an increase in rapidity of herbicide resistance can be mitigated by
choosing a metribuzin-tolerant variety. It also does not appear that metribuzin changed soil-
borne pathogen colonization of soybean, regardless of soybean sensitivity to the herbicide.
In the research conducted, methodology for determining soybean groundcover was
refined. Aerial photos taken by unmanned aerial vehicle and image processing software provided
more accurate assessments of soybean groundcover than cumbersome height and width
measurements. The increase in accuracy achieved by aerial photos and software analysis
translated to the ability to determine delays in soybean canopy formation that were a result of
PRE herbicide injury.
40
LITERATURE CITED
Anderson RN (1970) Influence of soybean seed size on response to atrazine. Weed Sci 18:162-64
Baker DN, Meyer RE (1966) Influence of stand geometry on light interception and net photosynthesis in cotton. Crop Sci 6:15–18
Barrentine WL, Edwards CJ Jr, Hartwig EE (1976) Screening soybeans for tolerance to
metribuzin. Agron J 68:351–353
Board JE, Harville BG (1992) Explanations for greater light interception in narrow- vs. wide-row soybean. Crop Sci 32:198–202
Board JE, Wier AT, Boethel DJ (1997) Critical light interception during seed filling for insecticide application and optimum soybean grain yield. Agron J 89:369–374
Casale WL, Hart WP (1986) Influence of four herbicides on carpogenic germination and
apothecium development of Sclerotinia sclerotiorum. Phytopath 76:980–984
Coble HD, Schrader JW (1973) Soybean tolerance to metribuzin. Weed Sci 21:308–309
Dann EK, Diers BW, Hammerschmidt R (1999) Suppression of Sclerotinia stem rot of soybean
by lactofen herbicide treatment. Phytopath 89:598–602
Dissanayake NJ, Hoy W, Griffin GL (1998) Herbicide effects on sugarcane growth, Pythium root
rot, and Pythium arrhenomanes. Phytopath 88:530–535
Duke SO, Wedge DE, Cerdeira AL, Matallo MB (2007) Herbicide effects on plant disease.
Outlooks Pest Manag 18:36–40
El-Khadem HS (1998) The mechanism of saccharide osotriazole formation. Carbohydr Res
313:255
Fedtke C, Schmidt RR (1983) Behaviour of metribuzin in tolerant and susceptible soybean varieties. Pages 177-182 in Matsunaka S, Hutson DH, Murphy SD, eds. Pesticide Chemistry: Human Welfare and the Environment. Elsevier LTD
Flenet F, Kiniry JR (1995) Efficiency of biomass accumulation by sunflower as affected by
glucose requirement of biosynthesis and leaf nitrogen content Field Crops Res 44:119-
127
Green JM, Obrigawitch TT, Long JD, Hutchinson JM (1988) Metribuzin and chlorimuron
mixtures for preemergence broadleaf weed control in soybeans (Glycine max). Weed
Technol 2:355–363

41
Hardcastle WS (1974) Differences in the tolerance of metribuzin by varieties of soybean. Weed Res 14:181-184
Harder DB, Sprague CL, Renner KA (2007) Effect of soybean row width and population on
weeds, crop yield, and economic return. Weed Technol 21:744-752
Heap IM (2019) International survey of herbicide resistant weeds. Weed Science Society of
America. Internet: www.weedscience.org. Accessed March 27, 2019
Jha P, Norsworthy JK (2009) Soybean canopy and tillage effects on emergence of Palmer
amaranth (Amaranthus palmeri) from a natural seed bank. Weed Sci 57:644-651
Kilen TC, Guohao H (1992) Identification and inheritance of metribuzin tolerance in wild soybean. Crop Sci 32:684-685
Ladlie JS, Meggitt WF, Penner D (1976) Effect of soil pH on microbial degradation, absorption,
and mobility of metribuzin. Weed Sci 24:477–481
Levene BC, Owen MDK, Tylka GL (1998) Response of soybean cyst nematodes and soybeans
(Glycine max) to herbicides. Weed Sci 46:264–270
Luxmoore RJ, Millington RJ, Marcellos H (1971) Soybean canopy structure and some radiant energy relations. Agron J 63:111–114
Moshier LJ, Rust OG (1981) Metribuzin injury in soybeans as influenced by application timing
and cultivation. Agron J 73:677–679
Nelson KA, Renner KA (2001) Soybean growth and development as affected by glyphosate and postemergence herbicide tank mixtures. Agron J 93:428-434
Nelson KA, Renner KA (1999) Cost-effective weed management in wide- and narrow-row glyphosate resistant soybean. J Prod Agric 12:460–465
Norsworthy JK (2004) Conventional soybean plant and progeny response to glyphosate. Weed
Technol 18:527–531
Norsworthy JK, Oliveira MJ (2004) Comparison of the critical period of weed control in wide-
and narrow-row corn. Weed Sci 52:802–807
Norsworthy JK, Ward SM, Shaw DR, Llewellyn R, Nichols RL, Webster TM, Bradley K
W, Frisvold G, Powles SB, Burgos NR, Witt W, Barrett M (2012) Reducing the risks of
herbicide resistance: Best management practices and recommendations. Weed
Sci 60 (Special Issue I):31–62
Pfister K, Arntzen CJ (1979) The mode of action of photosystem H-specific inhibitors in
herbicide-resistant weed biotypes. Z Naturforsch 34:996–1009

42
Radkey VL, Grau VL (1986) Effects of herbicides on carpogenic germination of Sclerotinia
sclerotiorum. Plant Dis 70:19–23
Salzman FP, Renner KA (1992) Response of soybean to combinations of clomazone, metribuzin,
linuron, alachlor, and atrazine. Weed Technol 6:922–929
Smith AE, Wilkinson RE (1974) Differential absorption, translocation and metabolism of metribuzin ([ 4-amino-6-f ert-butyl-3-(methylthio)-fli-triazine-5(4H/)one] by soybean cultivars. Plant Physiol 32:253-257
(USDA-NASS) U.S. Department of Agriculture–National Agricultural Statistics Service (2017)
Quick Stats. https://quickstats.nass.usda.gov. Accessed: February 2, 2019
Wax LM, Stoller EW, Bernard RL (1976) Differential response of soybean cultivars to
metribuzin. Agron J 68:484–486
Yelverton FH, Coble HD (1991) Narrow row spacing and canopy formation reduces weed
resurgence in soybean (Glycine max). Weed Sci 25:73-78

43
APPENDIX
Table 1. Results of the ANOVA conducted on soybean injury, soybean density, and relative
yield are displayed by p-values of all factors initially tested in the analysis.
Soybean injury Soybean density Soybean yield
Factors 2017 2018 2017 2018 2017 2018
---------------------------------p-values---------------------------------
Variety <0.0001 <0.0001 0.1673 0.9945 <0.0001 <0.0001
Metribuzin rate <0.0001 <0.0001 0.0495 0.0329 0.0902 0.2042
Variety by Metribuzin rate
0.0381 0.0053 0.2885 0.0924 0.0902 0.3292

44
Table 2. Visible soybean injury (%) 21 days after an application as influenced by the
interaction of metribuzin rate by varietal tolerance in 2017 and 2018.
Soybean injury
Variety Metribuzin rate 2017 2018
g ai ha-1 -----------%------------
CDZ 4540LL (tolerant) 0 0 ga
0 g
280 3 fg 1 g
560 2 g 2 g
840 7 e 4 gf
1120 16 d 6 ef CDZ 4818LL (moderately tolerant) 0 0 g 0 g
280 3 g 3 g
560 6 ef 9 de
840 10 e 11 d
1120 25 c 16 c CDZ 4748LL (sensitive) 0 0 g 0 g
280 7 e 5 gf
560 25 c 16 c
840 33 b 26 b
1120 51 a 46 a a Means not represented with like letters are statically different within columns based on
Fisher’s protected LSD (P = 0.05).

45
Table 3. Relative soybean density data shows the
significant main effect of metribuzin rate averaged
over varieties in 2017 and 2018.
Relative soybean densitya
Rate 2017 2018
g ai ha-1 ---------------%-------------- 0 100 ab
100 a
280 88 bc 103 a
560 90 ab 96 ab
840 77 d 95 ab
1120 77 d 89 b a Soybean densities are relative to the nontreated of
the three varieties which averaged 226,900 plants ha-1. b Means not represented with like letters are statically
different, within columns, based on Fisher’s protected
LSD (P= 0.05).

46
Table 4. Mechanistic growth curve ((y = a (1 – b * EXP (-c*days)), a = asymptote, b = scale,
c = growth rate) fit to soybean groundcover and volume data from 2017 and 2018; R2 values
displays the percentage of variability explained by the fit of the line.
Parameters
Response Variable Variety
Metribuzin rate Asymptote Scale
Growth rate R2
g ai ha-1 Soybean groundcover
CDZ 4818LL 0 -0.48132 0.79002 -0.02127 0.9823
280 -1.11769 0.83019 -0.01277 0.9760
560 -0.40757 0.75377 -0.02388 0.9854
840 -0.23947 0.70149 -0.03120 0.9438
1120 -0.22498 0.77975 -0.03040 0.9733
CDZ 4748LL 0 -0.87075 0.80317 -0.01543 0.9687
280 -0.19424 0.70325 -0.03349 0.9630
560 -0.60393 0.75618 -0.01974 0.9904
840 -0.23666 0.65955 -0.03206 0.9685
1120 -0.00514 2.69481 -0.06678 0.9648
CDZ 4540LL 0 0.03657 0.05471 0.03657 0.9819
280 -0.18700 -0.07706 -0.13967 0.9601
560 0.68475 -0.03851 0.06702 0.9516
840 0.00600 -1.05736 -0.07652 0.8927
1120 0.05924 -0.00061 -0.15748 0.9721
Soybean volume
CDZ 4818LL 0 -665.87747 0.741865 -0.04661 0.9166
280 -534.52187 0.702471 -0.05241 0.9352
560 -939.56833 0.6563 -0.04334 0.9321
840 -352.64547 0.853965 -0.05486 0.8945
1120 -847.66128 0.629467 -0.0457 0.9403
CDZ 4748LL 0 -746.82764 0.746294 -0.04379 0.9087
280 -1631.9397 0.702627 -0.03182 0.9201
560 -1071.1672 0.67513 -0.03989 0.9453
840 -1368.6025 0.61578 -0.03719 0.9075
1120 -619.41564 0.729439 -0.04425 0.9013
CDZ 4540LL 0 -559.74695 0.786829 -0.04637 0.9336
280 -809.76023 0.769881 -0.04169 0.9248

47
Table 4 continued. Mechanistic growth curve ((y = a (1 – b * EXP (-c*days)), a =
asymptote, b = scale, c = growth rate) fit to soybean groundcover and volume data from
2017 and 2018; R2 values displays the percentage of variability explained by the fit of the
line.
Parameters
Response Variable Variety
Metribuzin rate Asymptote Scale
Growth rate R2
g ai ha-1
Soybean volume
CDZ 4540LL 560 -1064.3915 0.702538 -0.03775 0.8874
840 -489.86499 0.696181 -0.0496 0.9224
1120 -829.19145 0.740144 -0.0395 0.8674

48
Table 5. Number of days required after metribuzin application for soybean to reach 1000, 2000, 4000, and 6000 cm3 based on
inverse predictions using the mechanistic growth curve fit to soybean volume data averaged over two site years.
Soybean volume
CDZ 4748LL (sensitve) CDZ 4818LL (moderatly tolerant) CDZ 4540LL (tolerant)
Soybean volume Rate Predicteda
Confidence limitsb Predicted
Confidence limits Predicted
Confidence limits
cm3 g ai ha-1 -----------------------------------------------------------days-------------------------------------------------------
1000 0 26 22, 30 26 22, 30 27 23, 31
280 26 23, 30 27 23, 31 26 21, 30
560 26 23, 30 26 22, 30 27 23, 31
840 28 25, 31 27 23, 32 30 26, 33
1120 29 25, 33 27 23, 31 28 24, 32
2000 0 36 34, 39 36 34, 39 38 35, 41
280 36 34, 39 36 34, 39 36 34, 39
560 36 34, 39 36 33, 39 37 35, 40
840 37 35, 40 37 35, 40 40 37, 43
1120 40 37, 42 37 34, 39 39 36, 42
4000 0 49 47, 51 48 46, 50 50 49, 52
280 50 48, 52 48 46, 49 49 47, 51
560 49 47, 51 48, 52 51, 54
48 46, 50 51 49, 52
840 50 49 47, 50 52 50, 54
1120 53 48 46, 50 52 50, 54
6000 0 57 56, 58 56 55, 57 58 57, 59
280 60 58, 61 55 53, 56 57 56, 59

49
Table 5. Number of days required after metribuzin application for soybean to reach 1000, 2000, 4000, and 6000 cm3 based
on inverse predictions using the mechanistic growth curve fit to soybean volume data averaged over two site years.
Soybean volume
CDZ 4748LL (sensitve) CDZ 4818LL (moderatly tolerant) CDZ 4540LL (tolerant)
Soybean volume Rate Predicteda
Confidence limitsb Predicted
Confidence limits Predicted
Confidence limits
6000 560 57 56, 58 56 55, 57 59 58, 61
840 58 57, 60 56 54, 57 59 58, 61
1120 61 59, 62*c 56 55, 57 61 59, 63 a The number of days after an application of metribuzin it took for soybean to reach the chosen soybean volume b The 95% confidence interval of the mean number of days for soybean to reach the chosen soybean volume
c Asterisk (*) indicates significant difference between the nontreated and treated plots based on 95% confidence intervals.

50
Table 6. Number of days required after herbicide application for soybean to reach 20, 40, 60, 80, and 95% groundcover based on
inverse predictions using the mechanistic growth curve fit to percent groundcover data.
Soybean varieties
CDZ 4748LL (sensitive)
CDZ 4818LL (moderately tolerant) CDZ 4540LL (tolerant)
Groundcover Rate Predicteda Confidence
limitsb Predicted Confidence
limits Predicted Confidence limits
% g ai ha-1 20 0 28 25, 30 27 25, 30 41 36, 47
280 32 28, 35 27 25, 30 33 29, 37
560 29 26, 31 29 26, 31 46 39, 53
840 32 29, 35 31 28, 34 45 39, 50
1120 40 36, 44 *c 29 26, 32 52 43, 62
40 0 39 36, 42 40 37, 42 52 48, 55
280 44 41, 47 39 36, 41 45 41, 49
560 40 37, 43 40 38, 43 55 51, 59
840 44 41, 47 43 40, 46 54 50, 57
1120 51 48, 53 * 42 39, 45 58 53, 63
60 0 48 46, 51 49 47, 52 57 55, 59
280 53 50, 55 48 46, 51 53 50, 56
560 49 47, 52 50 47, 52 59 57, 61
840 52 50, 55 52 49, 54 59 57, 61
1120 57 55, 58 * 51 48, 53 61 59, 63
80 0 56 54, 58 57 55, 59 61 60, 62
280 59 58, 61 57 55, 59 59 57, 61
560 57 55, 59 57 56, 59 62 61, 63
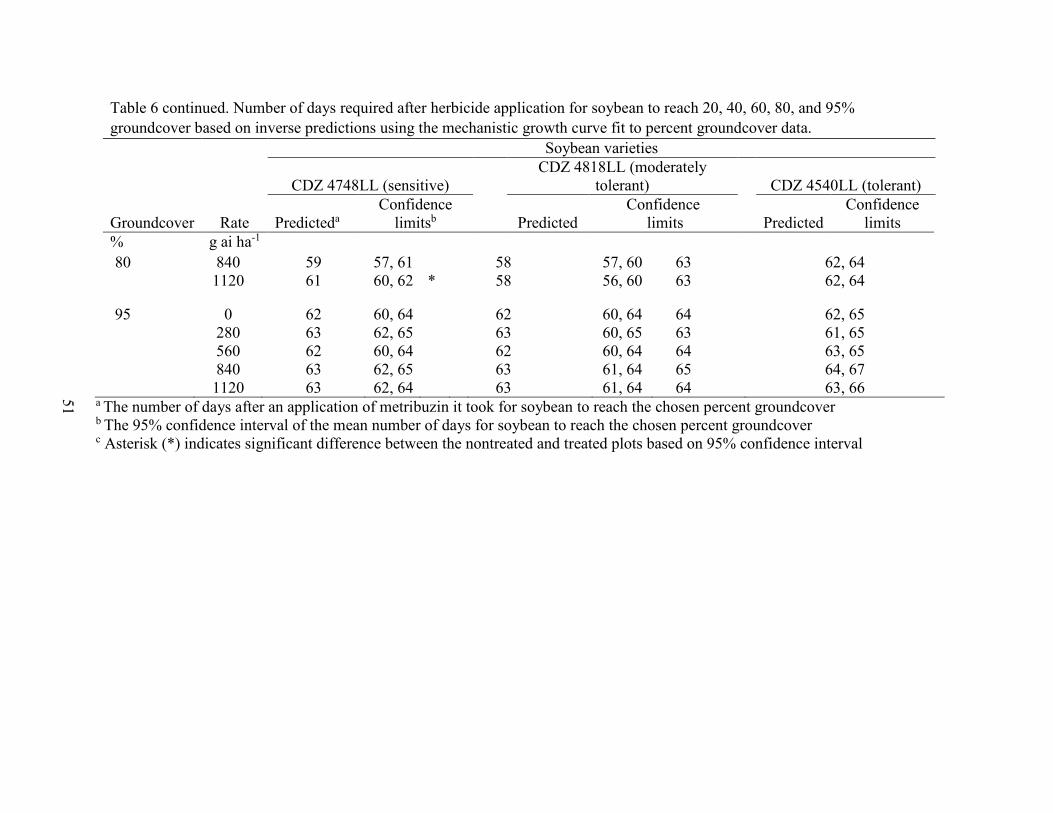
51
Table 6 continued. Number of days required after herbicide application for soybean to reach 20, 40, 60, 80, and 95%
groundcover based on inverse predictions using the mechanistic growth curve fit to percent groundcover data.
Soybean varieties
CDZ 4748LL (sensitive)
CDZ 4818LL (moderately tolerant) CDZ 4540LL (tolerant)
Groundcover Rate Predicteda Confidence
limitsb Predicted Confidence
limits Predicted Confidence
limits
% g ai ha-1
80 840 59 57, 61 58 57, 60 63 62, 64
1120 61 60, 62 * 58 56, 60 63 62, 64
95 0 62 60, 64 62 60, 64 64 62, 65
280 63 62, 65 63 60, 65 63 61, 65
560 62 60, 64 62 60, 64 64 63, 65
840 63 62, 65 63 61, 64 65 64, 67 1120 63 62, 64 63 61, 64 64 63, 66
a The number of days after an application of metribuzin it took for soybean to reach the chosen percent groundcover b The 95% confidence interval of the mean number of days for soybean to reach the chosen percent groundcover c Asterisk (*) indicates significant difference between the nontreated and treated plots based on 95% confidence interval

52
Table 7. Relative soybean yield displaying the significant main effect of variety,
averaged across metribuzin rates.
a Soybean yield displayed above is relative to nontreated of the same variety within year. The
nontreated of CDZ 4540LL, CDZ 4818LL and CDZ 4748LL yielded 2,750, 2,750, and 3,620 kg
ha-1, respectively in 2017 and in 2018 yielded 3,050, 3,080, and 3,570 kg ha-1, respectively. b Means not represented with like letters are statically different within columns based on
Fisher’s protected LSD (P=0.05).
Relative soybean yielda
Variety 2017 2018
------------------%------------------
CDZ 4540LL (tolerant) 101 aa 98 a
CDZ 4818LL (moderately tolerant) 101 a 97 a
CDZ 4748LL (sensitive) 98 b 79 b

53
a Abbreviation: na, not applicable, due to the pathogen not being observed in that site year
Table 8. The effects of variety, metribuzin rate, and variety by metribuzin rate interaction on the incidence of soybean root colonization by soil-borne pathogens in 2017 and 2018.
Factors by site year 2017
2018
Pathogens Variety Metribuzin rate Variety X
metribuzin rate Variety Metribuzin rate Variety X
metribuzin rate -----------------------------------------------------p-values-------------------------------------------------------
Acrophialophora 0.3695 0.5682 0.6262
na na na
Colletotrichum 0.7889 0.5382 0.9771
na na na
Didymella naa na na
0.3327 0.2459 0.5877
Fusarium na na na
0.9953 0.4798 0.9953
Pythium 0.8519 0.5558 0.9418
0.9312 0.7537 0.2104
Macrophomina 0.1686 0.7267 0.4596
0.7633 0.4584 0.6144
Phomopsis na na na
0.3811 0.3811 0.9071
Rhizoctonia 0.5193 0.8937 0.4019
0.5559 0.1847 0.6658
Rhizopus 0.1025 0.1958 0.4349
na na na
Trichoderma 0.3996 0.8138 0.4631
na na na
Total 0.2988 0.7666 0.6373
0.7881 0.3914 0.7881

54
CHAPTER 3
Flumioxazin Effects on Soybean Canopy Formation and Soil-borne Pathogen Presence
ABSTRACT
Rapid crop canopy formation is important to reduce weed emergence and, in turn,
selection for herbicide resistance. Field experiments were conducted in 2017 and 2018 in
Fayetteville, AR, to evaluate the impacts of preemergence applications of flumioxazin on
soybean injury, soybean density, canopy formation, and incidence of soil-borne pathogens.
Flumioxazin was applied at 0, 70, and 105 g ai ha-1 to predetermined flumioxazin-tolerant and -
sensitive soybean varieties. Flumioxazin at 70 g ha-1 injured the tolerant and sensitive varieties
from 0 to 4% and 14 to 15%, respectively. When averaged over flumioxazin rates, density of the
sensitive variety was only reduced in 2017 when activation of flumioxazin was delayed seven
days. Flumioxazin at 70 g ha-1 delayed the sensitive variety from reaching 20, 40, 60, and 80%
groundcover by 15, 16, 11, and 5 days, respectively. The tolerant variety suffered no delay in the
number of days to achieve any of these levels of groundcover. No delay in canopy closure (95%
groundcover) was seen with either variety. Consequently, no yield loss occurred for either
variety following a flumioxazin application. Flumioxazin did not impact root colonization of
Didymella, Fusarium, Macrophomina, and Rhizoctonia. Pythium colonization of the soybean
stem was increased by flumioxazin in 2017, but not in 2018. Because of the occurrence of
protoporphyrinogen oxidase-resistant Amaranthus spp., increased injury, delays in percent
groundcover, and an increase in Pythium colonization of soybean following a flumioxazin
application may warrant the need for other soil-applied herbicides at soybean planting.
Alternatively, soybean injury and delays in percent groundcover following flumioxazin
55
applications can be mitigated through appropriate variety selection; however, comprehensive
screening is needed to determine which varieties are most tolerant to flumioxazin.
Nomenclature: flumioxazin; Didymella, Fusarium, Macrophomina, Pythium, Rhizoctonia,
soybean, Glycine max (L.) Merr.
Keywords: Canopy formation, groundcover, sensitive, tolerant, variety

56
INTRODUCTION
Flumioxazin is a Group 14 protoporphyrinogen oxidase-(PPO) inhibiting herbicide that is
used in soybean production as a preplant or preemergence option for control of small-seeded
broadleaves and annual grasses (; Talbert et al. 1990; Taylor-Lovell et al. 2001; 2002; Yoshida et
al. 1991). PPO-inhibiting herbicides were used extensively to control Amaranthus ssp. before the
release of glyphosate-resistant crops (Norsworthy et al. 2012). Following the evolution of
glyphosate-resistant Amaranthus ssp. the use of PPO-inhibiting herbicides increased
(Norsworthy et al. 2012). In 2015, Salas et al. (2016) documented PPO-resistant Palmer
amaranth [Amaranthus palmeri (S.) Wats.] biotypes in Arkansas. Since the discovery, PPO-
resistance has been confirmed in seven states (Heap 2019; Varanasi et al. 2018). The evolution
and spread of PPO-resistant Palmer amaranth has called into question the utility and importance
of these herbicides for weed control in soybean.
Historically, flumioxazin has been used in the Midsouth over sulfentrazone, another
PPO-inhibiting herbicide, because of lower risk for injury to soybean (Taylor-Lovell et al. 2001).
The gene controlling soybean tolerance to sulfentrazone has been determined and was once
screened for in most commercialized soybean varieties (Swantek et al. 1998). It has been
suggested that flumioxazin and sulfentrazone tolerances in soybean are closely linked but not
synonymous; nonetheless, more research is needed to determine the mechanism of soybean
tolerance to flumioxazin (Taylor-Lovell et al. 2002). Therefore, current commercialized soybean
varieties have not been screened for flumioxazin tolerance resulting in uncertainty as to the risk
for injury from the herbicide. Two factors that contribute to flumioxazin injury to soybean are
varietal sensitivity and the splashing of herbicide onto emerged seedlings. The latter may be
more severe when a suspected sensitive variety is grown (Yoshida et al. 1991). Although

57
herbicide injury at high levels can reduce yields (Kapusta et al. 1986), herbicide induced injury
may have alternative effects on soybean production such as delaying canopy formation (Nelson
and Renner 2001) and increasing incidence of soil-borne pathogens infecting the seedling plants
(Dann et al. 1999).
There is not a good understanding of the adverse effects that flumioxazin-induced
herbicide injury may have on soybean canopy formation. Soybean canopy formation or light
interception by the crop can be measured using digital imagery (Purcell 2000). Light interception
of 95% or greater is considered full canopy closure (Board et al. 1992; Gardner et al. 1985;
Harder et al. 2007; Purcell 2000). An increase in soybean population or spatial distribution of
soybean increases light interception, promoting early canopy formation (Bertram and Pederson
2004; Harder et al. 2007). Crop canopy development in turn affects weed emergence (Burnside
and Moomaw 1977; Chandler et al. 2001; Dalley et al. 2004; Harder et al. 2007; Légère and
Schreiber 1989; Nelson and Renner 1997; Nice et al. 2001; Young et al. 2001). An increase in
canopy formation decreases weed seed germination by decreasing soil temperature and light
quantity and quality that reaches the soil surface (Harder et al. 2007; Jha and Norsworthy 2009;
Yelverton and Coble 1991). Changes in crop canopy formation have the potential to impact weed
emergence and disease presence by altering environmental conditions surrounding the crop (Jha
and Norsworthy 2008; Levene et al. 1998).
PPO-inhibiting herbicides have been shown in the past to affect pathogen presence and
disease severity (Dann et al. 1999; Levene et al. 1998; Sanogo et al. 2001). Lactofen, a PPO-
inhibiting herbicide, has been found to reduce soybean stem rot [Sclerotinia sclerotiorum (Lib.)
de Bary] severity by 40 to 60% (Dann et al. 1999). There was a high level of glyceollin found in
soybean leaves treated with lactofen. It is believed that an increase in glyceollin production

58
caused by lactofen injury to soybean is responsible for the control of soybean stem rot (Dann et
al. 1999).
Another PPO-inhibiting herbicide, acifluorfen, elicits an increase of glyceollin in
soybean, resulting in a decline of soybean cyst nematode egg production by 50 to 60% (Levene
et al. 1998). This type of interaction between herbicide and pest is considered an indirect
response (Duke et al. 2007). An indirect response is when the herbicide causes a physiological
change within the plant that increases tolerance or changes the environment to the point it is
unsuitable for the disease.
Flumioxazin and sulfentrazone have the ability to reduce root colonization of root rot
(Pythium arrhenomanes). Flumioxazin has been shown to reduce mycelium growth in vitro of
Pythium arrhenomanes and Pythium aphanidermatum (Daugrious et al. 2005). This type of
interaction is described as a direct response of a herbicide on pathogens (Duke et al. 2007). A
direct relationship between herbicide and disease is defined as the ability of the herbicide to
inhibit growth and reproduction by the compound itself. Herbicide and disease interactions are
complex, requiring the need for additional studies to truly understand the possible underlying
benefits or negative impacts on a cropping system. An area of study that is not thoroughly
researched is how early-season flumioxazin-induced injury to soybean affects the crop, including
incidence of soil-borne pathogens. Hence, the objective of this research was to determine if
flumioxazin resulted in delays in soybean canopy development and impacted the incidence of
soil-borne pathogens.
MATERIALS AND METHODS
Field experiments were conducted in 2017 and 2018 at the University of Arkansas-
Agricultural Research and Extension Center, Fayetteville, AR. The experiments in Fayetteville,

59
AR were initiated on June 15, 2017 and May 11, 2018 on a soil series composed of a Leaf silt
loam (Fine, mixed, active, thermic Typic, Albaquults) with 31% sand, 50% silt, 18% clay, 1.4%
organic matter, and pH of 6.5 and 6.0, respectively. In both years, the fields were prepared prior
to planting by disking and hipping beds that were 91 cm wide. The plot size was 7.6 m long and
3.6 m wide. The experiment was conducted in adjacent field sites each year. Trials were planted
in fields where soybean was grown the previous year to increase the likelihood that soil-borne
pathogens were present (Frans and Talbert 1977).
The experiment was designed as a two-factor factorial randomized complete block design
with four replications. The two factors were soybean variety (two varieties) and flumioxazin
(three rates) (Valor 51WG, Valent USA, Walnut Creek, CA, 94596) rate (0, 70, 105 g ai ha-1). A
greenhouse screening was conducted prior to field experimentation to categorize soybean
varieties as sensitive or tolerant to flumioxazin. The tolerant variety that was selected was
Credenz 4818LL and the sensitive variety was Credenz 4748LL (Bayer CropScience, Triangle
Park, North Carolina, 27709). Seed treatments were applied to simulate practices commonly
used in soybean production. Both varieties of soybean were treated with commercial seed
treatments PONCHO®/VOTiVO® which contains 40.3% clothianidin, 8.1% Bacillus firmus I-
1582, ILeVO® which contain 48.4% of fluopyram, and REDIGO® 480 which contains 41%
prothioconazole and 28.35% metalaxyl also commonly known as ALLEGIANCE® -FL. Soybean
is commonly categorized into medium, medium bushy, and bushy to correctly describe growing
characteristics of varieties. CDZ 4748LL is considered a medium bushy and CDZ 4818LL would
be considered bushy. Soybean varieties tested were indeterminate. Soybean varieties were
seeded at 346,000 seed ha-1 at a 2.2-cm depth. The experiments in 2017 and 2018 were kept
weed free with glufosinate, S-metolachlor, and hand-weeding. Visual estimates of soybean injury

60
to flumioxazin were rated 21 days after planting (DAP) on a scale of 0 to 100%, with 0 being no
crop injury and 100% being crop death.
To determine soybean canopy formation over time, photos were taken weekly after
planting until soybean reached canopy closure with an unmanned aerial vehicle (DJI Phantom 4
Pro equipped with a 1080p gimbal mounted camera, Shenzhen, China, 518057). Pictures were
taken of the whole trial and were divided into plots using the software program Field Analyzer
(https://www.turfanalyzer.com/). Field analyzer produced a proportion of green pixels for the
center two rows within the four-row treated plot; therefore, an accurate representation of percent
groundcover could be calculated (Purcell 2000). Canopy height and width of five soybean plants
in the center two rows of each plot were also recorded on a weekly basis. The measurements
were then averaged by plot, and soybean volume was calculated using the following equation
(� × ���� ℎ ��ℎ)(���� � �ℎ ÷ 2)2 (Norsworthy 2004). Soybean grain yield was
determined following physiological maturity by harvesting the center two rows in each plot
using a small-plot combine and then adjusting moisture to 13%.
When soybean reached V1 in the nontreated plots, ten plants were sampled from the
outside two rows of the plots that received flumioxazin at 107 g ha-1 and from nontreated plots.
These plants were dug from the plots, with roots remaining intact, and placed in sterile plastic
bags. All samples were placed in a cooler and immediately transported to the laboratory.
Individual plants were cut 1.5 cm below and above the soil line, keeping the portion of the
soybean plant that contained the soil line. The samples remained grouped by plot and were
washed with running water for 20 minutes. Samples were then soaked in a 6% 87.5 ml L-1 bleach
dilution for 30 seconds. Soybean stems were then placed in 100-mm-diameter petri dishes
containing agar (part number, 97064-336, VWR International, Arlington Heights, IL 60004) for

61
3 to 4 days. One sample of hyphal growth that differed in morphological characteristics within a
petri dish was selected and transferred by removal using a flame sterilized scalpel to petri dishes
containing an amended potato dextrose agar medium PDArad (18 g Difco potato dextrose agar,
10 and 250 mg of the antibiotics rifampicin and ampicillin, respectively) and the miticide
fenpropathrin (0.14 mg ai L-1) (Danitol 2.4 EC, Valent Chemical Co. Mahomet, IL 59639-117).
Isolates of similar morphological characteristics were grouped together seven to eight days after
the transfers were made. The number of isolates per group was recorded. Isolates of the same
group were randomly selected and sent for DNA analysis at the University of Arkansas Plant
Pathology laboratory in Monticello, AR.
Pure cultures of fungi and oomycete isolates were obtained and transferred to the
Monticello laboratory, using the method described previously. Representative pure cultures of
fungi and oomycete were arbitrarily selected from each group for DNA analysis.
Deoxyribonucleic acid was collected from pure cultures by scraping 0.25-0.5 ml of mycelia and
spores from the tops of colonies using a sterile scalpel blade. Mycelia and spores were placed
into a microfuge tube, where 500µL 0.9% (w/v) NaCl prepared with sterile distilled water was
added. Genomic DNA extractions were obtained by using a Norgen Biotek Genomic DNA
Purification kit (Kit # 27300, Norgen Biotek Corp., Ontario, Canada L2V 4Y6). Polymerase
chain reaction was achieved by following the GoTaq Green Master Mix 2X (Promega,Corp.,
Madison, WI 53711) using a 25µL reaction and following the accompanying amplification
guidelines. Primers used in reactions were internal transcribed spacer (ITS) 4 (reverse) and ITS-5
(forward) (ThermoFisher Scientific, Waltham, MA 02454). Confirmation of amplification was
determined by gel electrophoresis, followed by soaking in GelRed (Biotium, Freemont, CA
94538) nucleic acid stain for 20 minutes, and viewing the gel on a UV light box. Digestion of

62
excess nucleotides was achieved by using the ExoSAP-IT protocol (Catolog number 78201,
ThermoFisher Scientific, Waltham, MA 02454). Quantification of DNA concentrations were
achieved by using a micro-volume spectrophotometer (SimpliNano, GE Health Care Life
Sciences, Logan, UT 84321). Samples were sent pre-mixed to Eurofins Genomics (Louisville,
KY 40299) for sequencing in accordance with their protocol. Sequences were trimmed, aligned
using ClustalW in Bio-Edit (version 7.0.5, Ibis Therapeutics, Carlsbad, CA 92008), and
identified using the nucleotide basic local alignment search tool in GenBank (BLASTn, NCBI,
Bethesda, MD 20892).
Statistical Analysis. Data collected for soybean volume and percent groundcover were analyzed
similarly. Data were regressed in the Fit Curve platform of JMP 14.1 (SAS Institute Inc., SAS
Campus Drive, Cary, North Carolina 27513). A mechanistic curve (y = a (1 – b * EXP (-
c*days)) where a = asymptote, b = scale, and c = growth was fit to the soybean volume and
percent groundcover data by days after planting in a similar manner to that used in other research
(Gillespie et al. 1994). Parameters to fit the mechanistic growth curves are found in Table 1.
From the mechanistic curves, inverse predictions of the days until soybean achieved 20, 40, 60,
80, 95% and 1000, 3000, 5000 cm3 were predicted for percent groundcover and soybean volume,
respectively. The 95% confidence interval for the mean of the inverse prediction was used to
differentiate herbicide treatment and variety effects.
The percent injury data, collected 21 DAP, were not normally distributed; therefore,
injury data were subjected to log transformation, determined by the lambda value of a box cox
test (Box and Cox 1964). The log transformed injury data had an insignificant p-value when
subjected to a Shapiro-Wilk test; therefore, meeting the normality assumptions of analysis of
variance (ANOVA) in the Fit Model platform of JMP 14.1. Soybean density, pathogen isolates,

63
and yield data relative to the nontreated of the same variety passed all assumptions of ANOVA.
Site years were analyzed separately due to differences in timing of activating rainfalls. Means
were separated using a Fisher’s protected LSD with an alpha value of 0.05. P-values for each
ANOVA are displayed in Table 2.
RESULTS AND DISCUSSION
Soybean Injury. In general, injury levels in 2017 were higher than 2018 likely because of the 7-
day delay in herbicide activation versus the 4-day delay in the second year. In both site years, a
significant interaction between variety and flumioxazin rate was observed (P<0.0001 and
P=0.0002 in 2017 and 2018, respectively) (Table 2). In both site years, the sensitive variety CDZ
4748LL suffered greater injury from flumioxazin than the tolerant CDZ 4818LL (Table 3),
further validating that soybean has differing levels of flumioxazin tolerance as hypothesized by
Taylor-Lovell et al. (2001). The sensitive and tolerant soybean varieties displayed 14 to 15% and
0 to 4% visible injury, respectively, due to an application of flumioxazin at 70 g ha-1. Injury
increased as flumioxazin rate increased. Flumioxazin applied at 105 g ha-1 to the sensitive and
tolerant varieties caused 21 to 30% and 4 to 8% visible injury, respectively, at 21 DAP. The
difference in variety tolerance impacted the injury level observed. The delay in activation in both
site years increased the chance for herbicide injury to soybean to occur. Yoshida et al. (1991)
concluded that a delay in activation allows for soybean to emerge prior to the herbicide
infiltrating the soil surface, resulting in a splashing of herbicide onto emerged soybean when
subsequent rainfall occurs. A delay in herbicide activation may be key in determining variety
tolerance of soybean to flumioxazin at labeled field use rates. Through knowledge of variety
sensitivity to flumioxazin, injury to soybean may be mitigated when activation of the herbicide is
delayed.

64
Soybean Density. Soybean density was not affected by the interaction of flumioxazin rate by
variety in 2017 or 2018 (P=0.8223 and P=0.4529, respectively) (Table 2). However, the only
significant main effect was variety in 2017 (P=0.0046). In 2017, there was a 19% reduction in
density of the sensitive soybean variety compared to the nontreated, averaged over flumioxazin
rates (Table 4). The tolerant variety showed no reduction in density caused by applications of
flumioxazin in either site year (Table 4). In 2018, soybean was planted and then went four days
without an activating rainfall. Soybean seedlings had not yet emerged at the time of herbicide
activation, eliminating the effect of herbicide splash onto soybean as a possible mechanism of
stand reduction. Yoshida et al. (1991) observed that a delay in flumioxazin activation until after
soybean emergence increased the splashing of herbicide onto cotyledons, resulting in an increase
in crop injury. The lack of emerged plants in 2018 compared to the already emerged plants in
2017 at the time of flumioxazin activation explains why the sensitive soybean variety density
decreased in 2017 but not in 2018 in plots treated with the herbicide.
Soybean Volume. There was no statistical delay in the number of days soybean required to
reach the selected soybean volumes in both the sensitive and tolerant varieties (Figure 1; Table
5). Soybean has the ability to increase branching when soybean population per area is reduced
(Shibles and Weber 1965), which may explain the lack of effect on soybean volume in 2017 for
the sensitive variety. Also, measuring only 5 plants per plot may have made it difficult to detect
subtle differences in canopy volume between treatments.
Percent Groundcover. In the two site years within this study, early-season groundcover of the
sensitive soybean was delayed by a flumioxazin application (Figure 2; Table 6). An application
of flumioxazin at 70 g ai ha-1 increased the number of days required for sensitive soybean to
reach 20, 40, 60, and 80% groundcover by 15, 16, 11, and 5 days, respectively. No significant

65
delays of the tolerant variety were observed following flumioxazin at 70 or 105 g ha-1.
Additionally, no delays were observed in the number of days it took the sensitive or tolerant
varieties to achieve 95% groundcover at either flumioxazin rate. From these data, it can be
concluded flumioxazin applied to either a sensitive or tolerant variety will not delay canopy
closure; however, canopy formation will likely be delayed when flumioxazin is applied to a
sensitive variety resulting in the potential in increased weed emergence from planting to full
canopy closure. Similarly, Nelson and Renner (2001) observed soybean injury following a
postemergence herbicide application delayed leaf area index, soybean growth, and development.
A delay in soybean canopy formation is undesirable, as it may lead to an increase in weed
emergence (Jha and Norsworthy 2008). In turn, this rise in weed emergence increases selection
for herbicide resistance (Norsworthy et al. 2012).
Soybean Yield. The interaction of variety by flumioxazin rate was not significant in 2017 or
2018 (P=0.3293 and P=0.3856, respectively) (Table 2). Likewise, the main effects in 2017 and
2018 of soybean variety (P=0.3388 and P=0.3284, respectively) and flumioxazin rate (P=0.9052
and P=0.9452, respectively) did not impact soybean yield (Table 2). Similarly, Taylor-Lovell et
al. (2001) did not observe yield loss in 15 soybean varieties treated with flumioxazin at 105 g ha-
1, even when 59% injury was observed soon after emergence.
Pathogen Response. In 2018, soybean root colonization of pathogens was not affected by an
application of flumioxazin at either rate. Macrophomina, a possible causal agent of charcoal rot
in soybean (Khan 2007), was found to be influenced by variety selection in both 2017 and 2018
(P=0.0132 and P=0.0196, respectively) (Table 7). Thus, soybean varietal tolerance to
Macrophomina colonization may be present as noted by others previously (Pearson et al. 1984).
In 2017, both varietal selection and flumioxazin rate impacted the degree at which Pythium

66
colonized the stem of soybean. Pythium is the causal agent for root rot in soybean (Hendrix and
Campbell 1973). The flumioxazin-tolerant soybean variety (CDZ 4818LL) had an average of
0.67 isolates of Pythium per ten soybean plants, and the sensitive variety had 1.77 isolates per ten
plants (data not shown). Flumioxazin increased the likelihood of Pythium colonizing the stems of
soybean. The nontreated averaged 0.46 isolates of Pythium per ten plants while isolates found in
plots treated with flumioxazin increased to an average number of isolates of 1.94 per ten plants
(data not shown). The increase of Pythium is contrary to in-vitro studies that showed that
flumioxazin has a direct effect on reducing mycelium growth of Pythium (Daugrious et al. 2005).
It is hypothesized that the splashing of flumioxazin on to soybean stems near the soil line
results in necrotic wounds allowing for an increase in Pythium colonization. Soybean injury from
flumioxazin also resulted in delays in growth, as seen in the percent groundcover data (Table 5).
Delays in growth caused by environmental stresses can contribute to an increase in root rot
severity (Kirkpatrick et al. 2006). Therefore, it may be possible that the delay in soybean growth
resulting from flumioxazin induced injury also contributed to an increase in Pythium
colonization.
Conclusions and Practical Implications. Preemergence flumioxazin injury had season-long
effects on the growth of a sensitive soybean variety, and full recovery was never achieved until
soybean approached canopy closure. While the herbicide injury to soybean did not impact yield,
other monetary and cultural aspects may be directly affected. By delaying canopy formation of
the sensitive variety 15 days, a proportion of weed seeds will be exposed to environmental
conditions conducive for emergence, thus potentially increasing the need for additional weed
control measures. Increased weed emergence through reducing crop competitiveness via

67
herbicide-induced injury to soybean places added selection for herbicide resistance on
postemergence herbicides.
Flumioxazin injury to soybean can be mitigated through tolerant varietal selection;
however, large-scale flumioxazin variety screening is needed to make this practical. Soybean
root colonization of Didymella, Fusarium, Macrophomina, and Rhizoctonia were not affected by
an application of flumioxazin, but Pythium colonization of soybean roots was increased when
flumioxazin was applied in one of two years. The necrotic wounding following a delayed
activation of flumioxazin, as seen in 2017, may lead to an increase in Pythium colonization. For
soybean varieties that have sensitivity to flumioxazin, the risk for crop injury, delayed canopy
formation, and increased disease incidence likely outweighs any weed control benefit from the
herbicide, especially in areas infested with PPO-resistant Amaranthus spp.

68
LITERATURE CITED
Bertram MG, Pedersen P (2004) Adjusting management practices using glyphosate-resistant soybean varieties. Agron J 96:462-468
Board JE, Karmal M, Harville BG (1992) Temporal importance of greater light interception to increased yield in narrow-row soybean. Agron J 84:575–579
Box GEP, Cox DR (1964) Analysis of transformations. Journal of the Royal Statistical Society. Series B (Methodological) 26:211-252
Burnside OC, Moomaw RS (1977) Control of weed in narrow-row soybeans. Agron J 69:793-796
Chandler K, Shrestha A, Swanton CJ (2001) Weed seed return as influenced by the critical weed-free period and row spacing of no-till glyphosate-resistant soybean. Plant Sci 81:877-672
Dalley CD, Kells JJ, Renner KA (2004) Effect of glyphosate application timing and row spacing on corn (Zea mays) and soybean (Glycine max) yields. Weed Technol 18:165-176
Dann EK, Diers BW, Hammerschmidt R (1999) Suppression of Sclerotina stem rot of soybean by lactofen herbicide treatment. Phytopathology 89:598–602
Daugrois, JH, Hoy JW, Griffin JL (2005) Protoporphyrinogen oxidase inhibitor herbicide effects on Pythium root rot of sugarcane, Pythium species, and the soil microbial community. Phytopathol 95:220–226
Duke SO, Wedge DE, Cerdeira AL, Matallo MB (2007) Herbicide effects on plant disease.
Outlooks Pest Manag 18:36–40
Frans RE, Talbert RE, (1977) Design of field experiments and the measurement and analysis of plant responses B. Truelove, Research Methods in Weed Science, Southern Weed Science Society, Auburn, TX, pp. 15-23
Gardner FP, Pearce RB, Mitchell RL (1985) Physiology of Crop Plants. Ames, Iowa: Iowa State Press Pp 31-56
Gillespie AR, Allen HL, Vose JM (1994) Amount and vertical distribution of foliage of young loblolly pine trees as affected by canopy position and silvicultural treatment. Can J For Res 24:1337-1344
Harder DB, Sprague CL, Renner KA (2007) Effect of soybean row width and population on weeds, crop yield, and economic return. Weed Technol 21:744-752

69
Heap IM (2019). The International Survey of Herbicide Resistant Weeds.
http://www.weedscience.com Accessed January 2, 2019
Hendrix FF, Campbell WA (1973) Pythium as plant pathogens. Annu Rev Phythopathol 11:77-98
Jha P, Norsworthy JK (2009) Soybean canopy and tillage effects on emergence of Palmer amaranth (Amaranthus palmeri) from a natural seed bank. Weed Sci 57:644-651
Kapusta G, Jackson LA, Mason DS (1986) Yield response of weed-free soybeans (Glycine max) to injury from postemergence broadleaf herbicides. Weed Sci 34:304–307
Khan SK (2007) M. phaseolina as causal agent for charcoal rot of sunflower. Mycopath 5:111-118
Kirkpatrick MT, Rothrock CS, Rupe, JC, Gbur, EE (2006) The effect of Pythium ultimum and soil flooding on two soybean varieties. Plant Dis 90:597-602
Légère A, Schreiber MM (1989) Competition and canopy architecture as affected by soybean (Glycine max) row width and density of redroot pigweed (Amaranthus retroflexus) Weed Sci 37:1029-1038
Levene BC, Owen MDK, Tylka GL (1998) Response of soybean cyst nematodes and soybeans (Glycine max) to herbicides. Weed Sci 46:264–270
Nelson KA, Renner KA (1997) Weed management in wide- and narrow-row glyphosate-resistant soybean. J Prod Agric 12:460-465
Nelson KA, Renner KA (2001) Soybean growth and development as affected by glyphosate and postemergence herbicide tank mixtures. Agron. J. 93:428–434
Nice GR, Buehring NW, Shaw DR (2001) Sicklepod (senna obtusifolia) response to shading, soybean (Glycine max) row spacing, and population in three management systems. Weed Technol 15:155-162
Norsworthy JK (2004) Conventional soybean plant and progeny response to glyphosate. Weed Technol 18:527–531
Norsworthy JK, Ward SM, Shaw DR, Llewellyn R, Nichols RL, Webster TM, Bradley K W, Frisvold G, Powles SB, Burgos NR, Witt W, Barrett M (2012) Reducing the risks of herbicide resistance: Best management practices and recommendations. Weed Sci 60 (Special Issue I):31–62
Pearson CAS, Schwenk FW, Crowe FJ, Kelly K (1984) Colonization of soybean roots by Macrophomina phoseolina. Plant Dis 68:1086-1088.

70
Purcell LC (2000) Soybean canopy coverage and light interception measurement using digital imagery. Crop Sci 40:834–837
Salas RA, Burgos NR, Tranel PJ, Singh S, Glasglow L, Scott RC, Nichols RL (2016) Resistance
to PPO-inhibiting herbicides in Palmer amaranth from Arkansas. Pest Mange Sci 72:864-
869
Sanogo S, Yang XB, Lundeen P (2001) Field response of glyphosate-tolerant soybean to herbicides and sudden death syndrome. Plant Dis 85:773–779
Shibles RM, Weber CR (1965) Leaf area, solar radiation interception and dry matter production by soybeans. Crop Sci 5:575-578
Swantek JM, Sneller CH, Oliver LR (1998) Evaluation of soybean injury from sulfentrazone and inheritance of tolerance. Weed Sci 46:271–277
Talbert RE, Oliver LR, Fans RE, Johnson DH, Wichert RA, Kendig JA, Ruff DF, McCarty JT (1990) Field screening of new chemicals for herbicidal activity. 1989 Res Series Arkansas Agric Exp Sta 395:22
Taylor-Lovell S, Wax LM, Bollero G (2002) Preemergence flumioxazin and pendimethalin and post emergence herbicide systems for soybean (Glycine max). Weed Technol 16:502-511
Taylor-Lovell S, Wax LM, Nelson R (2001) Phytotoxic response and yield of soybean (Glycine
max) varieties treated with sulfentrazone or flumioxazin. Weed Technol 15:95-102
Varanasi VK, Brabham C, Norsworthy JK, Nie H, Young BG, Houston M, Barber T, Scott, RC (2018) A statewide survey of PPO-inhibitor resistance and the prevalent target-site mechanism in Palmer amaranth (Amaranthus palmeri) accessions from Arkansas. Weed Sci 66:149–158
Yelverton FH, Coble HD (1991) Narrow row spacing and canopy formation reduces weed resurgence in soybean (Glycine max). Weed Sci 25:73-78
Yoshida RM, Sakaki R, Sato T, Hada E, Nagano H, Oshio, Kamoshita K (1991) A new N-phenyl phthalimide herbicide. Crop Prot 1:69-75
Young BG, Young GM, Gonzini LC, Hart SE, Wax LM, Kapusta G (2001) Weed management in narrow- and wide-row glyphosate-resistant soybean (Glycine max). Weed Technol 15:112-121

71
APPENDIX
Table 1. Parameters of the mechanistic growth curve (y = a (1 – b * EXP (-c*days)) where a
= asymptote, b = scale, and c = growth, fit to groundcover and soybean volume data from
2017 and 2018; R2 values are present to display the percentage of variability explained by
the line fit.
Parameters Response variable Variety
Flumioxazin rate Asymptote Scale
Growth rate R2
g ai ha-1
Soybean groundcover CDZ 4818LL 0
0.0072 -7.2207 -0.0430 0.9725
70 -0.0249 2.4583 -0.0380 0.8605
105 -0.6617 0.9366 -0.0124 0.8698
CDZ 4748LL 0 -0.0022 19.8330 -0.0441 0.9361
70 -0.3201 0.9177 -0.0220 0.9456
105 -0.3210 0.8254 -0.0238 0.9476
Soybean volume CDZ 4818LL 0
202.7928 -0.1897 -0.1090 0.9245
70 -280.0561 0.4339 -0.0851 0.9357
105 -236.4815 0.3662 -0.0908 0.9257
CDZ 4748LL 0 -146.0814 0.6990 -0.0863 0.9088
70 -175.2448 0.3166 -0.0971 0.9804
105 -397.6464 0.2604 -0.0836 0.9214

72
Table 2. Results of the ANOVA conducted on soybean injury, soybean density, and
relative yield are displayed by p-values of all factors initially tested in the analysis.
Soybean injury Soybean density Soybean yield
Factors 2017 2018 2017 2018 2017 2018
----------------------------- p-values ----------------------------------
Variety <0.0001 <0.0001 0.0046 0.2980 0.3388 0.3284
Flumioxazin rate <0.0001 <0.0001 0.8223 0.8048 0.9052 0.9452
Variety by flumioxazin rate 0.0001 0.0002 0.8223 0.4529 0.3293 0.3856

73
Table 3. Percent visual estimates of injury to soybean 21 days after planting as
influenced by the interaction of flumioxazin rate by varietal tolerance to flumioxazin.
Soybean injury
Variety Flumioxazin rate 2017 2018
g ai ha-1
---------------------%--------------------
CDZ 4818LL 0 0 da 0 d
70 4 cd 0 d
105 8 c 4 c
CDZ 4748LL 0 0 d 0 d
70 15 b 14 b
105 30 a 21 a a Means not represented with like letters are statically different, within columns, based on
Fisher’s protected LSD (P= 0.05).

74
Table 4. Relative soybean density as affected by variety in 2017
and 2018 at Fayetteville, AR.
Soybean density
Variety 2017 2018
-------------% of nontreatedb------------
CDZ 4818LL 106 aa 100 a
CDZ 4748LL 81 b 89 a a Means within a column followed by the same lowercase letter are similar based on Fisher’s protected LSD at (P=0.05). b The nontreated plots of CDZ 4818LL and CDZ 4748LL in 2017 had
soybean densities of 276,640 and 298,870 plants ha-1, respectively and in 2018 had
soybean densities of 266,760 and 251,000 plants ha-1, respectively.

75
Table 5. The number of days predicted for soybean to reach a volume of 1000, 3000, and
5000 cm3. Differences between treatments occur when the 95% confidence intervals of the
mean do not overlap.
Variety Flumioxazin Soybean volume Predicted
Confidence limits
g ai ha-1 cm3 daysa lower, upperb
CDZ 4818LL
0
1000
28
25, 31
70 28 25, 30
105 29 27, 32
0 3000 39 38, 40
70 39 38, 40
105 40 39, 41
0 5000 44 43, 45
70 44 43, 45
105 45 44, 46
CDZ 4748LL 0
1000
28
26, 30
70 31 29, 33
105 31 29, 33
0 3000 40 39, 41
70 42 41, 43
105 42 41, 43
0 5000 45 44, 47
70 47 44, 48
105 47 45, 49 a The number of days for the soybean to reach the predicted soybean volume (cm3) b The 95% confidence interval of the true (population mean) number of days for soybean to reach each predicted soybean volume

76
Table 6. The number of days predicted for soybean treated with flumioxazin at 0,
70, and 105 g ai ha-1 to reach 20, 40, 60, 80, and 95% groundcover.
Variety Flumioxazin Groundcover Predicteda CI of meanb
g ai ha-1 % days lower, upper
CDZ 4818LL 0 20 21 18, 23 70 22 19, 25 ** 105 24 21, 27 ** 0 40 34 31, 37 70 35 32, 38 ** 105 38 35, 41 ** 0 60 47 43, 50 70 48 44, 51 ** 105 50 47, 54 **
0 80 59 56, 63
70 60 56, 63 **
105 61 58, 65 **
0 95 69 64, 73
70 68 64, 72 105 69 65, 73
CDZ 4748LL 0 20 25 22, 28 70 40 34, 46 * ** 105 41 36, 46 * ** 0 40 40 37, 44 70 56 52, 60 * ** 105 55 51, 59 * ** 0 60 53 50, 56 70 64 62, 67 * ** 105 64 61, 66 * **
0 80 65 62, 67
70 70 68, 72 * **
105 69 68, 71 * **
0 95 72 68, 76
70 73 72, 75
105 73 71, 75 a The number of days for soybean to reach the predicted percent groundcover (%) b The 95% confidence limits of the number of days required for soybean to reach the predicted percent groundcover * Designates the confidence limits of a treatment not overlapping with the nontreated of the same variety and groundcover (%). ** Shows significant differences due to non-overlapping confidence intervals of same treatment and same percent groundcover between varieties

77
Table 7. The effects of variety, flumioxazin rate, and the interaction of variety X flumioxazin rate on the incidence of soybean root colonization of soil-borne pathogens.
Pathogen groups
Year Factors Fusarium Pythium Macrophomina Didymella Rhizoctonia Outcast Total ----------------------------------- p-values ---------------------------------------------
2017 Variety 0.6393 0.0413 0.0132 naa 0.7796 0.0778 0.0897
Flumioxazin rate 0.7011 0.0112 0.1134 na 0.6613 0.3305 0.4849
Variety X flumioxazin rate 0.7809 0.0852 0.3593 na 0.6613 0.9897 0.4477
2018 Variety 0.2562 0.1671 0.0196 0.8665 0.5216 0.6279 0.8582
Flumioxazin rate 0.5477 0.1139 0.3027 0.5199 0.5425 0.6312 0.9748
Variety X flumioxazin rate 0.8774 0.8405 0.9344 0.1867 0.4495 0.8991 0.5254
a Abbreviation: na, not applicable.

78
Figure 1. Soybean volume data from 2017 and 2018 fit with a mechanistic growth curve (y = a (1 – b * EXP (-c*days)) where a =
asymptote, b = scale, and c = growth. Inverse prediction were made from the fitted lines giving an accurate representation of the
number of days for soybean volume to achieve 1000, 3000, and 5000 cm3. Parameter estimates of line fit are in Table 1. CDZ 4748LL
and CDZ 4818LL were considered sensitive and tolerant to flumioxazin, respectively.
0
1000
2000
3000
4000
5000
6000
7000
8000
9000
10000
0 10 20 30 40 50 60
So
yb
ea
n v
olu
me
(cm
3)
Days after planting
Soybean volume of tolerant and sensitive varieties
CDZ 4748LL flumioxazin rate: 0 g ai ha-1
CDZ 4748LL flumioxazin rate: 70 g ai ha-1
CDZ 4748LL flumioxazin rate: 105 g ai ha-1
CDZ 4818LL flumioxazin rate: 0 g ai ha-1
CDZ 4818LL flumioxazin rate: 70 g ai ha-1
CDZ 4818LL flumioxazin rate: 105 g ai ha-1
-1
-1
-1
-1
-1
-1

79
Figure 2. Predicted percent groundcover of tolerant (A) and sensitive (B) varieties in 2017 and 2018 were fit with a mechanistic
growth curve (y = a (1 – b * EXP (-c*days)) where a = asymptote, b = scale, and c = growth.
1 9 17 25 33 41 49 57 65 73Days after planting
B) CDZ 4748LL (sensitive variety)
CDZ 4748LL flumioxazin rate:0 g ai ha-1
CDZ 4748LL flumioxazin rate:70 g ai ha-1
CDZ 4748LL flumioxazin rate:105 g ai ha-1
0 g ai ha-1
70 g ai ha-1
105 g ai ha-1
0 g ai ha-1
70 g ai ha-1
105 g ai ha-1
80
CHAPTER 4
Weed Control and Soybean Injury from Preplant versus
at Planting Herbicide Applications
ABSRACT
Palmer amaranth is one of the most troublesome weeds of soybean in the U.S. To
effectively control this weed, overlapping residual herbicides and use of timely postemergence
herbicide applications are strongly recommended. Field studies were conducted in five site years
to assess the effect of application timing 12 to 16 days prior to planting (preplant) and at planting
on soybean injury and longevity of Palmer amaranth control using five residual herbicide
treatments. S-metolachlor + metribuzin and flumioxazin + chlorimuron-ethyl showed a
reduction in longevity of Palmer amaranth control from the date of planting when applied
preplant versus at planting in two of five site years. Sulfentrazone, sulfentrazone + cloransulam-
methyl, and saflufenacil + dimethenamid-P + pyroxasulfone + metribuzin did not reduce
longevity of Palmer amaranth control when applied preplant versus at planting in all five site
years. Visible estimates of soybean injury were less at 21 days after planting when herbicides
were applied 12 to 16 days preplant versus at planting. From these findings, preplant applications
can be used to reduce the potential for crop injury and may not cause a reduction in longevity of
control when herbicides with a long residual activity are used. Preplant herbicides increase the
likelihood of the residuals being activated prior to subsequent weed emergence versus
preemergence herbicides applied at soybean planting.
Nomenclature: cloransulam-methyl; chlorimuron-ethyl; dimethenamid-P; flumioxazin;
metribuzin; pyroxasulfone; S-metolachlor; saflufenacil; sulfentrazone; Palmer amaranth,
Amaranthus palmeri (S.) Wats., soybean, Glycine max (L.) Merr.

81
Key words: At planting, crop injury, longevity of control, postemergence, preemergence,
preplant, residual herbicides

82
INTRODUCTION
Selection placed on weed populations by repeated postemergence (POST) herbicide
applications contribute greatly to the occurrence of herbicide resistance (Culpepper et al. 2006;
Norsworthy et al. 2012). Early-season application of residual herbicides is often recommended as
a means to reduce selection for resistance to POST herbicides. Residual herbicides reduce the
number of weedy propagules POST herbicides are required to control (Norsworthy et al. 2012).
Longevity of residual herbicides may be influenced by time of application. Timing of residual
herbicide applications (preplant vs. at planting) may directly affect the longevity of weed control
and the amount of crop injury observed.
When making the decision between applying a herbicide preplant or at planting, one
consideration is the ability or likelihood of the herbicide being activated. Activation is the
movement of the herbicide through the soil profile to the location of germinating weed seeds by
precipitation or irrigation (Knake et al. 1967). Herbicides with high water solubility have the
ability to be activated with lower amounts of water than herbicides that are less water soluble;
however, high water-soluble herbicides may have a higher leaching or runoff potential if too
much water is present (Fieser and Haddadin 1965). Activation of herbicides before crop
emergence may also reduce the risk for crop injury caused by splashing of the herbicide onto
emerging seedlings during the first activating rainfall (Yoshida et al. 1991). Herbicides applied
before planting increase the likelihood of herbicide activation; however, applying herbicides
prior to planting may reduce longevity of weed control.
Many factors affect the longevity of weed control achieved by soil residual herbicides.
The fate of a herbicide is dependent on the physical and chemical properties as well as how they
respond to biotic and abiotic factors (Cheng 1990). In terms of weed control, a longer persisting
83
herbicide allows for lengthier residual weed control; however, lengthened herbicide persistence
increases the risk for negative environmental impacts (Thurman et al. 1991). The rate of
dissipation/degradation of a herbicide is dependent on many factors including, among others, the
amount of precipitation/irrigation, temperature, light quantity/intensity, herbicide rate, soil
properties (percent organic matter, clay content, cation exchange capacity, pH), soil moisture,
microbial flora, and plant uptake (Koskinen and Harper 1990; Pierzynski 1994; Wagenet and
Rao 1990).
Persistence of the herbicide in the environment can also be affected by mobility of the
compound, which is controlled by Kd (soil sorption), Koc (soil organic carbon sorption)
(Wauchope et al. 2002), and vapor pressure of the compound (Hamaker and Kerlinger 1969).
Loss potentials for herbicides vary greatly (Hamaker and Kerlinger 1969). Residual herbicide
selection is often based on the amount of herbicide available for uptake as well as the estimated
longevity and level of weed control. Another factor influencing residual herbicides is the
sensitivity of the weed that is to be controlled. Protoporphyrinogen oxidase (PPO)-resistant
Palmer amaranth poses a new problem for soybean producers. Palmer amaranth has evolved
resistance to residual herbicides like fomesafen, a diphenylether herbicide (Salas et al. 2016) that
have been commonly used in soybean over the past decade. Now that Palmer amaranth with
resistance to multiple sites of action is common in Midsouth agricultural fields (Varanasi et al.
2018), a reevaluation of herbicide selection, timing, and efficacy is needed to establish the most
effective programs in this region.
The objective of this research was to evaluate the impact of preplant vs. at-planting
residual herbicides on soybean injury and longevity of Palmer amaranth control. The null

84
hypothesis was that at-planting and preplant herbicides would provide similar lengths of Palmer
amaranth control beyond planting.
MATERIALS AND METHODS
Field experiments were conducted near Marianna (2017, 2018), Crawfordsville (2018),
and Fayetteville (2017 and 2018), Arkansas. Multiple site years of data were needed to capture
variability in timing, quantity of rainfall, and herbicide efficacy on different Palmer amaranth
biotypes. The Palmer amaranth biotype at Crawfordsville had previously been characterized as
resistant to PPO-inhibiting herbicides (Varanasi et al. 2018). At all locations, CDZ 5150 LL
soybean (Bayer CropScience, Research Triangle Park, NC) was planted. The soil series in the
production field near Crawfordsville, AR, was a Dundee silt loam (Fine-silty, mixed, active,
thermic Typic Endoaqualfs) with 11% sand, 77% silt, 12% clay, 1.95% organic matter (OM),
and a pH of 5.5. Trials at Fayetteville, AR, were conducted at the University of Arkansas
Research and Extension Center, on a Leaf silt loam soil (Fine, mixed, active, thermic Typic,
Albaqualts) with 34% sand, 53% silt, 13% clay, 1.5% organic matter, and in 2017 and 2018, a
pH of 6.8 and 6.2, respectively. Trials near Marianna were conducted at the Lon Mann Cotton
Research Station on a Convent silt loam (Coarse-silty, mixed, superactive, thermic Fluvaquentic
Endoaquepts) with 9% sand, 80% silt, 11% clay, 1.8% and in 2017 and 2018, a pH of 6.8 and
6.5, respectively. The soil at all locations was prepared with a disk, hipper, and a field cultivator
to smooth the beds before planting. Rainfall and irrigation events were recorded at each site. At
all locations, a natural population of Palmer amaranth was the predominant weed present.
Soybean was planted at a rate of 346,000 seed ha-1 in four-row plots measuring 7.6 m in
length at all locations. Near Crawfordsville and Marianna, the row width was 96 cm, and in
Fayetteville, rows were 91 cm wide. All trials were planted with a four-row vacuum planter

85
(John Deere, Moline, IL), except Crawfordsville in 2018, which was planted with an eight-row
(twin row) vacuum planter (Great Plains, Salina, KS).
The experiment was designed as a two-factor factorial randomized complete block with
four replications. Factor A was application timing (preplant or at planting) and factor B was
labeled herbicide treatments (S-metolachlor + metribuzin; sulfentrazone; sulfentrazone +
cloransulam-methyl; saflufenacil + dimethenamid–P + pyroxasulfone + metribuzin; flumioxazin
+ chlorimuron-ethyl) (Table 1). Herbicide treatments were designed to evaluate a range of injury
risks. Preplant treatments were applied 12 to 16 days prior to planting, and at-planting
applications were made the day of planting. Application and planting dates are displayed in
Figures 1-5. Herbicide applications were made with a CO2-pressurized backpack sprayer
calibrated to deliver delivering 140 L ha-1 at 4.8 km hr-1 with AIXR flat-fan 110015 nozzles
(Teejet Technologies, Springfield, IL). The entire test area was treated with paraquat (700 g ai
ha-1) at planting to control emerged weeds that might be present. Crawfordsville received no
supplemental irrigation, whereas Fayetteville was irrigated using an overhead lateral move
system. The site near Marianna was furrow irrigated. Once soybean emergence occurred,
irrigation was applied within 7 to 8 days of receiving a rainfall event of 1.5 cm or an irrigation
event. Irrigation and rainfall events are shown in Figures 1-5.
To evaluate the residual activity of treatments, emerged Palmer amaranth plants were
counted and removed by hand at 2 and 4 weeks after planting (WAP) from two established 0.5-
m2 quadrats with care given to not disturb the plots. Visible estimates of Palmer amaranth control
were rated weekly through 10 WAP relative to a nontreated on a 0 to 100% scale, with 0 being
no control and 100% being complete control (Frans and Talbert 1977). Soybean injury was also
86
visibly rated on a 0 to 100% scale, with 0 representing no crop injury and 100% indicating plant
death. Injury ratings were based on stunting, chlorosis, and necrosis.
Data Analysis. Visual estimates of control were analyzed using JMP 14.1 (SAS Institute Inc.,
SAS Campus Drive, Cary, NC). Because of differences in environmental conditions, site years
were analyzed separately, giving an accurate representation of the variability in longevity of
control across different soils and environmental conditions. All Palmer amaranth control data
were regressed against days after soybean planting using the Fit Curve platform of JMP. A
quadratic function was fit, allowing for a more accurate prediction estimate than a linear model
based on AICc, weighted AICc, SSE, and R-squared values. Days above 80 percent Palmer
amaranth control were predicted using a model that separated data by site year, application
timing (preplant, at planting), and herbicide treatment. Confidence intervals (95%) were
calculated for mean number of days that control exceeded 80%. Differences among herbicide
treatments or between timings can be inferred if the confidence intervals of the two predicted
means do not overlap.
Soybean injury and Palmer amaranth density data were analyzed by site year in JMP 14.1
with analysis of variance. Soybean injury 21 days after planting is presented to show the effects
that application timing had on crop injury. Cumulative Palmer amaranth density 28 days after
planting and soybean injury 21 days after planting in all five site years failed to follow a normal
distribution based on a Shapiro-Wilks test (Shapiro and Wilks 1965); therefore, a box cox
transformation test was performed to determine the lambda value and most suitable
transformation (Box and Cox 1964). Soybean injury and cumulative Palmer amaranth density
data were transformed with a log transformation to determine p-values and mean separations, but
original means are displayed for ease of interpretations.
87
RESULTS AND DISCUSSION
Herbicide Activation. Variability among herbicides in longevity of control can be explained by
application timing and environmental conditions at different site years. In all site years,
applications made 12 to 16 days prior to planting were activated with a 3.5- to 13.3-cm rainfall
before planting (Figures 1-5). Applications made at planting were likely activated prior to weed
emergence with rainfall events in excess of 3.0 cm at test sites near Marianna in 2017,
Crawfordsville in 2018, and Fayetteville in 2018. Applications made at planting in Fayetteville
in 2017 and near Marianna in 2018 received rainfall at 3 and 7 days after applications,
respectively; however, soil conditions were such that Palmer amaranth emergence was observed
prior to the first rainfall event. At planting soil moisture, soil temperature, and light conditions
were conducive for weed emergence prior to herbicide activation in Fayetteville 2017 and near
Marianna 2018; therefore, weed germination occurred before at planting herbicides were
activated.
Visible Estimates of Injury. Near Marianna in 2018 and Crawfordsville in 2017, no soybean
injury was present in any treatment evaluated. At the three locations where injury was observed
(Marianna 2017, Fayetteville 2017, and Fayetteville 2018), a significant two-way interaction for
herbicide treatment by application timing occurred (Table 2; Table 3). In these three site years,
sulfentrazone was less injurious to soybean when applied preplant versus at planting (Table 3).
Preplant application timing reduced soybean injury at Marianna in 2017 relative to at planting
applications for sulfentrazone + cloransulam and saflufenacil + dimethenamid-P + pyroxasulfone
+ metribuzin. Soybean injury was reduced in Fayetteville 2018 when saflufenacil +
dimethenamid-P + pyroxasulfone + metribuzin was applied preplant versus at planting. Similar
findings by Moshier and Russ (1981) show that high rates of metribuzin applied at planting

88
reduced soybean stand, height, and yield; however, applications of metribuzin made 3 weeks
prior to planting reduced visible soybean injury, and no height or yield reduction was observed.
These findings lead to the conclusion that applying historically injurious herbicides to soybean
12 to 16 days prior to planting reduces the risk for crop injury. Differences in the level of
herbicide injury among treatments were expected but not necessarily the objective of the study.
These data show the safening effects of application timing and longevity of weed control, which
can aid in herbicide application decisions.
Palmer Amaranth Control. The site year near Marianna in 2018 illustrates the consequences of
applying a residual herbicide without the ability to irrigate or properly activate the herbicide
(Figure 2). Preplant applications were made on May 11, 2018, and from the time of application
until planting, the trial received 3.0 cm of rainfall (Figure 2). The at planting application made on
May 25, 2018, was followed by 7 consecutive days without rainfall. Following planting, Palmer
amaranth germinated and emerged without hindrance from the applications made at planting.
Overall, poor Palmer amaranth control from the applications at planting were seen in this site
year (Table 4). Similar findings by Whitaker et al. (2010) show that timing and amount of
rainfall can impact the residual activity of preemergence herbicides. All treatments applied
preplant resulted in longer Palmer amaranth control compared to those at planting. Failure of
residual herbicides applied at planting can cause increased selection for resistance on POST
herbicide applications and likewise decrease the effectiveness of POST application or hasten the
earliness of POST applications (Norsworthy et al. 2012).
The number of days sulfentrazone + cloransulam-methyl and saflufenacil +
dimethenamid-P + pyroxasulfone + metribuzin provided above 80% Palmer amaranth control did
not differ between application timings in four of the five site years (Table 4). Marianna 2018 was

89
the only site year that differed due to lack of herbicide activation. Sulfentrazone applied preplant
provided an equal or greater number of days above 80% Palmer amaranth control in all five site
years when compared to sulfentrazone applications made at planting (Table 4). Of these
treatments sulfentrazone and pyroxasulfone have half-lives of more than 70 days (Table 5).
When comparing application timings of S-metolachlor + metribuzin and flumioxazin +
chlorimuron-ethyl, preplant applications provided a shorter longevity of Palmer amaranth control
in Fayetteville in 2018 and near Marianna in 2017 (Table 3). S-metolachlor + metribuzin and
flumioxazin + chlorimuron-ethyl have similar characteristics as none of the four herbicides with
activity on Palmer amaranth have a half-life that exceeds 27 days (Table 5). Whitaker et al.
(2010) reported that metribuzin + chlorimuron-ethyl provided 87% Palmer amaranth control 3
weeks after application, but control declined to 77% by 7 weeks after application.
Palmer Amaranth Emergence. Data collected from Marianna in 2018 is an example of an at-
planting herbicide treatment not receiving an activating rainfall until seven days after planting
(Figure 2). Only the main effect of application timing was significant (P<0.0001), with lower
Palmer amaranth emergence 28 d after planting from the preplant applications than from
applications at planting (26 and 64%, respectively, compared to the nontreated) (Table 6).
Marianna 2017 was an oddity in Palmer amaranth control; this is possibly due to the high
amounts of precipitation received at this location. Nearly 28 cm of rainfall was received from the
time the preplant applications were applied until four weeks after planting (Figure 3). The
difference in amount of rainfall received from the preplant to at planting timing can influence
longevity of control (Jhala and Singh 2012).

90
Data from site years at Fayetteville 2017, Fayetteville 2018, and near Crawfordsville
2018 were similar. Significant effects of application timing or an interaction of application
timing by herbicide treatment were not present in the results from the analysis (Table 6).
Application timing did not influence the longevity of Palmer amaranth control in Crawfordsville
2018, Fayetteville 2017, and in 2018 despite a difference in environmental conditions.
Conclusion and Practical Implications. Sulfentrazone, sulfentrazone + cloransulam-methyl,
and saflufenacil + dimethenamid-P + pyroxasulfone + metribuzin applied preplant would be a
safer option than applying these herbicides at planting for producers to reduce the potential for
crop injury without suffering a loss in weed control. By applying these herbicides preplant, the
available period for herbicide activation is lengthened, therefore increasing the odds for proper
activation to occur before weed emergence after crop planting (Oliver et al. 1993). However, if
tillage occurs after preplant herbicides are applied the efficacy could be affected. The study also
shows that herbicides with an overall shorter residual persistence and/or those most impacted by
rainfall amounts do not have the potential to be applied preplant without suffering shorter
longevity of weed control. Therefore, when herbicide selection decisions are being made for
preplant applications the length of residual activity and rate of herbicide should be assessed, and
longer residual herbicides should be selected and applied preplant.

91
LITERATURE CITED
Box GEP, Cox DR (1964) Analysis of transformations. Journal of the Royal Statistical Society. Series B (Methodological). 26:211-252
Cheng HH (1990) Pesticides in the soil environment—an overview. In Pesticides in the Soil
Environment. Madison, WI: Soil Sci Soc Am pp. 1–8
Culpepper AS, Grey TL, Vencill WK, Kitchler JM, Webster TM, Brown SM, York AC, Davis
JW, Hanna WW (2006) Glyphosate-resistant Palmer amaranth (Amaranthus palmeri)
confirmed in Georgia. Weed Sci 54:620–626
Ferrell JA, Vencill WK, Xia K, Grey TL (2005) Sorption and desorption of flumioxazin to soil, clay minerals and ion-exchange resin. Pest Manag Sci 61:40-46
Fieser LF, Haddadin MJ (1965) Isobenzofurane, a transient intermediate. Can J Chem 43:1599-
1606 Frans RE, Talbert RE, (1977) Design of field experiments and the measurement and analysis of
plant responses B. Truelove, Research Methods in Weed Science, Southern Weed Science Society, Auburn, TX, pp. 15-23
Gillespie, WE, Czapar GF, Hager AG (2011) Pesticide Fate in the Environment: A Guide for
Field Inspectors. Contract Report 2011‐07, 176 pp., Illinois State Water Survey.
University of Illinois at Urbana‐Champaign, Champaign, Illinois Hamaker JW, Kerlinger HO (1969) Vapor pressure of pesticides. Pages 39-54 in Pesticide
formulations research, ed. Advances in Chemistry. California: American Chemical
Society
Jhala AJ, Singh M (2012) Leaching of indaziflam compared with residual herbicides commonly used in Florida citrus. Weed Technol 26:602–607
Knake EL, Appleby AP, Furtick WR (1967) Soil incorporation and site of uptake of
preemergence herbicides. Weeds 15:228–232 Koskinen WC, Harper SS (1990) The retention process mechanisms. In Cheng HH, ed.
Pesticides in the soil Environments: Processes, Impacts, and Modeling. SSA Book Series
2. Madison, WI: Soil Science Society of America. Pages 51-77
Moshier LJ, Russ OG (1981) Metribuzin injury in soybeans as influenced by application timing
and cultivation. Agron J 73:677–679
Mueller TC, Boswell BW, Mueller SS, Steckel LE (2014) Dissipation of fomesafen, saflufenacil, sulfentrazone, and flumioxazin from a Tennessee soil under field conditions. Weed Sci 62:664–671

92
Mueller TC, Steckel LE (2011) Efficacy and dissipation of pyroxasulfone and three chloroacetamides in a Tennessee field soil. Weed Sci 59:574–579
Norsworthy JK, Ward S, Shaw D, Llewellyn R, Nichols R, Webster T, Bradley K, Frisvold G,
Powles S, Burgos N, Witt W, Barrett M (2012) Reducing the risks of herbicide
resistance: best management practices and recommendations. Weed Sci 60 (Special Issue
I):31-62
Oliver LR, Klingaman TE, McClelland M, Bozsa RC (1993) Herbicide systems in stale seedbed
soybean (Glycine max) production. Weed Technol 7:816–823
Pierzynski GM (1994) Plant nutrient aspects of sewage sludge. In Sewage Sludge: Land
Application and the Environment. Clapp CE, Larson WE, Dowdy RH eds. Soil Sci. Soc.
Am., Madison, WI, pp. 21–25
Salas RA, Burgos NR, Tranel PJ, Singh S, Glasgow L, Scott RC, Nichols RL (2016) Resistance
to PPO-inhibiting herbicide in Palmer amaranth from Arkansas. Pest Manag Sci 72:864–
869
Savage, KE (1977) Metribuzin persistence in soil. Weed Sci 25:55–59 Shaner, DL (2014) Herbicide Handbook. 10th Edition, Weed Science Society of America,
Lawrence, 513 p Shapiro SS, Wilk MB (1965) An analysis of variance test for normality (complete samples).
Biometrika 52:591–611
Thurman EM, Goolsby DA, Meyer MT, Kolpin DW (1991) Herbicides in surface
waters of the midwestern United States: The effect of spring flush.
Environ Sci Technol 25:1794-1796
Wesenbeeck V, IJ, Zabik JM, Wolt JD, Bormett GA, Roberts DW (1997) Field dissipation of
cloransulam-methyl at four sites in the U.S. soybean market. J Agric Food Chem 45:3299–3307
Varanasi VK, Brabham C, Norsworthy JK, Nie H, Young BG, Houston M, Barber T, Scott, RC
(2018) A statewide survey of PPO-inhibitor resistance and the prevalent target-site mechanism in Palmer amaranth (Amaranthus palmeri) accessions from Arkansas. Weed Sci 66:149–158
Wagenet RJ, Rao PSC (1990) Modeling pesticide fate in soils. Pages 351-399 in Cheng HH ed.
Pesticides in the soil environment: processes, impacts, and modeling.
Wauchope RD, Yeh S, Linders JBHJ, Kloskowski R, Tanaka K, Rubin B, (2002) Pesticide soil sorption parameters: theory, measurement, uses, limitations and reliability. Pest Manag Sci 58:419–445
93
Whitaker JR, York AC, Jordan DL, Culpepper AS (2010) Palmer amaranth (Amaranthus
palmeri) control in soybean with glyphosate and conventional herbicide systems. Weed
Technol 24:403-410 Yoshida RM, Sakaki R, Sato T, Hada E, Nagano H, Oshio, Kamoshita K (1991) A new N-phenyl
phthalimide herbicide. Crop Prot 1:69-75

94
APPENDIX
Table 1. Product name, manufacturer, herbicides common name, and rate of herbicide tested.
Product name
Company
Common name Rate
g ai ha-1
Boundary Syngenta Crop Protection, Inc, Greensboro, NC
27419
S-metolachlor+ 1,588 metribuzin 378
Authority MTZ
FMC, Philadelphia Penn
19104
sulfentrazone + 77 metribuzin 115
Verdict BASF Corp., Research Triangle Park, NC 27709
saflufenacil + 25
dimethenamid-P 219
Zidua BASF Corp, Research Triangle Park, NC 27709
pyroxasulfone 149
Tricor United Phosphorus, Inc. King of Prussia
70506-68
metribuzin 315
Sonic The Dow Chemical Company Midland,
Michigan 62719-680
sulfentrazone + 196 cloransulam 25
Valor XLT Valent U.S.A. LLC Agricultural
products Mahomet, IL 59639-117
flumioxazin + 63 chlorimuron-ethyl 21.6

95
Table 2. The p-values from ANOVA for soybean injury 21 days after planting and Palmer amaranth density 28 days after planting for
five site years.
ANOVA
Response variable tested
Factors evaluated
Marianna 2017 Marianna 2018
Fayetteville 2017
Fayetteville 2018
Crawfordsville 2018
-------------------------------------------- p-values -------------------------------------------------
Percent injury
herbicide 0.0007 naa < 0.0001 <0.0001 na
timing <0.0001 na 0.1275 0.0009 na
timing*herbicide 0.0007 na 0.0371 0.0044 na
Density
herbicide <0.0001 0.8708 0.0859 0.0014 0.9555
timing <0.0001 <0.0001 0.4300 0.0825 0.1633
timing*herbicide 0.0247 0.8579 0.9950 0.2546 0.1760 a No data were collected at these locations due to lack of injury caused by the herbicide treatment.

96
Table 3. Visible estimates of injury 21 days after planting near Marianna 2017, at Fayetteville 2017, and Fayetteville 2018.
a Applications of herbicides were made the day of planting b Applications of herbicides made 14 days prior to planting c Means that are significantly different are represented by letter separation by site year; means without the same letter are significantly
different.
Injury
Marianna 2017 Fayetteville 2017 Fayetteville 2018
Herbicide Rate At plantinga Preplantb At planting Preplant At planting Preplant
g ai ha-1 --------------------------------------------------------%----------------------------------------------------------
Sulfentrazone 525 66 ac 5 cd 31 a 10 bc 49 a 29 ab Sulfentrazone + 196
24 bc 3 d
15 b 10 bc
15 ab 49 a cloransulam methyl 25 Flumioxazin + 63
8 bcd 10 bcd
8 cd 6 cd
8 b 6 b chlorimuron ethyl 21.6 Saflufenacil + 25
26 b 1 d
7 cd 5 cd
34 a 4 b
dimethenamid-P + 219 pyroxasulfone + 149 metribuzin 315
S-metolachlor+ 1,588
1 d 1 d
3 d 5 cd
18 ab 3 b metribuzin 378

97
Table 4. Regression analysis of quadratic trend at all locations, showing inverse predictions of
the number of days that the herbicide achieved 80% control of Palmer amaranth relative to the
nontreated check; also shown is the mean confidence interval.
Longevity of control
Preplant At planting
Location (year) Herbicide Rate > 80%
Controlb CI of meanc
> 80%
Control CI of mean
g ai ha-1 ----------------------------da-------------------------
Crawfordsville 2018
Flumioxazin + 63
20 16 ≤ μ ≤ 24
20 16 ≤ μ ≤ 24 chlorimuron ethyl 21.6
Sulfentrazone + 196
26 23 ≤ μ ≤ 30
27 24 ≤ μ ≤ 31 cloransulam 25
Sulfentrazone 77 28*d 24 ≤ μ ≤ 31 17* 13 ≤ μ ≤ 21
S-metolachlor+ 1,588
29 25≤ μ ≤ 32
32 28 ≤ μ ≤ 35 metribuzin 378
Saflufenacil + 25
27 23≤ μ ≤ 30
31 27 ≤ μ ≤ 34
dimethenamid-P+ 219
pyroxasulfone+ 149
metribuzin 315 Fayetteville 2017
Flumioxazin + 63
32 28 ≤ μ ≤ 36
28 25 ≤ μ ≤ 32 chlorimuron ethyl 21.6
Sulfentrazone + 196
30 26 ≤ μ ≤ 34
25 21 ≤ μ ≤ 28 cloransulam 25
Sulfentrazone 77 34 30 ≤ μ ≤ 39 33 29 ≤ μ ≤ 37
S-metolachlor+ 1,588 30 27 ≤ μ ≤ 34
32 28 ≤ μ ≤ 36 metribuzin 378
Saflufenacil + 25
34 30 ≤ μ ≤ 38
34 30 ≤ μ ≤ 38
dimethenamid-P+ 219
pyroxasulfone+ 149
metribuzin 315 Fayetteville 2018
Flumioxazin + 63
21* 16 ≤ μ ≤ 27
37* 32 ≤ μ ≤ 42 chlorimuron ethyl 21.6
Sulfentrazone + 196
36 31 ≤ μ ≤ 41
37 32 ≤ μ ≤ 42 cloransulam 25
Sulfentrazone 77 40 35 ≤ μ ≤ 45 39 34 ≤ μ ≤ 44
S-metolachlor+ 1,588 26* 21 ≤ μ ≤ 31 37* 32 ≤ μ ≤ 42

98
Table 4 continued. Regression analysis of quadratic trend at all locations, showing inverse predictions of the number of days that the herbicide achieved 80% control of Palmer amaranth relative to the nontreated check; also shown is the mean confidence interval.
Longevity of control
Preplant At planting
Location (year) Herbicide Rate > 80%
Controlb CI of meanc
> 80%
Control CI of mean
g ai ha-1 ----------------------------da-------------------------
Fayetteville 2018
metribuzin 378 Saflufenacil + 25
40 35 ≤ μ ≤ 45
41 36 ≤ μ ≤ 47
dimethenamid-P+ 219
pyroxasulfone+ 149 metribuzin 315
Marianna 2017
Flumioxazin + 63
20* 17 ≤ μ ≤ 24
29* 25 ≤ μ ≤ 33 chlorimuron ethyl 21.6
Sulfentrazone + 196 24 21 ≤ μ ≤ 28
32 28 ≤ μ ≤ 35 cloransulam 25
Sulfentrazone 77 27 23 ≤ μ ≤ 30 33 29 ≤ μ ≤ 36
S-metolachlor+ 1,588
7* 2 ≤ μ ≤ 11
26* 23 ≤ μ ≤ 30 metribuzin 378
Saflufenacil + 25
25 22 ≤ μ ≤ 29
33 29 ≤ μ ≤ 36
dimethenamid-P+ 219
pyroxasulfone+ 149
metribuzin 315
Marianna 2018
Flumioxazin + 63 29* 26 ≤ μ ≤ 33
17* 14 ≤ μ ≤ 21 chlorimuron ethyl 21.6
Sulfentrazone + 196
29* 26 ≤ μ ≤ 32
22* 19 ≤ μ ≤ 26 cloransulam 25
Sulfentrazone 77 29* 26 ≤ μ ≤ 33 19* 16 ≤ μ ≤ 22
S-metolachlor+ 1,588
26* 23 ≤ μ ≤ 29
4* 0 ≤ μ ≤ 8 metribuzin 378
Saflufenacil + 25
31* 28 ≤ μ ≤ 34
18* 15 ≤ μ ≤ 22
dimethenamid-P+
219
pyroxasulfone+ 149
metribuzin 315 a (d) represents days b (> 80% control) is the number of days that the herbicide provided above 80 percent control of
Palmer amaranth. Values were calculated using the inverse prediction. c CI of Mean, (mean confidence interval) can be interpreted as there is a 95% probability that the
confidence interval will capture the true population mean. d ( * ) represents significant difference between application timings at (P=0.05)

99
Table 5. Published estimates of KOC (soil and organic carbon sorption ratio) and half-life of
herbicides evaluated.
Common name
KOC Citation Half life Citation
L kg-1 days
Cloransulam-methyl
54.4-915 Gillespie et al.
(2011) 11.2 Wesenbeeck et al.
(1997)
Chlorimuron-ethyl
0.11
Shaner (2014) 40 Shaner (2014)
Dimethenamid-P 105-396 Gillespie et al. (2011)
9 Mueller and
Steckel (2011)
Flumioxazin 116-200 Ferrell et al. (2005) 21.1 Mueller et al.
(2014)
Metribuzin
60 Gillespie et al.
(2011) 17-28 Savage (1977)
Pyroxasulfone 106-120 Westra (2012) 71 Mueller and
Steckel (2011)
Saflufenacil 4-92 Shaner (2014) 21.4 Mueller et al.
(2014)
S-metolachlor 200 Gillespie et al. (2011)
27 Mueller and
Steckel (2011)
Sulfentrazone 43 Shaner (2014) 70.48 Mueller et al.
(2014)

100
Table 6. Density of Palmer amaranth emergence for 28 days after planting at Marianna 2017, Marianna 2018, and Fayetteville 2018.
Fayetteville 2017 and Crawfordsville 2018 were not shown due to a non-significant interaction and main effects.
a Applications of herbicides were made the day of planting. b Applications of herbicides made 14 days prior to planting. c Uppercase letters are used to separate means of herbicide by timing interaction; means followed by the same letters do not differ
based on Fisher’s protected LSD (P=0.05). d Lowercase letters represent significant difference between main effects application timing and herbicide treatment within site year;
means followed by the same letters are do not differ based on Fisher’s protected LSD (P=0.05).
Marianna 2017 Marianna 2018 Fayetteville 2018
Factors Herbicide At plantinga Preplantb At planting Preplant At planting Preplant
Application timing
14bc 38a
64a 26b
18a 6b
Sulfentrazone 3 DEd 12 C - 4bc
--
Sulfentrazone + 9 CD 28 B
-
8a cloransulam methyl
Flumioxazin + 11 C 36
AB
-
2bc chlorimuron ethyl
Saflufenacil +
2 E 33 B
-
7ab
dimethenamid-P + pyroxasulfone + metribuzin
S-metolachlor+
47 AB 79 A
-
2bc metribuzin

101
Figure 1. Cumulative rainfall in Crawfordsville, 2018, starting at time of the preplant application
(dotted line shows time of planting/at planting application) and continuing three months past
planting.
0
5
10
15
20
25
30
35
40
0
1
2
3
4
5
6
7
Cu
mu
lati
ve
ra
infa
ll (
cm)
Da
ily r
ain
fall
(cm
)
Date
daily rainfall cumulative rainfall
Planting

102
Figure 2. Cumulative rainfall in Marianna, 2018 starting at time of the preplant application
(dotted line shows time of planting/at planting application) and continuing three months past
planting.
0
5
10
15
20
25
30
0
1
2
3
4
5
6
Cu
mu
lati
ve
ra
infa
ll a
nd
irr
iga
tio
n (
cm)
Da
ily r
ain
fall
an
d irr
iga
tio
n (
cm)
Date
daily rainfall and irrigation
cumulative rainfall and irrigaition
Planting

103
Figure 3. Cumulative rainfall- in Marianna, 2017 starting at time of the preplant application
(dotted line shows time of planting/at planting application) and continuing three months past
planting.
0
10
20
30
40
50
60
0
1
2
3
4
5
6
7
8
9
10
Cum
ula
tive
rain
fall
and i
rrig
atio
n (
cm)
Dai
ly r
ainfa
ll a
nd i
rrig
atio
n (
cm)
Date
daily rainfall and irrigation
cumulative rainfall and irrigation
Planting

104
Figure 4. Cumulative rainfall in Fayetteville 2017, starting at time of the preplant application
(dotted line shows time of planting/at planting application) and continuing three months past
planting.
0
10
20
30
40
50
60
0
1
2
3
4
5
6
7
8
9
10
Cu
mu
lati
ve
ra
infa
ll a
nd
irr
iga
tio
n (
cm)
Da
ily r
ain
fall
an
d irr
iga
tio
n (
cm)
Date
daily rainfall and irrigation
cumulative rainfall and irrigation
Planting
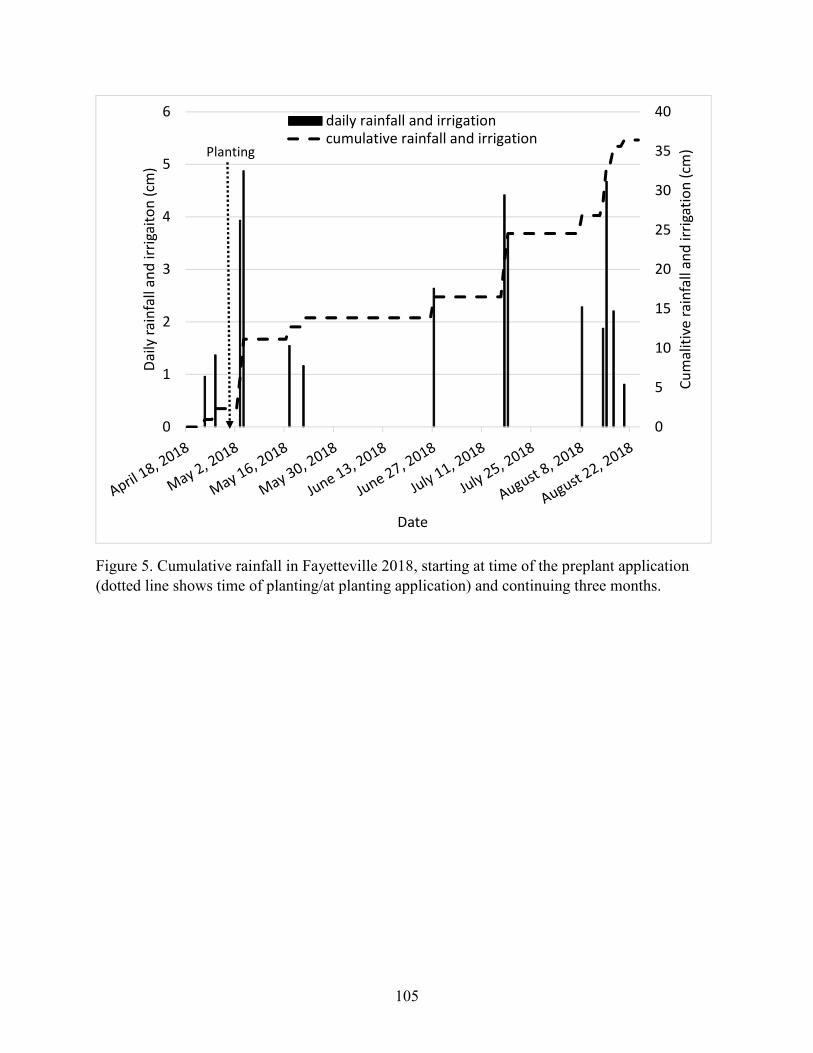
105
Figure 5. Cumulative rainfall in Fayetteville 2018, starting at time of the preplant application
(dotted line shows time of planting/at planting application) and continuing three months.
0
5
10
15
20
25
30
35
40
0
1
2
3
4
5
6
Cu
ma
liti
ve
ra
infa
ll a
nd
irr
iga
tio
n (
cm)
Da
ily r
ain
fall
an
d irr
iga
ito
n (
cm)
Date
daily rainfall and irrigation
cumulative rainfall and irrigationPlanting

106
CHAPTER 5
Impact of Labeled Postemergence Herbicides on Soybean Injury and Canopy Formation
Abstract. Field studies were conducted in 2017 and 2018 in Arkansas to evaluate the impacts of
soybean injury caused by labeled herbicides on crop canopy formation and yield. Fomesafen,
acifluorfen, S-metolachlor + fomesafen, and S-metolachlor + fomesafen + chlorimuron alone and
in combination with glufosinate were applied to glufosinate-resistant soybean at the V2 growth
stage. Soybean injury resulting from these labeled herbicide treatments ranged from 9 to 25% at
2 weeks after application. This level of injury resulted in a 4-, 5-, 6-, and 6-day delay in soybean
reaching 80% groundcover following fomesafen, acifluorfen, S-metolachlor + fomesafen, and S-
metolachlor + fomesafen + chlorimuron, respectively. There was a 2-day delay in soybean
reaching a canopy volume of 15,000 cm3 following each of the four herbicide treatments. The
addition of glufosinate to the herbicide applications resulted in longer delays of canopy
formation in every herbicide treatment except glufosinate + fomesafen. Fomesafen, acifluorfen,
S-metolachlor + fomesafen, and S-metolachlor + fomesafen + chlorimuron, each applied with
glufosinate, delayed soybean from reaching 80% groundcover by 2, 7, 8, and 9 days,
respectively, and delayed the number of days for soybean to reach a canopy volume of 15,000
cm3 by 2, 3, 2, and 2 days, respectively. No yield loss occurred with any herbicide application. A
delay in percent groundcover in soybean allows sunlight to reach the soil surface for longer
periods throughout the growing season, possibly promoting late-season weed germination and
the need for an additional postemergence herbicide application.
Nomenclature: acifluorfen; chlorimuron; fomesafen; glufosinate; S-metolachlor; soybean
Glycine max (L.) Merr.
Keywords: Groundcover, herbicide injury, soybean volume, canopy formation

107
INTRODUCTION
Protoporphyrinogen oxidase- (PPO) and acetolactate synthase- (ALS) inhibiting
herbicides historically have successfully controlled Amaranthus spp. (Harris et al. 1991; Mavo et
al. 1995). Herbicides that inhibit PPO and ALS have been effective preemergence (PRE)
(flumioxazin, sulfentrazone, chlorimuron, cloransulam) and postemergence (POST) as control
options (fomesafen, acifluorfen, lactofen, imazethapyr) for many troublesome weeds in soybean
(Harris et al. 1991; Mavo et al. 1995; Niekamp et al. 1999). Five years after the introduction of
ALS herbicides to the United States, ALS-resistant biotypes of prickly lettuce (Lactuca serriola
L.) and kochia [Kochia scoparia (L) Roth] were documented (Mallory-Smith et al. 1990; Saari et
al. 1990). To date, at least 160 species of weeds, including Palmer amaranth [Amaranthus
palmeri (S.) Wats.] have evolved resistance to ALS herbicides (Heap 2018).
Protoporphyrinogen oxidase-inhibiting herbicides were relied on for control of
Amaranthus species before the release of glyphosate-resistant crops (Norsworthy et al. 2012).
Protoporphyrinogen oxidase-inhibiting herbicide use increased substantially following
widespread resistance of Amaranthus species to ALS and glyphosate (Norsworthy et al. 2008).
The first documented PPO-resistant Amaranthus ssp. was common waterhemp [Amaranthus
tuberculatus (Moq.] Sauer) in Kansas in 2000 (Heap 2018). The resistant waterhemp biotype
was soon found in Missouri, Illinois, and Iowa (Heap 2018). Palmer amaranth resistant to PPO-
inhibiting herbicides was subsequently documented in Arkansas in 2015 (Salas et al. 2016).
Herbicides that inhibit PPO and ALS are less effective today because of the evolution and spread
of PPO- and ALS-resistant Palmer amaranth and common waterhemp (Salas et al. 2016;
Varanasi et al. 2018).

108
Besides potential resistance evolution, the continued use of these herbicides in soybean
may be questionable because injury to the crop often follows their use (Whitaker et al. 2010).
Prior to PPO- and ALS-resistant Palmer amaranth, injury to soybean was considered tolerable
because of the high level of weed control achieved by the application (Harris et al. 1991).
However, it has been shown that soybean injury following a herbicide application can result in
delayed canopy formation, leading to a possible increase in weed germination (Nelson and
Renner 2001). With a reduction in efficacy for Palmer amaranth, the most troublesome weed of
soybean (Schwartz-Lazaro et al. 2018), the continued use of these herbicides may not be justified
due to the detrimental effects on soybean canopy formation.
Crop canopy formation is a vital tool utilized by growers to reduce late-season weed
emergence and limit the need for additional POST herbicides. Canopy closure reduces the
emergence rate of weed seeds by shading the soil surface (Burnside and Moomaw 1977;
Chandler et al. 2001; Dalley et al. 2004; Harder et al. 2007; Nelson and Renner 1997; Nice et al.
2001; Young et al. 2001). Canopy formation is complex because many factors influence its rate
of development, including row spacing, seeding rate, plant phenology, maturity group,
fertilization, and environmental conditions among others. Growers can better utilize canopy
closure by decreasing row spacing and/or increasing seeding rate, which promotes early canopy
closure by increasing leaf area index (LAI) (Bertram and Pederson 2004; Burnside and Colville
1964; Harder et al. 2007; Yelverton and Coble 1991). In Midsouth soybean production systems,
soybean is primarily grown on rows spaced 97 cm apart, resulting in soybean taking 50 to 80
days after planting to reach full canopy formation under irrigated conditions (Bell et al. 2015).
Rate of canopy formation in soybean influences light interception and alters light quality,
both of which have been shown to impact weed emergence (Huang 1993; Jha and Norsworthy

109
2009). Full canopy formation is achieved when 95% of available light is intercepted by the crop
(Gardner et al. 1985; Harder et al. 2007; Shibles and Weber 1965). This level of light
interception is needed to maximize soybean yield and strongly suppress weed emergence
(Edwards and Purcell 2005; Jha and Norsworthy 2009). The interception of solar radiation by
the crop canopy impacts light quality reaching the soil surface and weed seeds lying on or near
the soil surface. The phytochrome conversion of Pr (red) and Pfr (far red) has been shown to be
of importance for germination of troublesome weed species such as redroot pigweed
(Amaranthus retroflexus L.) (Gallengher and Cardina 1998). Soybean is able to reduce the
germination of shallow-seeded weed species by altering the incidence of the Pr and Pfr ratio
underneath the crop canopy. Jha and Norsworthy (2009) observed that a reduction of soil
temperature due to crop canopy formation contributed a larger role than light quality in reducing
Palmer amaranth emergence.
The benefits of promoting early-season crop canopy formation has been thoroughly
established. As soybean population increases or spatial distribution of soybean becomes more
uniform, there is an increase in LAI and promotion of early canopy closure (Bertram and
Pederson 2004; Harder et al. 2007). Early-season canopy formation can be promoted by reducing
soybean row spacing, in turn reducing crop weed emergence (Bertram and Pederson 2004;
Harder et al. 2007). By reducing weed emergence through an assortment of cultural practices, so
too is the selection for resistance to foliar active and residual herbicides lessened (Norsworthy et
al. 2012).
Crop and weed interactions are complex. Anything producers can do to maximize the
competitive nature of the crop will likely benefit weed management. With this being true, the

110
objective of this research was to assess the injury caused by POST-applied herbicides and
determine the effects of selected herbicides on soybean canopy formation.
MATERIAL AND METHODS
Field experiments were conducted near Crawfordsville, Arkansas, in 2017 and 2018 and
at the Lon Mann Cotton Research Station near Marianna, Arkansas, in 2018. The soil series in
the production field near Crawfordsville was a Dundee silt loam (Fine-silty, mixed, active,
thermic Typic Endoaqualfs) with 11% sand, 77% silt, 12% clay, 1.95% organic matter (OM),
and a pH of 5.5 and 5.8, in 2017 and 2018, respectively. In both site years near Crawfordsville,
soybean was planted with a twin-row planter (Great Plains, Salina, KS) with a spacing of 17.8
cm between the twin rows on 96.5 cm spaced rows. The trials established in Crawfordsville were
non-irrigated. The trial at Marianna was conducted on a Convent silt loam (Coarse-silty, mixed,
superactive, thermic Fluvaquentic Endoaquepts) with 9% sand, 80% silt, 11% clay, 1.8% OM,
and a pH of 6.8. The soybean near Marianna was planted with a single-row planter on 96.5-cm-
wide rows. The trial near Marianna was furrow irrigated. Soil at both locations was prepared
with a disk, hipper, and a field cultivator to smooth beds before planting. All experiments were
planted to a non-sulfonylurea-tolerant, glufosinate-resistant soybean variety (CDZ 5150LL) at a
rate of 346,000 seed ha-1. At both locations, a weather station was present to record rainfall data.
Experiments conducted at both locations were established as a two-factor randomized
complete block design with four replications. The two factors were a labeled rate of the
herbicides (fomesafen, acifluorfen, S-metolachlor + fomesafen, S-metolachlor + fomesafen +
chlorimuron) applied with or without glufosinate (Table 1). Additionally, nontreated plots were
included for comparison. Plot size was 7.6 m long and 3.8 m wide. Treatments were applied 28
day after planting (DAP). To accurately assess the impact of treatments on soybean

111
development, plots were maintained weed free by applying flumioxazin (Valor, Valent U.S.A,
LLC Agricultural products, Mahomet, IL, 59639-117) at 71 g ai ha-1 3 to 4 DAP to all treatments
with additional applications of glufosinate at 595 g ai ha-1 + S-metolachlor at 1,066 g ai ha-1 at 14
DAP (to keep trial weed free). Herbicide treatments were applied with a CO2-pressurized
backpack sprayer calibrated to deliver 140 L ha-1 at 4.8 km hr-1 using AIXR flat fan 110015
nozzles (Teejet Technologies, Springfield, IL, 62703).
Data collected included crop injury ratings, soybean plant volume, percent groundcover,
and yield. To evaluate crop injury, soybean was assessed for visible phytotoxicity, necrosis, and
stunting compared to the nontreated control. Ratings were based on a 0 to 100% scale, with 0%
being no crop injury and 100% being crop death (Frans and Talbert 1977). Visual estimates of
crop injury were rated 7, 14, 21, and 28 days after application. Soybean volume was calculated
by measuring height and width of five soybean plants within the center two rows inside the plot
and then calculating volume using the following formula: (� × ���� ℎ� �ℎ)(���� � �ℎ ÷
2)2 (Norsworthy 2004). Soybean volume was assessed weekly until canopy closure for all plots
was achieved or until soybean maturity. Aerial photos were taken weekly after planting using an
unmanned aerial vehicle (DJI Phantom 4 Pro equipped with a 1080p gimbal mounted camera
Shenzhen, China, 518057). These photos were achieved by taking an ortho-mosaic of the area
and were stitched into a complete image (ortho-mosaic) through Field Agent software (Sentera,
Minneapolis, MN 55423). The ortho-mosaic was then subjected to analysis in Field Analyzer
(https://www.turfanalyzer.com/#field_analyzer). Field analyzer produced the proportion of green
pixels in the selected area in each plot, giving an assessment of groundcover. Soybean grain
was harvested from the two center rows of each plot at maturity using a small-plot combine, and
yields were adjusted to 13% moisture.

112
Data Analysis. All data were analyzed in JMP Pro 14.1 (SAS Institute Inc., Cary, NC). Soybean
canopy volume data were regressed using a mechanistic growth curve ((y = a (1 – b * EXP (-
c*days)), a = asymptote, b = scale, c = growth rate) to predict canopy development over time in
the Fit Curve platform of JMP as described previously (Gillespie et al. 1994). Inverse
predictions of the amount of days for soybean to reach 15,000 cm3 were recorded along with
95% confidence intervals. Percent groundcover data were also regressed using a mechanistic
growth curve in the Fit Curve platform of JMP. From the mechanistic growth curve, inverse
predictions were made for the number of days required after application for soybean to achieve
60% and 80% groundcover. Confidence intervals of the means were also produced for the
groundcover estimates. Soybean volume and percent groundcover data were regressed over site
years to increase the number of observations and give a stronger prediction estimate. Regressing
over site years gave an average soybean response over three environments. Percent injury and
yield data were subjected to analysis of variance (ANOVA). When analyzing injury and soybean
yield, site year and site year nested within replication were considered random effects of the
model. Means were separated using Fisher’s protected LSD at P=0.05. P-values of ANOVA
analysis are displayed in Table 2.
RESULTS AND DISCUSSION
Soybean Injury. Herbicide treatments comprised of the PPO- and ALS-inhibiting herbicides
used in this experiment were chosen because of their tendency to injure soybean, even when
applied at labeled rates (Whitaker et al. 2010). With the widespread occurrence of ALS-resistant
Palmer amaranth and the increasing occurrence of PPO-resistant Palmer amaranth (Varanasi et
al. 2018), the continued use of these herbicides has been questioned, especially if there is
sufficient injury to delay crop canopy formation, resulting in an opportunity for additional weed

113
emergence. Hence, the goal of the experiment was not to validate or confirm that certain PPO-
and ALS- herbicides cause injury to soybean, but rather to determine if crop injury translates into
a delay in soybean canopy formation. Therefore, comparing injury levels among treatments was
not the primary focus of the experiment.
Based on ANOVA, there was a significant interaction between PPO/ALS herbicide and
the addition of glufosinate (P=0.0086) (Table 2). Across the three site years, glufosinate +
acifluorfen caused 25% injury, which was the highest level observed (Table 3). Fomesafen, S-
metolachlor + fomesafen, S-metolachlor + fomesafen + chlorimuron alone and in combination
with glufosinate resulted in soybean injury levels of 9 to 15% (Table 3). Similarly, Beyers et al.
(2002) found that PPO- and ALS-inhibiting herbicides mixed with glufosinate resulted up to
21% injury to glufosinate-resistant soybean; these findings are comparable to injury levels
observed in experiments that were conducted.
Soybean Volume. Parameters of the mechanistic growth curves are shown in Table 4.
Difference in soybean volume from the nontreated was difficult to determine due to the
additional variability added to the analysis by subsampling five plants from each plot at different
timings. Percent groundcover analysis considered the whole plot and was a better representation
of soybean canopy formation over time than was soybean volume. However, general numeric
delays in soybean volume caused by herbicide injury to soybean are evident in data presented in
Table 5. The herbicides fomesafen, acifluorfen, S-metolachlor + fomesafen, and S-metolachlor +
fomesafen + chlorimuron numerically delayed soybean from reaching a volume of 15,000 cm3
by 2 days. Glufosinate + fomesafen, glufosinate + acifluorfen, glufosinate + S-metolachlor +
fomesafen, glufosinate + S-metolachlor + fomesafen + chlorimuron delayed soybean from

114
reaching a volume of 15,000 cm3 by 2, 3, 2, and 2 days, respectively. A significant reduction in
soybean volume compared to the nontreated was only detected for the glufosinate + fomesafen
treatment.
Percent Groundcover. The application of fomesafen, acifluorfen, and glufosinate + S-
metolachlor + fomesafen delayed soybean from reaching 60% groundcover by 3 days compared
to nontreated soybean (Table 6). S-metolachlor + fomesafen and S-metolachlor + fomesafen +
chlorimuron delayed formation of 60% soybean groundcover by 4 days. The application of
glufosinate + acifluorfen, which was also the most injurious herbicide treatment applied, delayed
60% soybean groundcover by 5 days. Applications of glufosinate + fomesafen and glufosinate +
S-metolachlor + fomesafen were not significantly different from the nontreated; however, a delay
to 60% groundcover of 2 to 3 days was seen.
It has been noted that soybean has a high propensity to recover from early-season
herbicide-induced injury, with seldom an impact on grain yield (Kapusta et al. 1986); however,
the ability of soybean to recover from injury that delays canopy formation would likely be
contingent upon planting date, soybean phenology, maturity group, growth habit, and soil
moisture availability. For determinate soybean variety, canopy growth generally declines at
flowering (R1) and grain yield is closely linked to the amount of canopy present when soybean
begins reproductive development (Edwards and Purcell 2005). Data collected from all three site
years show no significant delay in the number of days required to achieve 80% groundcover;
however, there is a general trend that shows soybean injured by herbicides will have a delay in
canopy formation. For example, soybean treated with glufosinate + acifluorfen reached 80%
groundcover 7 days later than the nontreated.

115
As soybean shifts from primarily vegetative growth to reproductive growth, canopy
formation is slowed; therefore, placement of 80% groundcover on the mechanistic growth curve
shows a very low slope and reduces the power of the prediction estimate (larger confidence
interval). Injury caused by herbicides has season-long effects on soybean growth and
development. The belief that soybean can fully recover from herbicide injury may be
exaggerated; a delay of soybean canopy formation should be expected relative to the amount of
herbicide-induced injury.
Digital analysis of groundcover proved more powerful at predicting the impact of
herbicide-induced injury on soybean canopy formation over manual measurements of soybean
height and width. The 95% confidence limits of the 60% groundcover analysis averaged a 3.2-
day span compared to an averaged 8.4-day span of the confidence limits of the prediction of
soybean volume (Table 5 and 6), which illustrates the higher accuracy of prediction estimates of
percent groundcover. The collection of percent groundcover data using an unmanned aerial
vehicle also reduced the time needed to gather accurate assessments of soybean canopy
formation.
Soybean Yield. Soybean yield loss from early-season injury caused by herbicides was not found
in this research (Table 7). Lack of an impact on soybean yield was expected as crop injury from
herbicides when applied according to the label should not cause yield loss (Kapusta et al. 1986).
Conclusions and Practical Implications. Soybean injury caused by PPO-inhibiting and ALS-
inhibiting herbicides alone and in combination with glufosinate result in a delay in soybean
canopy formation. The herbicides fomesafen, acifluorfen, S-metolachlor + fomesafen, and S-
metolachlor + fomesafen + chlorimuron delayed soybean from reaching 80% groundcover by at
least 4 days. The addition of glufosinate to the herbicide applications often resulted in longer

116
delays in canopy formation. Glufosinate + S-metolachlor + fomesafen + chlorimuron delayed
soybean from reaching 80% groundcover by 9 days, which would likely increase the need for a
subsequent POST herbicide application, especially in fields where PPO- and ALS-resistant
Palmer amaranth are present. In fields heavily infested with PPO- and ALS-resistant Palmer
amaranth, an option that may be less injurious to soybean is use of S-metolachlor or other
chloroacetamide herbicides with glufosinate, albeit these combinations were not directly
evaluated in this research.
Although the herbicide treatments tested displayed no impacts on yield, other economic
factors are influenced. Palmer amaranth, one of the most troublesome weeds in the U.S., has the
ability to emerge throughout the soybean growing season requiring sequential herbicide
applications for season-long control in southern U.S. soybean production systems (Norsworthy et
al. 2012). Soybean canopy formation has been shown to reduce Palmer amaranth emergence (Jha
and Norsworthy 2009). Therefore, when herbicides cause soybean injury and delay canopy
formation, a larger proportion of weeds have the ability to emerge over the course of a growing
season. As weed emergence increases, there is greater selection on foliar active and residual
herbicides, possibly increasing the number of applications needed for season-long control. A
delay in soybean canopy formation increases selection for herbicide resistance with the
succeeding application. Additionally, soybean injury sustained by prior herbicide applications
may increase cost of herbicide programs because of increases in the critical weed-free period
(Nelson and Renner 2001).

117
LITERATURE CITED
Bell HD, Norsworthy JK, Scott RC, Popp M (2015) Effect of row spacing, seeding rate, and
herbicide program in glufosinate-resistant soybean on Palmer amaranth
management. Weed Technol 29:390–404
Bertram MG, Pedersen P (2004) Adjusting management practices using glyphosate-resistant
soybean cultivars. Agron J 96:462-468
Beyers JT, Smeda RJ, Johnson WG (2002) Weed management programs in glufosinate-resistant
soybean (Glycine max). Weed Technol 16:267-273
Burnside OC, Colville WL (1964) Soybean and weed yields as affected by irrigation, row
spacing, tillage, and amiben. Weeds 12:109-112
Burnside OC, Moomaw RS (1977) Control of weeds in narrow-row soybeans. Agron J 69:793-
796
Chandler K, Shrestha A, Swanton CJ (2001) Weed seed return as influenced by the critical
weed-free period and row spacing of no-till glyphosate-resistant soybean. Plant Sci
81:877-672
Dally CD, Kells JJ, Renner KA (2004) Effect of glyphosate application timing and row spacing
on corn (Zea mays) and soybean (Glycine max) yields. Weed Technol 18:165-176
Edwards JT, Purcell LC (2005) Light interception and yield response of ultra-short-season
soybean to diphenylether herbicides in midsouthern United States. Weed Technol
19:168-175
Frans RE, Talbert RE, (1977) Design of field experiments and the measurement and analysis of
plant responses B. Truelove, Research Methods in Weed Science, Southern Weed
Science Society, Auburn, TX, pp. 15-23
Gallagher RS, Cardina J (1998) Phytochrome-mediated Amaranthus germination I: effect of seed
burial and germination temperature. Weed Sci 46:48–52
Gardner FP, Pearce RB, Mitchell RL (1985) Physiology of Crop Plants. Ames, Iowa: Iowa State
Press Pp 31-56
Gillespie AR, Allen HL, Vose JM (1994) Amount and vertical distribution of foliage of young
loblolly pine trees as affected by canopy position and silvicultural treatment. Can J For
Res 24:1337-1344

118
Harder DB, Sprague CL, Renner KA (2007) Effect of soybean row width and population on
weeds, crop yield, and economic return. Weed Technol 21:744-752
Harris JR, Gossett BJ, Murphy TR, Toler JE (1991) Response of broadleaf weeds and soybeans
to the diphenylether herbicides. J Prod Agric 4:407–411
Heap IM (2018). The International Survey of Herbicide Resistant Weeds.
http://www.weedscience.com Accessed December 2, 2018
Huang S (1993) Light intensity, row spacing, and photoperiod effects on expression of brachytic
stem in soybean. Crop Sci 33:29–37
Jha P, Norsworthy JK (2009) Soybean canopy and tillage effects on emergence of Palmer
amaranth (Amaranthus palmeri) from a natural seed bank. Weed Sci 57:644-651
Kapusta G, Jackson LA, Mason DS (1986) Yield response of weed-free soybeans (Glycine max)
to injury from postemergence broadleaf herbicides. Weed Sci 34:304–307
Mallory‐Smith C A, Thill D C, Dial M J (1990) Identification of sulfonylurea herbicide‐resistant
prickly lettuce (Lactuca serriola). Weed Technol 4:163–168
Mavo CM, Horak, MJ, Peterson DE, Boyer JE (1995) Differential control of four Amaranthus
species by six postemergence herbicides in soybean (Glycine max). Weed Technol 9:141-
147
Nelson KA, Renner KA (1997) Weed management in wide- and narrow- row glyphosate-
resistant soybean. J Prod Agric 12:460-465
Nelson KA, Renner KA (2001) Soybean growth and development as affected by glyphosate and
postemergence herbicide tank mixtures. Agron J 93:428-434.
doi:10.2134/agronj2001.932428x
Nice GR, Buehring NW, Shaw DR (2001) Sicklepod (Senna obtusifolia) response to shading,
soybean (Glycine max) row spacing, and population in three management systems, Weed
Technol 15:155-162
Niekamp JW, Johnson WG, Smeda RJ (1999) Broadleaf weed control with sulfentrazone and
flumioxazin in no-tillage soybean (Glycine max). Weed Technol 13:233–238
Norsworthy JK, Griffith GM, Scott RC, Smith KL, Oliver LR (2008) Confirmation and control
of glyphosate-resistant Palmer amaranth (Amaranthus palmeri) in Arkansas. Weed
Technol 22:108–113
Norsworthy JK, Ward, SM, Shaw DR, Llewellyn R, Nichols RL, Webster TM, Bradley K
W, Frisvold G, Powles SB, Burgos NR, Witt W, Barrett M (2012) Reducing the risks of

119
herbicide resistance: Best management practices and recommendations. Weed
Sci 60 (Special Issue I):31–62
Norsworthy, JK (2004) Conventional soybean plant and progeny response to glyphosate. Weed
Technol 18:527–531
Saari LL, Cotterman J C, Primiani M M (1990) Mechanism of sulfonylurea herbicide resistance
in the broadleaf weed, Kochia scoparia. Plant Physiol 93:55–61
Salas RA, Burgos NR, Tranel PJ, Singh S, Glasglow L, Scott RC, Nichols RL (2016) Resistance
to PPO-inhibiting herbicides in Palmer amaranth from Arkansas. Pest Mange Sci 72:864-
869
Shibles RM, Weber CR (1965) Leaf area, solar radiation interception and dry matter production
by soybeans. Crop Sci 5:575-578
Schwartz-Lazaro LM, Norsworthy JK, Steckel LE, Stephenson DO, Bish MD, Bradley KW,
Bond JA (2018) A midsouthern consultant’s survey on weed management practices in
soybean. Weed Technol 32:116-126
Varanasi VK, Brabham C, Norsworthy JK, Nie H, Young BG, Houston M, Barber T, Scott, RC
(2018) A statewide survey of PPO-inhibitor resistance and the prevalent target-site
mechanism in Palmer amaranth (Amaranthus palmeri) accessions from Arkansas. Weed
Sci 66:149–158
Whitaker JR, York AC, Jordan DL, Culpepper S (2010) Palmer amaranth (Amaranthus palmeri)
control in soybean with glyphosate and conventional herbicide systems. Weed
Technol 24:403–410
Yelverton FH, Coble HD (1991) Narrow row spacing and canopy formation reduces weed
resurgence in soybean (Glycine max). Weed Sci 25:73-78
Young BG, Young GM, Gonzini LC, Hart SE, Wax LM, Kapusta G (2001) Weed management
in in narrow- and wide-row glyphosate-resistant soybean (Glycine max). Weed Technol
15:112-121

120
APPENDIX
Table 1. Herbicides, formulations, and rates evaluated as well as manufacture and address. Herbicides are grouped by treatments as
they were applied in experiments.
Herbicide Rate Trade name Formulation Manufacturer Address g ai ha-1
Fomesafen
393
Flexstar®
1.88 L Syngenta
Greensboro, NC
S-metolachlor+
1,223
Prefix®
5.92 EC Syngenta
Greensboro, NC
fomesafen
269
Acifluorfen
560
Ultrablazer®
2 L United Phosphorous Inc.
King of Prussia, PA
S-metolachlor+
1,223
Prefix®
5.92 EC Syngenta
Greensboro, NC
fomesafen+
269
chlorimuron
9
Classic®
25 DF DuPont
Wilmington, DE
Glufosinate+
656
Liberty®
280 SL Bayer CropScience
Research Triangle Park, NC
fomesafen
393
Flexstar®
1.88 L Syngenta
Greensboro, NC
Glufosinate+
656
Liberty®
280 SL Bayer CropScience
Research Triangle Park, NC
S-metolachlor+
1,223
Prefix®
5.92 EC Syngenta
Greensboro, NC
fomesafen
269
Glufosinate+
656
Liberty®
280 SL Bayer CropScience
Research Triangle Park, NC
acifluorfen
560
Ultrablazer®
2 L United Phosphorous Inc.
King of Prussia, PA
Glufosinate +
656
Liberty®
280 SL Bayer CropScience
Research Triangle Park, NC
S-metolachlor+
1,223
Prefix®
5.92 EC Syngenta
Greensboro, NC
fomesafen+
269
chlorimuron
9
Classic®
25 DF DuPont
Wilmington, DE
Nontreated
--

121
Table 2. Results of the ANOVA conducted on soybean injury and relative yield are
displayed by p-values of all factors tested in the analysis.
Factors Soybean injury Relative yield
-------------------------- p-values -------------------------
Herbicide 0.0003 0.9864
Glufosinate addition 0.2190 0.9563
Herbicide X
glufosinate addition 0.0086 0.5637

122
Table 3. Percentage injury to soybean 2 weeks after
application as influenced by the interaction of herbicide
selection with and without the addition of glufosinate
averaged across site years.
a Means not represented with like letters inside the same
column are statistically different based on Fisher’s protected
LSD (α = 0.05).
Herbicide Rate Soybean injury
g ai ha-1 %
Fomesafen 393 15 b
S-metolachlor+ 1,223 12 bc
Fomesafen 269
Acifluorfen 560 14 bc
S-metolachlor+ 1,223
10 bc fomesafen+ 269
chlorimuron 9
Glufosinate+ 656 14 bc
fomesafen 393
Glufosinate+ 656
9 c S-metolachlor+ 1,223
fomesafen 269
Glufosinate+ 656 25 a
acifluorfen 560
Glufosinate + 656
11 bc S-metolachlor+ 1,223
fomesafen+ 269
chlorimuron 9
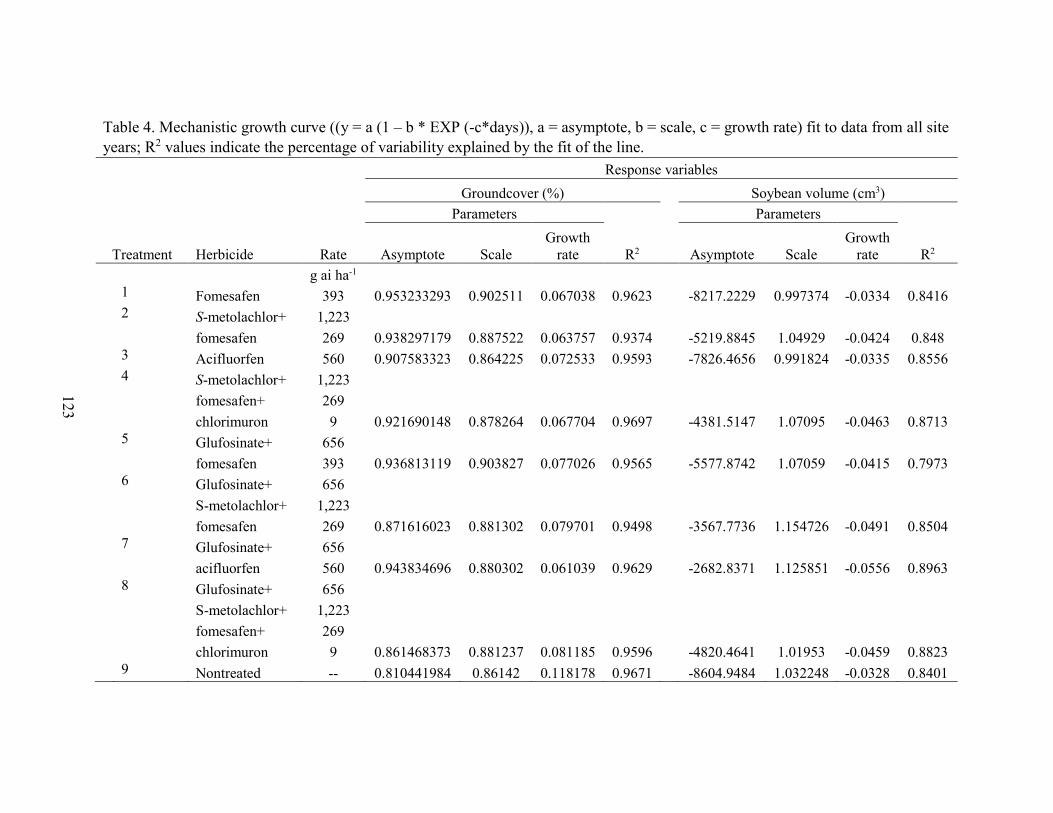
123
Table 4. Mechanistic growth curve ((y = a (1 – b * EXP (-c*days)), a = asymptote, b = scale, c = growth rate) fit to data from all site
years; R2 values indicate the percentage of variability explained by the fit of the line.
Response variables
Groundcover (%) Soybean volume (cm3)
Parameters Parameters
Treatment Herbicide Rate Asymptote Scale
Growth rate R2 Asymptote Scale
Growth rate R2
g ai ha-1
1 Fomesafen 393 0.953233293 0.902511 0.067038 0.9623 -8217.2229 0.997374 -0.0334 0.8416
2 S-metolachlor+ 1,223
0.938297179 0.887522 0.063757 0.9374
-5219.8845 1.04929 -0.0424 0.848 fomesafen 269
3 Acifluorfen 560 0.907583323 0.864225 0.072533 0.9593 -7826.4656 0.991824 -0.0335 0.8556
4 S-metolachlor+ 1,223
0.921690148 0.878264 0.067704 0.9697
-4381.5147 1.07095 -0.0463 0.8713
fomesafen+ 269
chlorimuron 9
5 Glufosinate+ 656
0.936813119 0.903827 0.077026 0.9565
-5577.8742 1.07059 -0.0415 0.7973 fomesafen 393
6 Glufosinate+ 656
0.871616023 0.881302 0.079701 0.9498
-3567.7736 1.154726 -0.0491 0.8504
S-metolachlor+ 1,223
fomesafen 269
7 Glufosinate+ 656
0.943834696 0.880302 0.061039 0.9629
-2682.8371 1.125851 -0.0556 0.8963 acifluorfen 560
8 Glufosinate+ 656
0.861468373 0.881237 0.081185 0.9596
-4820.4641 1.01953 -0.0459 0.8823
S-metolachlor+ 1,223
fomesafen+ 269
chlorimuron 9
9 Nontreated -- 0.810441984 0.86142 0.118178 0.9671 -8604.9484 1.032248 -0.0328 0.8401

124
a Number of days after a V2 herbicide application for soybean to reach 15,000 cm3 b 95% confidence interval of the mean number of days for soybean to reach 15,000 cm3
Table 5. Number of days required after herbicide application for soybean to reach volume of 15,000 cm3 based on inverse predictions using the mechanistic growth curve fit to soybean volume data.
Herbicide Rate Predicted days to 15,000 cm3
g ai ha-1 da Confidence limitsb
Fomesafen 393 17 12, 21
S-metolachlor+ 1,223
17
11, 22
Fomesafen 269
Acifluorfen 560 17 13, 22
S-metolachlor+ 1,223
17
12, 22
fomesafen+ 269
chlorimuron 9
Glufosinate+ 656
17
13, 20
fomesafen 393
Glufosinate+ 656
17
11, 22
S-metolachlor+ 1,223
fomesafen 269
Glufosinate+ 656
18
14, 22
acifluorfen 560
Glufosinate+ 656
17
13, 21
S-metolachlor+ 1,223
fomesafen+ 269
chlorimuron 9
Nontreated ----- 15 10, 20

125
a Number of days after a V2 application for soybean to reach 60% groundcover b 95% confidence interval of the mean number of days for soybean to reach 60% groundcover
c Number of days after a V2 application for soybean to reach 80% groundcover
d 95% confidence interval of the mean number of days for soybean to reach 80% groundcover
* Asterisk marks significant difference from the nontreated check.
Table 6. Number of days required after herbicide application for soybean to reach 60
and 80% groundcover based on inverse predictions using the mechanistic growth
curve fit to percent groundcover data.
Days to percent groundcover
Herbicide Rate 60% groundcovera 80% groundcoverc
g ai ha-1
d
Confidence limitsb
d
Confidence limitsd
Fomesafen 393 13 12, 15* 26 23, 28
S-metolachlor+ 1,223 14
12, 16*
28
24, 32 fomesafen 269
Acifluorfen 560 13 12, 14* 27 23, 31
S-metolachlor+ 1,223
14
12, 15*
28
25, 31 fomesafen+ 269
chlorimuron 9
Glufosinate+ 656 12
10, 14
24
21, 27 fomesafen 393
Glufosinate+ 656
13
11, 15
30
24, 35 S-metolachlor+ 1,223
fomesafen 269
Glufosinate+ 656 15
13, 16*
29
25, 32 acifluorfen 560
Glufosinate + 656
13
12, 15*
31
24, 38
S-metolachlor+ 1,223
fomesafen+ 269
chlorimuron 9
Nontreated na 10 9, 11 22 19, 26

126
Table 7. Soybean yield relative to the nontreated, averaged
across all three site years.
Herbicide Rate Relative yielda
g ai ha-1 %
Fomesafen 393 102
S-metolachlor+ 1,223
99
fomesafen 269
Acifluorfen 560 105
S-metolachlor+ 1,223
105
fomesafen+ 269
chlorimuron 9
Glufosinate+ 656
102
fomesafen 393
Glufosinate+ 656
102
S-metolachlor+ 1,223
fomesafen 269
Glufosinate+ 656
101
acifluorfen 560
Glufosinate + 656
101
S-metolachlor+ 1,223
fomesafen+ 269
chlorimuron 9
a – Yield relative to the nontreated check; no significant
difference at or among site years was observed. Yield of the
nontreated averaged 3, 985 kg ha-1.

127
Figure 1. Mechanistic growth curve ((y = a (1 – b * EXP (-c*days)) where a = asymptote, b =
scale, and c = growth) to estimate percentage soybean groundcover following fomesafen applied
to V2 soybean with and without glufosinate relative to nontreated soybean as a function of days
after application over three site years. Parameter estimates for each line are found in Table 4.
0
10
20
30
40
50
60
70
80
90
100
0 10 20 30 40 50
Gro
undco
ver
(%
)
Days
with glufosinate without glufosinate nontreated

128
Figure 2. Mechanistic growth curve ((y = a (1 – b * EXP (-c*days)) where a = asymptote, b =
scale, and c = growth) to estimate percentage soybean groundcover following fomesafen + S-
metolachlor applied to V2 soybean with and without glufosinate relative to nontreated soybean
as a function of days after application over three site years. Parameter estimates for each line are
found in Table 4.
0
10
20
30
40
50
60
70
80
90
100
0 10 20 30 40 50
Gro
undco
ver
(%
)
Days
with glufosinate without glufosinate nontreated

129
Figure 3. Mechanistic growth curve ((y = a (1 – b * EXP (-c*days)) where a = asymptote, b =
scale, and c = growth) to estimate percentage soybean groundcover following fomesafen + S-
metolachlor + chlorimuron applied to V2 soybean with and without glufosinate relative to
nontreated soybean as a function of days after application over three site years. Parameter
estimates for each line are found in Table 4
0
10
20
30
40
50
60
70
80
90
100
0 5 10 15 20 25 30 35 40 45
Gro
undco
ver
(%
)
Days
with glufosinate without glufosinate nontreated
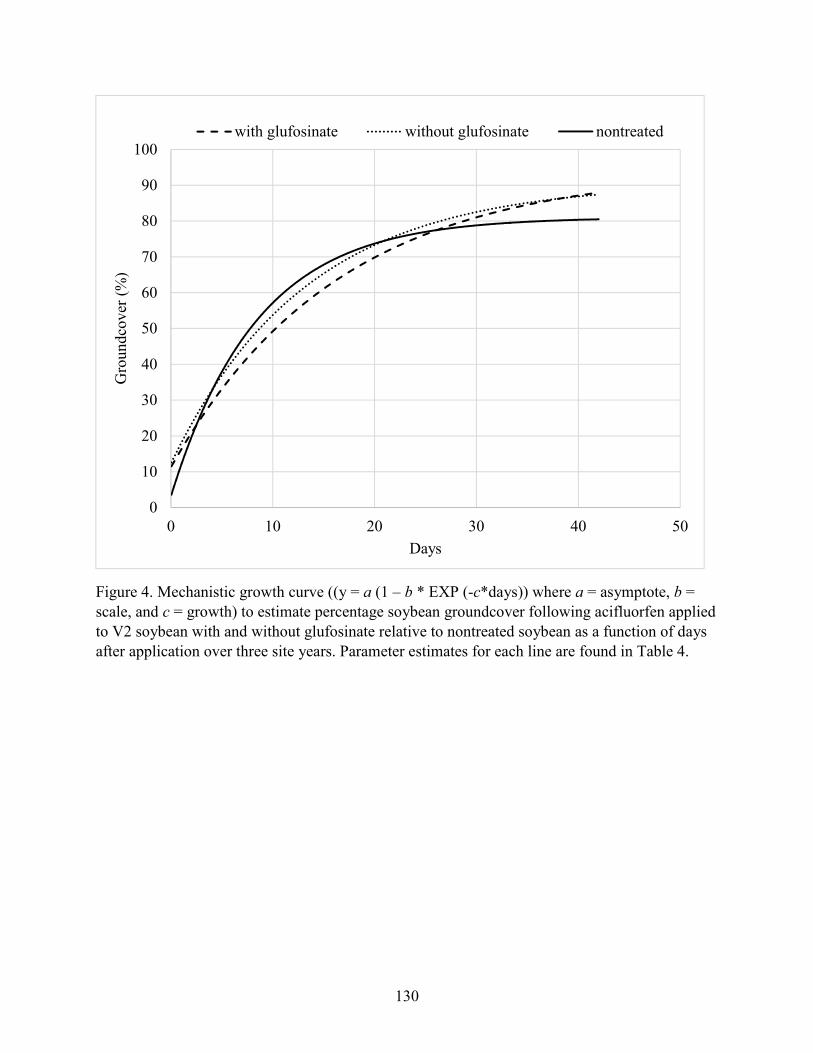
130
Figure 4. Mechanistic growth curve ((y = a (1 – b * EXP (-c*days)) where a = asymptote, b =
scale, and c = growth) to estimate percentage soybean groundcover following acifluorfen applied
to V2 soybean with and without glufosinate relative to nontreated soybean as a function of days
after application over three site years. Parameter estimates for each line are found in Table 4.
0
10
20
30
40
50
60
70
80
90
100
0 10 20 30 40 50
Gro
undco
ver
(%
)
Days
with glufosinate without glufosinate nontreated

131
General Conclusion
The need for integrating weed control methods is evident as there is an increase in multiple
herbicide-resistant weeds in U.S. cropping systems, and likewise, an increase in selection placed
on weed populations by the remaining effective herbicides. To reduce weed emergence and
mitigate the risk of evolution of herbicide-resistant weeds, early-season crop canopy formation
has been advocated. Field experiments were conducted to evaluate whether: 1) soybean injury
caused by metribuzin or flumioxazin delayed canopy formation or changed the incidence of
pathogen colonization; 2) residual herbicides applied preplant reduced the potential for soybean
injury and achieved the same longevity of weed control as herbicides applied at planting; 3)
postemergence-applied acetolactate synthase- and protoporphyrinogen oxidase-inhibiting
herbicides alone and in combination with glufosinate delayed canopy formation or impacted
grain yield. In general, few interactions between herbicide and soil-borne pathogens were
observed. Observations from multiple experiments conveyed that injury from preemergence-
residual herbicides and postemergence-foliar herbicides delayed early season canopy formation.
However, it was also observed that selecting tolerant-soybean cultivars mitigated soybean injury
from flumioxazin and metribuzin applications and a subsequent a delay in canopy formation did
not occur. Soybean injury was also reduced by applying preemergence-residual herbicides 14-
days prior to planting. No reduction in longevity of weed control was observed when herbicides
with a half-life of greater than 70-days were applied 14-day prior to planting when compared to
applications at planting. To mitigate herbicide injury to soybean and the likewise lengthening the
period of weed emergence, tolerant soybean varieties should be selected, or if using a sensitive
variety, preemergence-residual herbicides may be applied 14-days prior to planting.