Mistakes in Applying Computational Fluid · PDF fileMistakes in Applying Computational Fluid...
69
Mistakes in Applying Computational Fluid Dynamics Professor W.K. Chow Fellow, Hong Kong Academy of Engineering Sciences Chair Professor of Architectural Science and Fire Engineering Director, Research Centre for Fire Engineering Head of Department, Department of Building Services Engineering The Hong Kong Polytechnic University, Hong Kong, China Founding President, Society of Fire Protection Engineers – Hong Kong Chapter President, Asia-Oceania Association for Fire Science and Technology CPD14-2e.ppt CPD Lecture Room Z2-003 7:00 – 8:00 pm, 31 July 2014
Transcript of Mistakes in Applying Computational Fluid · PDF fileMistakes in Applying Computational Fluid...

Mistakes in Applying Computational Fluid Dynamics
Professor W.K. Chow Fellow, Hong Kong Academy of Engineering Sciences
Chair Professor of Architectural Science and Fire Engineering
Director, Research Centre for Fire Engineering
Head of Department, Department of Building Services Engineering
The Hong Kong Polytechnic University, Hong Kong, China
Founding President, Society of Fire Protection Engineers – Hong Kong Chapter
President, Asia-Oceania Association for Fire Science and Technology
CPD14-2e.ppt
CPD Lecture Room Z2-003 7:00 – 8:00 pm, 31 July 2014

2
Topics Covered
1. Introduction
2. Heat Release Rate
3. Free Open Boundary Condition
4. Functional Analysis
5. Grid Size Variation
6. Example Cases: Time Line Analysis
7. Observations
8. Recommendations
9. Conclusion

3
1. Introduction

4
With the rapid development of economics in the Far
East, many big construction projects were found.
The new designs have difficulties to comply with the
fire codes.
Performance-based design (PBD) was then applied
to determine fire safety provisions, particularly for
underground subway stations in urban areas
without much space.
Cost reduction is another key reason in using PBD.

5
Resources limitation: Free software of
Computational Fluid Dynamics (CFD) was applied
in hazard assessment in many construction projects.
No full-scale burning tests were carried out to
justify the CFD predicted results.
The free CFD software Fire Dynamics Simulator
(FDS) is commonly used to study fire-driven fluid
flow.
It was developed by National Institute of Standards
and Technology (NIST) and frequently used in
solving practical fire problems.

6
Authorities having jurisdictions (AHJ) are now
more knowledgeable in fire science and engineering.
Many officers are well-trained and possess a master
degree in fire engineering.
CFD Results are starting to be challenged.
Many new project submissions based on CFD for
fire hazard assessment were NOT approved.

Some validation works:
7

Bad
8

Good
9
10
Problems identified by fire officers in using CFD in
the Far East are:
Mainly accepted for smoke control design, many
doubts on fire simulation such as open kitchen in
small residential flats of very tall buildings and
wood houses.
FDS was commonly used, but not yet justified for
application in huge space with tall halls such as
public transport interchanges.
Air pressure, turbulence parameters seldom
presented.
Full-scale burning tests on typical scenarios with
similar conditions are necessary.

11
Similar criticisms for journal papers reviewing raised
by fire research workers on CFD results are:
Application to simulate fire needs to watch because
fire phenomena are substantially three-dimensional
and very unstable in the flow and temperature fields
of the buildings concerned.
Three-dimensionality and instability of the fire-
induced flow fields are not fully discussed.
Ability of CFD to resolve the flow in the turbulent
fire plume.
Ability of CFD to resolve the turbulent exchange
flow through the opening.

12
Although consulting engineers believe in such CFD-
FDS predictions, a very tight inspection scheme was
implemented on new project applications based on
CFD.
Hot smoke tests required in atria of irregular shape
or taller than 12 m in some places.

13
Common mistakes made in PBD projects with
railway and subway systems based on CFD as
pointed out by different parties including fire
research workers, users, fire officers and journal
paper reviewers will be discussed in this
presentation.

14
2. Heat Release Rate

15
In fire safety design, the most important parameter
is the heat release rate (HRR), which is the single
most important variable in characterizing the
“flammability” of products and their consequent
fire hazard.
It gives information on fire size, fire growth rate,
available egress time and suppression system
impact.
The potential for ignition of nearby items, flashover
potential in a room, and the amount of water
needed to extinguish the fire can be estimated.
The evolution of HRR with time becomes the most
important input variable which must be estimated
properly for fire simulations.
16
Heat release rate of burning an object in the
enclosure should be agreed carefully in fire hazard
assessment.
Normally, only a small accidental fire was assumed
to break out in an empty enclosure.
Design Fire Down to 0.5 MW in a Railway Hall
years ago !

17
Apple Daily 29 Jan 2011
Train cars as an example.
Beware of low values, say up to 6.5 MW for train
car was originally proposed even in the draft
version of the new fire safety (FS) code of Hong
Kong.
In Hong Kong, there are many parallel traders in
some stations.

18
Pointed out by Chow well before 2004 that
combustible luggage should be reduced:
W.K. Chow, “Fire safety in train vehicle: Design based on
accidental fire or arson fire?”, The Green Cross,
March/April, 7 pages (2004).

19
Now up to 20 MW, good enough ?
At least 35 MW by SP recently !
Code of Practice for Fire Safety in
Buildings April 2012

20
SP Report 2011: Scale model studies !

February 2014
New works on train fires by Ingason, SP
21

22
3. Free Open Boundary Condition

23
In applying CFD to building fire hazard assessment,
there are always windows and doors open to outside.
Bi-directional air flows were observed in
experimental studies, with hot gas flowing out and
cool air coming into the room.
The boundary conditions of the flow parameters,
particularly pressure, have to be specified carefully.
There are empirical correlations relating the
pressure profiles across the vertical openings such as
windows or doors, under different room geometries,
heat release rates of the fires, and opening sizes.

24
In FDS simulations, the opening boundary
condition was taken as a passive opening to the
outside like a door or window.
An OPEN boundary was set on the exterior
boundary of the computational domain.
The outflow of opening boundary condition for the
momentum equation was determined by simplifying
the pressure in terms of the velocity vector, pressure
perturbation and density.
pp
~
2
2
u

The pressure is set to the ambient pressure by the
user, which is defaulted to zero.
p~
Outflow
Inflow
Inside
Outside
Neutral plane
Velocity profile on the free boundary
25

26
For inflow, the fluid element on the boundary has
been assumed to be accelerating from the state
along a streamline.
The flow field was calculated by Bernoulli
equation.
It assumes that pressure is zero infinitely far
away.
At the boundary between two grids, the pressure
boundary condition is similar to that at an
external open boundary.

27
But pressure is taken from the adjacent grid
where the flow is incoming.
Outflow and inflow are separately set on the
opening vent.
This cannot simulate the real free boundary
condition because the position of neutral plane
cannot be determined.
Such boundary conditions might not give proper
specification.
A better approach is to extend the computing
domains outside.
Some pioneering work on fire modelling
demonstrated that the flow pattern in the vicinity of
doorway was entirely different if the free boundary
had not been extended sufficiently.
Markatos and co-workers (1984) extended the flow
domain to the ‘free boundary’ region outside the
doorway when studying the smoke flow in
enclosures and obtained results that agreed
reasonably with experimental data.
Markatos N.C. and Cox G., “Hydrodynamics and Heat Transfer in enclosures
containing a fire source,” PCH PhysicoChemical Hydrodynamics, 5 (1984)
53-66.
28
29
Galea and associates (1994) pointed out in their
case study on simulating fire development in an
aircraft that it is desirable to extend the solution
domain outside the fire compartment in order to
find physically realistic behaviour in the vicinity
of the open doors.
Mawhinney R.N., Galea E.R., Hoffmann N. and Patel M.K., “A critical
comparison of a PHOENICS based fire field model with experimental
compartment fire data”, Journal of Fire Protection Engineering, 6 (1994)
137-152.

30
Schaelin and co-workers (1992) pointed out that
extending the computing domains outside was a
better approach when simulating plume flow.
Schaelin A., van der Maas J. and Moser A., “Simulation of airflow through
large openings in buildings”, Proceedings of the ASHRAE Winter Meeting,
Anaheim, Calif, USA pp. 319-328, January 1992.

Schaelin A., van der Maas J. and Moser A. (1992), “Simulation of airflow through
large openings in buildings” ASHRAE Transactions, Vol. 98, No. 2, pp. 319-328.
Need to extend
very far to
outside
31

32
In applying FDS, Hadjisophocleous and Ko (2009)
suggested that the impact of the open boundary at
the exterior of the computational domain was
minor when the boundary had been extended up
to 2 m outside a geometry of width 10 m.
Therefore, it may not be necessary to extend the
computational domain to some distance beyond
the opening to obtain good results while using
FDS version 4.07.
They also pointed out that this situation is rather
complicated and should be evaluated for different
cases.
Hadjisophocleous G. and Ko Y.J., “Impact of various parameters on the CFD
predictions of atrium smoke management systems”, ASHRAE Transactions
115 Part 1 (2009) 263-270.

A Local Example
Chow and Chow (2009)
A 5-level glass façade geometry of 15 m tall.
A fire was located in a compartment at level 3 with
heat release rate 1 MW or 5 MW.
The glass was broken with hot gases spreading out.
The computing domain was extended to 4 m outside.
The computing domain was divided into 80 by 40 by
120 or 384,000 parts.
Chow C.L. and Chow W.K., “A brief review on applying computational fluid
dynamics in building fire hazard assessment,” A Chapter in Fire Safety, I.
Søgaard and H. Krogh (Eds.), Nova Science Publishers, 2009.
33

Free boundary
Fire
6 m
10 m
3 m
3 m
3 m
3m
3m
1 m
1 m
6 m
1 m
(a) Elevation (b) End view
The geometry of a glass façade
34

(a) Initial (b) Intermediate (c) Steady
Velocity vectors for 1 MW fire with 4 m only outside
Results cut at here
35
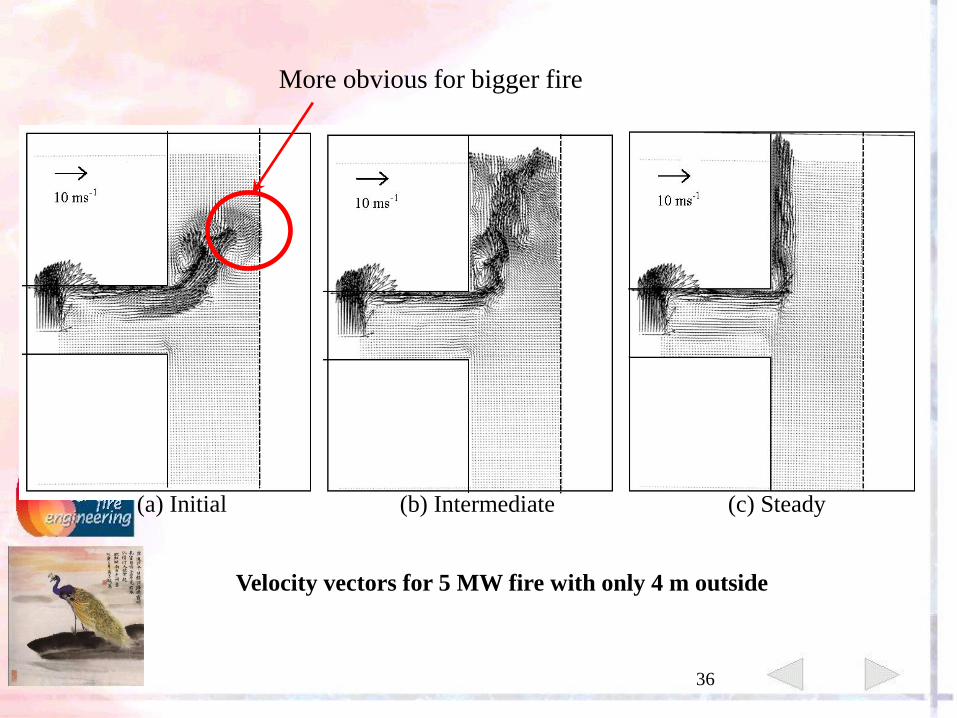
(a) Initial (b) Intermediate (c) Steady
Velocity vectors for 5 MW fire with only 4 m outside
More obvious for bigger fire
36

(a) Initial (b) Intermediate (c) Steady
Velocity vectors for 1 MW fire with 20 m outside
37
The computing domain was extended further by 20
m, having three times of the original grid size.
All free
In comparing with the case by extending out by 20 m
more, the flow pattern of the entire window flame.
Note that the steady state results would be very
different as shown in these figures.
Higher heat release rates would give a longer range,
need to extend to longer distance away.
38

(a) Initial (b) Intermediate (c) Steady
Velocity vectors for 5 MW fire with 20 m outside
Long enough !
39

40
4. Functional Analysis

PM
P
M
PM
2 parameters
41
In order to quantify this comparison precisely,
functional analysis proposed on zone modeling
was applied to evaluate the CFD results.

42
Transient predicted and measured data are
expressed as vectors and .
The Euclidean norm and secant inner product
cosine between and are calculated:
Norm =
Cosine =
M
P
P
M
P
MP
MP
MP
Values of norm and cosine are used to compare
CFD predicted results with measured data.
Values of norm should be 0, and cosine should be
close to 1 for good agreement.

43
5. Grid Size Variation

Grid size denoted by x, y and z is the most
important numerical parameter in CFD simulations.
Quality of the mesh was assessed by a non-
dimensional parameter rather than an absolute mesh
cell size.
For simulations involving buoyant plumes, a
measure of how well the flow field is resolved is given
by the non-dimensional expression on R*:
*
* ),,max(
D
zyxR
44

The nominal size of the mesh cell δx and the
characteristic fire diameter D* given by fire power ,
air density , temperature T , specific heat of air
cp , and gravitational acceleration g are important in
simulating buoyant plumes:
Q
5/2
*
gTc
QD
p
45

46
The ratio D*/δx can be taken as the number of
computational cells spanning the characteristic
diameter of the fire.
A refined grid system can improve the accuracy of
results of LES.
It was suggested that the value of D*/δX should be
larger than 10 to guarantee a reliable operation of
FDS.
Zou and Chow got reasonable FDS predictions of
temperature and radiation data with D*/δX of
about 14.
Study by Hietaniemi et al. on pool fire showed
that having at least 20 cells within the diameter of
the pool would give predictions agreed with
experiments.

47
Validation study given by Hill et al. suggests that
R* should be between 0.06 to 0.25.
It is also found that the optimum resolution of a
pool fire simulation R* is around 0.05 by Ma and
Quintiere, the centerline temperature and velocity
in the non-combusting region is also predicted
well.
However, for the non-combustion flow field
prediction, FDS did not give any suggestion about
the grid size.

48
6. Example Cases: Time Line
Analysis
49
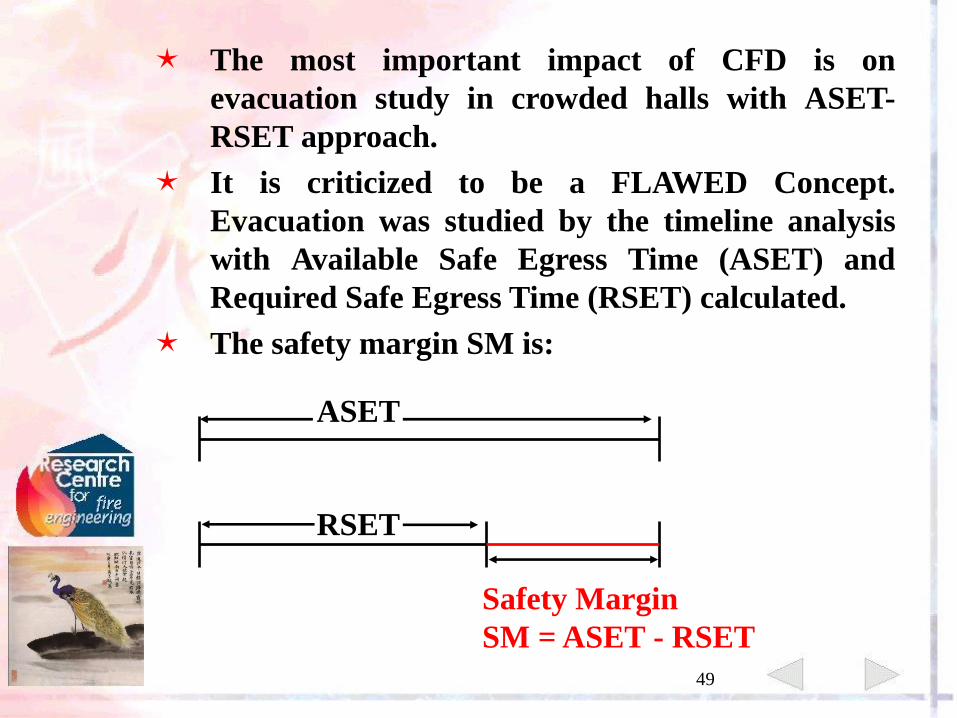
The most important impact of CFD is on
evacuation study in crowded halls with ASET-
RSET approach.
It is criticized to be a FLAWED Concept.
Evacuation was studied by the timeline analysis
with Available Safe Egress Time (ASET) and
Required Safe Egress Time (RSET) calculated.
The safety margin SM is:
ASET
RSET
Safety Margin
SM = ASET - RSET

50
Problems identified in Southeast Asia in projects on
estimating ASET are:
Predicted by CFD fire models, with very few
Validation & Verification works for large halls.
Small fire scenarios without experimental
justification.
Seldom used big fires.
Other toxicants, irritants and asphyxiants were not
yet specified because there is no fire engineering tool
available to predict the chemical species liberated
from combustion accurately.
There are far too many chemical reactions involved
in the burning process.

(in fire retardants)
Sensory irritation
– Irritation of eyes
Pulmonary irritation
– Upper respiratory tract
– coughing
Smoke Toxicant
Smoke toxicants
Asphyxiants Irritants
CO HCN CO2 HBr Halogen acid Organic
HCl Acrolein Central nervous system
depression
Loss of consciousness
Ultimately death
51

52
Tenability limits commonly used (following partly
CIBSE Guide E 2010 are:
Lift safety for occupants and firemen
Radiative heat flux: 2.5 kWm-2
Smoke layer temperature: 120 oC
Smoke layer interface height: 2.5 m
Carbon monoxide concentration [CO]: 6000 to
8000 ppm for 5 minutes exposure
Toxicity effect of many toxic gases such as
hydrogen chloride HCl is very severe.
Neglecting them will give problems in estimating
ASET.

53
Again, only heat and [CO] are specified.
All heat and toxic gases are assumed to be within
the stratified smoke layer at high levels.
This would not hold for tall atria.
These approaches are only applicable for those
fuels emitting only carbon monoxide upon
burning.
If toxicity of fire gases is included in the
tenability limit, ASET is highly reduced.

54
Such problems were even found in the draft new
code on building fire safety issued by the Hong
Kong authority for consultation in September
2011, and implemented in April 2012.
Code of Practice for Fire Safety in
Buildings April 2012

55
7. Observations

56
The following problems were identified in using CFD
for Fire Engineering Approach (or known as
performance-based design elsewhere) in determining
fire safety provisions.
Air pressure and turbulence parameters are
seldom presented, and only the velocity vector
patterns and temperature distribution are shown.
Grid sensitivity criteria are only deduced from
temperature and velocity predictions, but not
pressure or turbulence parameters.
There is no justification on fire phenomena by
scale-models or full-scale burning tests.

57
The following criticisms were raised in applying CFD
for fire simulations:
All phenomena are substantially three-
dimensional; the flow and temperature fields of
the smoke exhaust in the hall are very unstable.
The three-dimensionality and the instability of the
flow fields are not fully discussed.
Ability of CFD to resolve the flow in the turbulent
fire plume is in doubt.
Uncertainty in the ability of CFD to resolve the
turbulent exchange flow across the opening.

58
8. Recommendations

59
The ‘stability criteria’ and ‘free boundary
conditions’ must be inspected in CFD reports.
There are always windows and doors in a
building. Bi-directional flow would be resulted,
with hot gas flowing out and cool air coming into
the room.
The boundary conditions of flow parameters,
pressure in particular, have to be specified
carefully to predict such bi-directional flow.
There are empirical correlations among the
pressure profiles across the vertical openings such
as windows or doors, and room geometries, heat
release rates of the fires, and opening sizes.

60
However, the empirical parameters might not be
appropriate for the boundary conditions of the
particular room fire.
From the results of this project, a better approach
is to extend the computing domain outside as
reported in the above study.

61
More caution is needed in the application of CFD
to simulate phenomena in a building fire.
Therefore, CFD might only be good for practical
smoke control design in big halls to avoid putting
in fire simulation.
Full-scale burning tests on typical scenarios with
similar conditions are still necessary to justify the
CFD predictions.
Hot smoke tests must be carried out during the
testing and commissioning of smoke exhaust
system in tall halls.

62
The following should be justified in the CFD
simulations in construction project submission:
The three groups of parameters on physical
models, numerical parameters and physical
systems in the CFD models should be watched.
Details of the grid systems. Note that in a large
airport terminal, a 10 m grid means that velocity
and temperature are the same within 10 m.
The convergence and stability criteria, turbulent
parameters.

63
The boundary conditions on velocity components,
pressure and temperature.
The extension of free boundaries to outside
domain.
The prediction and presentation in the following
three groups [18] should be evaluated:
- Velocity-temperature
- Pressure
- Turbulent parameters
Justification on the above three groups of CFD
predictions by empirical formula and analytical
expressions.
Experiments on scale models of the building to
compare with CFD predictions.
In-situ field tests to evaluate the system
performance.

64
The following should be discussed in fire hazard
assessment reports using CFD:
The choice of grid that gives suitably grid-
independent results.
The location of the external boundary conditions
that influence the predictions.
Quality control checks for the CFD predictions to
give details of :
- exchange flow
- neutral pressure planes
Experimental verification using data from full-
scale burning tests.

65
9. Conclusion
66
Consulting engineers pushed hard to promote the
use of CFD, and always believe in the CFD-FDS
predictions.
However, in-depth verification and validation
work is necessary.
Free opening boundary condition should be
evaluated before applying in CFD simulations,
especially when the combustion process is included
while simulating fires in tall or supertall buildings.
Extending the computational domain to a
sufficient distance beyond the opening is
recommended.

67
Further related work on validation and
verification of liquid fuel model in FDS should be
conducted.
As raised by Chen (2009) on indoor aerodynamics,
it is difficult to have the whole set of CFD
predicted results agreed with experiments.
Macroscopic flow parameters predicted by CFD
are very useful.
Chen Q., “CFD for simulating air distribution in buildings: The state of the
art, challenges, and opportunities”, Proceedings of the 11th International
Conference on Air Distribution in Rooms (ROOMVENT 2009), 24-27 May
2009, Busan, Korea, pp. 23-31.

68
Note that different results were predicted by
different CFD software packages.
Further, strongly buoyant flow should be
predicted more carefully.
It is useful to compare the prediction with the
Reynolds Averaged Navier Stokes equation
method (RANS).
However, this is quite labour intensive to develop
a new CFD software and very expensive to
purchase commercial CFD license.
Earlier studies on thermal plume suggested that
results are similar.

69
Acknowledgment
This work described in this presentation was partially
supported by the Construction Industry Institute (Hong
Kong) / PolyU Innovation Fund for the project “Assessment
of a fire model in simulating combustion for construction
projects with fire engineering approach”.