MIST: Severity of Dependence Scale (SDS) Validity of the...
17
Downloaded By: [Universidad de Sevilla] At: 08:46 17 June 2008 Substance Use & Misuse, 43:919–935 Copyright © 2008 Informa Healthcare USA, Inc. ISSN: 1082-6084 (print); 1532-2491 (online) DOI: 10.1080/10826080701801543 MIST: Severity of Dependence Scale (SDS) Validity of the Severity of Dependence Scale (SDS) Construct Applying the Item Response Theory to a Non-Clinical Sample of Heroin Users FRANCISCO GONZ ´ ALEZ-SAIZ, 1 ´ OSCAR M. LOZANO, 1,2 ROSARIO BALLESTA, 1 TERESA SILVA, 3 MARIA TERESA BRUGAL, 4 IZASKUN BILBAO, 1 GREGORIO BARRIO, 5 ANTONIA DOMINGO-SALVANY, 6 MARIA JOSE BRAVO, 5 LUIS DE LA FUENTE, 3 AND GRUPO DEL PROYECTO IT ´ INERE 1,∗ 1 Fundaci´ on Andaluza para la Atenci ´ on a las Drogodependencias, Sevilla, Spain 2 Universidad de Huelva, Spain 3 Centro Nacional de Epidemiolog´ ıa, Instituto de Salud Carlos III, Madrid, Spain 4 Agencia de Salut Publica, Barcelona, Spain 5 Universidad Complutense de Madrid, Madrid, Spain 6 Unidad de Investigaci´ on en Servicios Sanitarios, Institut Municipal d’Investigaci´ o M` edica (IMIM), Barcelona, Spain Aims: The purpose of this work is to study the validity of the Severity of Dependence Scale (SDS) construct by applying Rasch models to a non-clinical sample of heroin abusers. Subjects: 982 (73% men) young people 30 years old or under (mean age 25.9 years) participated. All of them were captured from the community in the metropolitan areas of Madrid, Barcelona and Seville, between April 2002 and December 2003. Analysis: Dimensionality of the scale and calibration of items were studied using the Rating Scale model, which is a Rasch-type model. A factorial analysis was also performed to check the dimensionality of the scale. Results: The analysis of fit shows that all the items have infit and outfit values between ±2 logits, indicating that the data fit the model and that it may be assumed to be unidimensional. The principal components analysis also showed Address correspondence to Dr. Francisco Gonz´ alez-Saiz, Fundaci ´ on Andaluza para la Atenci ´ on a las Drogodependencias, Avda. Hytasa, Ed. Toledo II, Plt. 3, oficina 3. 41006, Seville, Spain. E-mail: [email protected] This study was mainly financed by the Fundaci´ on para Investigaci´ on y la Prevenci´ on del SIDA, FIPSE 3035/99 Project. It also received support for specific research from Redes Tem´ aticas de In- vestigaci´ on Cooperativa (C03-09 y G03-005), Fondo de Investigaci´ on Sanitaria (FIS 00/1017, FIS 01/0908), and the Delegaci´ on del Gobierno para el Plan Nacional sobre Drogas. ∗ The It´ ınere Project Group is made up of the authors mentioned above and: Sof´ ıa Ruiz, David Fern´ andez, Mireia Ambr´ os Hortensi, Daniel Lacasa, Angels Llorens, Eusebio Mej´ ıas, Montserrat Neira, Jos´ e Pulido, Luis Royuela, Fernando S´ anchez, Fernando Vallejo, and Nuria Vall´ es. 919
Transcript of MIST: Severity of Dependence Scale (SDS) Validity of the...

Dow
nloa
ded
By:
[Uni
vers
idad
de
Sev
illa]
At:
08:4
6 17
Jun
e 20
08
Substance Use & Misuse, 43:919–935Copyright © 2008 Informa Healthcare USA, Inc.ISSN: 1082-6084 (print); 1532-2491 (online)DOI: 10.1080/10826080701801543
MIST: Severity of Dependence Scale (SDS)
Validity of the Severity of Dependence Scale (SDS)Construct Applying the Item Response Theory to a
Non-Clinical Sample of Heroin Users
FRANCISCO GONZALEZ-SAIZ,1OSCAR M. LOZANO,1,2
ROSARIO BALLESTA,1 TERESA SILVA,3
MARIA TERESA BRUGAL,4 IZASKUN BILBAO,1
GREGORIO BARRIO,5 ANTONIA DOMINGO-SALVANY,6
MARIA JOSE BRAVO,5 LUIS DE LA FUENTE,3
AND GRUPO DEL PROYECTO ITINERE1,∗
1Fundacion Andaluza para la Atencion a las Drogodependencias, Sevilla, Spain2Universidad de Huelva, Spain3Centro Nacional de Epidemiologıa, Instituto de Salud Carlos III, Madrid, Spain4Agencia de Salut Publica, Barcelona, Spain5Universidad Complutense de Madrid, Madrid, Spain6Unidad de Investigacion en Servicios Sanitarios, Institut Municipald’Investigacio Medica (IMIM), Barcelona, Spain
Aims: The purpose of this work is to study the validity of the Severity of Dependence Scale(SDS) construct by applying Rasch models to a non-clinical sample of heroin abusers.Subjects: 982 (73% men) young people 30 years old or under (mean age 25.9 years)participated. All of them were captured from the community in the metropolitan areasof Madrid, Barcelona and Seville, between April 2002 and December 2003. Analysis:Dimensionality of the scale and calibration of items were studied using the Rating Scalemodel, which is a Rasch-type model. A factorial analysis was also performed to checkthe dimensionality of the scale. Results: The analysis of fit shows that all the items haveinfit and outfit values between ±2 logits, indicating that the data fit the model and that itmay be assumed to be unidimensional. The principal components analysis also showed
Address correspondence to Dr. Francisco Gonzalez-Saiz, Fundacion Andaluza para la Atenciona las Drogodependencias, Avda. Hytasa, Ed. Toledo II, Plt. 3, oficina 3. 41006, Seville, Spain. E-mail:[email protected]
This study was mainly financed by the Fundacion para Investigacion y la Prevencion del SIDA,FIPSE 3035/99 Project. It also received support for specific research from Redes Tematicas de In-vestigacion Cooperativa (C03-09 y G03-005), Fondo de Investigacion Sanitaria (FIS 00/1017, FIS01/0908), and the Delegacion del Gobierno para el Plan Nacional sobre Drogas.
∗The Itınere Project Group is made up of the authors mentioned above and: Sofıa Ruiz, DavidFernandez, Mireia Ambros Hortensi, Daniel Lacasa, Angels Llorens, Eusebio Mejıas, MontserratNeira, Jose Pulido, Luis Royuela, Fernando Sanchez, Fernando Vallejo, and Nuria Valles.
919

Dow
nloa
ded
By:
[Uni
vers
idad
de
Sev
illa]
At:
08:4
6 17
Jun
e 20
08
920 Gonzalez-Saiz et al.
the existence of a principal factor that explains 52.5% of the variance observed. Itemcalibration found that they are between +0.89 and −1.04 logits on the scale. Conclusion:The results show unidimensional structure of the SDS scale. Item calibration shows theyare distributed along the continuum, which must be taken into account when calculatingtotal scores. The study’s limitations are noted.
Keywords Severity Dependence Scale (SDS); heroin addiction; Rasch models; ItemResponse Theory (IRT), validity
Introduction
One of the main goals of clinical evaluation of patients manifesting overconsumption ofpsychoactive substances is to diagnose their abuse or dependence. The best clinical evalu-ation instrument is a well-done clinical history. However, standardized instruments are anexcellent diagnostic aid.
The diagnostic criteria for substance dependence established by the most widely ac-cepted nosological classification systems (DSM-IV-TR and CIE-10) are based on the con-cept known as the Alcohol Dependence Syndrome (ADS), proposed by Edwards and Gross(1976) and accepted as the theoretical reference on addiction. Several different scales andclinical interviews have been designed in an attempt to measure each of the criteria for de-pendence proposed by those nosological systems and make them operable (e.g., the Schedulefor Clinical Assessment in Neuropsychiatry [SCAN] or the Substance Dependence SeverityScale [SDSS]).
Other scales measuring severity of dependence have also been designed based onconstructs that may be nearer or further from the most widely accepted nosological criteria.
These are based on a dimensional evaluation model (from lesser to greater severity)rather than on the categorical model using diagnostic criteria (“case” or “not case” ofdependence). Among these are, for example, the Leeds Dependence Questionnaire (LDQ)and the Severity of Dependence Scale (SDS).
The SDS is made up of five easily administrable items, and is used to determine thedegree of dependence on different types of drugs, focusing on the psychological componentsof dependence.
Some SDS studies published contribute evidence to the scale’s reliability and validity.Gossop et al. (1995) applied the scale to a sample of heroin, amphetamine, and cocaineusers, and found sufficient internal consistency and evidence of validity to back the internalstructure and relationships with other consumption variables. Other studies, such as thoseby Topp and Mattick (1997), Kaye and Darke (2001), and Cuevas, Sanz, de la Fuente,Padilla, and Berenguer (2000), on amphetamine, cocaine, and benzodiazepine abusers,respectively, have established the cutoff point that best discriminates between presence andabsence of dependence on each of those substances. In work on the Spanish version of theSDS, Gonzalez-Saiz and Salvador-Carulla (1998) pointed out that the scale only measuressome of the items necessary to completely evaluate substance dependence.
These studies were performed within the framework of measurement of the ClassicalTest Theory (CTT). At the present time, Item Response Theory models are being used moreand more in the field of health, because they make it possible to show the metric propertiesof items and tests that cannot be studied with the CTT. Among these are the invariance ofmeasurement, error in measurement per item (not for the entire instrument, as in the CTT),knowing the position of each item on the continuum, and finding the most probable responseto each item for a person with a given severity of dependence (Bezruczko, 2005; Conradand Smith, 2004; McHorney and Monahan, 2004; Prieto, Alonso, and Lamarca, 2003).

Dow
nloa
ded
By:
[Uni
vers
idad
de
Sev
illa]
At:
08:4
6 17
Jun
e 20
08
SDS Validity in a Non-Clinical Sample of Heroin Users 921
Some of the studies performed in drug addiction have used these models to analyze thedimensionality of a nicotine dependency scale (Breteler, Hilberink, Zeeman, and Lammers,2004), the uniformity of substance dependence syndrome elements based on the criteriain the DSM-III-R and ICD-10 (Kan, Breteler, van der Ven, and Zitman, 1998) and dis-crimination of items on an alcohol dependence scale (Kahler, Strong, Hayaki, Ramsey, andBrown, 2003). The purpose of this work was to apply an IRT model, and more specifically,the Rating Scale Model, which is a polytomous model, derived from Rasch Model, to con-tribute evidence of the validity of the SDS construct. The validation studies used concentrateon providing evidence of the dimensionality of the scale and calibrating the items on theseverity of dependence continuum.
Method
Subjects
The participants were 982 young people between 18 and 30 years old who had consumedheroin at least 12 times in the last 12 months before the interview and at least once in thelast 3 months. This is a multicenter study performed by three research groups. All of themwere captured from the community in the metropolitan areas of Madrid (43.4%), Barcelona(36.2%), and Seville (20.4%). The sample was recruited in the street, in different drugconsumption scenarios and not from drug user treatment centers. As there was no suitablesampling frame for participant selection, nonprobability sampling methods were used. Atfirst, an attempt was made for one worker per city to collect an initial nucleus of drug usersfrom various scenarios (targeted sampling; Watters, 1989), and who would then name othereligible consumers (snowball sampling; Hartnoll et al., 1997).
Participants were informed of the purpose and the stages of the study. They wereexplained that their participation was voluntary and that the data would be used exclusivelyfor statistical purposes. At the end of the explanation, they were asked to sign an informedconsent form for their participation.
However, this method was not very productive, and in the end, respondent-drivensampling, which is a snowball system providing incentives for participation and capturingor naming other participants (Heckathorn, 1997), was used.
The final sample was collected using four procedures: snowball sampling (47%), workof outside recruiters, such as users, ex-users and professionals (34.1%), direct capture bystudy fieldworkers in drug use scenarios where it was rather likely to find heroin users,especially places with massive drug consumption and/or sale (17.1%), and direct participa-tion in response to advertising (1.7%). To improve representativeness, an attempt was madeto capture heterogeneous drug consumers by diversifying places and ways of capture andactively searching for certain types of users (integrated, very young, new user, etc.).
Instrument
The purpose of the Severity of Dependence Scale (SDS) is to evaluate the severity ofpsychological dependence on different types of drugs (Gossop et al., 1995). It is made upof five items representing the psychological components of the subject’s dependence inthe month before the test is given. A Likert-type scale codes the response to each item,with scores ranging from 0 to 3 (0 = never/almost never; 1 = sometimes; 2 = often; 3 =always/nearly always for items 1–4; and 0 = not difficult; 1 = quite difficult; 2 = very
Dow
nloa
ded
By:
[Uni
vers
idad
de
Sev
illa]
At:
08:4
6 17
Jun
e 20
08
922 Gonzalez-Saiz et al.
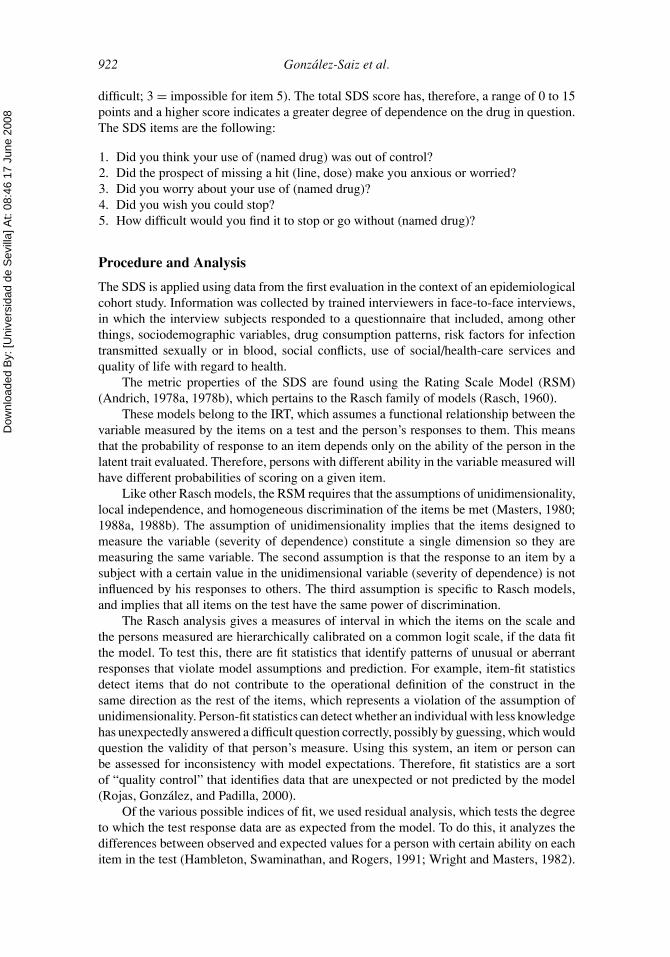
difficult; 3 = impossible for item 5). The total SDS score has, therefore, a range of 0 to 15points and a higher score indicates a greater degree of dependence on the drug in question.The SDS items are the following:
1. Did you think your use of (named drug) was out of control?2. Did the prospect of missing a hit (line, dose) make you anxious or worried?3. Did you worry about your use of (named drug)?4. Did you wish you could stop?5. How difficult would you find it to stop or go without (named drug)?
Procedure and Analysis
The SDS is applied using data from the first evaluation in the context of an epidemiologicalcohort study. Information was collected by trained interviewers in face-to-face interviews,in which the interview subjects responded to a questionnaire that included, among otherthings, sociodemographic variables, drug consumption patterns, risk factors for infectiontransmitted sexually or in blood, social conflicts, use of social/health-care services andquality of life with regard to health.
The metric properties of the SDS are found using the Rating Scale Model (RSM)(Andrich, 1978a, 1978b), which pertains to the Rasch family of models (Rasch, 1960).
These models belong to the IRT, which assumes a functional relationship between thevariable measured by the items on a test and the person’s responses to them. This meansthat the probability of response to an item depends only on the ability of the person in thelatent trait evaluated. Therefore, persons with different ability in the variable measured willhave different probabilities of scoring on a given item.
Like other Rasch models, the RSM requires that the assumptions of unidimensionality,local independence, and homogeneous discrimination of the items be met (Masters, 1980;1988a, 1988b). The assumption of unidimensionality implies that the items designed tomeasure the variable (severity of dependence) constitute a single dimension so they aremeasuring the same variable. The second assumption is that the response to an item by asubject with a certain value in the unidimensional variable (severity of dependence) is notinfluenced by his responses to others. The third assumption is specific to Rasch models,and implies that all items on the test have the same power of discrimination.
The Rasch analysis gives a measures of interval in which the items on the scale andthe persons measured are hierarchically calibrated on a common logit scale, if the data fitthe model. To test this, there are fit statistics that identify patterns of unusual or aberrantresponses that violate model assumptions and prediction. For example, item-fit statisticsdetect items that do not contribute to the operational definition of the construct in thesame direction as the rest of the items, which represents a violation of the assumption ofunidimensionality. Person-fit statistics can detect whether an individual with less knowledgehas unexpectedly answered a difficult question correctly, possibly by guessing, which wouldquestion the validity of that person’s measure. Using this system, an item or person canbe assessed for inconsistency with model expectations. Therefore, fit statistics are a sortof “quality control” that identifies data that are unexpected or not predicted by the model(Rojas, Gonzalez, and Padilla, 2000).
Of the various possible indices of fit, we used residual analysis, which tests the degreeto which the test response data are as expected from the model. To do this, it analyzes thedifferences between observed and expected values for a person with certain ability on eachitem in the test (Hambleton, Swaminathan, and Rogers, 1991; Wright and Masters, 1982).
Dow
nloa
ded
By:
[Uni
vers
idad
de
Sev
illa]
At:
08:4
6 17
Jun
e 20
08
SDS Validity in a Non-Clinical Sample of Heroin Users 923
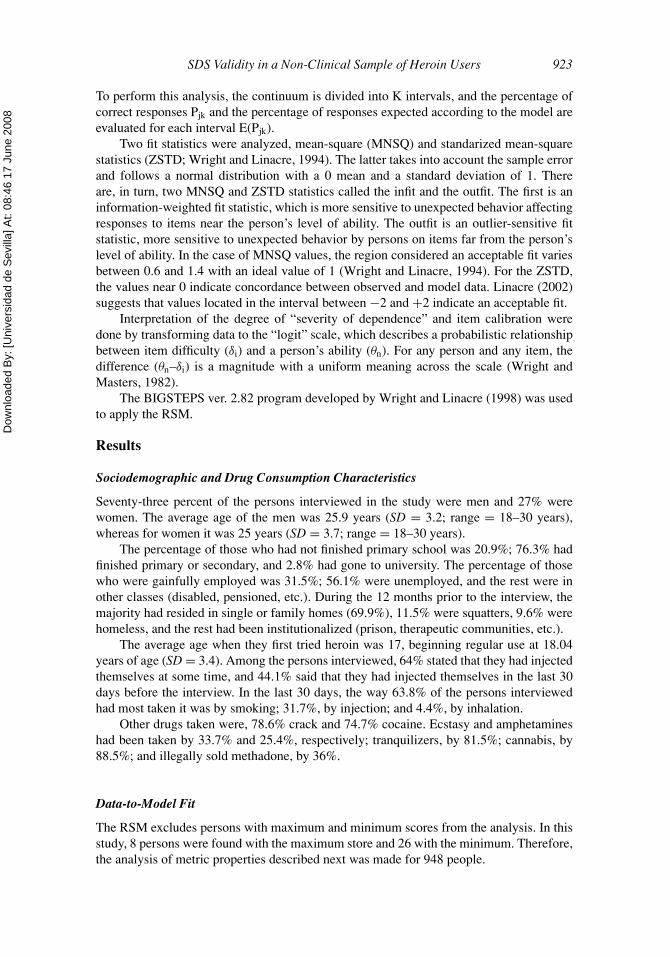
To perform this analysis, the continuum is divided into K intervals, and the percentage ofcorrect responses Pjk and the percentage of responses expected according to the model areevaluated for each interval E(Pjk).
Two fit statistics were analyzed, mean-square (MNSQ) and standarized mean-squarestatistics (ZSTD; Wright and Linacre, 1994). The latter takes into account the sample errorand follows a normal distribution with a 0 mean and a standard deviation of 1. Thereare, in turn, two MNSQ and ZSTD statistics called the infit and the outfit. The first is aninformation-weighted fit statistic, which is more sensitive to unexpected behavior affectingresponses to items near the person’s level of ability. The outfit is an outlier-sensitive fitstatistic, more sensitive to unexpected behavior by persons on items far from the person’slevel of ability. In the case of MNSQ values, the region considered an acceptable fit variesbetween 0.6 and 1.4 with an ideal value of 1 (Wright and Linacre, 1994). For the ZSTD,the values near 0 indicate concordance between observed and model data. Linacre (2002)suggests that values located in the interval between −2 and +2 indicate an acceptable fit.
Interpretation of the degree of “severity of dependence” and item calibration weredone by transforming data to the “logit” scale, which describes a probabilistic relationshipbetween item difficulty (δi) and a person’s ability (θn). For any person and any item, thedifference (θn–δi) is a magnitude with a uniform meaning across the scale (Wright andMasters, 1982).
The BIGSTEPS ver. 2.82 program developed by Wright and Linacre (1998) was usedto apply the RSM.
Results
Sociodemographic and Drug Consumption Characteristics
Seventy-three percent of the persons interviewed in the study were men and 27% werewomen. The average age of the men was 25.9 years (SD = 3.2; range = 18–30 years),whereas for women it was 25 years (SD = 3.7; range = 18–30 years).
The percentage of those who had not finished primary school was 20.9%; 76.3% hadfinished primary or secondary, and 2.8% had gone to university. The percentage of thosewho were gainfully employed was 31.5%; 56.1% were unemployed, and the rest were inother classes (disabled, pensioned, etc.). During the 12 months prior to the interview, themajority had resided in single or family homes (69.9%), 11.5% were squatters, 9.6% werehomeless, and the rest had been institutionalized (prison, therapeutic communities, etc.).
The average age when they first tried heroin was 17, beginning regular use at 18.04years of age (SD = 3.4). Among the persons interviewed, 64% stated that they had injectedthemselves at some time, and 44.1% said that they had injected themselves in the last 30days before the interview. In the last 30 days, the way 63.8% of the persons interviewedhad most taken it was by smoking; 31.7%, by injection; and 4.4%, by inhalation.
Other drugs taken were, 78.6% crack and 74.7% cocaine. Ecstasy and amphetamineshad been taken by 33.7% and 25.4%, respectively; tranquilizers, by 81.5%; cannabis, by88.5%; and illegally sold methadone, by 36%.
Data-to-Model Fit
The RSM excludes persons with maximum and minimum scores from the analysis. In thisstudy, 8 persons were found with the maximum store and 26 with the minimum. Therefore,the analysis of metric properties described next was made for 948 people.
Dow
nloa
ded
By:
[Uni
vers
idad
de
Sev
illa]
At:
08:4
6 17
Jun
e 20
08
924 Gonzalez-Saiz et al.
Table 1Overall fit of subjects and items to the model
Model Infit Outfit
Measure Error MNSQ ZSTD MNSQ ZSTD
SubjectsMean .34 .71 1.00 −.3 1.00 −.3SD 1.49 .11 .82 1.0 .85 1.0Max. 3.63 1.14 5.60 2.9 6.10 3.1Min. −3.61 .65 .08 −2.1 .08 −2.2
ItemsMean .00 .05 1.00 −.1 1.00 .0SD .71 .00 .08 1.0 .12 1.0Max. .89 .05 1.09 1.1 1.21 1.7Min. −1.04 .05 .90 −1.4 .88 −1.1
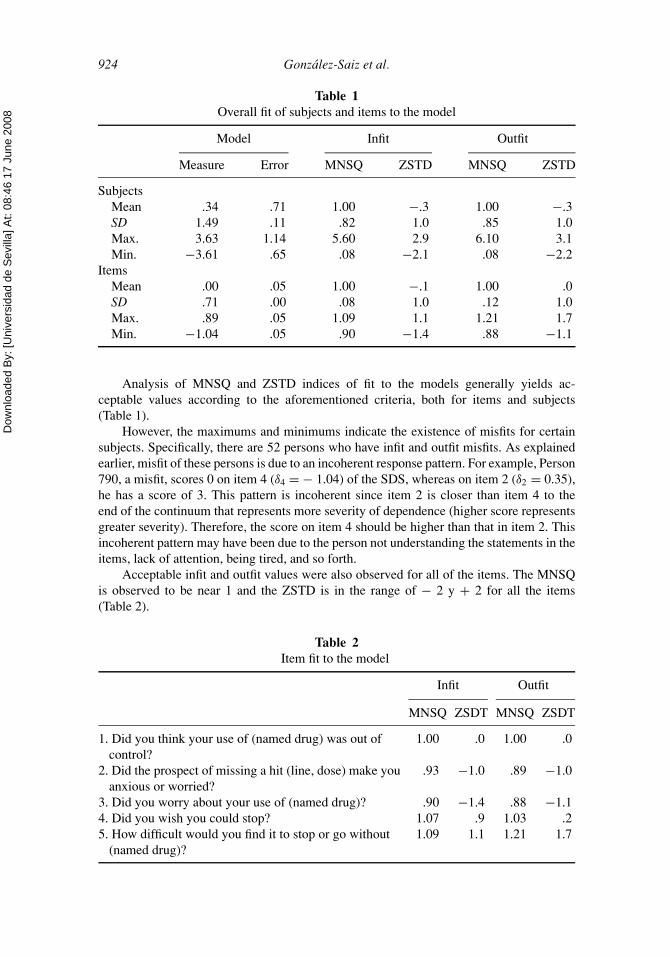
Analysis of MNSQ and ZSTD indices of fit to the models generally yields ac-ceptable values according to the aforementioned criteria, both for items and subjects(Table 1).
However, the maximums and minimums indicate the existence of misfits for certainsubjects. Specifically, there are 52 persons who have infit and outfit misfits. As explainedearlier, misfit of these persons is due to an incoherent response pattern. For example, Person790, a misfit, scores 0 on item 4 (δ4 = − 1.04) of the SDS, whereas on item 2 (δ2 = 0.35),he has a score of 3. This pattern is incoherent since item 2 is closer than item 4 to theend of the continuum that represents more severity of dependence (higher score representsgreater severity). Therefore, the score on item 4 should be higher than that in item 2. Thisincoherent pattern may have been due to the person not understanding the statements in theitems, lack of attention, being tired, and so forth.
Acceptable infit and outfit values were also observed for all of the items. The MNSQis observed to be near 1 and the ZSTD is in the range of − 2 y + 2 for all the items(Table 2).
Table 2Item fit to the model
Infit Outfit
MNSQ ZSDT MNSQ ZSDT
1. Did you think your use of (named drug) was out ofcontrol?
1.00 .0 1.00 .0
2. Did the prospect of missing a hit (line, dose) make youanxious or worried?
.93 −1.0 .89 −1.0
3. Did you worry about your use of (named drug)? .90 −1.4 .88 −1.14. Did you wish you could stop? 1.07 .9 1.03 .25. How difficult would you find it to stop or go without
(named drug)?1.09 1.1 1.21 1.7

Dow
nloa
ded
By:
[Uni
vers
idad
de
Sev
illa]
At:
08:4
6 17
Jun
e 20
08
SDS Validity in a Non-Clinical Sample of Heroin Users 925
In view of these results, it may be said that the data matrix fits the RSM acceptably,and this model can therefore be used to measure severity of dependence.
On the other hand, some authors argue that existence of a single variable can be assumedwhen the data fit the model (Gustafsson, 1980) so the unidimensional assumption is satisfied(Smith and Miao, 1994).
In this application of the SDS, the unidimensional assumption indicated by the analysisof fit of the items is reaffirmed by factorial analysis. As observed in Tables 3 and 4, theprincipal components analysis shows a principal factor that explains 52.5% of the variance,and all of the items are highly saturated in that factor. This supports the unidimensionalstructure found by the analyses performed previously.
Table 3Total variance explained
Initial Eigenvalues Rotation Sums of Squared Loadings
Component Total % Variance Cumulative % Total % Variance Cumulative %
1 2.63 52.51 52.51 2.63 52.51 52.512 0.79 15.78 68.293 0.73 14.59 82.884 0.44 8.78 91.665 0.42 8.34 100
Note: Extraction method: Principal components analysis.
Table 4Component matrix
Component 1
Item 1 .730Item 2 .785Item 3 .783Item 4 .723Item 5 .584
Map of Persons and Items
The map of persons and items shown in Figure 1 shows the calibration of items and theposition of persons on the “severity of dependence” continuum. The common logit scale isrepresented on the vertical line in the center of the map (the letters M, S, and Q for itemand person distributions represent the mean, 1 SD, and 2 SDs, respectively), and the logitsfor the interval scale are placed to the left of the figure.
A “#” in the “persons” column represents the position of the persons on the dependenceseverity continuum. “#” represents a group of 10 persons and “.” is a group of 9 persons orfewer.

Dow
nloa
ded
By:
[Uni
vers
idad
de
Sev
illa]
At:
08:4
6 17
Jun
e 20
08
926 Gonzalez-Saiz et al.
Figure 1. Maps of persons and items
The “map of items” column shows the position of each item on the continuum, rep-resenting the value on the scale for each item in the “severity of dependence” construct inparentheses.
Figure 1 shows items calibrated by difficulty and persons by level of ability together.The highest item/person values on the scale are at the top of the graph. For example, “Didyou think your use of (drug named) was out of control?” (δ1 = 0.42 logits) was a moredifficult question than “Did you worry about your use of (drug named)?” (δ3 = − 0.63logits).

Dow
nloa
ded
By:
[Uni
vers
idad
de
Sev
illa]
At:
08:4
6 17
Jun
e 20
08
SDS Validity in a Non-Clinical Sample of Heroin Users 927
Figure 2. Example of most probable response for a person with a severity of dependence of −1.2logits
Person measures on the common logit scale make it possible to find out the most likelyresponse to the items composing the SDS. For example, in Figure 2, Person A has a low‘severity of dependence’ score (θA = −1.2). It may be observed that in Item 5 (δ5 = 0.89),the most likely response is 0 (never), in Item 1 (δ1 = 0.42) it is 1 (sometimes) and in Item4 (δ4 = − 1.04) the most likely response is 3 (often).
Category Probabilities Curves
The Category Probability Curves (CPC) are represented starting from the ability thresholdparameters of the item steps (τm). The interest in studying these curves resides in two mainpoints: (a) the curves provide information on the functioning of the alternative responses.Specifically, the fact that all of the curves are at some point the most probable indicatescorrect functioning of the response alternative; and (b) the intersections between the curves(thresholds) define the limits of the “most probable response regions” on the continuum.That is, they define different regions on the continuum where there is a higher probabilityof the subjects responding to the category of response represented over this region.
As shown in Figure 3 all the response categories are the most probable in some sectionof the continuum, which indicates that they are functioning properly. The region of mostprobable response for persons with a severity of dependence score of 0 is between −∞ and−1.97 logits; the most probable response is 1 for persons with scores between −1.97and −0.3 logits; the most probable response is 2 for those who have scores between−0.3 and 2 logits, and for respondents with scores over 2 logits, the most probable responseis 3.

Dow
nloa
ded
By:
[Uni
vers
idad
de
Sev
illa]
At:
08:4
6 17
Jun
e 20
08
928 Gonzalez-Saiz et al.
Figure 3. Category probability curves
Discussion
This work concentrated on contributing two types of evidence of the construct validity ofthe SDS scale. On one hand, unidimensional structure of the SDS scale was confirmed. Onthe other, the scale values of the items on the “severity of dependence” continuum werefound.
With the results found, after checking that the data fit the model, unidimensionalitymay be assumed (Smith and Miao, 1994). This assumption has further been checked byfactorial analysis, which led to the same conclusion. A review in the literature shows thatGossop et al. (1995) also found a unidimensional structure in their study of the SDS, whereasGonzalez-Saiz and Salvador-Carulla (1998) detected two factors in the SDS.
Some authors connect the use of Rasch models with evidence on the structure of theset of items selected (Bond, 2004; Simith and Suh, 2003; Smith, 2001). As describedearlier, these models make it possible to find out the probability of response to the itemsaccording to the difference in ability of the persons and the location of the items. Thisimplies a hierarchical structure (Linacre, 2004), which, in the case of the SDS, means thatthe persons with the highest level of severity of dependence will occupy the top positions onthe continuum (Figure 1), whereas those with the lowest level of dependence will occupythe lowest positions. Analogously, it may be seen how the item positions vary by difficultyon the continuum. Therefore, in Rasch models, there is a confluence between the theoreticalconception of the measure of a construct—-in this case the severity of dependence—-andits mathematical development. In this sense, the measurement can only be made when theset of items that measures the construct is theoretically coherent, which is given by the fitof items and persons. If the items on the SDS did not fit, we would have to think aboutother sources of variability outside of the “severity of dependence” construct. This in turn,implies a departure from the unidimensional assumption (Messick, 1995).
On the other hand, calibration of the items along the severity of dependence continuumhas demonstrated that not all of the items on the SDS measure the construct with the sameintensity. Finding different values on the scale for each item contradicts the assumption ofparallel items that require Likert-type scaling typical of a CTT. Therefore, the total scores

Dow
nloa
ded
By:
[Uni
vers
idad
de
Sev
illa]
At:
08:4
6 17
Jun
e 20
08
SDS Validity in a Non-Clinical Sample of Heroin Users 929
on the SDS scale are found as a sum model of all the items, which must be weighted bya factor so that the relative weight of each item on the continuum is included in the totalscores.
From the point of view of the measure, this finding shows that the items have a relativeweight in the severity of dependence construct.
We therefore believe that the application of the IRT to the SDS scale points out some ofits limitations and advantages in measuring the construct severity of dependence, althoughthese properties are complementary to and do not exclude those offered by studies done inthe frame of the CTT. The results obtained, then, provide new evidence making it possiblefor future studies using this scale to be interpreted more accurately.
Study’s Limitations
One of the limitations of the study is the use of a nonrandom sample. Without doubt thislimits its representativeness, with the pertinent consequences for data analysis. On the otherhand, this limitation is not a determining trait for calculating parameters of items or personswhen the Rasch models are applied, although it is for other IRT models (Glas, 1989; Wrightand Stone, 1979).
Finally, further research applying the IRT to measurement of severity of dependenceusing the SDS on clinical samples would be useful. This would enable the similarities anddifferences from results of epidemiological studies to be seen, and also how these resultsare related to those obtained from the perspective of the CTT.
RESUME
Validite de construct de la SDS (Echelle de la Severite de la Dependance) enappliquant les modeles de Rasch dans un echantillon non clinique deconsommateurs d’heroıne
Objectifs: L’objet de cette recherche est d’etudier la validite de construct de la SDS (Echellede la Severite de la Dependance) en appliquant les modeles de Rasch dans un echantillonnon clinique de consommateurs d’heroıne. Participants: Dans cette etude ont participe 982jeunes de moins de 30 ans. Ils ont etes selectionnes dans un environnement non therapeutiquedans les regions de Madrid, Barcelone et Seville. Analyse: L’etude de la dimensionnalitede l’echelle et la calibration des items ont ete realisees d’apres le Rating Scale Model, dela famille des modeles de Rasch. Une analyse factorielle a ete egalement effectuee afin decontraster la dimensionnalite de l’echelle. Resultats: L’analyse de l’ajustement indique quetous les items ont une valeur de infit et outfit compris entre ± 2 logits, ce qui signifie queles donnees s’ajustent au modele et que nous pouvons assumer l’unidimensionnalite. Dememe, l’analyse des composantes principales a montre l’existence d’un facteur principal quiexplique le 52,5% de la variance observee. La calibration des items montre qu’ils prennentdes valeurs d’echelle comprises entre +0,89 et −1,04 logits. Conclusions : Les resultatsobtenus indiquent une structure unidimensionnelle de l’echelle SDS. La calibration desitems reflete qu’ils sont distribues tout au long du continu et qu’il est necessaire de leprendre en compte lors du calcul des ponctuations totales.Mot Cles: Severite de la dependance (SDS); Adiction a l’heroıne; Modeles de Rasch;Theorie de la Reponse a l’Item, Validite.

Dow
nloa
ded
By:
[Uni
vers
idad
de
Sev
illa]
At:
08:4
6 17
Jun
e 20
08
930 Gonzalez-Saiz et al.
RESUMEN
Validez de constructo de la Escala de Severidad de la Dependencia (SDS) enuna muestra no clınica de consumidores de heroına aplicando la Teorıa derespuesta al Item
Objetivos: El proposito de este trabajo es estudiar la validez de constructo de la SDSaplicando los modelos de Rasch en una muestra no clınica de consumidores de heroına.Participantes: participaron 982 jovenes menores de 30 anos. Todos ellos fueron reclutadosen ambitos no terapeuticos en las areas metropolitanas de las ciudades de Madrid, Barcelonay Sevilla. Analisis: El estudio de la dimensionalidad de la escala y la calibracion de los ıtemsse ha realizado aplicando el modelo Rating Scale, perteneciente a la familia de modelosde Rasch. Tambien se ha realizado un analisis factorial para contrastar la dimensionalidadde la escala. Resultados: El analisis del ajuste refleja que todos los ıtems tienen valoresde infit y outfit comprendidos entre ±2 logits, lo que indica que los datos se ajustan almodelo y podemos asumir la unidimensionalidad. Asimismo, el analisis de componentesprincipales ha mostrado la existencia de un factor principal que explica el 52,5% de lavarianza observada. La calibracion de los ıtems muestra que estos toman valores de escalacomprendidos entre +0,89 y −1,04 logits. Conclusiones: Los resultados obtenidos estanindicando una estructura unidimensional de la escala SDS. La calibracion de los ıtemsrefleja que estos se encuentran distribuidos a lo largo del continuo, siendo necesario tenerlopresente en el calculo de las puntuaciones totales.Keywords: Severidad de la dependencia (SDS); Adiccion a la heroına; Modelos de Rasch;Teorıa de Respuesta al Item, Validez.
THE AUTHORS
Francisco Gonzalez-Saiz, Ph.D. in Psychiatry and a Mas-ter’s Degree in Drug Addiction, has been sharing researchwith clinical work with substance user and addicted pa-tients. His main research focus is the use of measurementinstruments for the clinical evaluation of patients addictedto substances. He is currently working as a research andeducation consultant for the Fundacion Andaluza para laAtencion a las Drogodependencias e Incorporacion Social(FADAIS), where he actively participated in several stud-ies on the effectiveness of treatment programs for opiateaddiction patients.
Oscar M. Lozano Rojas, Ph.D. in Psychology, in Behav-ioral Sciences, specializing in the area of methodology,is a member of the “Psychosocial and MethodologicalStudies” Research Team participating in the applicationof psychometric models to psychological and health-careconstructs. He is currently working as a research techni-cian at the Fundacion Andaluza para la Atencion a las Dro-godependencias e Incorporacion Social (FADAIS) and isan Associate Professor at the University of Huelva.

Dow
nloa
ded
By:
[Uni
vers
idad
de
Sev
illa]
At:
08:4
6 17
Jun
e 20
08
SDS Validity in a Non-Clinical Sample of Heroin Users 931
Rosario Ballesta, M.D., has a degree in Psychology anda Master’s Degree in Drug Dependencies. She was a re-searcher for the Narcotics Prescription in Andalusia Ex-perimental Programme, and is currently Director of theInformation Systems and Research at the Fundacion An-daluza para la Atencion a las Drogodependencias e Incor-poracion Social (FADAIS), where she fosters research ondiversification of treatment for opiate addicted patients.
Teresa Silva, M.D., degree in Psychology, works at Uni-versity Rey Juan Carlos, in the Department of Health Sci-ence. Currently she works in a research project about vi-olent behavior and psychopathological problems and itsrelationship with drugs use (heroin and cocaine) in a psy-chological framework
Maria Teresa Brugal Puig, M.D., Ph.D., M.P.H.(Barcelona Autonomous University), is Senior Researcheron epidemiology of drug and HIV, and Director ofBarcelona Drug Information System. Research projectfunded by grants from the National Funds of Health Inves-tigation (FISs) and National Plan on Drug Abuse (Ministryof Health). Advisor of the European Monitoring Centerfor Drugs and Drug Addiction and the AIDS and Mo-bility Commission. Her research work has been orientedtoward obtaining information for the planning of interven-tion policies in the drug use field, as well as to evaluatethe efficacy of interventions implemented by the differentSpanish health administrations.
Izaskun Bilbao, M.D., degree in Sociology and Expertin Research Techniques by the Centro de InvestigacionesSociologicas (CIS). Among her lines of research is the ap-plication of qualitative research techniques to health care.She is currently working as a technician for the FundacionAndaluza para la Atencion a las Drogodependencias e In-corporacion Social (FADAIS).

Dow
nloa
ded
By:
[Uni
vers
idad
de
Sev
illa]
At:
08:4
6 17
Jun
e 20
08
932 Gonzalez-Saiz et al.
Gregorio Barrios, Ph.D., M.D. and surgeon, is workingin several areas of health and related factors in differentpopulation groups, among which are drug consumers. Heis especially interested in the relationship between socioe-conomic factors and health. He is currently a professor inthe Department of Preventive Medicine, Public Health andthe History of Science at the Complutense University andis a technical consultant for the Observatorio Espanol yEstrategia.
Antonia Domingo-Salvany, M.D., with a Ph.D. inMedicine, has been working on drug use epidemiologyat the Institut Municipal d’Investigacio Medica (IMIM)since 1989 and is currently focusing on psychiatric co-morbidity among drug users and health services research.
Marıa Jose Bravo, M.P.H., Ph.D., Department of Preven-tive Medicine, Public Health and History of Science at theComplutense University in Madrid, has been working inthe area of problems related to drug consumption from theperspective of public health since 1987. Most recently, shehas been concentrating on the study of infectious diseasetransmission risk behavior, especially HIV/AIDS amongillegal drug consumers.
Luis de la Fuente, M.D., M.P.H., Ph.D., has been workingin the field of the epidemiology of drug consumption andassociated problems, first in the National Plan on Drugsand then in the National Plan on AIDS and the NationalCentre for Epidemiology since 1988. His main area ofinterest has been problems associated with injected drugconsumption, especially HIV, from the perspective of theevaluation of the efficacy of public prevention policies.

Dow
nloa
ded
By:
[Uni
vers
idad
de
Sev
illa]
At:
08:4
6 17
Jun
e 20
08
SDS Validity in a Non-Clinical Sample of Heroin Users 933
Glossary
Item Response Theory (IRT) modeling: A statistical technique that is applied afterdata have been collected. IRT consists of a class of statistical procedures that areused to model the association between an individual’s responses to survey ques-tions/items (in probabilistic terms) and an underlying latent trait that is measured by theitems.
The Rasch model: The only item response theory (IRT) model in which the total score acrossitems characterizes a person totally. It is also the simplest of such models having theminimum of parameters for the person (just one), and just one parameter correspondingto each category of an item. This item parameter is generically referred to as a threshold
Outfit: Outlier-sensitive fit statistic. This is based on the conventional chi-square statistic.This is more sensitive to unexpected observations by persons on items that are relativelyvery easy or very hard for them (and vice-versa).
Infit: Inlier-pattern-sensitive fit statistic. This is based on the chi-square statistic with eachobservation weighted by its statistical information (model variance). This is moresensitive to unexpected patterns of observations by persons on items that are roughlytargeted on them (and vice-versa).
Mean-square: This is the chi-square statistic divided by its degrees of freedom. Conse-quently its expected value is close to 1.0. Values greater than 1.0 (underfit) indicateunmodeled noise or other source of variance in the data—these degrade measurement.Values less than 1.0 (overfit) indicate that the model predicts the data too well—causingsummary statistics, such as reliability statistics, to report inflated statistics. See furtherdichotomous and polytomous mean-square statistics.
Z-Standardized: These report the statistical significance (probability) of the chi-square(mean-square) statistics occurring by chance when the data fit the Rasch model. Thevalues reported are unit-normal deviates, in which .05% 2-sided significance corre-sponds to 1.96. Overfit is reported with negative values
References
Andrich, D. (1978a). A rating formulation for ordered response categories. Psychometrika, 43:561–573.
Andrich, D. (1978b). Scaling attitude items constructed and scored in the Likert Tradition. Educationaland Psychological Measurement, 38:665–680.
Bezruczko, N. (2005). Rasch measurement in health science. Minnesota: JAM PressBreteler, M. H., Hilberink, S. R., Zeeman, G., Lammers, S. M. (2004). Compulsive smoking: the devel-
opment of a Rasch homogeneous scale of nicotine dependence. ddictive Behaviors, 29(1):199–205.
Bond, T. G. (2004). Application of two IRT models for construct validation to issues about spatialability. Revista de Metodologıa de las Ciencias del Comportamientol, 5(2):181–196
Conrad, K., Smith, E. (2004). International conference on objective measurement: applications ofRasch analisys in health care. Medical Care, 42(1 Suppl.):11–I6.
Cuevas, C., Sanz, E., de la Fuente, J., Padilla, J., Berenguer, J. (2000). The Severity of DependenceScale (SDS) as screening test for benzodiazepine dependence: SDS validation study. Addiction,95(2):245–250.
Edwards, G., Gross, M. (1976). Alcohol dependence: provision description of a clinical syndrome.British Medical Journal, 1:1058–1061.
Glas, C. A. W. (1989). Contributions to estimating and testing Rasch models. Doctoral dissertation,Tecnical University of Twente, Netherlands: Cip-Gegevens Knoinglijke Bibliotheek.

Dow
nloa
ded
By:
[Uni
vers
idad
de
Sev
illa]
At:
08:4
6 17
Jun
e 20
08
934 Gonzalez-Saiz et al.
Gonzalez-Saiz, F., Carulla, S. (1998). Estudio de fiabilidad y validez de la version espanola de laescala severity of dependence scale (SDS). Adicciones, 10(3):223–232.
Gossop, M., Darke, S., Griffiths, P., Hando, J., Powis, B., Hallm, W., et al. (1995). The Severity ofDependence Scale (SDS): psychometric properties of the SDS in English and Australian samplesof heroin, cocaine and amphetamine users. Addiction, 90:607–614.
Gustafsson, J. E. (1980). A solution of the conditional estimation problem for long tests in theRasch model for dichotomous ıtems. Educational and Psychological Measurement, 40:377–385.
Hartnoll, R., Griffiths, P., Taylor, C., Hendrick, V., Blanken, P., Nolimal, D. (1997). Handbook onsnowball sampling. Strasbourg: Pompidou Group. Council of Europe.
Hambleton, R. K., Swaminathan, H., Rogers, H. J. (1991). Fundamentals of item response theory.Newbury Park: Sage.
Heckathorn, D. D. (1997). Respondent -driven sampling: a new approach to the study of hiddenpopulations. Social Problems, 44:174–179.
Kahler, C. W., Strong, D. R., Hayaki, J., Ramsey, S. E., Brown, R. A. (2003). An item responseanalysis of the Alcohol Dependence Scale in treatment-seeking alcoholics.Journal of Studies on Alcohol, 64(1):127–136.
Kan, C. C., Breteler, M. H., van der Ven, A. H., Zitman, F. G. (1998). An evaluation of DSM-III-R and ICD-10 benzodiacepine criteria using Rasch modelling. Addiction, 93(3):349–359.
Kaye, S., Darke, S. (2001). Determining a diagnostic cut-off on the Severity of Dependence Scale(SDS) for cocaine dependence. Addiction, 97:727–731.
Linacre, J. M. (2002). What do infit and outfit, mean-square and standardized mean? Rasch Measure-ment Transaction, 168(2):878.
Linacre, J. M. (2004). Test validity and Rasch measurement: construct, content, etc. Rasch Measure-ment Transactions, 18(1):972.
Masters, G. N. (1980). A Rasch model for rating scales. Dissertation Abstract International, 41:215A–216A.
Masters, G. N. (1988a). Measurement models for ordered response categories. In R. Langeheine J.Rost (Eds.), Latent trait and latent class models. New York: Plenum Press.
Masters, G. N. (1988b). The analysis of partial credit scoring. Applied Measurement in Education,1(4):79–297.
McHorney, C. A., Monahan, P. (2004). Postscrip: Applications of Rasch analisys in health care.Medical Care, 42(1 Suppl.):I73–I78.
Messick, S. (1995). Validity of psychological assessment. Validation of inferences from persons’responses and performance as scientific inquiry into score meaning. American Psychologist,50:741–749.
Patrick D., Chiang, Y. P. (2001). Health Outcomes Assessment: The Remaining Questions. RaschMeasurement Transactions, 14(4):782.
Prieto, L., Alonso, J., Lamarca, R. (2003). Classical test theory versus Rasch analysis for quality oflife questionnaire reduction. Health Qual Life Outcomes, 1(27).
Rasch, G. (1960/1980). Probabilistic models for same intelligence and attainment test. Chicago:University of Chicago Press
Rojas, A. J., Gonzalez, A., Padilla, J. L., Perez, C. (2000). Comparacion de estrategias de ajuste delos datos al modelo de credito parcial. Psicothema, 12(2):296–302.
Smith Jr., E. V. (2001). Evidence for the reliability of measures and validity of measure interpretation:A Rasch measurement perspective. Journal of Applied Measurement, 2:281–311
Smith, R. M., Miao, C. Y. (1994). Assessing unidimensionality for Rasch measurement. In M. Wilson(Ed.), Objective measurement. Vol.2. Norwood, NJ: Ablex Publishing Corporation.
Smith, R. M., Suh, K. K. (2003). Rasch fit statistics as a test of the invariance of ıtem parameterestimates. Journal of Applied Measurement, 4(2):159.
Topp, L., Mattick, R. (1997). Choosing a cut-off on the Severity of Dependence Scale (SDS) foramphetamine users. Addiction, 92(7):839–845.

Dow
nloa
ded
By:
[Uni
vers
idad
de
Sev
illa]
At:
08:4
6 17
Jun
e 20
08
SDS Validity in a Non-Clinical Sample of Heroin Users 935
Watters, J. B. (1989). Targeted sampling: Options for the study of hidden populations. Soc Probl,36:416–430.
Wright, B. D., Masters, G. N. (1982). Rating scale analysis. Chicago: MESA Press.Wright, B. D., Linacre, J. M. (1994). Reasonable mean-square fit values. Rasch Measurement Trans-
action, 8(3):370.Wright, B. D., Linacre, J. M. (1998). BIGSTEPS ver. 2.2. Computer Program. Chicago: MESA Press.Wright, B. D., Stone, M. H. (1979). Best test design. Chicago: MESA Press.