
Mississippi Statewide Accountability System
28
1 Webster County School District (7800) East Webster High School (7800004) No Child Left Behind 2013-2014 School Report Card The No Child Left Behind Act of 2001 (NCLB) requires each state to use a unified accountability model. School, district, and state report cards that contain the following accountability information must be produced and made available publicly. Mississippi Statewide Accountability System The Mississippi Statewide Accountability System (MSAS) is a single “A” through “F” school and district accountability system based on the requirements of Federal law under the Elementary and Secondary Education Act Flexibility Request and Mississippi Code 37-17-6. The MSAS assigns performance classifications based on 1) student achievement, 2) student growth, and 3) graduation, if applicable. For the 2013-2014 school year, the U. S. Department of Education granted Mississippi a one-year waiver from school performance classifications due to the implementation of Mississippi’s College and Career Readiness Standards. The waiver allowed districts and school s to retain the letter grade received in the 2012-2013 school year if the 2013-2014 grade was lower as a result of assessment results. Current Year Prior Year Official Grade: A A Without Waiver Grade: A ** 4-Year Graduation Rate: 88.5 90.3 Notes: Only districts and schools serving grade 1 or higher or higher are eligible to receive a performance classification. The Without Waiver Grade only applies the 2013-2014 school year. Possible Accountability Status: A, B, C, D, F. (N/A – The school did not receive a performance classification due to not having available data.) ESEA Annual Measurable Objective (AMO) A district or school is responsible for meeting annual measurable objectives (AMO) in three areas: Reading/Language Arts, Mathematics, and a third academic indicator referred to as the “Other Academic Indicator.” The “Other Academic Indicator” for schools and districts without a grade 12 is the attendance rate. For schools and districts with a grade 12, the indicator is the graduation rate. If a district or school does not meet an AMO in any one of the three areas, the district or school is considered to have not met AMOs. Current Year Prior Year District AMO Status: Not Met Met Reading/Language Arts Status: Not Met Met Mathematics Status: Not Met Met Other Academic Indicator Status: Met Met Differentiated Accountability Label: Not Meeting AMOs High Performing Reward AMO Subgroup Results Student Groups Reading/ Language Arts Mathematics Other Academic Indicator Graduation Rate Attendance Rate Current Year Prior Year All Students: Not Met Not Met Met 88.5 90.3 95 Students with IEPs: ** ** ** ** ** ** Limited English Proficient: ** ** ** ** ** ** Economically Disadvantaged: Not Met Not Met ** 74.3 88.1 ** Asian: ** ** ** ** ** ** Black: ** ** ** ** ** ** Hispanic: ** ** ** ** ** ** Native American: ** ** ** ** ** ** White: Not Met Not Met ** 90.9 88.7 **
Transcript of Mississippi Statewide Accountability System

1
Webster County School District (7800)
East Webster High School (7800004) No Child
Left Behind
2013-2014
School
Report Card
The No Child Left Behind Act of 2001 (NCLB) requires each state to use a unified accountability model. School, district, and state report cards that contain the following accountability information must be produced and made available publicly.
Mississippi Statewide Accountability System The Mississippi Statewide Accountability System (MSAS) is a single “A” through “F” school and district accountability system based on the requirements of Federal law under the Elementary and Secondary Education Act Flexibility Request and Mississippi Code 37-17-6. The MSAS assigns performance classifications based on 1) student achievement, 2) student growth, and 3) graduation, if applicable. For the 2013-2014 school year, the U. S. Department of Education granted Mississippi a one-year waiver from school performance classifications due to the implementation of Mississippi’s College and Career Readiness Standards. The waiver allowed districts and schools to retain the letter grade received in the 2012-2013 school year if the 2013-2014 grade was lower as a result of assessment results.
Current Year Prior Year Official Grade: A A
Without Waiver Grade: A **
4-Year Graduation Rate: 88.5 90.3
Notes: Only districts and schools serving grade 1 or higher or higher are eligible to receive a performance classification. The Without Waiver Grade only applies the 2013-2014 school year. Possible Accountability Status: A, B, C, D, F. (N/A – The school did not receive a performance classification due to not having available data.)
ESEA Annual Measurable Objective (AMO) A district or school is responsible for meeting annual measurable objectives (AMO) in three areas: Reading/Language Arts, Mathematics, and a third academic indicator referred to as the “Other Academic Indicator.” The “Other Academic Indicator” for schools and districts without a grade 12 is the attendance rate. For schools and districts with a grade 12, the indicator is the graduation rate. If a district or school does not meet an AMO in any one of the three areas, the district or school is considered to have not met AMOs.
Current Year Prior Year
District AMO Status: Not Met Met
Reading/Language Arts Status: Not Met Met
Mathematics Status: Not Met Met
Other Academic Indicator Status: Met Met
Differentiated Accountability Label: Not Meeting AMOs High Performing Reward
AMO Subgroup Results
Student Groups Reading/
Language Arts Mathematics
Other Academic Indicator
Graduation Rate Attendance
Rate Current
Year
Prior
Year
All Students: Not Met Not Met Met 88.5 90.3 95
Students with IEPs: ** ** ** ** ** **
Limited English Proficient: ** ** ** ** ** **
Economically Disadvantaged: Not Met Not Met ** 74.3 88.1 **
Asian: ** ** ** ** ** **
Black: ** ** ** ** ** **
Hispanic: ** ** ** ** ** **
Native American: ** ** ** ** ** **
White: Not Met Not Met ** 90.9 88.7 **

2
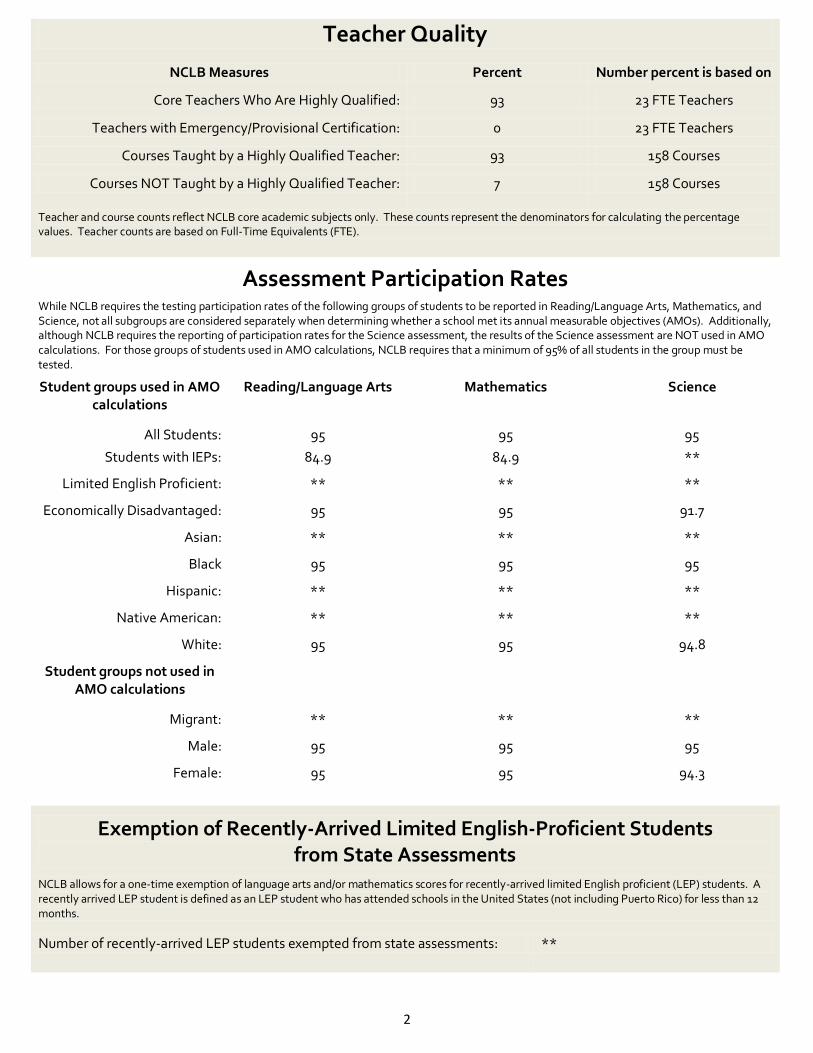
Teacher Quality
NCLB Measures Percent Number percent is based on
Core Teachers Who Are Highly Qualified: 98 23 FTE Teachers
Teachers with Emergency/Provisional Certification: 0 23 FTE Teachers
Courses Taught by a Highly Qualified Teacher: 97 134 Courses
Courses NOT Taught by a Highly Qualified Teacher: 3 134 Courses
Teacher and course counts reflect NCLB core academic subjects only. These counts represent the denominators for calculating the percentage values. Teacher counts are based on Full-Time Equivalents (FTE).
Assessment Participation Rates While NCLB requires the testing participation rates of the following groups of students to be reported in Reading/Language Arts, Mathematics, and Science, not all subgroups are considered separately when determining whether a school met its annual measurable objectives (AMOs). Additionally, although NCLB requires the reporting of participation rates for the Science assessment, the results of the Science assessment are NOT used in AMO calculations. For those groups of students used in AMO calculations, NCLB requires that a minimum of 95% of all students in the group must be tested.
Student groups used in AMO calculations
Reading/Language Arts Mathematics Science
All Students: 95 95 95
Students with IEPs: 95 95 **
Limited English Proficient: ** ** **
Economically Disadvantaged: 95 95 95
Asian: ** ** **
Black 95 95 95
Hispanic: ** ** **
Native American: ** ** **
White: 95 95 95
Student groups not used in AMO calculations
Migrant: ** ** **
Male: 95 95 95
Female: 95 95 95
Exemption of Recently-Arrived Limited English-Proficient Students from State Assessments
NCLB allows for a one-time exemption of language arts and/or mathematics scores for recently-arrived limited English proficient (LEP) students. A recently arrived LEP student is defined as an LEP student who has attended schools in the United States (not including Puerto Rico) for less than 12 months.
Number of recently-arrived LEP students exempted from state assessments: **
3
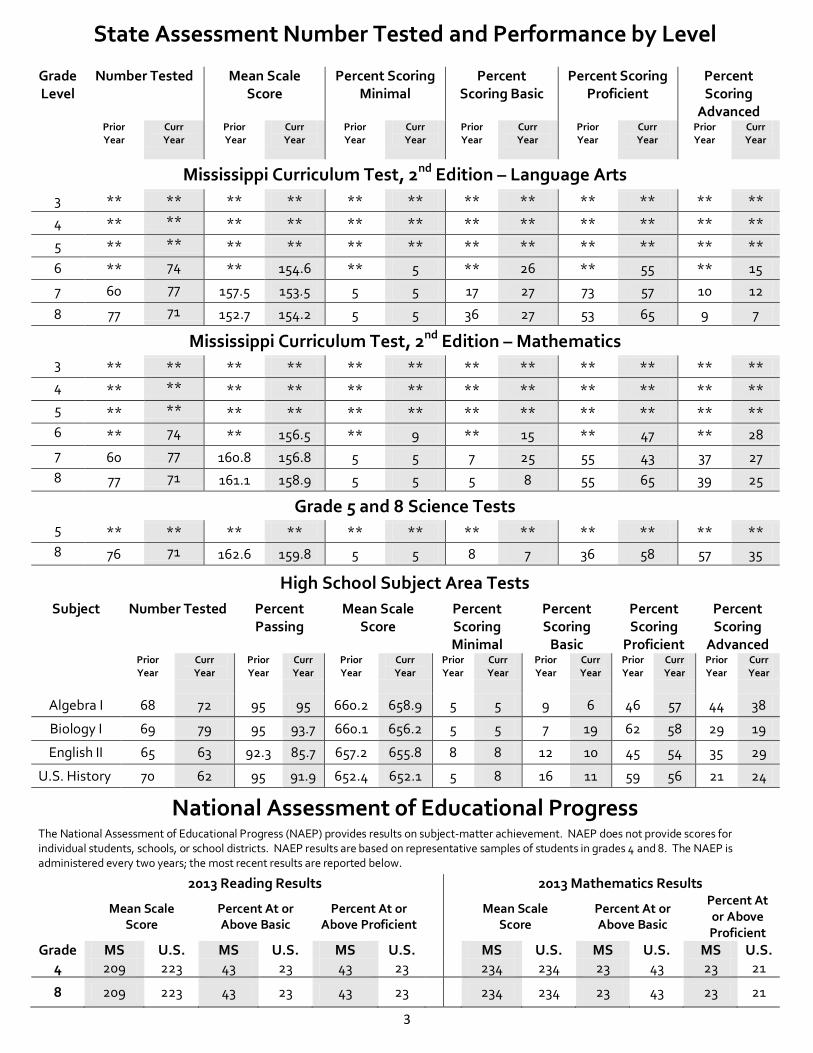
State Assessment Number Tested and Performance by Level
Grade Level
Number Tested Mean Scale Score
Percent Scoring Minimal
Percent Scoring Basic
Percent Scoring Proficient
Percent Scoring
Advanced Prior
Year
Curr Year
Prior Year
Curr Year
Prior Year
Curr Year
Prior Year
Curr Year
Prior Year
Curr Year
Prior Year
Curr Year
Mississippi Curriculum Test, 2nd Edition – Language Arts
3 ** ** ** ** ** ** ** ** ** ** ** **
4 ** ** ** ** ** ** ** ** ** ** ** **
5 ** ** ** ** ** ** ** ** ** ** ** **
6 ** 74 ** 154.6 ** 5 ** 26 ** 55 ** 15
7 60 77 157.5 153.5 5 5 17 27 73 57 10 12
8 77 71 152.7 154.2 5 5 36 27 53 65 9 7
Mississippi Curriculum Test, 2nd Edition – Mathematics 3 ** ** ** ** ** ** ** ** ** ** ** **
4 ** ** ** ** ** ** ** ** ** ** ** **
5 ** ** ** ** ** ** ** ** ** ** ** **
6 ** 74 ** 156.5 ** 9 ** 15 ** 47 ** 28
7 60 77 160.8 156.8 5 5 7 25 55 43 37 27
8 77 71 161.1 158.9 5 5 5 8 55 65 39 25
Grade 5 and 8 Science Tests 5 ** ** ** ** ** ** ** ** ** ** ** **
8 76 71 162.6 159.8 5 5 8 7 36 58 57 35
High School Subject Area Tests
Subject Number Tested Percent Passing
Mean Scale Score
Percent Scoring Minimal
Percent Scoring
Basic
Percent Scoring
Proficient
Percent Scoring
Advanced Prior
Year
Curr Year
Prior Year
Curr Year
Prior Year
Curr Year
Prior Year
Curr Year
Prior Year
Curr Year
Prior Year
Curr Year
Prior Year
Curr Year
Algebra I 68 72 95 95 660.2 658.9 5 5 9 6 46 57 44 38
Biology I 69 79 95 93.7 660.1 656.2 5 5 7 19 62 58 29 19
English II 65 63 92.3 85.7 657.2 655.8 8 8 12 10 45 54 35 29
U.S. History 70 62 95 91.9 652.4 652.1 5 8 16 11 59 56 21 24
National Assessment of Educational Progress The National Assessment of Educational Progress (NAEP) provides results on subject-matter achievement. NAEP does not provide scores for individual students, schools, or school districts. NAEP results are based on representative samples of students in grades 4 and 8. The NAEP is administered every two years; the most recent results are reported below.
2013 Reading Results 2013 Mathematics Results
Mean Scale Score
Percent At or Above Basic
Percent At or Above Proficient
Mean Scale
Score Percent At or Above Basic
Percent At or Above Proficient
Grade MS U.S. MS U.S. MS U.S. MS U.S. MS U.S. MS U.S. 4 209 223 43 23 43 23 234 234 23 43 23 21
8 209 223 43 23 43 23 234 234 23 43 23 21

4
Percent of Students Scoring Proficient and Above 2013-2014 Assessments
Gra
de/
Subj
ect
All
Stu
den
ts
Dis
able
d O
nly
Lim
ited
Eng
lish
Pro
fici
ent
Eco
no
mic
ally
Dis
adva
nta
ged
Asi
an
Bla
ck
His
pan
ic
Nat
ive
Am
eric
an
Wh
ite
Fem
ale
Mal
e
Mig
ran
t
Gra
de/
Subj
ect
All
Stu
den
ts
Dis
able
d O
nly
Lim
ited
Eng
lish
Pro
fici
ent
Eco
no
mic
ally
Dis
adva
nta
ged
Asi
an
Bla
ck
His
pan
ic
Nat
ive
Am
eric
an
Wh
ite
Fem
ale
Mal
e
Mig
ran
t
Mississippi Curriculum Test, 2nd Edition –
Language Arts
Mississippi Curriculum Test, 2nd Edition –Mathematics
3 ** ** ** ** ** ** ** ** ** ** ** ** 3 ** ** ** ** ** ** ** ** ** ** ** **
4 ** ** ** ** ** ** ** ** ** ** ** ** 4 ** ** ** ** ** ** ** ** ** ** ** **
5 ** ** ** ** ** ** ** ** ** ** ** ** 5 ** ** ** ** ** ** ** ** ** ** ** **
6 70 40 ** 50 ** 50 ** ** 72 81 58 ** 6 75 40 ** 67 ** 50 ** ** 78 81 69 **
7 69 31 ** 50 ** 43 5 ** 76 71 67 ** 7 71 46 ** 59 ** 57 5 ** 75 76 64 **
8 74 60 ** 61 ** 57 ** ** 75 74 74 ** 8 90 95 ** 83 ** 86 ** ** 90 85 94 **
Mississippi Alternate Assessment of the Extended Curriculum Frameworks –
Language Arts
Mississippi Alternate Assessment of the Extended Curriculum Frameworks –
Mathematics
3 ** ** ** ** ** ** ** ** ** ** ** ** 3 ** ** ** ** ** ** ** ** ** ** ** **
4 ** ** ** ** ** ** ** ** ** ** ** ** 4 ** ** ** ** ** ** ** ** ** ** ** **
5 ** ** ** ** ** ** ** ** ** ** ** ** 5 ** ** ** ** ** ** ** ** ** ** ** **
6 76 40 ** 68 ** 50 ** ** 78 82 69 ** 6 ** ** ** ** ** ** ** ** ** ** ** **
7 70 46 ** 59 ** 57 5 ** 74 76 63 ** 7 ** ** ** ** ** ** ** ** ** ** ** **
8 90 95 ** 85 ** 88 ** ** 90 86 94 ** 8 ** ** ** ** ** ** ** ** ** ** ** **
Grades 5 and 8 Science Tests
Mississippi Alternate Assessment of the Extended Curriculum Frameworks –
Science
5 ** ** ** ** ** ** ** ** ** ** ** ** 5 ** ** ** ** ** ** ** ** ** ** ** **
8 93 95 ** 81 ** 75 ** ** 95 94 92 ** 8 95 95 ** 95 ** 95 ** ** ** ** 95 **
High School Subject Area Tests
Mississippi Alternate Assessment of the Extended Curriculum Frameworks –
Secondary
Algebra I
94 95 ** 95 ** 95 ** ** 93 88 95 ** Math ** ** ** ** ** ** ** ** ** ** ** **
Biology I
92 95 ** 94 ** 95 ** ** 91 88 94 ** Science ** ** ** ** ** ** ** ** ** ** ** **
English II
87 95 ** 86 ** 67 ** ** 88 91 84 ** Language
Arts ** ** ** ** ** ** ** ** ** ** ** **
U.S. History
81 95 ** 65 ** 38 ** ** 87 73 92 **

5
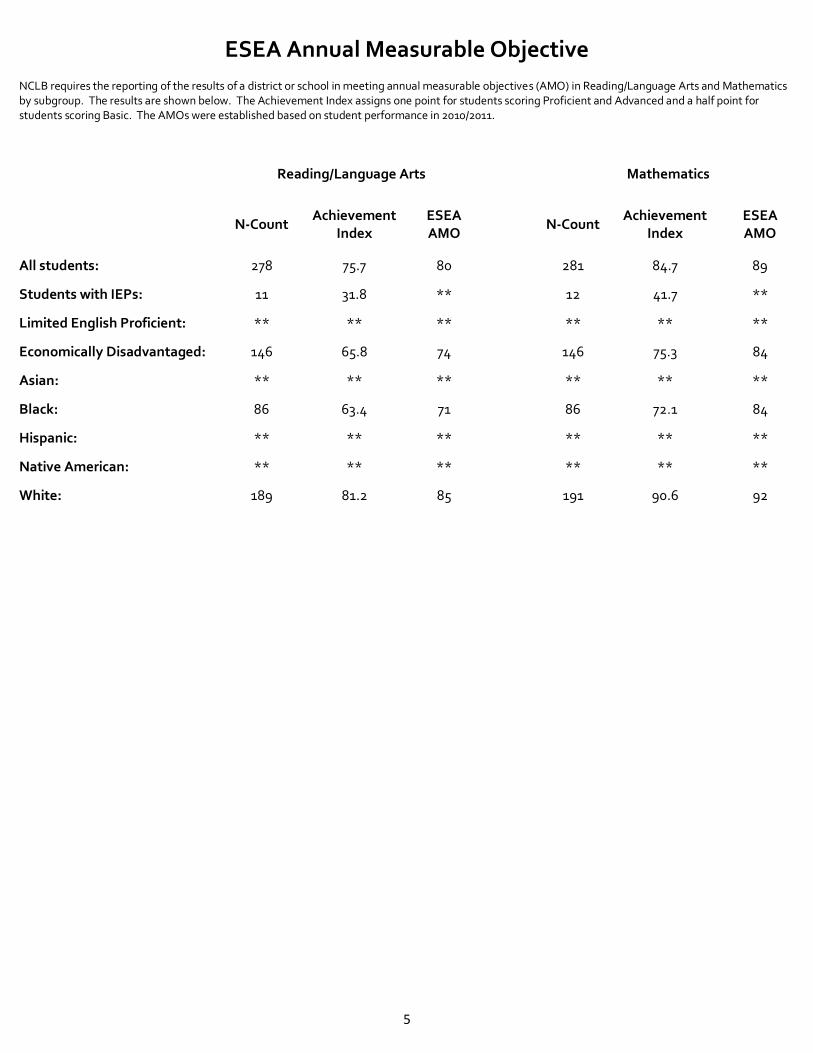
ESEA Annual Measurable Objective
NCLB requires the reporting of the results of a district or school in meeting annual measurable objectives (AMO) in Reading/Language Arts and Mathematics by subgroup. The results are shown below. The Achievement Index assigns one point for students scoring Proficient and Advanced and a half point for students scoring Basic. The AMOs were established based on student performance in 2010/2011.
Reading/Language Arts Mathematics
N-Count
Achievement Index
ESEA AMO
N-Count Achievement
Index ESEA AMO
All students: 274 85.8 87 281 88.8 93
Students with IEPs: 27 72.2 ** 29 81 **
Limited English Proficient: ** ** ** ** ** **
Economically Disadvantaged: 93 77.4 81 97 82.5 91
Asian: ** ** ** ** ** **
Black: 30 73.3 ** 34 82.4 **
Hispanic: ** ** ** ** ** **
Native American: ** ** ** ** ** **
White: 243 87.4 89 245 89.8 93

6
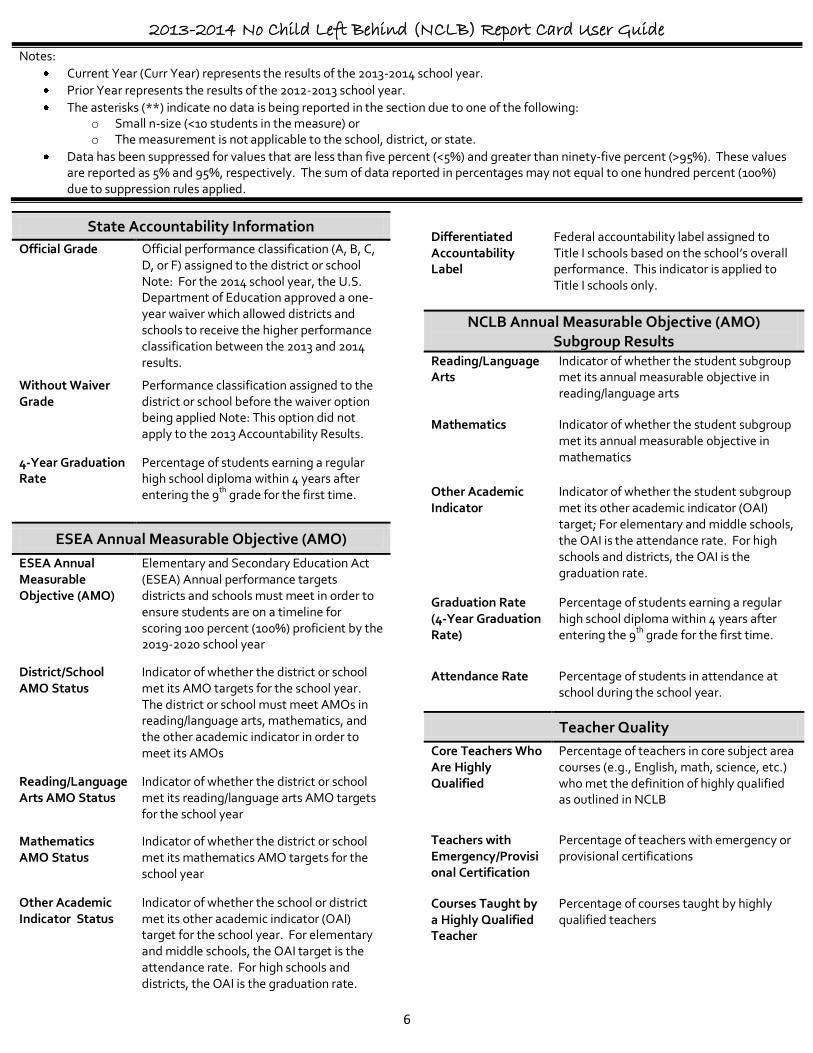
2013-2014 No Child Left Behind (NCLB) Report Card User Guide
Notes:
Current Year (Curr Year) represents the results of the 2013-2014 school year.
Prior Year represents the results of the 2012-2013 school year.
The asterisks (**) indicate no data is being reported in the section due to one of the following: o Small n-size (<10 students in the measure) or o The measurement is not applicable to the school, district, or state.
Data has been suppressed for values that are less than five percent (<5%) and greater than ninety-five percent (>95%). These values are reported as 5% and 95%, respectively. The sum of data reported in percentages may not equal to one hundred percent (100%) due to suppression rules applied.
State Accountability Information
Official Grade Official performance classification (A, B, C, D, or F) assigned to the district or school Note: For the 2014 school year, the U.S. Department of Education approved a one- year waiver which allowed districts and schools to receive the higher performance classification between the 2013 and 2014 results.
Without Waiver Grade
Performance classification assigned to the district or school before the waiver option being applied Note: This option did not apply to the 2013 Accountability Results.
4-Year Graduation Rate
Percentage of students earning a regular high school diploma within 4 years after entering the 9th grade for the first time.
ESEA Annual Measurable Objective (AMO)
ESEA Annual Measurable Objective (AMO)
Elementary and Secondary Education Act (ESEA) Annual performance targets districts and schools must meet in order to ensure students are on a timeline for scoring 100 percent (100%) proficient by the 2019-2020 school year
District/School AMO Status
Indicator of whether the district or school met its AMO targets for the school year. The district or school must meet AMOs in reading/language arts, mathematics, and the other academic indicator in order to meet its AMOs
Reading/Language Arts AMO Status
Indicator of whether the district or school met its reading/language arts AMO targets for the school year
Mathematics AMO Status
Indicator of whether the district or school met its mathematics AMO targets for the school year
Other Academic Indicator Status
Indicator of whether the school or district met its other academic indicator (OAI) target for the school year. For elementary and middle schools, the OAI target is the attendance rate. For high schools and districts, the OAI is the graduation rate.
Differentiated Accountability Label
Federal accountability label assigned to Title I schools based on the school’s overall performance. This indicator is applied to Title I schools only.
NCLB Annual Measurable Objective (AMO) Subgroup Results
Reading/Language Arts
Indicator of whether the student subgroup met its annual measurable objective in reading/language arts
Mathematics Indicator of whether the student subgroup met its annual measurable objective in mathematics
Other Academic Indicator
Indicator of whether the student subgroup met its other academic indicator (OAI) target; For elementary and middle schools, the OAI is the attendance rate. For high schools and districts, the OAI is the graduation rate.
Graduation Rate (4-Year Graduation Rate)
Percentage of students earning a regular high school diploma within 4 years after entering the 9th grade for the first time.
Attendance Rate Percentage of students in attendance at school during the school year.
Teacher Quality
Core Teachers Who Are Highly Qualified
Percentage of teachers in core subject area courses (e.g., English, math, science, etc.) who met the definition of highly qualified as outlined in NCLB
Teachers with Emergency/Provisional Certification
Percentage of teachers with emergency or provisional certifications
Courses Taught by a Highly Qualified Teacher
Percentage of courses taught by highly qualified teachers

7
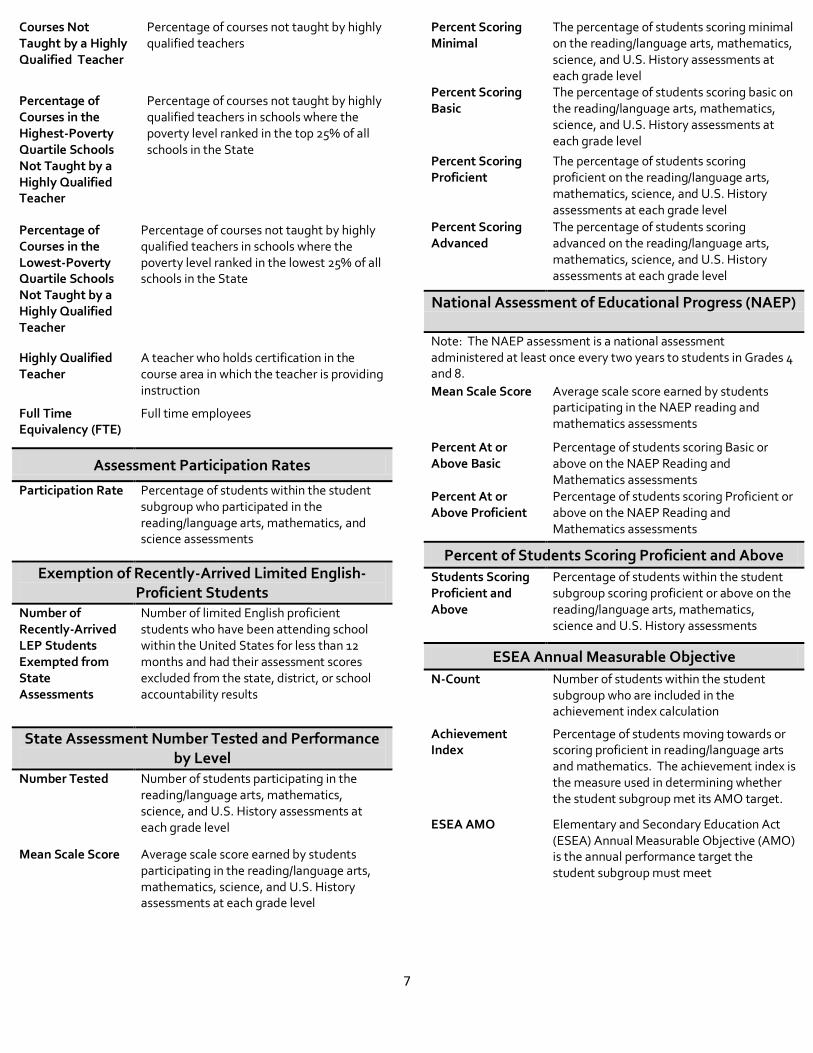
Courses Not Taught by a Highly Qualified Teacher
Percentage of courses not taught by highly qualified teachers
Percentage of Courses in the Highest-Poverty Quartile Schools Not Taught by a Highly Qualified Teacher
Percentage of courses not taught by highly qualified teachers in schools where the poverty level ranked in the top 25% of all schools in the State
Percentage of Courses in the Lowest-Poverty Quartile Schools Not Taught by a Highly Qualified Teacher
Percentage of courses not taught by highly qualified teachers in schools where the poverty level ranked in the lowest 25% of all schools in the State
Highly Qualified Teacher
A teacher who holds certification in the course area in which the teacher is providing instruction
Full Time Equivalency (FTE)
Full time employees
Assessment Participation Rates
Participation Rate Percentage of students within the student subgroup who participated in the reading/language arts, mathematics, and science assessments
Exemption of Recently-Arrived Limited English-Pr0ficient Students
Number of Recently-Arrived LEP Students Exempted from State Assessments
Number of limited English proficient students who have been attending school within the United States for less than 12 months and had their assessment scores excluded from the state, district, or school accountability results
State Assessment Number Tested and Performance by Level
Number Tested Number of students participating in the reading/language arts, mathematics, science, and U.S. History assessments at each grade level
Mean Scale Score Average scale score earned by students participating in the reading/language arts, mathematics, science, and U.S. History assessments at each grade level
Percent Scoring Minimal
The percentage of students scoring minimal on the reading/language arts, mathematics, science, and U.S. History assessments at each grade level
Percent Scoring Basic
The percentage of students scoring basic on the reading/language arts, mathematics, science, and U.S. History assessments at each grade level
Percent Scoring Proficient
The percentage of students scoring proficient on the reading/language arts, mathematics, science, and U.S. History assessments at each grade level
Percent Scoring Advanced
The percentage of students scoring advanced on the reading/language arts, mathematics, science, and U.S. History assessments at each grade level
National Assessment of Educational Progress (NAEP)
Note: The NAEP assessment is a national assessment administered at least once every two years to students in Grades 4 and 8.
Mean Scale Score Average scale score earned by students participating in the NAEP reading and mathematics assessments
Percent At or Above Basic
Percentage of students scoring Basic or above on the NAEP Reading and Mathematics assessments
Percent At or Above Proficient
Percentage of students scoring Proficient or above on the NAEP Reading and Mathematics assessments
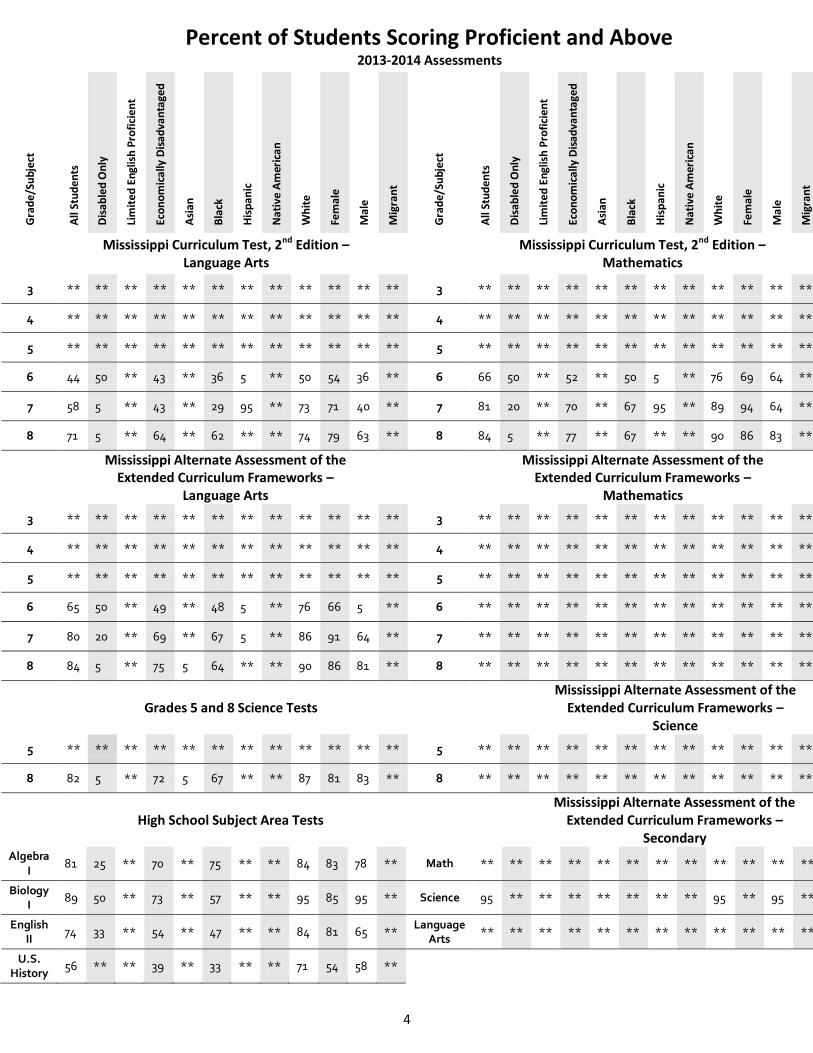
Percent of Students Scoring Proficient and Above
Students Scoring Proficient and Above
Percentage of students within the student subgroup scoring proficient or above on the reading/language arts, mathematics, science and U.S. History assessments
ESEA Annual Measurable Objective
N-Count Number of students within the student subgroup who are included in the achievement index calculation
Achievement Index
Percentage of students moving towards or scoring proficient in reading/language arts and mathematics. The achievement index is the measure used in determining whether the student subgroup met its AMO target.
ESEA AMO Elementary and Secondary Education Act (ESEA) Annual Measurable Objective (AMO) is the annual performance target the student subgroup must meet

1
Webster County School District (7800)
Eupora Elementary School (7800008) No Child
Left Behind
2013-2014
School
Report Card
The No Child Left Behind Act of 2001 (NCLB) requires each state to use a unified accountability model. School, district, and state report cards that contain the following accountability information must be produced and made available publicly.
Mississippi Statewide Accountability System The Mississippi Statewide Accountability System (MSAS) is a single “A” through “F” school and district accountability system based on the requirements of Federal law under the Elementary and Secondary Education Act Flexibility Request and Mississippi Code 37-17-6. The MSAS assigns performance classifications based on 1) student achievement, 2) student growth, and 3) graduation, if applicable. For the 2013-2014 school year, the U. S. Department of Education granted Mississippi a one-year waiver from school performance classifications due to the implementation of Mississippi’s College and Career Readiness Standards. The waiver allowed districts and schools to retain the letter grade received in the 2012-2013 school year if the 2013-2014 grade was lower as a result of assessment results.
Current Year Prior Year Official Grade: C C
Without Waiver Grade: D **
4-Year Graduation Rate: ** **
Notes: Only districts and schools serving grade 1 or higher or higher are eligible to receive a performance classification. The Without Waiver Grade only applies the 2013-2014 school year. Possible Accountability Status: A, B, C, D, F. (N/A – The school did not receive a performance classification due to not having available data.)
ESEA Annual Measurable Objective (AMO) A district or school is responsible for meeting annual measurable objectives (AMO) in three areas: Reading/Language Arts, Mathematics, and a third academic indicator referred to as the “Other Academic Indicator.” The “Other Academic Indicator” for schools and districts without a grade 12 is the attendance rate. For schools and districts with a grade 12, the indicator is the graduation rate. If a district or school does not meet an AMO in any one of the three areas, the district or school is considered to have not met AMOs.
Current Year Prior Year
District AMO Status: Not Met Not Met
Reading/Language Arts Status: Not Met Not Met
Mathematics Status: Not Met Not Met
Other Academic Indicator Status: Met Met
Differentiated Accountability Label: Not Meeting AMOs Approaching Target
AMO Subgroup Results
Student Groups Reading/
Language Arts Mathematics
Other Academic Indicator
Graduation Rate Attendance
Rate Current
Year
Prior
Year
All Students: Not Met Not Met Met ** ** 95
Students with IEPs: Not Met Met ** ** ** **
Limited English Proficient: ** ** ** ** ** **
Economically Disadvantaged: Not Met Met ** ** ** **
Asian: ** ** ** ** ** **
Black: Not Met Not Met ** ** ** **
Hispanic: ** ** ** ** ** **
Native American: ** ** ** ** ** **
White: Not Met Not Met ** ** ** **

2
Teacher Quality
NCLB Measures Percent Number percent is based on
Core Teachers Who Are Highly Qualified: 100 21 FTE Teachers
Teachers with Emergency/Provisional Certification: 0 21 FTE Teachers
Courses Taught by a Highly Qualified Teacher: 100 127 Courses
Courses NOT Taught by a Highly Qualified Teacher: 0 127 Courses
Teacher and course counts reflect NCLB core academic subjects only. These counts represent the denominators for calculating the percentage values. Teacher counts are based on Full-Time Equivalents (FTE).
Assessment Participation Rates While NCLB requires the testing participation rates of the following groups of students to be reported in Reading/Language Arts, Mathematics, and Science, not all subgroups are considered separately when determining whether a school met its annual measurable objectives (AMOs). Additionally, although NCLB requires the reporting of participation rates for the Science assessment, the results of the Science assessment are NOT used in AMO calculations. For those groups of students used in AMO calculations, NCLB requires that a minimum of 95% of all students in the group must be tested.
Student groups used in AMO calculations
Reading/Language Arts Mathematics Science
All Students: 95 95 95
Students with IEPs: 95 95 95
Limited English Proficient: ** ** **
Economically Disadvantaged: 95 95 95
Asian: ** ** **
Black 95 95 95
Hispanic: ** ** **
Native American: ** ** **
White: 95 95 95
Student groups not used in AMO calculations
Migrant: ** ** **
Male: 95 95 95
Female: 95 95 95
Exemption of Recently-Arrived Limited English-Proficient Students from State Assessments
NCLB allows for a one-time exemption of language arts and/or mathematics scores for recently-arrived limited English proficient (LEP) students. A recently arrived LEP student is defined as an LEP student who has attended schools in the United States (not including Puerto Rico) for less than 12 months.
Number of recently-arrived LEP students exempted from state assessments: **

3
State Assessment Number Tested and Performance by Level
Grade Level
Number Tested Mean Scale Score
Percent Scoring Minimal
Percent Scoring Basic
Percent Scoring Proficient
Percent Scoring
Advanced Prior
Year
Curr Year
Prior Year
Curr Year
Prior Year
Curr Year
Prior Year
Curr Year
Prior Year
Curr Year
Prior Year
Curr Year
Mississippi Curriculum Test, 2nd Edition – Language Arts
3 64 74 144.5 151.3 23 9 38 39 30 30 9 22
4 74 66 151.9 150.5 10 20 27 21 45 41 19 18
5 76 74 147 150.1 24 11 33 34 34 45 9 11
6 54 ** 149.8 ** 13 ** 28 ** 57 ** 5 **
7 ** ** ** ** ** ** ** ** ** ** ** **
8 ** ** ** ** ** ** ** ** ** ** ** **
Mississippi Curriculum Test, 2nd Edition – Mathematics 3 64 74 151.4 157.4 11 5 34 20 45 55 9 23
4 74 66 154 151.6 5 12 32 35 47 42 15 11
5 76 74 154.2 153.9 12 12 25 27 36 38 28 23
6 54 ** 157.4 ** 9 ** 6 ** 61 ** 24 **
7 ** ** ** ** ** ** ** ** ** ** ** **
8 ** ** ** ** ** ** ** ** ** ** ** **
Grade 5 and 8 Science Tests 5 77 74 154.8 155.6 9 5 27 22 29 38 35 35
8 ** ** ** ** ** ** ** ** ** ** ** **
High School Subject Area Tests
Subject Number Tested Percent Passing
Mean Scale Score
Percent Scoring Minimal
Percent Scoring
Basic
Percent Scoring
Proficient
Percent Scoring
Advanced Prior
Year
Curr Year
Prior Year
Curr Year
Prior Year
Curr Year
Prior Year
Curr Year
Prior Year
Curr Year
Prior Year
Curr Year
Prior Year
Curr Year
Algebra I ** ** ** ** ** ** ** ** ** ** ** ** ** **
Biology I ** ** ** ** ** ** ** ** ** ** ** ** ** **
English II ** ** ** ** ** ** ** ** ** ** ** ** ** **
U.S. History ** ** ** ** ** ** ** ** ** ** ** ** ** **
National Assessment of Educational Progress The National Assessment of Educational Progress (NAEP) provides results on subject-matter achievement. NAEP does not provide scores for individual students, schools, or school districts. NAEP results are based on representative samples of students in grades 4 and 8. The NAEP is administered every two years; the most recent results are reported below.
2013 Reading Results 2013 Mathematics Results
Mean Scale Score
Percent At or Above Basic
Percent At or Above Proficient
Mean Scale
Score Percent At or Above Basic
Percent At or Above Proficient
Grade MS U.S. MS U.S. MS U.S. MS U.S. MS U.S. MS U.S. 4 209 223 43 23 43 23 234 234 23 43 23 21
8 209 223 43 23 43 23 234 234 23 43 23 21

4
Percent of Students Scoring Proficient and Above 2013-2014 Assessments
Gra
de/
Subj
ect
All
Stu
den
ts
Dis
able
d O
nly
Lim
ited
Eng
lish
Pro
fici
ent
Eco
no
mic
ally
Dis
adva
nta
ged
Asi
an
Bla
ck
His
pan
ic
Nat
ive
Am
eric
an
Wh
ite
Fem
ale
Mal
e
Mig
ran
t
Gra
de/
Subj
ect
All
Stu
den
ts
Dis
able
d O
nly
Lim
ited
Eng
lish
Pro
fici
ent
Eco
no
mic
ally
Dis
adva
nta
ged
Asi
an
Bla
ck
His
pan
ic
Nat
ive
Am
eric
an
Wh
ite
Fem
ale
Mal
e
Mig
ran
t
Mississippi Curriculum Test, 2nd Edition –
Language Arts
Mississippi Curriculum Test, 2nd Edition –Mathematics
3 51 43 ** 38 ** 33 5 ** 57 48 52 ** 3 77 79 ** 68 ** 67 95 ** 80 71 82 **
4 60 40 ** 57 ** 52 ** ** 63 63 55 ** 4 54 40 ** 50 ** 33 ** ** 63 50 59 **
5 54 38 ** 47 ** 43 ** ** 64 58 51 ** 5 61 25 ** 53 ** 43 ** ** 73 55 65 **
6 ** ** ** ** ** ** ** ** ** ** ** ** 6 ** ** ** ** ** ** ** ** ** ** ** **
7 ** ** ** ** ** ** ** ** ** ** ** ** 7 ** ** ** ** ** ** ** ** ** ** ** **
8 ** ** ** ** ** ** ** ** ** ** ** ** 8 ** ** ** ** ** ** ** ** ** ** ** **
Mississippi Alternate Assessment of the Extended Curriculum Frameworks –
Language Arts
Mississippi Alternate Assessment of the Extended Curriculum Frameworks –
Mathematics
3 78 79 ** 69 ** 67 5 ** 81 74 81 ** 3 ** ** ** ** ** ** ** ** ** ** ** **
4 53 40 ** 49 ** 33 ** ** 62 50 57 ** 4 ** ** ** ** ** ** ** ** ** ** ** **
5 60 25 ** 52 ** 43 ** ** 72 55 64 ** 5 ** ** ** ** ** ** ** ** ** ** ** **
6 ** ** ** ** ** ** ** ** ** ** ** ** 6 ** ** ** ** ** ** ** ** ** ** ** **
7 ** ** ** ** ** ** ** ** ** ** ** ** 7 ** ** ** ** ** ** ** ** ** ** ** **
8 ** ** ** ** ** ** ** ** ** ** ** ** 8 ** ** ** ** ** ** ** ** ** ** ** **
Grades 5 and 8 Science Tests
Mississippi Alternate Assessment of the Extended Curriculum Frameworks –
Science
5 73 50 ** 66 ** 64 ** ** 80 71 74 ** 5 50 50 ** 50 ** 50 ** ** ** 95 5 **
8 ** ** ** ** ** ** ** ** ** ** ** ** 8 ** ** ** ** ** ** ** ** ** ** ** **
High School Subject Area Tests
Mississippi Alternate Assessment of the Extended Curriculum Frameworks –
Secondary
Algebra I
** ** ** ** ** ** ** ** ** ** ** ** Math ** ** ** ** ** ** ** ** ** ** ** **
Biology I
** ** ** ** ** ** ** ** ** ** ** ** Science ** ** ** ** ** ** ** ** ** ** ** **
English II
** ** ** ** ** ** ** ** ** ** ** ** Language
Arts ** ** ** ** ** ** ** ** ** ** ** **
U.S. History
** ** ** ** ** ** ** ** ** ** ** **

5
ESEA Annual Measurable Objective
NCLB requires the reporting of the results of a district or school in meeting annual measurable objectives (AMO) in Reading/Language Arts and Mathematics by subgroup. The results are shown below. The Achievement Index assigns one point for students scoring Proficient and Advanced and a half point for students scoring Basic. The AMOs were established based on student performance in 2010/2011.
Reading/Language Arts Mathematics
N-Count
Achievement Index
ESEA AMO
N-Count Achievement
Index ESEA AMO
All students: 213 70.9 78 213 77.9 81
Students with IEPs: 27 51.9 61 27 66.7 65
Limited English Proficient: ** ** ** ** ** **
Economically Disadvantaged: 143 66.4 72 143 74.1 74
Asian: ** ** ** ** ** **
Black: 67 62.7 69 67 66.4 67
Hispanic: ** ** ** ** ** **
Native American: ** ** ** ** ** **
White: 138 75.4 82 138 83.3 87

6
2013-2014 No Child Left Behind (NCLB) Report Card User Guide
Notes:
Current Year (Curr Year) represents the results of the 2013-2014 school year.
Prior Year represents the results of the 2012-2013 school year.
The asterisks (**) indicate no data is being reported in the section due to one of the following: o Small n-size (<10 students in the measure) or o The measurement is not applicable to the school, district, or state.
Data has been suppressed for values that are less than five percent (<5%) and greater than ninety-five percent (>95%). These values are reported as 5% and 95%, respectively. The sum of data reported in percentages may not equal to one hundred percent (100%) due to suppression rules applied.
State Accountability Information
Official Grade Official performance classification (A, B, C, D, or F) assigned to the district or school Note: For the 2014 school year, the U.S. Department of Education approved a one- year waiver which allowed districts and schools to receive the higher performance classification between the 2013 and 2014 results.
Without Waiver Grade
Performance classification assigned to the district or school before the waiver option being applied Note: This option did not apply to the 2013 Accountability Results.
4-Year Graduation Rate
Percentage of students earning a regular high school diploma within 4 years after entering the 9th grade for the first time.
ESEA Annual Measurable Objective (AMO)
ESEA Annual Measurable Objective (AMO)
Elementary and Secondary Education Act (ESEA) Annual performance targets districts and schools must meet in order to ensure students are on a timeline for scoring 100 percent (100%) proficient by the 2019-2020 school year
District/School AMO Status
Indicator of whether the district or school met its AMO targets for the school year. The district or school must meet AMOs in reading/language arts, mathematics, and the other academic indicator in order to meet its AMOs
Reading/Language Arts AMO Status
Indicator of whether the district or school met its reading/language arts AMO targets for the school year
Mathematics AMO Status
Indicator of whether the district or school met its mathematics AMO targets for the school year
Other Academic Indicator Status
Indicator of whether the school or district met its other academic indicator (OAI) target for the school year. For elementary and middle schools, the OAI target is the attendance rate. For high schools and districts, the OAI is the graduation rate.
Differentiated Accountability Label
Federal accountability label assigned to Title I schools based on the school’s overall performance. This indicator is applied to Title I schools only.
NCLB Annual Measurable Objective (AMO) Subgroup Results
Reading/Language Arts
Indicator of whether the student subgroup met its annual measurable objective in reading/language arts
Mathematics Indicator of whether the student subgroup met its annual measurable objective in mathematics
Other Academic Indicator
Indicator of whether the student subgroup met its other academic indicator (OAI) target; For elementary and middle schools, the OAI is the attendance rate. For high schools and districts, the OAI is the graduation rate.
Graduation Rate (4-Year Graduation Rate)
Percentage of students earning a regular high school diploma within 4 years after entering the 9th grade for the first time.
Attendance Rate Percentage of students in attendance at school during the school year.
Teacher Quality
Core Teachers Who Are Highly Qualified
Percentage of teachers in core subject area courses (e.g., English, math, science, etc.) who met the definition of highly qualified as outlined in NCLB
Teachers with Emergency/Provisional Certification
Percentage of teachers with emergency or provisional certifications
Courses Taught by a Highly Qualified Teacher
Percentage of courses taught by highly qualified teachers

7
Courses Not Taught by a Highly Qualified Teacher
Percentage of courses not taught by highly qualified teachers
Percentage of Courses in the Highest-Poverty Quartile Schools Not Taught by a Highly Qualified Teacher
Percentage of courses not taught by highly qualified teachers in schools where the poverty level ranked in the top 25% of all schools in the State
Percentage of Courses in the Lowest-Poverty Quartile Schools Not Taught by a Highly Qualified Teacher
Percentage of courses not taught by highly qualified teachers in schools where the poverty level ranked in the lowest 25% of all schools in the State
Highly Qualified Teacher
A teacher who holds certification in the course area in which the teacher is providing instruction
Full Time Equivalency (FTE)
Full time employees
Assessment Participation Rates
Participation Rate Percentage of students within the student subgroup who participated in the reading/language arts, mathematics, and science assessments
Exemption of Recently-Arrived Limited English-Pr0ficient Students
Number of Recently-Arrived LEP Students Exempted from State Assessments
Number of limited English proficient students who have been attending school within the United States for less than 12 months and had their assessment scores excluded from the state, district, or school accountability results
State Assessment Number Tested and Performance by Level
Number Tested Number of students participating in the reading/language arts, mathematics, science, and U.S. History assessments at each grade level
Mean Scale Score Average scale score earned by students participating in the reading/language arts, mathematics, science, and U.S. History assessments at each grade level
Percent Scoring Minimal
The percentage of students scoring minimal on the reading/language arts, mathematics, science, and U.S. History assessments at each grade level
Percent Scoring Basic
The percentage of students scoring basic on the reading/language arts, mathematics, science, and U.S. History assessments at each grade level
Percent Scoring Proficient
The percentage of students scoring proficient on the reading/language arts, mathematics, science, and U.S. History assessments at each grade level
Percent Scoring Advanced
The percentage of students scoring advanced on the reading/language arts, mathematics, science, and U.S. History assessments at each grade level
National Assessment of Educational Progress (NAEP)
Note: The NAEP assessment is a national assessment administered at least once every two years to students in Grades 4 and 8.
Mean Scale Score Average scale score earned by students participating in the NAEP reading and mathematics assessments
Percent At or Above Basic
Percentage of students scoring Basic or above on the NAEP Reading and Mathematics assessments
Percent At or Above Proficient
Percentage of students scoring Proficient or above on the NAEP Reading and Mathematics assessments
Percent of Students Scoring Proficient and Above
Students Scoring Proficient and Above
Percentage of students within the student subgroup scoring proficient or above on the reading/language arts, mathematics, science and U.S. History assessments
ESEA Annual Measurable Objective
N-Count Number of students within the student subgroup who are included in the achievement index calculation
Achievement Index
Percentage of students moving towards or scoring proficient in reading/language arts and mathematics. The achievement index is the measure used in determining whether the student subgroup met its AMO target.
ESEA AMO Elementary and Secondary Education Act (ESEA) Annual Measurable Objective (AMO) is the annual performance target the student subgroup must meet

1
Webster County School District (7800)
Eupora High School (7800010) No Child
Left Behind
2013-2014
School
Report Card
The No Child Left Behind Act of 2001 (NCLB) requires each state to use a unified accountability model. School, district, and state report cards that contain the following accountability information must be produced and made available publicly.
Mississippi Statewide Accountability System The Mississippi Statewide Accountability System (MSAS) is a single “A” through “F” school and district accountability system based on the requirements of Federal law under the Elementary and Secondary Education Act Flexibility Request and Mississippi Code 37-17-6. The MSAS assigns performance classifications based on 1) student achievement, 2) student growth, and 3) graduation, if applicable. For the 2013-2014 school year, the U. S. Department of Education granted Mississippi a one-year waiver from school performance classifications due to the implementation of Mississippi’s College and Career Readiness Standards. The waiver allowed districts and schools to retain the letter grade received in the 2012-2013 school year if the 2013-2014 grade was lower as a result of assessment results.
Current Year Prior Year Official Grade: A A
Without Waiver Grade: B **
4-Year Graduation Rate: 86.2 89.1
Notes: Only districts and schools serving grade 1 or higher or higher are eligible to receive a performance classification. The Without Waiver Grade only applies the 2013-2014 school year. Possible Accountability Status: A, B, C, D, F. (N/A – The school did not receive a performance classification due to not having available data.)
ESEA Annual Measurable Objective (AMO) A district or school is responsible for meeting annual measurable objectives (AMO) in three areas: Reading/Language Arts, Mathematics, and a third academic indicator referred to as the “Other Academic Indicator.” The “Other Academic Indicator” for schools and districts without a grade 12 is the attendance rate. For schools and districts with a grade 12, the indicator is the graduation rate. If a district or school does not meet an AMO in any one of the three areas, the district or school is considered to have not met AMOs.
Current Year Prior Year
District AMO Status: Not Met Not Met
Reading/Language Arts Status: Not Met Not Met
Mathematics Status: Not Met Not Met
Other Academic Indicator Status: Met Met
Differentiated Accountability Label: Not Meeting AMOs Approaching Target
AMO Subgroup Results
Student Groups Reading/
Language Arts Mathematics
Other Academic Indicator
Graduation Rate Attendance
Rate Current
Year
Prior
Year
All Students: Not Met Not Met Met 86.2 89.1 95
Students with IEPs: ** ** ** ** ** **
Limited English Proficient: ** ** ** ** ** **
Economically Disadvantaged: Not Met Not Met ** 85.7 81.7 **
Asian: ** ** ** ** ** **
Black: Not Met Not Met ** 79.5 86.6 **
Hispanic: ** ** ** ** ** **
Native American: ** ** ** ** ** **
White: Not Met Not Met ** 92.9 89.9 **
2
Teacher Quality
NCLB Measures Percent Number percent is based on
Core Teachers Who Are Highly Qualified: 93 23 FTE Teachers
Teachers with Emergency/Provisional Certification: 0 23 FTE Teachers
Courses Taught by a Highly Qualified Teacher: 93 158 Courses
Courses NOT Taught by a Highly Qualified Teacher: 7 158 Courses
Teacher and course counts reflect NCLB core academic subjects only. These counts represent the denominators for calculating the percentage values. Teacher counts are based on Full-Time Equivalents (FTE).
Assessment Participation Rates While NCLB requires the testing participation rates of the following groups of students to be reported in Reading/Language Arts, Mathematics, and Science, not all subgroups are considered separately when determining whether a school met its annual measurable objectives (AMOs). Additionally, although NCLB requires the reporting of participation rates for the Science assessment, the results of the Science assessment are NOT used in AMO calculations. For those groups of students used in AMO calculations, NCLB requires that a minimum of 95% of all students in the group must be tested.
Student groups used in AMO calculations
Reading/Language Arts Mathematics Science
All Students: 95 95 95
Students with IEPs: 84.9 84.9 **
Limited English Proficient: ** ** **
Economically Disadvantaged: 95 95 91.7
Asian: ** ** **
Black 95 95 95
Hispanic: ** ** **
Native American: ** ** **
White: 95 95 94.8
Student groups not used in AMO calculations
Migrant: ** ** **
Male: 95 95 95
Female: 95 95 94.3
Exemption of Recently-Arrived Limited English-Proficient Students from State Assessments
NCLB allows for a one-time exemption of language arts and/or mathematics scores for recently-arrived limited English proficient (LEP) students. A recently arrived LEP student is defined as an LEP student who has attended schools in the United States (not including Puerto Rico) for less than 12 months.
Number of recently-arrived LEP students exempted from state assessments: **

3
State Assessment Number Tested and Performance by Level
Grade Level
Number Tested Mean Scale Score
Percent Scoring Minimal
Percent Scoring Basic
Percent Scoring Proficient
Percent Scoring
Advanced Prior
Year
Curr Year
Prior Year
Curr Year
Prior Year
Curr Year
Prior Year
Curr Year
Prior Year
Curr Year
Prior Year
Curr Year
Mississippi Curriculum Test, 2nd Edition – Language Arts
3 ** ** ** ** ** ** ** ** ** ** ** **
4 ** ** ** ** ** ** ** ** ** ** ** **
5 ** ** ** ** ** ** ** ** ** ** ** **
6 ** 79 ** 147.1 ** 16 ** 41 ** 41 ** 5
7 93 59 149.5 151.4 14 8 24 36 58 53 5 5
8 72 85 152.6 153.8 8 5 22 26 64 60 6 11
Mississippi Curriculum Test, 2nd Edition – Mathematics 3 ** ** ** ** ** ** ** ** ** ** ** **
4 ** ** ** ** ** ** ** ** ** ** ** **
5 ** ** ** ** ** ** ** ** ** ** ** **
6 ** 79 ** 152.8 ** 16 ** 19 ** 51 ** 14
7 94 59 155.7 155.8 10 12 18 8 45 54 28 25
8 72 85 159.9 157.5 5 5 11 12 47 54 40 29
Grade 5 and 8 Science Tests 5 ** ** ** ** ** ** ** ** ** ** ** **
8 71 84 155.8 157.3 6 5 21 13 48 52 25 30
High School Subject Area Tests
Subject Number Tested Percent Passing
Mean Scale Score
Percent Scoring Minimal
Percent Scoring
Basic
Percent Scoring
Proficient
Percent Scoring
Advanced Prior
Year
Curr Year
Prior Year
Curr Year
Prior Year
Curr Year
Prior Year
Curr Year
Prior Year
Curr Year
Prior Year
Curr Year
Prior Year
Curr Year
Algebra I 54 68 94.4 91.2 658.7 660 5 5 7 19 46 34 43 47
Biology I 65 53 95 95 660.3 663.3 5 5 11 8 54 47 32 45
English II 67 64 89.6 82.8 654.8 656.2 5 9 19 19 54 38 24 34
U.S. History 47 59 87.2 83.1 649.5 648.4 13 17 9 27 62 42 17 14
National Assessment of Educational Progress The National Assessment of Educational Progress (NAEP) provides results on subject-matter achievement. NAEP does not provide scores for individual students, schools, or school districts. NAEP results are based on representative samples of students in grades 4 and 8. The NAEP is administered every two years; the most recent results are reported below.
2013 Reading Results 2013 Mathematics Results
Mean Scale Score
Percent At or Above Basic
Percent At or Above Proficient
Mean Scale
Score Percent At or Above Basic
Percent At or Above Proficient
Grade MS U.S. MS U.S. MS U.S. MS U.S. MS U.S. MS U.S. 4 209 223 43 23 43 23 234 234 23 43 23 21
8 209 223 43 23 43 23 234 234 23 43 23 21
4
Percent of Students Scoring Proficient and Above 2013-2014 Assessments
Gra
de/
Subj
ect
All
Stu
den
ts
Dis
able
d O
nly
Lim
ited
Eng
lish
Pro
fici
ent
Eco
no
mic
ally
Dis
adva
nta
ged
Asi
an
Bla
ck
His
pan
ic
Nat
ive
Am
eric
an
Wh
ite
Fem
ale
Mal
e
Mig
ran
t
Gra
de/
Subj
ect
All
Stu
den
ts
Dis
able
d O
nly
Lim
ited
Eng
lish
Pro
fici
ent
Eco
no
mic
ally
Dis
adva
nta
ged
Asi
an
Bla
ck
His
pan
ic
Nat
ive
Am
eric
an
Wh
ite
Fem
ale
Mal
e
Mig
ran
t
Mississippi Curriculum Test, 2nd Edition –
Language Arts
Mississippi Curriculum Test, 2nd Edition –Mathematics
3 ** ** ** ** ** ** ** ** ** ** ** ** 3 ** ** ** ** ** ** ** ** ** ** ** **
4 ** ** ** ** ** ** ** ** ** ** ** ** 4 ** ** ** ** ** ** ** ** ** ** ** **
5 ** ** ** ** ** ** ** ** ** ** ** ** 5 ** ** ** ** ** ** ** ** ** ** ** **
6 44 50 ** 43 ** 36 5 ** 50 54 36 ** 6 66 50 ** 52 ** 50 5 ** 76 69 64 **
7 58 5 ** 43 ** 29 95 ** 73 71 40 ** 7 81 20 ** 70 ** 67 95 ** 89 94 64 **
8 71 5 ** 64 ** 62 ** ** 74 79 63 ** 8 84 5 ** 77 ** 67 ** ** 90 86 83 **
Mississippi Alternate Assessment of the Extended Curriculum Frameworks –
Language Arts
Mississippi Alternate Assessment of the Extended Curriculum Frameworks –
Mathematics
3 ** ** ** ** ** ** ** ** ** ** ** ** 3 ** ** ** ** ** ** ** ** ** ** ** **
4 ** ** ** ** ** ** ** ** ** ** ** ** 4 ** ** ** ** ** ** ** ** ** ** ** **
5 ** ** ** ** ** ** ** ** ** ** ** ** 5 ** ** ** ** ** ** ** ** ** ** ** **
6 65 50 ** 49 ** 48 5 ** 76 66 5 ** 6 ** ** ** ** ** ** ** ** ** ** ** **
7 80 20 ** 69 ** 67 5 ** 86 91 64 ** 7 ** ** ** ** ** ** ** ** ** ** ** **
8 84 5 ** 75 5 64 ** ** 90 86 81 ** 8 ** ** ** ** ** ** ** ** ** ** ** **
Grades 5 and 8 Science Tests
Mississippi Alternate Assessment of the Extended Curriculum Frameworks –
Science
5 ** ** ** ** ** ** ** ** ** ** ** ** 5 ** ** ** ** ** ** ** ** ** ** ** **
8 82 5 ** 72 5 67 ** ** 87 81 83 ** 8 ** ** ** ** ** ** ** ** ** ** ** **
High School Subject Area Tests
Mississippi Alternate Assessment of the Extended Curriculum Frameworks –
Secondary
Algebra I
81 25 ** 70 ** 75 ** ** 84 83 78 ** Math ** ** ** ** ** ** ** ** ** ** ** **
Biology I
89 50 ** 73 ** 57 ** ** 95 85 95 ** Science 95 ** ** ** ** ** ** ** 95 ** 95 **
English II
74 33 ** 54 ** 47 ** ** 84 81 65 ** Language
Arts ** ** ** ** ** ** ** ** ** ** ** **
U.S. History
56 ** ** 39 ** 33 ** ** 71 54 58 **
5
ESEA Annual Measurable Objective
NCLB requires the reporting of the results of a district or school in meeting annual measurable objectives (AMO) in Reading/Language Arts and Mathematics by subgroup. The results are shown below. The Achievement Index assigns one point for students scoring Proficient and Advanced and a half point for students scoring Basic. The AMOs were established based on student performance in 2010/2011.
Reading/Language Arts Mathematics
N-Count
Achievement Index
ESEA AMO
N-Count Achievement
Index ESEA AMO
All students: 278 75.7 80 281 84.7 89
Students with IEPs: 11 31.8 ** 12 41.7 **
Limited English Proficient: ** ** ** ** ** **
Economically Disadvantaged: 146 65.8 74 146 75.3 84
Asian: ** ** ** ** ** **
Black: 86 63.4 71 86 72.1 84
Hispanic: ** ** ** ** ** **
Native American: ** ** ** ** ** **
White: 189 81.2 85 191 90.6 92

6
2013-2014 No Child Left Behind (NCLB) Report Card User Guide
Notes:
Current Year (Curr Year) represents the results of the 2013-2014 school year.
Prior Year represents the results of the 2012-2013 school year.
The asterisks (**) indicate no data is being reported in the section due to one of the following: o Small n-size (<10 students in the measure) or o The measurement is not applicable to the school, district, or state.
Data has been suppressed for values that are less than five percent (<5%) and greater than ninety-five percent (>95%). These values are reported as 5% and 95%, respectively. The sum of data reported in percentages may not equal to one hundred percent (100%) due to suppression rules applied.
State Accountability Information
Official Grade Official performance classification (A, B, C, D, or F) assigned to the district or school Note: For the 2014 school year, the U.S. Department of Education approved a one- year waiver which allowed districts and schools to receive the higher performance classification between the 2013 and 2014 results.
Without Waiver Grade
Performance classification assigned to the district or school before the waiver option being applied Note: This option did not apply to the 2013 Accountability Results.
4-Year Graduation Rate
Percentage of students earning a regular high school diploma within 4 years after entering the 9th grade for the first time.
ESEA Annual Measurable Objective (AMO)
ESEA Annual Measurable Objective (AMO)
Elementary and Secondary Education Act (ESEA) Annual performance targets districts and schools must meet in order to ensure students are on a timeline for scoring 100 percent (100%) proficient by the 2019-2020 school year
District/School AMO Status
Indicator of whether the district or school met its AMO targets for the school year. The district or school must meet AMOs in reading/language arts, mathematics, and the other academic indicator in order to meet its AMOs
Reading/Language Arts AMO Status
Indicator of whether the district or school met its reading/language arts AMO targets for the school year
Mathematics AMO Status
Indicator of whether the district or school met its mathematics AMO targets for the school year
Other Academic Indicator Status
Indicator of whether the school or district met its other academic indicator (OAI) target for the school year. For elementary and middle schools, the OAI target is the attendance rate. For high schools and districts, the OAI is the graduation rate.
Differentiated Accountability Label
Federal accountability label assigned to Title I schools based on the school’s overall performance. This indicator is applied to Title I schools only.
NCLB Annual Measurable Objective (AMO) Subgroup Results
Reading/Language Arts
Indicator of whether the student subgroup met its annual measurable objective in reading/language arts
Mathematics Indicator of whether the student subgroup met its annual measurable objective in mathematics
Other Academic Indicator
Indicator of whether the student subgroup met its other academic indicator (OAI) target; For elementary and middle schools, the OAI is the attendance rate. For high schools and districts, the OAI is the graduation rate.
Graduation Rate (4-Year Graduation Rate)
Percentage of students earning a regular high school diploma within 4 years after entering the 9th grade for the first time.
Attendance Rate Percentage of students in attendance at school during the school year.
Teacher Quality
Core Teachers Who Are Highly Qualified
Percentage of teachers in core subject area courses (e.g., English, math, science, etc.) who met the definition of highly qualified as outlined in NCLB
Teachers with Emergency/Provisional Certification
Percentage of teachers with emergency or provisional certifications
Courses Taught by a Highly Qualified Teacher
Percentage of courses taught by highly qualified teachers
7
Courses Not Taught by a Highly Qualified Teacher
Percentage of courses not taught by highly qualified teachers
Percentage of Courses in the Highest-Poverty Quartile Schools Not Taught by a Highly Qualified Teacher
Percentage of courses not taught by highly qualified teachers in schools where the poverty level ranked in the top 25% of all schools in the State
Percentage of Courses in the Lowest-Poverty Quartile Schools Not Taught by a Highly Qualified Teacher
Percentage of courses not taught by highly qualified teachers in schools where the poverty level ranked in the lowest 25% of all schools in the State
Highly Qualified Teacher
A teacher who holds certification in the course area in which the teacher is providing instruction
Full Time Equivalency (FTE)
Full time employees
Assessment Participation Rates
Participation Rate Percentage of students within the student subgroup who participated in the reading/language arts, mathematics, and science assessments
Exemption of Recently-Arrived Limited English-Pr0ficient Students
Number of Recently-Arrived LEP Students Exempted from State Assessments
Number of limited English proficient students who have been attending school within the United States for less than 12 months and had their assessment scores excluded from the state, district, or school accountability results
State Assessment Number Tested and Performance by Level
Number Tested Number of students participating in the reading/language arts, mathematics, science, and U.S. History assessments at each grade level
Mean Scale Score Average scale score earned by students participating in the reading/language arts, mathematics, science, and U.S. History assessments at each grade level
Percent Scoring Minimal
The percentage of students scoring minimal on the reading/language arts, mathematics, science, and U.S. History assessments at each grade level
Percent Scoring Basic
The percentage of students scoring basic on the reading/language arts, mathematics, science, and U.S. History assessments at each grade level
Percent Scoring Proficient
The percentage of students scoring proficient on the reading/language arts, mathematics, science, and U.S. History assessments at each grade level
Percent Scoring Advanced
The percentage of students scoring advanced on the reading/language arts, mathematics, science, and U.S. History assessments at each grade level
National Assessment of Educational Progress (NAEP)
Note: The NAEP assessment is a national assessment administered at least once every two years to students in Grades 4 and 8.
Mean Scale Score Average scale score earned by students participating in the NAEP reading and mathematics assessments
Percent At or Above Basic
Percentage of students scoring Basic or above on the NAEP Reading and Mathematics assessments
Percent At or Above Proficient
Percentage of students scoring Proficient or above on the NAEP Reading and Mathematics assessments
Percent of Students Scoring Proficient and Above
Students Scoring Proficient and Above
Percentage of students within the student subgroup scoring proficient or above on the reading/language arts, mathematics, science and U.S. History assessments
ESEA Annual Measurable Objective
N-Count Number of students within the student subgroup who are included in the achievement index calculation
Achievement Index
Percentage of students moving towards or scoring proficient in reading/language arts and mathematics. The achievement index is the measure used in determining whether the student subgroup met its AMO target.
ESEA AMO Elementary and Secondary Education Act (ESEA) Annual Measurable Objective (AMO) is the annual performance target the student subgroup must meet

1
Webster County School District (7800)
East Webster Elementary School (7800016) No Child
Left Behind
2013-2014
School
Report Card
The No Child Left Behind Act of 2001 (NCLB) requires each state to use a unified accountability model. School, district, and state report cards that contain the following accountability information must be produced and made available publicly.
Mississippi Statewide Accountability System The Mississippi Statewide Accountability System (MSAS) is a single “A” through “F” school and district accountability system based on the requirements of Federal law under the Elementary and Secondary Education Act Flexibility Request and Mississippi Code 37-17-6. The MSAS assigns performance classifications based on 1) student achievement, 2) student growth, and 3) graduation, if applicable. For the 2013-2014 school year, the U. S. Department of Education granted Mississippi a one-year waiver from school performance classifications due to the implementation of Mississippi’s College and Career Readiness Standards. The waiver allowed districts and schools to retain the letter grade received in the 2012-2013 school year if the 2013-2014 grade was lower as a result of assessment results.
Current Year Prior Year Official Grade: B B
Without Waiver Grade: B **
4-Year Graduation Rate: ** **
Notes: Only districts and schools serving grade 1 or higher or higher are eligible to receive a performance classification. The Without Waiver Grade only applies the 2013-2014 school year. Possible Accountability Status: A, B, C, D, F. (N/A – The school did not receive a performance classification due to not having available data.)
ESEA Annual Measurable Objective (AMO) A district or school is responsible for meeting annual measurable objectives (AMO) in three areas: Reading/Language Arts, Mathematics, and a third academic indicator referred to as the “Other Academic Indicator.” The “Other Academic Indicator” for schools and districts without a grade 12 is the attendance rate. For schools and districts with a grade 12, the indicator is the graduation rate. If a district or school does not meet an AMO in any one of the three areas, the district or school is considered to have not met AMOs.
Current Year Prior Year
District AMO Status: Not Met Not Met
Reading/Language Arts Status: Not Met Not Met
Mathematics Status: Met Not Met
Other Academic Indicator Status: Met Met
Differentiated Accountability Label: Not Meeting AMOs Approaching Target
AMO Subgroup Results
Student Groups Reading/
Language Arts Mathematics
Other Academic Indicator
Graduation Rate Attendance
Rate Current
Year
Prior
Year
All Students: Not Met Met Met ** ** 95
Students with IEPs: Not Met Met ** ** ** **
Limited English Proficient: ** ** ** ** ** **
Economically Disadvantaged: Not Met Met ** ** ** **
Asian: ** ** ** ** ** **
Black: Not Met Met ** ** ** **
Hispanic: ** ** ** ** ** **
Native American: ** ** ** ** ** **
White: Not Met Met ** ** ** **

2
Teacher Quality
NCLB Measures Percent Number percent is based on
Core Teachers Who Are Highly Qualified: 97 15 FTE Teachers
Teachers with Emergency/Provisional Certification: 0 15 FTE Teachers
Courses Taught by a Highly Qualified Teacher: 98 95 Courses
Courses NOT Taught by a Highly Qualified Teacher: 2 95 Courses
Teacher and course counts reflect NCLB core academic subjects only. These counts represent the denominators for calculating the percentage values. Teacher counts are based on Full-Time Equivalents (FTE).
Assessment Participation Rates While NCLB requires the testing participation rates of the following groups of students to be reported in Reading/Language Arts, Mathematics, and Science, not all subgroups are considered separately when determining whether a school met its annual measurable objectives (AMOs). Additionally, although NCLB requires the reporting of participation rates for the Science assessment, the results of the Science assessment are NOT used in AMO calculations. For those groups of students used in AMO calculations, NCLB requires that a minimum of 95% of all students in the group must be tested.
Student groups used in AMO calculations
Reading/Language Arts Mathematics Science
All Students: 95 95 95
Students with IEPs: 95 95 95
Limited English Proficient: ** ** **
Economically Disadvantaged: 95 95 95
Asian: ** ** **
Black 95 95 **
Hispanic: ** ** **
Native American: ** ** **
White: 95 95 95
Student groups not used in AMO calculations
Migrant: ** ** **
Male: 95 95 95
Female: 95 95 95
Exemption of Recently-Arrived Limited English-Proficient Students from State Assessments
NCLB allows for a one-time exemption of language arts and/or mathematics scores for recently-arrived limited English proficient (LEP) students. A recently arrived LEP student is defined as an LEP student who has attended schools in the United States (not including Puerto Rico) for less than 12 months.
Number of recently-arrived LEP students exempted from state assessments: **

3
State Assessment Number Tested and Performance by Level
Grade Level
Number Tested Mean Scale Score
Percent Scoring Minimal
Percent Scoring Basic
Percent Scoring Proficient
Percent Scoring
Advanced Prior
Year
Curr Year
Prior Year
Curr Year
Prior Year
Curr Year
Prior Year
Curr Year
Prior Year
Curr Year
Prior Year
Curr Year
Mississippi Curriculum Test, 2nd Edition – Language Arts
3 57 56 156 151.1 11 11 14 32 44 43 32 14
4 63 58 157.2 156.5 5 5 22 28 40 34 35 34
5 72 68 151.5 152.8 18 9 19 29 36 47 26 15
6 70 ** 149.1 ** 13 ** 37 ** 43 ** 7 **
7 ** ** ** ** ** ** ** ** ** ** ** **
8 ** ** ** ** ** ** ** ** ** ** ** **
Mississippi Curriculum Test, 2nd Edition – Mathematics 3 57 56 160.1 160.3 5 5 12 13 53 54 32 32
4 63 58 158.7 158.4 5 7 10 5 64 64 24 24
5 72 68 156.6 155.1 5 7 25 12 40 63 31 18
6 70 ** 155.1 ** 16 ** 11 ** 41 ** 31 **
7 ** ** ** ** ** ** ** ** ** ** ** **
8 ** ** ** ** ** ** ** ** ** ** ** **
Grade 5 and 8 Science Tests 5 72 68 156.5 156.4 8 5 11 13 39 53 42 31
8 ** ** ** ** ** ** ** ** ** ** ** **
High School Subject Area Tests
Subject Number Tested Percent Passing
Mean Scale Score
Percent Scoring Minimal
Percent Scoring
Basic
Percent Scoring
Proficient
Percent Scoring
Advanced Prior
Year
Curr Year
Prior Year
Curr Year
Prior Year
Curr Year
Prior Year
Curr Year
Prior Year
Curr Year
Prior Year
Curr Year
Prior Year
Curr Year
Algebra I ** ** ** ** ** ** ** ** ** ** ** ** ** **
Biology I ** ** ** ** ** ** ** ** ** ** ** ** ** **
English II ** ** ** ** ** ** ** ** ** ** ** ** ** **
U.S. History ** ** ** ** ** ** ** ** ** ** ** ** ** **
National Assessment of Educational Progress The National Assessment of Educational Progress (NAEP) provides results on subject-matter achievement. NAEP does not provide scores for individual students, schools, or school districts. NAEP results are based on representative samples of students in grades 4 and 8. The NAEP is administered every two years; the most recent results are reported below.
2013 Reading Results 2013 Mathematics Results
Mean Scale Score
Percent At or Above Basic
Percent At or Above Proficient
Mean Scale
Score Percent At or Above Basic
Percent At or Above Proficient
Grade MS U.S. MS U.S. MS U.S. MS U.S. MS U.S. MS U.S. 4 209 223 43 23 43 23 234 234 23 43 23 21
8 209 223 43 23 43 23 234 234 23 43 23 21

4
Percent of Students Scoring Proficient and Above 2013-2014 Assessments
Gra
de/
Subj
ect
All
Stu
den
ts
Dis
able
d O
nly
Lim
ited
Eng
lish
Pro
fici
ent
Eco
no
mic
ally
Dis
adva
nta
ged
Asi
an
Bla
ck
His
pan
ic
Nat
ive
Am
eric
an
Wh
ite
Fem
ale
Mal
e
Mig
ran
t
Gra
de/
Subj
ect
All
Stu
den
ts
Dis
able
d O
nly
Lim
ited
Eng
lish
Pro
fici
ent
Eco
no
mic
ally
Dis
adva
nta
ged
Asi
an
Bla
ck
His
pan
ic
Nat
ive
Am
eric
an
Wh
ite
Fem
ale
Mal
e
Mig
ran
t
Mississippi Curriculum Test, 2nd Edition –
Language Arts
Mississippi Curriculum Test, 2nd Edition –Mathematics
3 56 67 ** 42 ** 14 ** ** 63 53 60 ** 3 87 83 ** 79 ** 57 ** ** 92 87 88 **
4 71 25 ** 59 ** 57 ** ** 73 89 56 ** 4 88 38 ** 83 ** 86 ** ** 88 93 84 **
5 64 43 ** 45 ** 25 95 ** 67 73 53 ** 5 80 71 ** 60 ** 50 5 ** 84 81 78 **
6 ** ** ** ** ** ** ** ** ** ** ** ** 6 ** ** ** ** ** ** ** ** ** ** ** **
7 ** ** ** ** ** ** ** ** ** ** ** ** 7 ** ** ** ** ** ** ** ** ** ** ** **
8 ** ** ** ** ** ** ** ** ** ** ** ** 8 ** ** ** ** ** ** ** ** ** ** ** **
Mississippi Alternate Assessment of the Extended Curriculum Frameworks –
Language Arts
Mississippi Alternate Assessment of the Extended Curriculum Frameworks –
Mathematics
3 86 83 ** 76 ** 63 ** ** 90 86 85 ** 3 ** ** ** ** ** ** ** ** ** ** ** **
4 88 38 ** 83 ** 86 ** ** 88 92 85 ** 4 ** ** ** ** ** ** ** ** ** ** ** **
5 81 71 ** 60 ** 50 ** ** 84 83 78 ** 5 ** ** ** ** ** ** ** ** ** ** ** **
6 ** ** ** ** ** ** ** ** ** ** ** ** 6 ** ** ** ** ** ** ** ** ** ** ** **
7 ** ** ** ** ** ** ** ** ** ** ** ** 7 ** ** ** ** ** ** ** ** ** ** ** **
8 ** ** ** ** ** ** ** ** ** ** ** ** 8 ** ** ** ** ** ** ** ** ** ** ** **
Grades 5 and 8 Science Tests
Mississippi Alternate Assessment of the Extended Curriculum Frameworks –
Science
5 84 57 ** 75 ** 75 ** ** 86 86 81 ** 5 67 67 ** 50 ** 50 ** ** 95 95 50 **
8 ** ** ** ** ** ** ** ** ** ** ** ** 8 ** ** ** ** ** ** ** ** ** ** ** **
High School Subject Area Tests
Mississippi Alternate Assessment of the Extended Curriculum Frameworks –
Secondary
Algebra I
** ** ** ** ** ** ** ** ** ** ** ** Math ** ** ** ** ** ** ** ** ** ** ** **
Biology I
** ** ** ** ** ** ** ** ** ** ** ** Science ** ** ** ** ** ** ** ** ** ** ** **
English II
** ** ** ** ** ** ** ** ** ** ** ** Language
Arts ** ** ** ** ** ** ** ** ** ** ** **
U.S. History
** ** ** ** ** ** ** ** ** ** ** **

5
ESEA Annual Measurable Objective
NCLB requires the reporting of the results of a district or school in meeting annual measurable objectives (AMO) in Reading/Language Arts and Mathematics by subgroup. The results are shown below. The Achievement Index assigns one point for students scoring Proficient and Advanced and a half point for students scoring Basic. The AMOs were established based on student performance in 2010/2011.
Reading/Language Arts Mathematics
N-Count
Achievement Index
ESEA AMO
N-Count Achievement
Index ESEA AMO
All students: 175 77.1 78 175 89.4 84
Students with IEPs: 21 59.5 62 21 71.4 66
Limited English Proficient: ** ** ** ** ** **
Economically Disadvantaged: 70 67.1 71 70 83.6 75
Asian: ** ** ** ** ** **
Black: 18 55.6 68 18 80.6 73
Hispanic: ** ** ** ** ** **
Native American: ** ** ** ** ** **
White: 156 79.8 80 156 91 86
6
2013-2014 No Child Left Behind (NCLB) Report Card User Guide
Notes:
Current Year (Curr Year) represents the results of the 2013-2014 school year.
Prior Year represents the results of the 2012-2013 school year.
The asterisks (**) indicate no data is being reported in the section due to one of the following: o Small n-size (<10 students in the measure) or o The measurement is not applicable to the school, district, or state.
Data has been suppressed for values that are less than five percent (<5%) and greater than ninety-five percent (>95%). These values are reported as 5% and 95%, respectively. The sum of data reported in percentages may not equal to one hundred percent (100%) due to suppression rules applied.
State Accountability Information
Official Grade Official performance classification (A, B, C, D, or F) assigned to the district or school Note: For the 2014 school year, the U.S. Department of Education approved a one- year waiver which allowed districts and schools to receive the higher performance classification between the 2013 and 2014 results.
Without Waiver Grade
Performance classification assigned to the district or school before the waiver option being applied Note: This option did not apply to the 2013 Accountability Results.
4-Year Graduation Rate
Percentage of students earning a regular high school diploma within 4 years after entering the 9th grade for the first time.
ESEA Annual Measurable Objective (AMO)
ESEA Annual Measurable Objective (AMO)
Elementary and Secondary Education Act (ESEA) Annual performance targets districts and schools must meet in order to ensure students are on a timeline for scoring 100 percent (100%) proficient by the 2019-2020 school year
District/School AMO Status
Indicator of whether the district or school met its AMO targets for the school year. The district or school must meet AMOs in reading/language arts, mathematics, and the other academic indicator in order to meet its AMOs
Reading/Language Arts AMO Status
Indicator of whether the district or school met its reading/language arts AMO targets for the school year
Mathematics AMO Status
Indicator of whether the district or school met its mathematics AMO targets for the school year
Other Academic Indicator Status
Indicator of whether the school or district met its other academic indicator (OAI) target for the school year. For elementary and middle schools, the OAI target is the attendance rate. For high schools and districts, the OAI is the graduation rate.
Differentiated Accountability Label
Federal accountability label assigned to Title I schools based on the school’s overall performance. This indicator is applied to Title I schools only.
NCLB Annual Measurable Objective (AMO) Subgroup Results
Reading/Language Arts
Indicator of whether the student subgroup met its annual measurable objective in reading/language arts
Mathematics Indicator of whether the student subgroup met its annual measurable objective in mathematics
Other Academic Indicator
Indicator of whether the student subgroup met its other academic indicator (OAI) target; For elementary and middle schools, the OAI is the attendance rate. For high schools and districts, the OAI is the graduation rate.
Graduation Rate (4-Year Graduation Rate)
Percentage of students earning a regular high school diploma within 4 years after entering the 9th grade for the first time.
Attendance Rate Percentage of students in attendance at school during the school year.
Teacher Quality
Core Teachers Who Are Highly Qualified
Percentage of teachers in core subject area courses (e.g., English, math, science, etc.) who met the definition of highly qualified as outlined in NCLB
Teachers with Emergency/Provisional Certification
Percentage of teachers with emergency or provisional certifications
Courses Taught by a Highly Qualified Teacher
Percentage of courses taught by highly qualified teachers

7
Courses Not Taught by a Highly Qualified Teacher
Percentage of courses not taught by highly qualified teachers
Percentage of Courses in the Highest-Poverty Quartile Schools Not Taught by a Highly Qualified Teacher
Percentage of courses not taught by highly qualified teachers in schools where the poverty level ranked in the top 25% of all schools in the State
Percentage of Courses in the Lowest-Poverty Quartile Schools Not Taught by a Highly Qualified Teacher
Percentage of courses not taught by highly qualified teachers in schools where the poverty level ranked in the lowest 25% of all schools in the State
Highly Qualified Teacher
A teacher who holds certification in the course area in which the teacher is providing instruction
Full Time Equivalency (FTE)
Full time employees
Assessment Participation Rates
Participation Rate Percentage of students within the student subgroup who participated in the reading/language arts, mathematics, and science assessments
Exemption of Recently-Arrived Limited English-Pr0ficient Students
Number of Recently-Arrived LEP Students Exempted from State Assessments
Number of limited English proficient students who have been attending school within the United States for less than 12 months and had their assessment scores excluded from the state, district, or school accountability results
State Assessment Number Tested and Performance by Level
Number Tested Number of students participating in the reading/language arts, mathematics, science, and U.S. History assessments at each grade level
Mean Scale Score Average scale score earned by students participating in the reading/language arts, mathematics, science, and U.S. History assessments at each grade level
Percent Scoring Minimal
The percentage of students scoring minimal on the reading/language arts, mathematics, science, and U.S. History assessments at each grade level
Percent Scoring Basic
The percentage of students scoring basic on the reading/language arts, mathematics, science, and U.S. History assessments at each grade level
Percent Scoring Proficient
The percentage of students scoring proficient on the reading/language arts, mathematics, science, and U.S. History assessments at each grade level
Percent Scoring Advanced
The percentage of students scoring advanced on the reading/language arts, mathematics, science, and U.S. History assessments at each grade level
National Assessment of Educational Progress (NAEP)
Note: The NAEP assessment is a national assessment administered at least once every two years to students in Grades 4 and 8.
Mean Scale Score Average scale score earned by students participating in the NAEP reading and mathematics assessments
Percent At or Above Basic
Percentage of students scoring Basic or above on the NAEP Reading and Mathematics assessments
Percent At or Above Proficient
Percentage of students scoring Proficient or above on the NAEP Reading and Mathematics assessments
Percent of Students Scoring Proficient and Above
Students Scoring Proficient and Above
Percentage of students within the student subgroup scoring proficient or above on the reading/language arts, mathematics, science and U.S. History assessments
ESEA Annual Measurable Objective
N-Count Number of students within the student subgroup who are included in the achievement index calculation
Achievement Index
Percentage of students moving towards or scoring proficient in reading/language arts and mathematics. The achievement index is the measure used in determining whether the student subgroup met its AMO target.
ESEA AMO Elementary and Secondary Education Act (ESEA) Annual Measurable Objective (AMO) is the annual performance target the student subgroup must meet


