Missende Waarden: Preventie Patronen, Mechanismen · Missende Waarden: Preventie Patronen,...
31
Missende Waarden: Preventie Patronen, Mechanismen Edith de Leeuw Thema middag Nonresponse en Missing Data, Universiteit Groningen, 30 Maart 2006
Transcript of Missende Waarden: Preventie Patronen, Mechanismen · Missende Waarden: Preventie Patronen,...
Missende Waarden: PreventiePatronen, Mechanismen
Edith de Leeuw
Thema middag Nonresponse en Missing Data, Universiteit Groningen, 30 Maart 2006

Copyright De Leeuw 2Groningen Maart 2006
Item-Nonresponse Pattern
Var 1 … p
Cas
e 1
… n
! General pattern: various variables missing
! ? = missing
?
?
?
?
?
Copyright De Leeuw 3Groningen Maart 2006
Why a Problem?
! Gaps in data matrix! Loss of information! Bad image (quality criterion)
! Ignoring (deletion of missing cases(deletion of missing cases) has problems:– Analyses are performed on different (sub) data sets– Analyses can be inconsistent with each other– Difficult to present results consistently over analyses– Potential for bias – Strong assumption (MCARMCAR)
Copyright De Leeuw 4Groningen Maart 2006
Why a Problem continued
! Potential for biased biased results– Univariate analysis and (general) low item-
nonresponse: bias is generally small– Multivariate analysis, even with low item nonresponse
for each question, cumulates to a substantial proportion of records that are missing
! So: do something
! Simply ignoring (standard option in SPSS and other packages) not wisenot wise
Copyright De Leeuw 5Groningen Maart 2006
Important Distinctions! Missing Completely At Random (MCAR)
– Missing values random sample of all values! Missing At Random (MAR)
– Missing values random sample of all values within classes defined by covariates (conditional)
! Not Missing At Random (NMAR)– Missingness is related to unobserved (missing)
value
(Little & Rubin, 1987, p14)
Copyright De Leeuw 6Groningen Maart 2006
A Silly Example
Hoytink, 2004
Copyright De Leeuw 7Groningen Maart 2006
Illustration: Survey Research
! Interviewer overlooks a question by accident– Turns two pages in one
! Elderly person has difficulty remembering event
! Participant refuses to answer

Copyright De Leeuw 8Groningen Maart 2006
Sources Item-Nonresponse
! Researcher (by design)! Interviewer! Respondent! Questionnaire! Method of Data Collection
! Interaction between sources, e.g, respondent and questionnaire
Copyright De Leeuw 9Groningen Maart 2006
What Can Be Done
! Missing by Design– Special analyses (e.g., multi-level analysis)
! Partial Non-Response (e.g., break-of)– Prevent– Adjust:
! Delete cases and treat as unit-nonresponse (weighting)! Keep cases and impute missing answers
! Item Non-Response– Prevent– Adjust (impute!)

Copyright De Leeuw 10Groningen Maart 2006
What is Known
! Respondents: Age and Education
! Interviewer: Training and Supervision
! Topic: Sensitive Questions
! Questionnaire: Lay-out, Do-not-know category, Number of categories, graphical tools
! Mode: SAQ, CAI

Copyright De Leeuw 11Groningen Maart 2006
Mechanisms I: Interviewer
! Interviewer fails to:– Ask question– Record answer– Record answer correctly
! In post-interview editing this will often be coded as missing– Fails to probe (ask again)
! Causes of failure:– Mistakes (e.g., wrong routing)– Purpose, cheating (e.g., fast interview, not wanting
to go to much trouble)

Copyright De Leeuw 12Groningen Maart 2006
Prevention I: Interviewer
! Mistakes:– Train interviewers in correct procedures– Give instruction about the questionnaire– Avoid mistakes by:
! Ergonomic lay-out questionnaire or interviewer schedule (e.g., far less chance of skipping, routing errors, etc)
! Use of computer-assisted interviewing (e.g., no routing errors, range checks )
! Cheating:– Stricter supervision – CAI

Copyright De Leeuw 13Groningen Maart 2006
Mechanisms II: Respondent
! Respondent – Skips question by mistake – Refuses to answer– Not able to provide (correct) answer
! Causes:– Badly designed self-administered questionnaire
(mistake)– Sensitive question (refusal)– A problem in the total question-answer process (not
able to provide, e.g. memory in retrospective questions)
Copyright De Leeuw 14Groningen Maart 2006
Prevention II: Respondent
! Write good questions and test them:– Comprehension question & answer categories– Inclusion of all relevant answer categories
! Avoid mistakes (cf. Interviewer mistakes)– Provide help (good instructions, etc)– Ergonomic lay-out questionnaire – CSAQ
! Pretest!! Special formats
– Sensitive questions– Retrospective questions
Copyright De Leeuw 15Groningen Maart 2006
Mechanisms and Prevention III: The Questionnaire
! Good questionnaire helps to avoid mistakes of interviewer and/or respondent
! Question should be understood, categories should fit and be exhaustive (keep questions understandable)– Pretest this: Expert reviews, cognitive interviewing,etc
! Lay-out should be clear and guide from question to question
! Use graphical language consistently– SAQ, such as web/internet questionnaire
Copyright De Leeuw 16Groningen Maart 2006
Prevent and then Adjust:Why Adjust?
! Remember: respondent age and education consistently correlate with item-nonresponse: – NOT MCAR, So standard solution (pairwise/listwise) not
adequate– Use age & education in model
! Impute missing data to get a complete data -set– All analyses are on ONE data-set– Consistent with each other– Retain all data
Copyright De Leeuw 17Groningen Maart 2006
Two Phases In Adjustment
! Phase I: Diagnosis, Inspect Patterns of Missingness– Suggest processes– Suggest solutions
! Phase II: Cure, Adjust for Missing – Use what you know from phase 1– Use any available information you have
! Plan for nonresponse

Copyright De Leeuw 18Groningen Maart 2006
Patterns of Item Nonresponse
Var 1 … p
Cas
e 1
… n
! Various variables missing (Missing = ?)
? Unsystematic (MCAR)or
? MARor
? NMAR?
?
?
?
?
Copyright De Leeuw 19Groningen Maart 2006
Tools for Exploring Missingness
! Descriptive statistics! Graphical representations
– View data matrix on screen/Special plots
! Statistical tests– Usual tests for MCAR
! Software:– SPSS-MVA module – Dedicated Programs for Missing Data
! e.g. SOLAS, NORM
– Some DIY-tricks using SPSS or any other program
Copyright De Leeuw 20Groningen Maart 2006
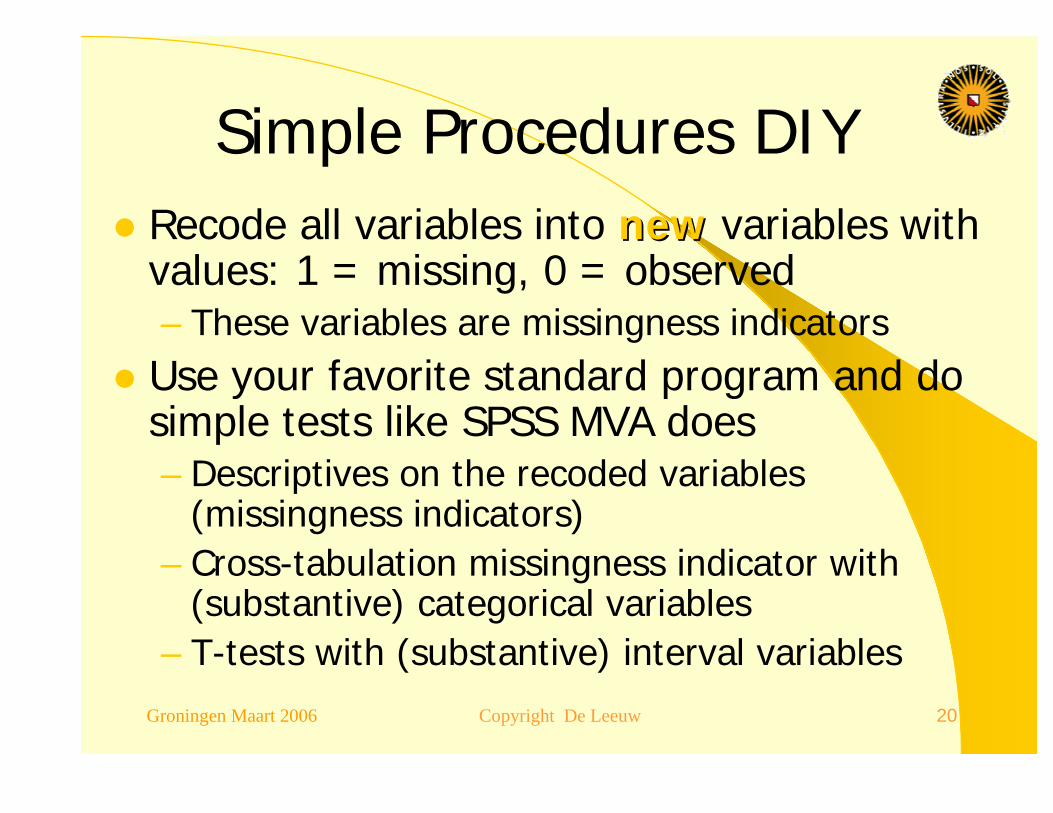
Simple Procedures DIY! Recode all variables into newnew variables with
values: 1 = missing, 0 = observed– These variables are missingness indicators
! Use your favorite standard program and do simple tests like SPSS MVA does– Descriptives on the recoded variables
(missingness indicators)– Cross-tabulation missingness indicator with
(substantive) categorical variables – T-tests with (substantive) interval variables

Copyright De Leeuw 21Groningen Maart 2006
DIY-MVA and MORE…! Use newnew variables (missingness indicators)! Use favorite standard program! Examples
– SPSS Explore – Graphs
! Boxplot with missingness indicator on category axis– Correlations between missingness indicators– PCA– Correlations substantive vars with indicators
! Pairwise deletion! Why?Why?– …….

Copyright De Leeuw 22Groningen Maart 2006
Example MSCOHORT.SAV! Data set from educational research
– Order of variables: idnr, father education (fatheduc), father occupation (fathocc), sex, iqlo, iqpm, iqws, education (educ), occupation (occup)
– Note 1: iglo,iqpm,iqws are three IQ-tests – Note 2: 2 variables measure ‘father of pupil’
rest of variables measure pupil!– Note 3: Missing data are indicated by missing
value 999
Copyright De Leeuw 23Groningen Maart 2006
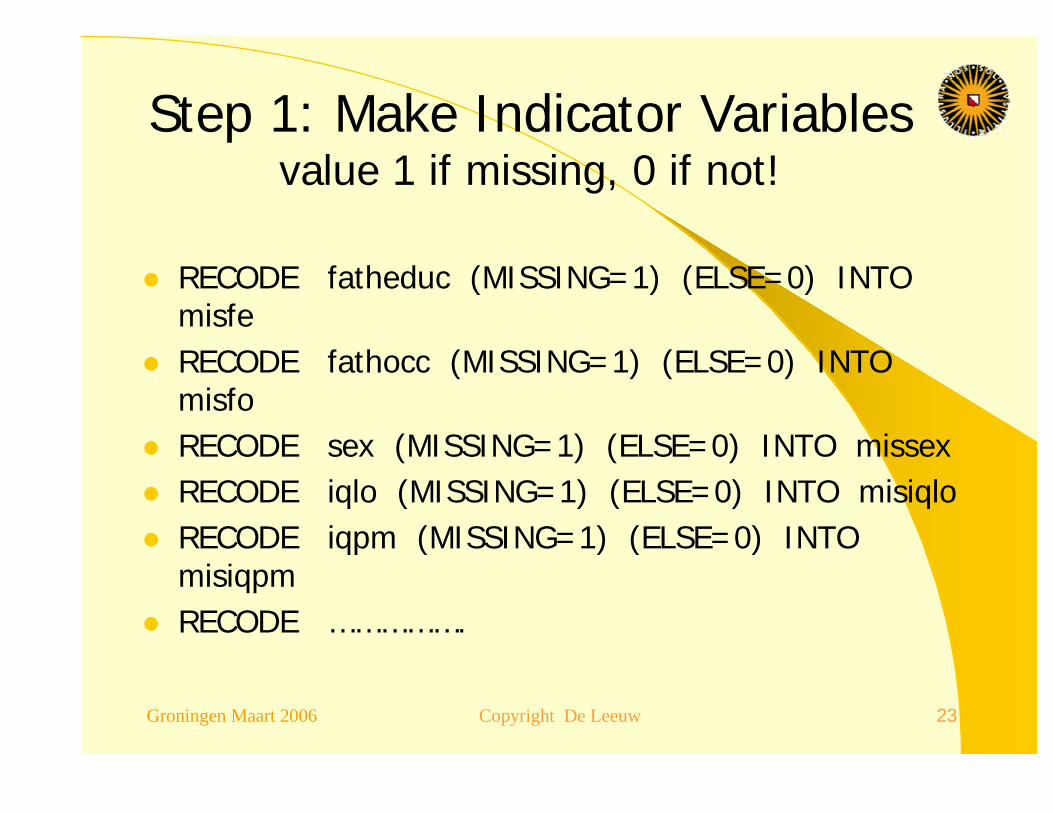
Step 1: Make Indicator Variablesvalue 1 if missing, 0 if not!
! RECODE fatheduc (MISSING=1) (ELSE=0) INTO misfe
! RECODE fathocc (MISSING=1) (ELSE=0) INTO misfo
! RECODE sex (MISSING=1) (ELSE=0) INTO missex! RECODE iqlo (MISSING=1) (ELSE=0) INTO misiqlo! RECODE iqpm (MISSING=1) (ELSE=0) INTO
misiqpm! RECODE …………….
Copyright De Leeuw 24Groningen Maart 2006
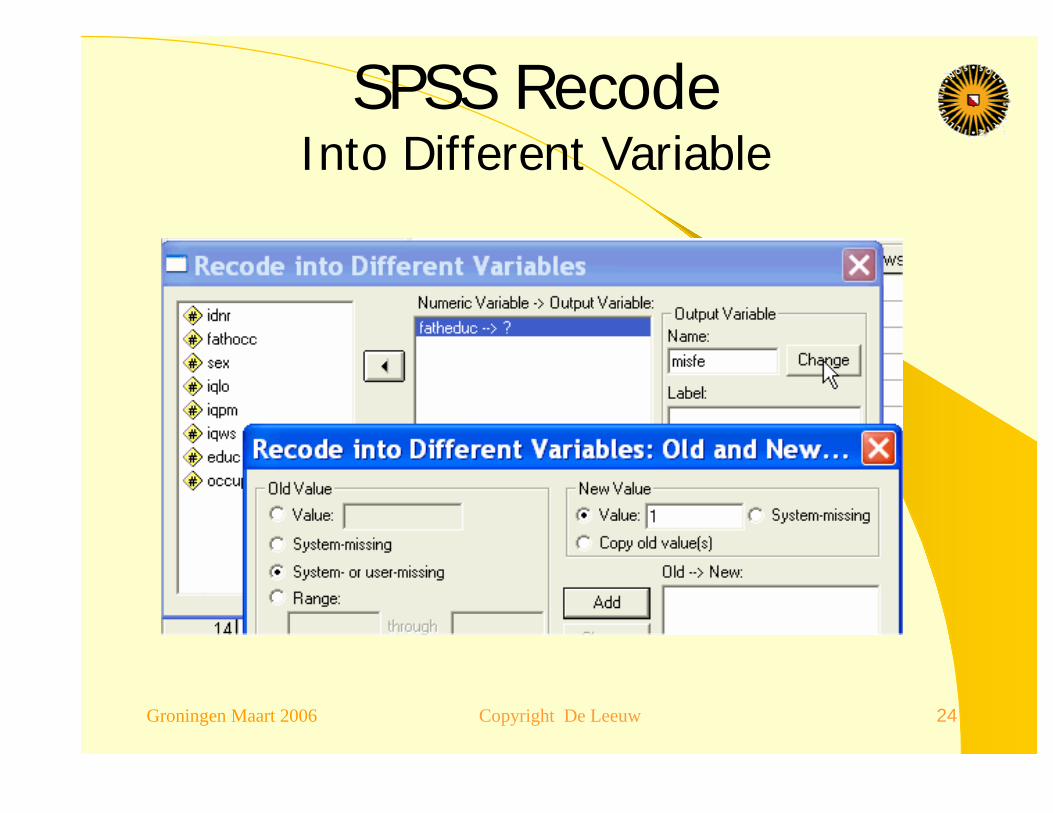
SPSS RecodeInto Different Variable
Copyright De Leeuw 25Groningen Maart 2006
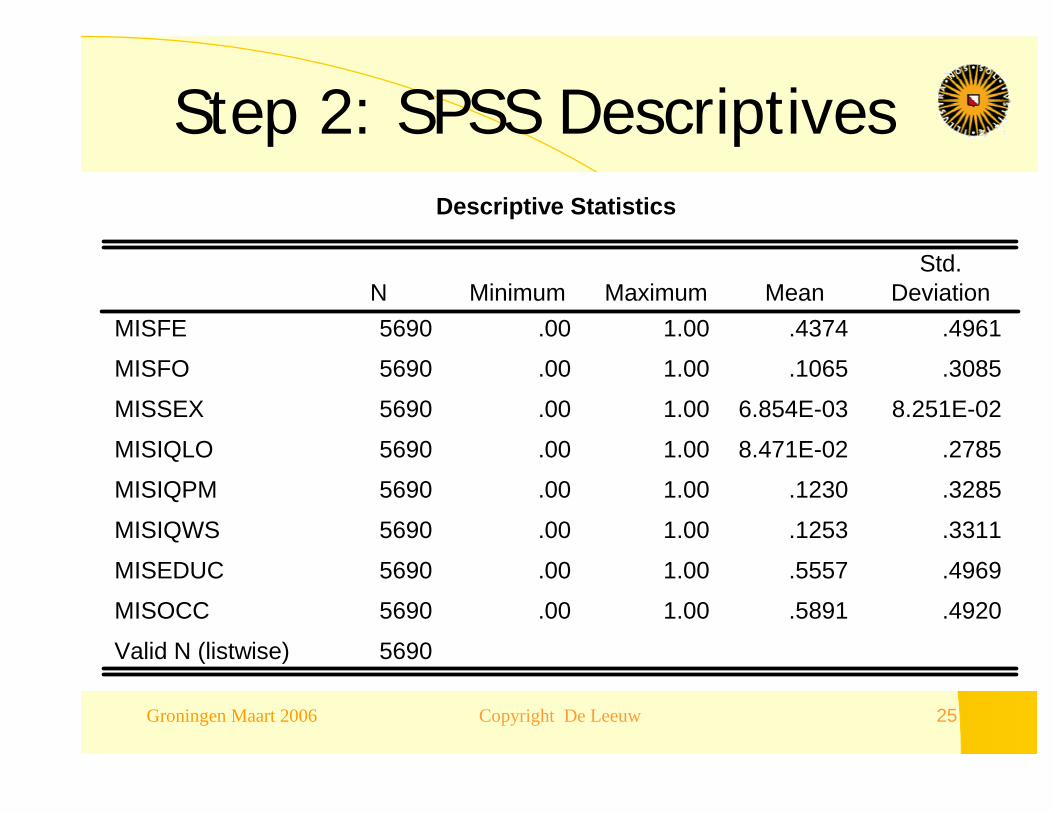
Step 2: SPSS DescriptivesDescriptive Statistics
5690 .00 1.00 .4374 .4961
5690 .00 1.00 .1065 .3085
5690 .00 1.00 6.854E-03 8.251E-02
5690 .00 1.00 8.471E-02 .2785
5690 .00 1.00 .1230 .3285
5690 .00 1.00 .1253 .3311
5690 .00 1.00 .5557 .4969
5690 .00 1.00 .5891 .4920
5690
MISFE
MISFO
MISSEX
MISIQLO
MISIQPM
MISIQWS
MISEDUC
MISOCC
Valid N (listwise)
N Minimum Maximum MeanStd.
Deviation
Copyright De Leeuw 26Groningen Maart 2006
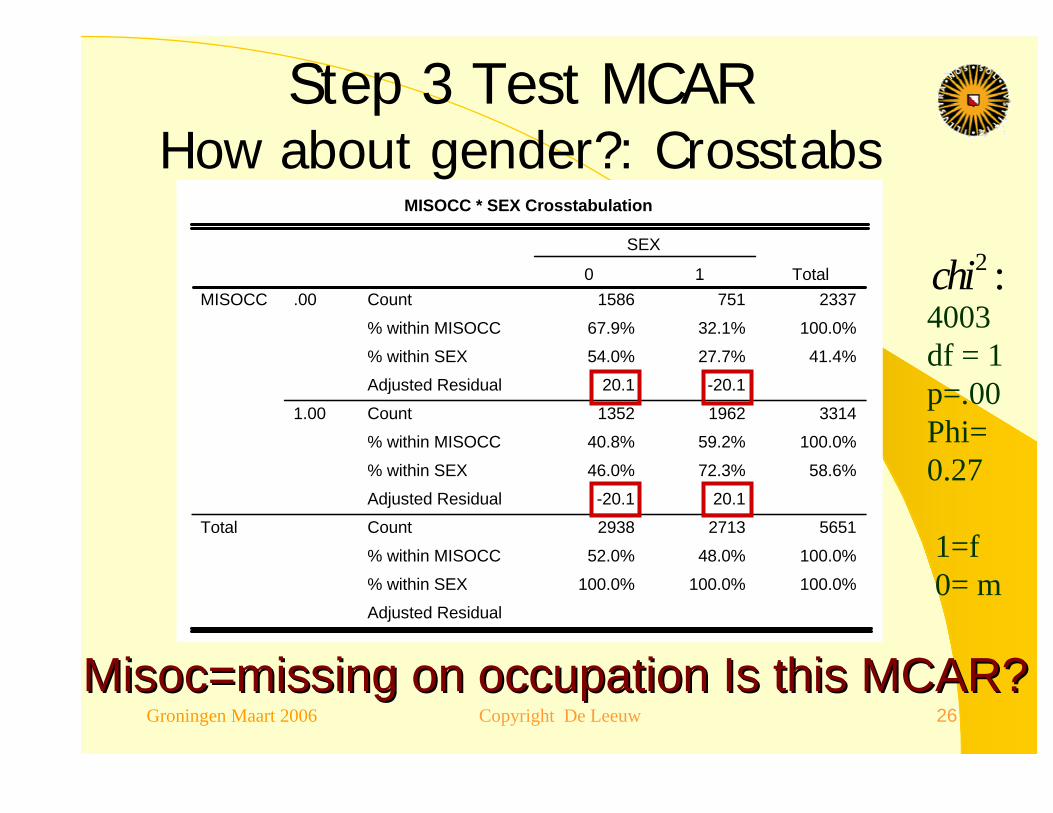
Step 3 Test MCARHow about gender?: Crosstabs
MisocMisoc=missing on occupation Is this MCAR?=missing on occupation Is this MCAR?
4003df = 1p=.00Phi= 0.27
1=f0= m
2 :chi
MISOCC * SEX Crosstabulation
1586 751 2337
67.9% 32.1% 100.0%
54.0% 27.7% 41.4%
20.1 -20.1
1352 1962 3314
40.8% 59.2% 100.0%
46.0% 72.3% 58.6%
-20.1 20.1
2938 2713 5651
52.0% 48.0% 100.0%
100.0% 100.0% 100.0%
Count
% within MISOCC
% within SEX
Adjusted Residual
Count
% within MISOCC
% within SEX
Adjusted Residual
Count
% within MISOCC
% within SEX
Adjusted Residual
.00
1.00
MISOCC
Total
0 1
SEX
Total
Copyright De Leeuw 27Groningen Maart 2006
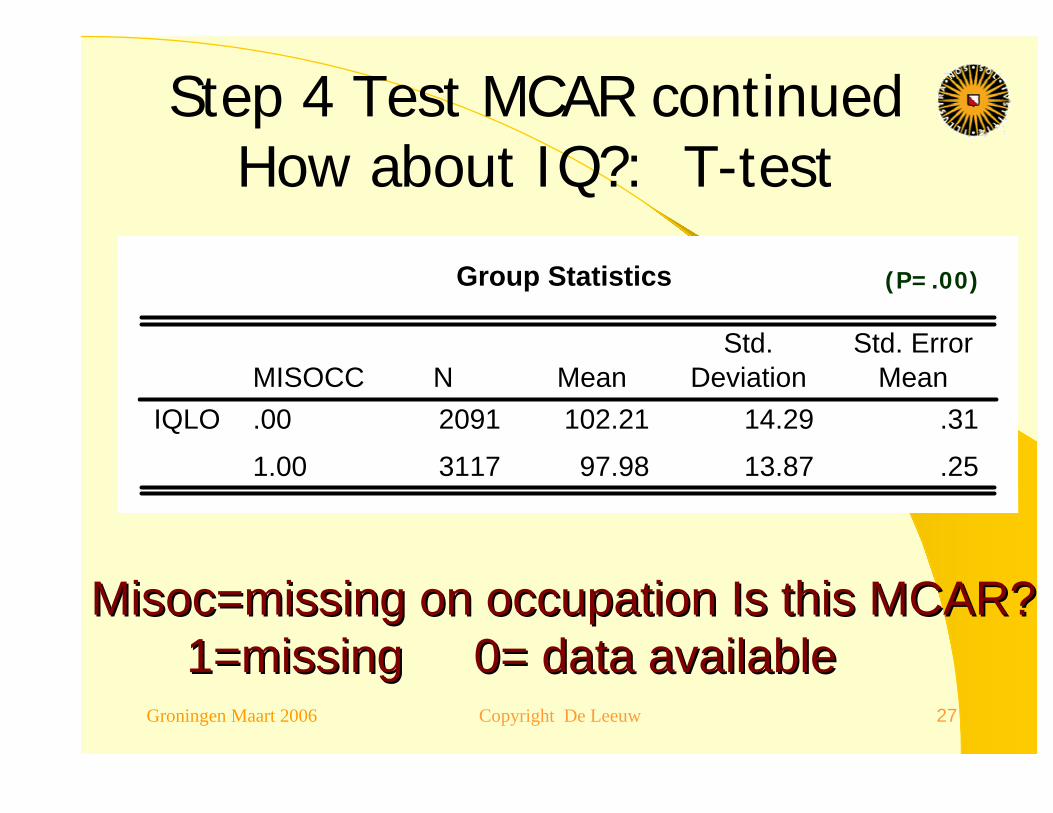
Step 4 Test MCAR continuedHow about IQ?: T-test
Group Statistics
2091 102.21 14.29 .31
3117 97.98 13.87 .25
MISOCC
.00
1.00
IQLO
N MeanStd.
DeviationStd. Error
Mean
MisocMisoc=missing on occupation Is this MCAR?=missing on occupation Is this MCAR?1=missing1=missing 0= data available0= data available
(P=.00)
Copyright De Leeuw 28Groningen Maart 2006
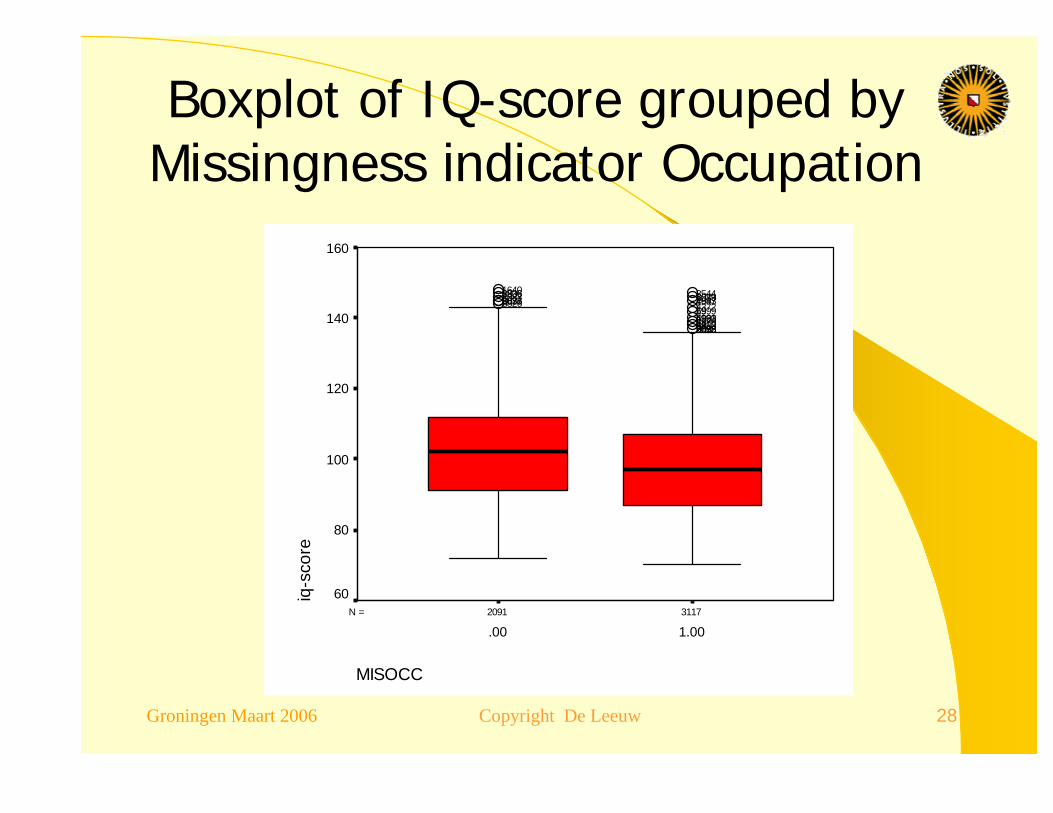
Boxplot of IQ-score grouped by Missingness indicator Occupation
31172091N =
MISOCC
1.00.00
iq-s
core
160
140
120
100
80
60
509221982078206596754503923484970519149604923199959437249931647507910833544
38263827363320764087380629361640
Copyright De Leeuw 29Groningen Maart 2006
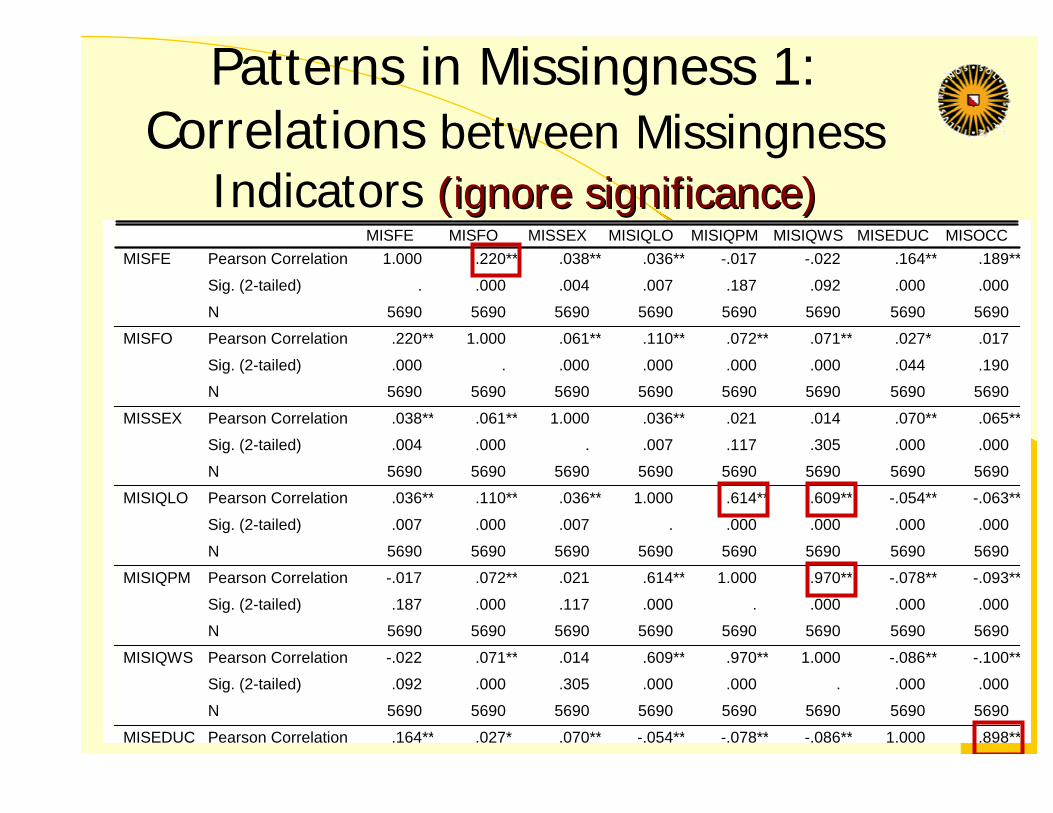
Patterns in Missingness 1: Correlations between Missingness
Indicators (ignore significance)(ignore significance)1.000 .220** .038** .036** -.017 -.022 .164** .189**
. .000 .004 .007 .187 .092 .000 .000
5690 5690 5690 5690 5690 5690 5690 5690
.220** 1.000 .061** .110** .072** .071** .027* .017
.000 . .000 .000 .000 .000 .044 .190
5690 5690 5690 5690 5690 5690 5690 5690
.038** .061** 1.000 .036** .021 .014 .070** .065**
.004 .000 . .007 .117 .305 .000 .000
5690 5690 5690 5690 5690 5690 5690 5690
.036** .110** .036** 1.000 .614** .609** -.054** -.063**
.007 .000 .007 . .000 .000 .000 .000
5690 5690 5690 5690 5690 5690 5690 5690
-.017 .072** .021 .614** 1.000 .970** -.078** -.093**
.187 .000 .117 .000 . .000 .000 .000
5690 5690 5690 5690 5690 5690 5690 5690
-.022 .071** .014 .609** .970** 1.000 -.086** -.100**
.092 .000 .305 .000 .000 . .000 .000
5690 5690 5690 5690 5690 5690 5690 5690
.164** .027* .070** -.054** -.078** -.086** 1.000 .898**
Pearson Correlation
Sig. (2-tailed)
N
Pearson Correlation
Sig. (2-tailed)
N
Pearson Correlation
Sig. (2-tailed)
N
Pearson Correlation
Sig. (2-tailed)
N
Pearson Correlation
Sig. (2-tailed)
N
Pearson Correlation
Sig. (2-tailed)
N
Pearson Correlation
MISFE
MISFO
MISSEX
MISIQLO
MISIQPM
MISIQWS
MISEDUC
MISFE MISFO MISSEX MISIQLO MISIQPM MISIQWS MISEDUC MISOCC
Copyright De Leeuw 30Groningen Maart 2006
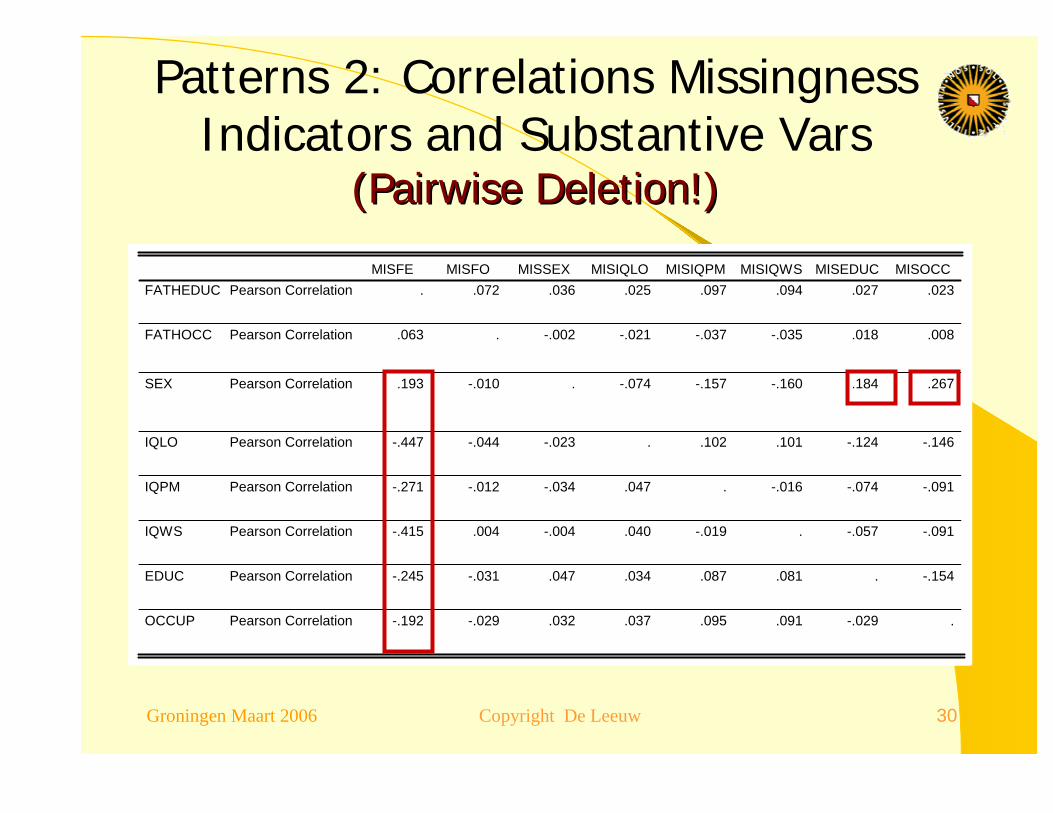
Patterns 2: Correlations MissingnessIndicators and Substantive Vars
(Pairwise Deletion!)(Pairwise Deletion!)
. .072 .036 .025 .097 .094 .027 .023
.063 . -.002 -.021 -.037 -.035 .018 .008
.193 -.010 . -.074 -.157 -.160 .184 .267
-.447 -.044 -.023 . .102 .101 -.124 -.146
-.271 -.012 -.034 .047 . -.016 -.074 -.091
-.415 .004 -.004 .040 -.019 . -.057 -.091
-.245 -.031 .047 .034 .087 .081 . -.154
-.192 -.029 .032 .037 .095 .091 -.029 .
Pearson Correlation
Pearson Correlation
Pearson Correlation
Pearson Correlation
Pearson Correlation
Pearson Correlation
Pearson Correlation
Pearson Correlation
FATHEDUC
FATHOCC
SEX
IQLO
IQPM
IQWS
EDUC
OCCUP
MISFE MISFO MISSEX MISIQLO MISIQPM MISIQWS MISEDUC MISOCC

Copyright De Leeuw 31Groningen Maart 2006
Suggested Readings
! De Leeuw, E.D., Hox, J., and Huisman, M. (2003). Prevention and treatment of item nonresponse. Journal of Official Statistics, 19, 2, 153-176.
! Schafer, J.L. and Graham, J.W. (2002). Missing data: Our view of the state of the art. Psychological Methods, 7, 147-177.