MisaineSEA CNSOPB REV 2 · table 7-3: emissions associated with flaring for one well..... 85 table...
146
Transcript of MisaineSEA CNSOPB REV 2 · table 7-3: emissions associated with flaring for one well..... 85 table...

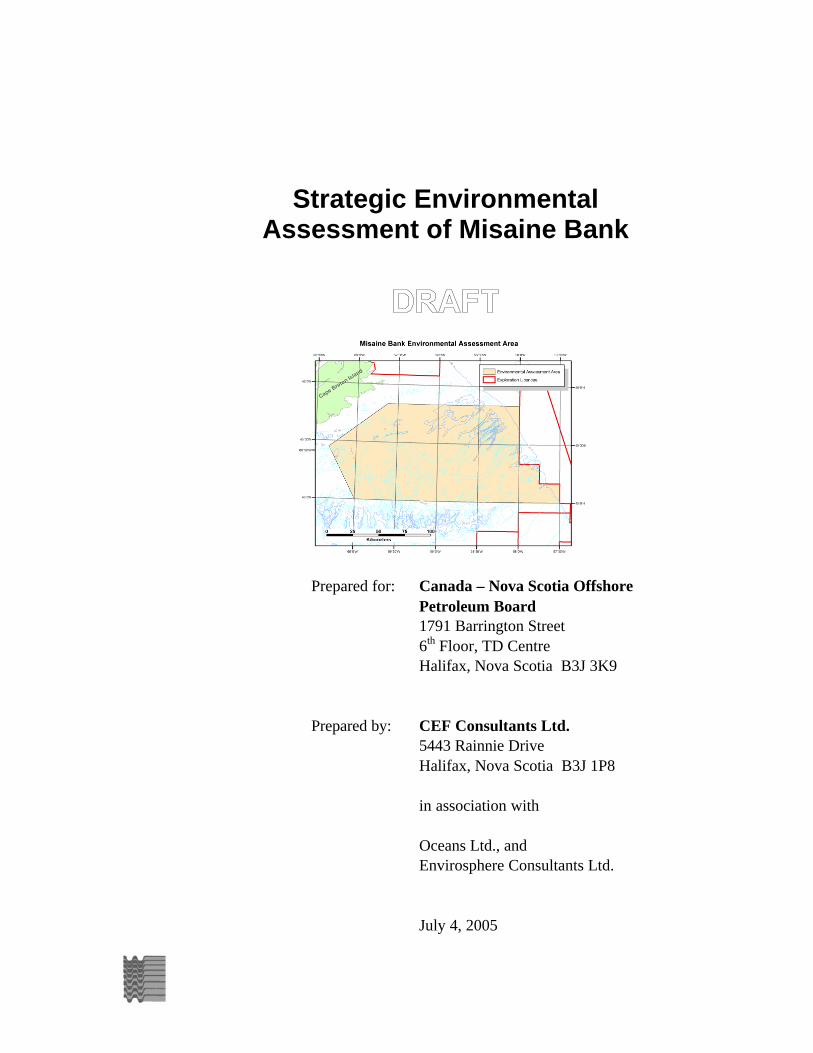
Strategic Environmental Assessment of Misaine Bank
Prepared for: Canada – Nova Scotia Offshore
Petroleum Board 1791 Barrington Street 6th Floor, TD Centre Halifax, Nova Scotia B3J 3K9
Prepared by: CEF Consultants Ltd. 5443 Rainnie Drive Halifax, Nova Scotia B3J 1P8 in association with Oceans Ltd., and Envirosphere Consultants Ltd.
July 4, 2005

– i –
Executive Summary
The Canada-Nova Scotia Offshore Petroleum Board (CNSOPB) is undertaking a Strategic Environmental Assessment (SEA) for the Misaine Bank area. This document is a draft assessment report based on the Scoping Document for a Strategic Environmental Assessment for the Misaine Bank, which was finalized following receipt and review of comments from regulatory agencies, stakeholders, and the public. This draft assessment report will be made available for public review and comment for a period of at least 30 days, and will be revised based upon regulatory and public comment. A public review meeting will be held in Sydney, Cape Breton, before the end of the review period.
The SEA is being conducted to provide an overview of the existing environment in the Misaine Bank area, as well as to discuss the potential environmental effects associated with offshore oil and gas exploration activities, identify knowledge and data gaps, highlight issues of concern, and make recommendations for mitigation and planning in the area. This document provides a description of the two primary activities associated with offshore oil and gas exploration: seismic surveys and exploratory drilling. A brief description of the environment is then provided, followed by the assessment methodology and the Valued Ecosystem Components to be used, the types of impacts to be considered, and potential mitigation measures.
Fisheries & Oceans Canada is the lead federal authority for oceans management and provides the national policy context for integrated ocean management. The Department has developed a prototype oceans management plan for the Eastern Scotian Shelf through a public consultation process. The ESSIM (Eastern Scotian Shelf Integrated Management) Draft Management Plan provides general guidance for assessing ocean impacts related to oil and gas exploration, and thus provides important guidance to this SEA.
Analysis of potential impacts suggests that the Misaine SEA area is not more sensitive to the potential effects of oil and gas than other areas of the Scotian Shelf. It is, however, less affected by past human activities, particularly bottom trawling, than many other areas opened to exploration previously. The area also has uncommon topography and may support unusual benthic communities in the numerous deep holes of cold water.
Fisheries for snow crab and northern shrimp within the Misaine SEA area are highly lucrative. The Laurentian Channel, on the eastern edge of the area, is an important migration route for marine mammals. The endangered blue whale, which enters the Gulf of St. Lawrence to feed in the summer, is of particular concern. Also, numerous coastal sites along eastern Cape Breton are sensitive to potential accidental spills of hydrocarbons.
Lack of information on benthic habitat within the area and its relationship to seismic effects, particularly on shrimp, are a concern. Less scientific information has been

– ii –
gathered within the Misaine SEA area than most other areas where oil and gas exploration has occurred. To reflect this lack of information, and concern by commercial fishermen about the potential importance of the area to the sustainability of their fisheries, it is recommended that Louisbourg Hole be a priority area for the collection of additional baseline information. A review of its ecological importance should be conducted once sufficient new information is available. It is also recommended that, if well site surveys are to be conducted in the area, biological information be collected and made publicly available for incorporation into a baseline database.
New guidelines for seismic surveys have been developed by DFO, in conjunction with other agencies. These guidelines would be adopted for the Misaine SEA area, should it become open to exploration, and will ensure minimal impacts on marine mammals and species of concern listed under SARA.
Other mitigation measures considered in this assessment include:
• prohibition of selected or all exploration activities;
• baseline studies or effects monitoring;
• modified rules for seismic operations dealing with ramping up, response to sightings, or night-time operations;
• use of specially trained observers to deal with specific issues, and
• zero discharge from exploratory drilling operations.
These additional mitigation measures can be applied broadly to exploration activities within the Misaine SEA area. They address the specific sensitivities identified in this SEA, and conform to the guidance provided in ESSIM. They will work to ensure that the residual impacts from oil and gas exploration remain at acceptably low levels. Additional mitigation, particularly with reference to the timing of activities to avoid especially sensitive periods are addressed in project-specific environmental assessments that may follow this SEA should a call for bids be issued.
The Misaine SEA area is less affected by past human activities, particularly bottom trawling, than other areas opened to exploration previously, and likely supports productive and possibly uncommon benthic communities. Still, no reason could be found to exclude exploration for oil and gas from the area.
– iii –
CONTENTS
EXECUTIVE SUMMARY...................................................................................................................... i
TABLE OF CONTENTS....................................................................................................................... iii
1 INTRODUCTION............................................................................................................................ 1
1.1 OBJECTIVES ................................................................................................................................ 3 1.2 RATIONALE FOR THIS SEA........................................................................................................... 3
2 EXPLORATION ACTIVITIES....................................................................................................... 5
2.1 SEISMIC SURVEYS ....................................................................................................................... 5 2.1.1 Seismic Sound Propagation ................................................................................................. 6 2.1.2 Other Influences on the Environment ................................................................................... 6 2.1.3 Potential Accidental Effects................................................................................................. 6
2.2 EXPLORATORY DRILLING ............................................................................................................ 7 2.2.1 Support Vessels and Aircraft................................................................................................ 8 2.2.2 Discharges.......................................................................................................................... 8 2.2.3 Duration and Timing ........................................................................................................... 9 2.2.4 Hazards Survey ................................................................................................................... 9
2.3 EXPLORATION ALTERNATIVES ..................................................................................................... 9
3 PHYSICAL ENVIRONMENT ...................................................................................................... 10
3.1 SURFICIAL GEOLOGY................................................................................................................. 10 3.2 OCEANOGRAPHY OF THE SCOTIAN SHELF ................................................................................... 11
3.2.1 General Conditions on the Scotian Shelf ............................................................................ 12 3.2.2 Laurentian Channel........................................................................................................... 13 3.2.3 Sable Island Bank.............................................................................................................. 13 3.2.4 Banquereau Bank.............................................................................................................. 14 3.2.5 Scotian Shelf Break ........................................................................................................... 14 3.2.6 Scotian Slope..................................................................................................................... 14
3.3 OCEANOGRAPHY OF THE MISAINE BANK AREA .......................................................................... 15 3.3.1 Ocean Currents................................................................................................................. 15
3.4 WINDS ...................................................................................................................................... 23 3.5 WAVES ..................................................................................................................................... 25 3.6 NOISE ....................................................................................................................................... 27
4 BIOLOGICAL ENVIRONMENT................................................................................................. 28
4.1 PRIMARY PRODUCTIVITY ........................................................................................................... 28 4.2 ZOOPLANKTON.......................................................................................................................... 29 4.3 BENTHIC COMMUNITIES ............................................................................................................ 29

– iv –
4.4 COMMERCIAL MARINE INVERTEBRATES..................................................................................... 30 4.4.1 Snow Crab ........................................................................................................................ 30 4.4.2 Northern Shrimp ............................................................................................................... 31 4.4.3 Other Species .................................................................................................................... 31
4.5 MARINE FISH ............................................................................................................................ 31 4.5.1 Seasonal Distributions....................................................................................................... 32 4.5.2 Commercial Groundfish .................................................................................................... 32 4.5.3 Large Pelagics .................................................................................................................. 34 4.5.4 Pelagic and Estuarial ........................................................................................................ 34
4.6 EGGS, LARVAE, & SPAWNING .................................................................................................... 34 4.6.1 Methodology ..................................................................................................................... 35 4.6.2 Eggs and Larvae from SSIP Oblique Bongo Tows .............................................................. 36 4.6.3 Literature Reports of Spawning ......................................................................................... 37 4.6.4 EAISSNA Maps of SSIP Data............................................................................................. 38
4.7 MARINE MAMMALS................................................................................................................... 42 4.7.1 Cetaceans ......................................................................................................................... 42 4.7.2 Seals ................................................................................................................................. 48
4.8 MARINE TURTLES ..................................................................................................................... 48 4.9 SEA BIRDS ................................................................................................................................ 48
4.9.1 Seasonal Distributions of Pelagic Birds ............................................................................. 49 4.9.2 Foraging Patterns and Prey Species .................................................................................. 50 4.9.3 Coastal Waterfowl and Seabirds........................................................................................ 50
4.10 SPECIES AT RISK...................................................................................................................... 51
5 HUMAN ACTIVITY ..................................................................................................................... 54
5.1 SPECIAL AREAS ......................................................................................................................... 54 5.1.1 Coral Areas....................................................................................................................... 54 5.1.2 Sensitive Coastal Areas ..................................................................................................... 56
5.2 SHIP TRAFFIC ............................................................................................................................ 58 5.3 FISHING ACTIVITY..................................................................................................................... 58
5.3.1 Abundance and Management............................................................................................. 58 5.3.2 Pre- and Post-Moratorium Fishing Activity ....................................................................... 62 5.3.3 Snow Crab and Shrimp...................................................................................................... 65 5.3.4 Groundfish........................................................................................................................ 67 5.3.5 Emerging and Experimental Fisheries ............................................................................... 69
6 ASSESSMENT METHODS AND CONSULTATION.................................................................. 70
6.1 OVERVIEW ................................................................................................................................ 70 6.1.1 Regulatory Context............................................................................................................ 70 6.1.2 Information on Exploration Activities and Impacts............................................................. 71
6.2 RESULTS OF CONSULTATION...................................................................................................... 72 6.2 ISSUES SCOPING AND SELECTION OF VALUED ECOSYSTEM COMPONENTS.................................... 74

– v –
6.2.1 Issues Scoping................................................................................................................... 74 6.2.2 Boundaries........................................................................................................................ 74 6.2.3 Selection of Valued Ecosystem Components....................................................................... 75
6.3 ENVIRONMENTAL EFFECTS ASSESSMENT FRAMEWORK............................................................... 76 6.3.1 Data Deficiencies.............................................................................................................. 76
6.4 ENVIRONMENTAL PLANNING AND MANAGEMENT....................................................................... 77
7 EFFECTS ANALYSIS................................................................................................................... 77
7.1 ESSIM AND CRITERIA FOR ECOLOGICAL SIGNIFICANCE ............................................................. 77 7.1.1 Ecological Significance ..................................................................................................... 78 7.1.2 Initial Evaluation of the Misaine SEA Area ........................................................................ 79
7.2 SEISMIC SURVEYS ..................................................................................................................... 80 7.3 EXPLORATORY DRILLING .......................................................................................................... 81 7.4 POTENTIAL EFFECTS ON VECS .................................................................................................. 82
7.4.1 Seismic Surveys................................................................................................................. 82 7.4.2 Exploratory Drilling.......................................................................................................... 83 7.4.3 Well Site Surveys............................................................................................................... 86 7.4.4 Potential Effects on Fisheries ............................................................................................ 87
7.5 SPECIAL SENSITIVITIES OF THE AREA ......................................................................................... 87 7.5.1 Naturalness....................................................................................................................... 87 7.5.2 Productivity and Reproduction .......................................................................................... 88 7.5.3 Lack of Information on Benthic Communities..................................................................... 88 7.5.4 Concerns about Impacts on Shrimp and Crab Fisheries ..................................................... 88 7.5.5 Deep Water Corals............................................................................................................ 90 7.5.6 Sensitive Coastal Areas ..................................................................................................... 90 7.5.7 Species at Risk................................................................................................................... 92
8 EFFECTS OF THE ENVIRONMENT ON POTENTIAL PROJECTS....................................... 92
9 CUMULATIVE EFFECTS............................................................................................................ 93
10 SUMMARY OF SPECIAL CONCERNS AND MITIGATING MEASURES.............................. 95
11 REFERENCES............................................................................................................................... 96
Glossary...................................................................................................................................... 107
APPENDIX A – Additional Information for the Environmental Setting
LIST OF TABLES
TABLE 1-1: MISAINE BANK SEA STUDY AREA COORDINATES .................................................................... 2 TABLE 2-1: TYPICAL VOLUME OF WATER-BASED MUD CONSTITUENT DISCHARGED PER WELL ................. 8 TABLE 3-1: ANNUAL PERCENTAGE FREQUENCY OCCURRENCE OF WINDN SPEED BY DIRECTION ............... 24

– vi –
TABLE 3-2: ANNUAL PERCENTAGE FREQUENCY OCCURRENCE OF WAVE HEIGHT BY DIRECTION ............... 25 TABLE 4-1: AVERAGE NUMBERS OF FISH EGGS BY MONTH WITHIN THE MISAINE SEA AREA
(INDIVIDUALS/M3)............................................................................................................... 36 TABLE 4-2: OCCURRENCE OF EGGS, SPAWNING AND LARVAE IN THE MISAINE SEA AREA ......................... 42 TABLE 4-3: MARINE MAMMAL SPECIES THAT OCCUR ON THE SCOTIAN SHELF........................................... 44 TABLE 4-4: SUMMARY OF THE DISTRIBUTION AND PRIMARY PREY OF TOOTHED AND BALEEN WHALES
PROBABLY COMMON IN THE MISAINE AREA ........................................................................ 46 TABLE 4-5: SPECIES WITH COSEWIC/SARA DESIGNATIONS IN THE STUDY AREA.................................... 53 TABLE 5-1: DESIGNATED SPECIAL AREAS ALONG SOUTH COAST OF CAPE BRETON ISLAND ....................... 57 TABLE 5-2: STOCK STATUS OF SPECIES ON EASTERN SCOTIAN SHELF....................................................... 61 TABLE 5-3: AVERAGE ANNUAL PRE-MORATORIUM AND POST-MORATORIUM LANDINGS FOR FISHERIES
MANAGEMENT DIVISIONS 4VN, 4VS, AND 4W..................................................................... 63 TABLE 5-4: LANDINGS (THOUSANDS OF METRIC TONNES) FOR UNIT AREA 4VSB BY MAJOR SPECIES OR
SPECIES GROUP, 2001 TO 2003............................................................................................ 65 TABLE 6-1: STAKEHOLDER CONSULTATIONS FOR THE MISAINE SEA......................................................... 73 TABLE 7-1: ECOLOGICAL SENSITIVITY OF AREAS WITHIN THE MISAINE SEA AREA .................................. 80 TABLE 7-2: SPILL INCIDENTS REPORTED TO THE CNSOPB, 2002-2004 ..................................................... 82 TABLE 7-3: EMISSIONS ASSOCIATED WITH FLARING FOR ONE WELL ........................................................ 85 TABLE 9-1: NUMBER OF ENVIRONMENTAL ASSESSMENTS CONSIDERED BY THE CNSOPB, 2001-2005 ...... 94
LIST OF FIGURES
FIGURE 1-1: AREA TO BE COVERED BY THE STRATEGIC ENVIRONMENTAL ASSESSMENT ............................ 1 FIGURE 1-2: RELATIONSHIP OF THE ORPHEUS GRABEN TO THE PROPOSED MISAINE SEA AREA ................... 4 FIGURE 3-1: SURFICIAL GEOLOGY OF THE MISAINE SEA AREA................................................................. 11 FIGURE 3-2: MODELED DRIFT TRAJECTORIES AT THE SURFACE................................................................. 17 FIGURE 3-3: MODELED DRIFT TRAJECTORIES AT 25 M .............................................................................. 18 FIGURE 3-4: MODELED DRIFT TRAJECTORIES AT 100 M ............................................................................ 19 FIGURE 3-5: ANNUAL TEMPERATURE AND SALINITY VARIABILITY FOR MISAINE BANK ............................. 20 FIGURE 3-6: SEASONAL CYCLE OF TEMPERATURE AND SALINITY FOR MISAINE BANK ............................... 21 FIGURE 3-7: VERTICAL SECTION OF TEMPERATURE AND SALINITY DISTRIBUTIONS ON THE
LOUISBOURG LINE DURING JUNE 1999 (MISAINE BANK LIES WITHIN THE FIRST RIGHT HAND
100 KM OF THE SECTION)..................................................................................................... 22 FIGURE 3-8: LOCATION OF THE LOUISBOURG OCEANOGRAPHIC MONITORING LINE ................................... 23 FIGURE 3-9: ANNUAL WIND DIRECTION VS. WIND SPEED ......................................................................... 24 FIGURE 3-10: ANNUAL PRIMARY WAVE DIRECTION VS. SIGNIFICANT WAVE HEIGHT ................................ 26 FIGURE 3-11: SOUND SPEED PROFILES IN MISAINE BANK COMPUTED FROM MEAN TEMPERATURE AND
SALINITY............................................................................................................................ 28 FIGURE 4-1: SSIP STATIONS WITHIN THE MISAINE SEA AREA .................................................................. 35 FIGURE 4-2: MONTHLY ABUNDANCE OF EGGS WITHIN THE MISAINE SEA AREA FROM AN SSIP DATASET .. 37

– vii –
FIGURE 4-3: CONCENTRATIONS OF PROBABLE COD EGGS ON THE SCOTIAN SHELF FROM SSIP DOUBLE
OBLIQUE BONGO TOWS ...................................................................................................... 38 FIGURE 4-4: CONCENTRATIONS OF PROBABLE COD EGGS ON THE SCOTIAN SHELF FROM SSIP SURFACE
BONGO TOWS .................................................................................................................... 40 FIGURE 4-5: CONCENTRATIONS OF YELLOWTAIL EGGS ON THE SCOTIAN SHELF FROM SSIP SURFACE BONGO
TOWS ................................................................................................................................ 41 FIGURE 4-6: CONCENTRATIONS OF AMERICAN PLAICE EGGS ON THE SCOTIAN SHELF FROM SSIP SURFACE
BONGO TOWS ..................................................................................................................... 41 FIGURE 5-1: LOCATION OF SENSITIVE COASTAL FEATURES AND THE STONE FENCE CORAL PROTECTION
AREA ................................................................................................................................. 56 FIGURE 5-2: ESTIMATED MERCHANT, CRUISE AND FISHING VESSEL TRAFFIC DENSITY CIRCA 2001 ........... 58 FIGURE 5-3: FISHERIES MANAGEMENT AREAS FOR FINFISH, SNOW CRAB AND LOBSTER............................ 60 FIGURE 5-4: AVERAGE ANNUAL PRE-MORATORIUM (1988-1993) AND POST-MORATORIUM (1997-2001)
LANDED VALUE FOR FISHERIES MANAGEMENT DIVISIONS 4VN, 4VS, AND 4W..................... 64 FIGURE 5-5: LOCATION OF SNOW CRAB CATCHES, 2001-2003 .................................................................. 66 FIGURE 5-6: LOCATION OF NORTHERN SHRIMP CATCHES, 2001-2003 ....................................................... 67 FIGURE 5-7: LOCATION OF REDFISH CATCHES, 2001 TO 2003.................................................................... 68 FIGURE 5-8: LOCATION OF GROUNDFISH CATCHES, 2001 TO 2003............................................................. 69
Cover photo credits:
Coral Image – http://www.duke.edu/%7Eal18/Gallery.htm
Seismic Vessel Viking – http://www.economist.com.na/2001/280901/story10.htm
Oil Rig – http://tonova.typepad.com/thesuddencurve/images/oil_rig.jpg

– viii –

1 INTRODUCTION The Canada-Nova Scotia Offshore Petroleum board (CNSOPB) is undertaking a Strategic Environmental Assessment (SEA) for the Misaine Bank area as outlined in Figure 1-1. A scoping document was prepared and released for public comment to assist the CNSOPB in developing the terms of reference and scope for the assessment. This scoping document was finalized on May 24, 2005, and was made available on the CNSOPB website. Comments were received, and those comments were taken into consideration during the composition of this draft SEA.
Figure 1-1: Area to be Covered by the Strategic Environmental Assessment
Table 1-1 gives the coordinates for the study area, in both degrees, minutes and seconds, and decimal degrees, referenced to the NAD 27 datum.

2 Strategic Environmental Assessment for the Misaine Bank Area
Table 1-1: Misaine Bank SEA Study Area Coordinates
Degrees, Minutes, Seconds Decimal Degrees
Latitude N Longitude W Latitude N Longitude W
45°50' 59°38'30" 45.83333 59.62500
45°50' 59°0' 45.83333 59.00000
45°50' 58°0' 45.83333 58.00000
45°20' 58°0' 45.33333 58.00000
45°20' 57°45' 45.33333 57.75000
45°10' 57°45' 45.16667 57.75000
45°10' 57°30' 45.16667 57.50000
45°0' 57°30' 45.00000 57.50000
45°0' 59°0' 45.00000 59.00000
45°0' 60°0' 45.00000 60.00000
45°27' 60°20' 45.45000 60.33333
45°50' 59°38'30" 45.83333 59.62500
The Canada - Nova Scotia Offshore Petroleum Board has the responsibility pursuant to the Canada - Nova Scotia Offshore Petroleum Resources Accord Implementation Act and the Canada - Nova Scotia Offshore Petroleum Resources Accord Implementation (Nova Scotia) Act (the Accord Acts) to ensure that offshore oil and gas activities proceed in an environmentally responsible manner. The CNSOPB conducts strategic environmental assessments (SEAs) in portions of the Nova Scotia offshore area that may be offered in a Call for Bids for exploration licences for offshore oil and gas exploration and that have not been assessed by a comprehensive study, a panel review under the Canadian Environmental Assessment Act (CEAA), or a public review by a commissioner appointed by the CNSOPB.
This draft assessment report is based on a scoping document, which received commentary from regulatory agencies and stakeholders. This draft assessment report will be made available for public review and comment for a period of at least 30 days, and will be revised based on regulatory and public comment. A public review meeting will be held in Sydney, Cape Breton, before the end of the review period.
SEA is a planning process that examines the environmental effects which may be associated with a plan, program, or policy proposal and allows for the incorporation of environmental considerations at the earliest stages of program planning. SEA typically considers the overall ecological setting rather than a project-specific environmental assessment that focuses on site-specific issues within well-defined boundaries. Additional information regarding SEA may be found on the Canadian Environmental Assessment Agency web site at: http://www.ceaa-acee.gc.ca. This SEA addresses its relationship to DFO's Eastern Scotian Shelf Integrated Management (ESSIM) initiative.

Strategic Environmental Assessment for the Misaine Bank Area 3
This document provides a description of the two primary activities associated with offshore oil and gas exploration: seismic surveys and exploratory drilling. A brief description of the environment is then provided, followed by the assessment methodology to be used, the types of effects to be considered, and potential mitigation measures.
1.1 Objectives
The Misaine Bank SEA will consider petroleum-related activities that may occur offshore if one or more exploration licences are issued. An exploration licence confers:
1. the right to explore for, and the exclusive right to drill and test for, petroleum;
2. the exclusive right to develop those portions of the offshore area in order to produce petroleum, and
3. the exclusive right, subject to compliance with the other provisions of the Accord Act to apply for a production licence.
Associated activities may include drilling of either exploration or delineation wells, in addition to seismic and other geophysical surveys. All of these activities require the specific approval of the CNSOPB and each requires a project-specific assessment of its associated environmental effects. The SEA does not replace the need for site-specific EAs, but provides an overview of the existing environment in the Study Area, and identifies any major environmental effects associated with offshore oil and gas activities that may differ from past experience in Nova Scotia offshore waters. It will identify knowledge and data gaps, highlight issues of concern, and make recommendations for mitigation and planning. Information from the SEA will assist the CNSOPB in determining whether exploration rights should be offered in whole or in part for the area, and may also identify general restrictive or mitigative measures that should be considered for application to exploration activities within new exploration licences.
The Misaine Bank SEA will identify features in the study area that might pose different environmental problems from those common to the wider Scotian Shelf, or which may need to be addressed differently by the oil and gas industry or its regulators. The SEA may identify general restrictive or mitigative measures and monitoring requirements that should be considered for application to exploration activities.
1.2 Rationale for this SEA
The 1986 Accord Acts, establishing the Canada-Nova Scotia Offshore Petroleum Board (CNSOPB), are mirror legislation under authority of the Ministers of Natural Resources Canada and the Nova Scotia Department of Energy. The Acts give the Board the responsibility to regulate oil and gas activity in the Nova Scotia offshore, including:
• health and safety for offshore workers;

4 Strategic Environmental Assessment for the Misaine Bank Area
• protection of the environment during offshore petroleum activities;
• management and conservation of offshore petroleum resources;
• compliance with the provisions of the Accord Acts that deal with Canada-Nova Scotia employment and industrial benefits;
• issuance of licences for offshore exploration and development, and
• resource evaluation, data collection, curation and distribution.
This SEA is focused on environmental protection. To ensure that opportunities for economic and employment benefits are provided to Nova Scotians and Canadians, the Board requires a Canada-Nova Scotia Benefits Plan be submitted before exploration or production activity proceeds. Together, the Natural Resources Canada and the Nova Scotia Department of Energy support the use of a SEA to support the Government of Canada Cabinet Directives regarding sustainability and the Province's Energy Strategy. The intent is to ensure that environmental considerations are taken into account when issuing exploration rights.
Current geoscience knowledge and comparison to similar geological structures around the world suggest oil and gas reserves may be found in the Misaine SEA area. The Orpheus Graben, covering about 20,000 km2 (50 km by 400 km), is the dominant feature of this area (Figure 1-2). The maximum sediment thickness in the area is not known for certain but may exceed 12 kilometers at its eastern end.
Figure 1-2: Relationship of the Orpheus Graben to the Proposed Misaine SEA Area

Strategic Environmental Assessment for the Misaine Bank Area 5
Seven exploration wells were drilled within (4) and along the edge of (3) the basin during the early 1970s (well symbols are shown at these locations in Figure 1-2). They drilled faulted, basement- and salt-related structures utilizing then-current knowledge and understanding, with exploration targets based on seismic data of very limited quality and quantity. No hydrocarbon shows were encountered in the original wells.
2 EXPLORATION ACTIVITIES
2.1 Seismic Surveys
Seismic surveys use underwater sound generated by sudden releases of compressed air to map geological structures under the seabed. Pressure waves from the airguns reflect at the boundaries of different rock types, and these reflected waves are picked up at a series of receivers towed behind the survey vessel. Computer-based data processing systems convert the reflected sound into seismic displays that can be used to map possible hydrocarbon accumulations.
An offshore survey vessel is typically 80 to 95 m long, with a crew of approximately 40 personnel (Davis et al. 1998). An array of airguns towed 4 to 10 m below the water surface behind a survey vessel provides the high intensity energy source. The vessel runs a series of lines at a speed of approximately 3.5 to 5.5 knots (6.5 to 10 km/h).
The sound source is typically discharged approximately every 25 m (10 to 12 seconds) and directs the largest amount of sound downward toward the sea floor . Reflected sound energy from below the sea bottom is recorded by one or more hydrophone arrays (streamers) towed behind the survey vessel. These streamers are typically 3 to 6 km long.
Seismic surveys can be two-dimensional (2D) or three-dimensional (3D). 2D seismic surveys typically cover relatively large geographical areas and generally spend less time within a small specific area than 3D surveys. Survey lines tend to be more than 1 km apart, and often run in different directions. 2D surveys use a single source array and a single streamer (receiver).
3D seismic surveys provide a much greater resolution of underground structures. 3D surveys are substantially more expensive and are not always done prior to exploratory drilling. 3D surveys tend to concentrate activity over a relatively small geographical area for extended periods (often weeks at a time), with survey lines usually spaced several hundred metres apart (Davis et al. 1998). 3D surveys typically use multiple source arrays and 6 to 8 streamers (receivers).
An exploration licence confers the exclusive right to undertake drilling activity, but is not required to conduct seismic surveys. Therefore, seismic survey areas often extend beyond exploration licence boundaries.

6 Strategic Environmental Assessment for the Misaine Bank Area
2.1.1 Seismic Sound Propagation
Seismic shots, or bursts of energy from airguns, are of short duration, at most a few tens of milliseconds (ms). Peak energy levels in a shot is high, but the short duration of the shot means that the total energy transmitted into the water column is low compared to a continuous release. Most of the sound produced by an airgun array is in the range of 10 to 300 Hertz (Turnpenny and Nedwell 1994). Seismic airguns are designed to produce primarily low frequencies, but a broad spectrum of signal is generated, particularly to the side. The shape of the pulse also influences its potential environmental effect.
The total airgun volume in the array and the operating pressure of the guns determine the amplitude of the acoustic signal. Marine airgun arrays normally have a total volume of between 2,000 and 4,000 cubic inches and operate at approximately 2,000 pounds per square inch (psi). The peak sound pressure level generated by such arrays would be between 240 and 260 dB re 1µPa @ 1 m.
The sound amplitude from a seismic array diminishes (attenuates) with increasing distance from the source. Attenuation is a function of the logarithm of the distance from the source, meaning it is rapid close to the source, but more gradual at longer distances. As the distance increases, the amplitude of the sound diminishes and the frequency spectrum broadens.
A range of activity and site-specific factors may also influence sound propagation in the marine environment. For example, sound levels and frequencies can vary, and oceanographic characteristics (e.g., sea bottom roughness, water depth, temperature, and salinity) can also influence attenuation as it propagates through the water (Davis et al. 1998). Sound propagation in shallow water, for example, is more strongly attenuated, especially at low frequencies, compared to deeper waters. Stratification of the water column can also provide channels that promote the transmission of sound over long distances.
Davis et al. (1998) provides a more thorough review of sound propagation. Background noise levels are also important in determining the impact of the sound from seismic surveys, especially at distances of greater than one kilometre. The hearing sensitivity of organisms will also play a role in the magnitude of impact on biota.
2.1.2 Other Influences on the Environment
Vessel traffic, including survey and possible guard vessels, can also have effects on the environment. Other operational concerns include vessel discharges, such as deck drainage, vessel exhaust, and the presence of vessels and lights at night.
2.1.3 Potential Accidental Effects
Unlike exploratory drilling, the risk of releasing oil or gas to the environment during seismic surveys is the same as for any typical ship. As is the case with any marine vessel,

Strategic Environmental Assessment for the Misaine Bank Area 7
accidents may occur, ranging from small spills of fuel, to releases from seismic streamers, to possible collisions with marine life, fishing gear, and/or other vessels.
2.2 Exploratory Drilling
Hydrocarbons are found in porous rock structures, which may contain oil and gas accumulations that are large enough to be commercially developed. Exploratory drilling is the only way to confirm the presence and nature of hydrocarbons (oil, gas, condensate, % water, or a combination of these) that seismic survey results indicated may be present. Selection of specific sites for exploratory drilling can only be determined following analysis of seismic data.
If hydrocarbons are found during exploratory drilling, testing may be required to further define the potential for development. The results of these tests may give some indication about whether hydrocarbons may be present in quantities that are economical to develop.
Appraisal and/or delineation wells may be required if the presence of commercial quantities of hydrocarbons is indicated. These wells are drilled at a new location over the same prospect (or reservoir). They are required to determine the area and volume of the discovered hydrocarbons. The size and structural complexity of the accumulation will decide the number of appraisal/delineation wells required.
Drill rigs may be anchored directly on the bottom or floating. Floating rigs, including drill ships, can be anchored to the bottom or dynamically positioned.
Jack-up rigs are generally used in waters less than 80 m deep. They are towed to the drill site, where their movable legs are jacked down onto the sea bottom, elevating the rig platform until it is about 20 m above the water surface. The type of bottom support used for the legs depends on the softness of the bottom. If the bottom is unstable, large steel mats can be used to support the rig legs; where the bottom is solid, steel cylinders (“spud cans”) are attached to each leg.
Semi-submersible rigs might also be used, if the water at the well sites is deep enough. These rigs are towed to the drill site where the bottom part of the rig is flooded, and the rig moored to the bottom with a series of 6 to 10 anchors. Most semi-submersibles rely on anchors, but a few use a dynamic positional system with multi-directional thrusters.
Drill ships are unlikely to be used in the Misaine Bank area because the moderate depths favour less expensive rigs.
Drill rigs are usually self contained and include a derrick and drilling equipment, a helicopter pad, fire and rescue equipment and crew quarters. Rigs usually have one to three support vessels in attendance. They need to be supplied with drilling equipment, fuel, food, and many other materials and supplies to maintain a crew, vessel, and drilling

8 Strategic Environmental Assessment for the Misaine Bank Area
operations. In addition, there are regular crew changes and visitors that need to be carried to and from the platform.
2.2.1 Support Vessels and Aircraft
Materials are transported to drill rigs by supply vessels approximately three times per week. A series of dedicated 24-hour stand-by vessels also attend the rig throughout the drilling operation. Crews and some supplies are also routinely transferred to the offshore by helicopter.
2.2.2 Discharges
Drilling muds may be water-based (WBMs), oil-based (OBMs), or synthetic (SBMs). WBM are typically used, but OBMs or SBMs may be used with permission from the CNSOPB following review of specific environmental assessment of the impacts. The release of OBMs is prohibited, and the only release of SBMs to the local marine environment permitted is through that remaining on cuttings discharged. The main component of any WBM is seawater, with bentonite (clay) and barite as the primary additives. WBMs are proprietary mixtures, and each contains its own blend of chemicals. The typical volume of water-based mud constituents discharged per well, for a single well drilled 5,000 m deep, is shown in Table 2-1 (from Thomson et al. 2000).
Table 2-1: Typical Volume of Water-Based Mud Constituent Discharged Per Well
CONSTITUENT TONNES
TOTAL CUTTINGS GENERATED 1235.0
MI GEL 107.6
MI BAR 219.2
CAUSTIC SODA 2.2
SODA ASH 0.6
LIME 0.1
SPERSENE CF 0.5
DRILLING DETERGENT 1.1
POLY PAC 6.7
XCD KELZAN 2.4
POLY PLUS 5.4
POTASSIUM CHLORIDE 107.8
DEFOAM X 0.4
CALCIUM CARBONATE 24.6
Offshore drilling platforms also routinely produce a variety of other wastes including:

Strategic Environmental Assessment for the Misaine Bank Area 9
• grey and black water (showers, dishwashing, deck drains);
• ballast water/preload water;
• bilge water;
• deck drainage;
• discharges from machinery spaces;
• garbage, and
• cooling water.
The amount of these discharges can vary with variables such as weather conditions. Thomson et al. (2000) estimated discharges of grey and black water to be 40 m3/day and 19 m3/day respectively, for a floating drilling platform with 100 people. Treatment of these wastes will follow the NEB/CNSOPB/C-NLOPB Offshore Waste Treatment Guidelines in effect at the time.
2.2.3 Duration and Timing
The drilling of a single exploration well typically requires between 40 and 100 days, depending on the complexity of the well, environmental conditions, and well depth. Testing, if hydrocarbons are found, may encompass a broad array of activities and usually requires from 10 to 40 days.
Because of unfavorable ice and weather conditions, exploratory drilling would unlikely be carried out between the months of January and April/May.
2.2.4 Hazards Survey
Prior to setting up jack-up rigs, a hazard survey is conducted at each well site to make sure conditions will support the rig legs (or spuds) and no potential shallow gas accumulations exist near the surface that the well bore would penetrate. Site surveys acquire high-resolution seismic data, sub-bottom profiles, sidescan sonar images and bathymetry concurrently. Grab samples and bottom camera photographs are taken where appropriate. The actual geometry of the surveys may be adjusted during acquisition to account for water depth. The choice of sub-bottom profiler (shallow or deep tow) is dependent on water depth. Airgun arrays used in hazards surveys are substantially less powerful than those used in seismic surveys.
2.3 Exploration Alternatives
Seismic surveying using air guns as a sound source is the current industry standard for collection of geophysical information thousands of metres below the seabed. Seismic surveys are conducted to identify potential underground structures that may hold hydrocarbon reserves. Exploratory drilling is conducted on promising structures to verify the presence of hydrocarbons and to provide information on flow rates and quality.

10 Strategic Environmental Assessment for the Misaine Bank Area
Alternatives to a project are defined as functionally different ways of achieving the same end (CEA Agency 1997). A seismic survey is a cost-effective means to determine if underground structures have sufficient potential for oil and gas deposits to explore further.
Alternative means for the project can be defined as methods of similar technical character or methods that are functionally the same (CEA Agency 1997). Alternative means of exploration surveying include use of different sound sources, such as explosives or vibrating devices. In relation to exploratory drilling, different types of drilling muds may be used.
Conducting marine seismic surveys is expensive, but much less expensive than exploratory drilling. Information obtained by seismic surveys substantially reduces the cost of exploration. If seismic surveys were not generally permitted in marine environments, exploratory drilling and/or production would not occur.
3 PHYSICAL ENVIRONMENT The surface of Misaine Bank is extensively marked by channels and canyons that resulted from glacial and ice melting processes. This is expected to have an impact on the circulation in the area and at the same time make the modeling of waste dispersion near the bottom a complex issue, due to the intricate character of the interactions between the flow and the irregular bottom floor. The relative simplicity of the current systems around Sable Island (clockwise current circulation with dominant easterly flow on the north and westerly to northwesterly flow on the south) will not be observed here.
3.1 Surficial Geology
The Misaine Bank area has been substantially affected by glacial activity, from multiple glacial events. The topography of the bank can be attributed to sub-aerial erosion of the bedrock during low-stand events (MacLean and King 1971). The topography of the surficial sediments closely follows the contours of the underlying bedrock.
Figure 3-1 shows that the surficial sediments of the Misaine SEA area comprise primarily Sable Island sand and gravel, and Sambro sand and Laurentian sand (MacLean and King 1971). The Sable Island sand and gravel unit consists of fine- to coarse-grained, well-sorted sand that laterally grades into gravel. This formation overlies the Scotian Shelf drift and glacial till. The Sambro sand unit is a coarser-grained lateral extension of the Emerald silt unit, and underlies the Sable Island sand and gravel unit. The Laurentian sand is an informal name for the extension of this unit into the Laurentian Channel. This unit is composed of fine- to coarse-grained sand, with some silt, clay and gravel. This unit is most likely derived from the underlying glacial till unit.

Strategic Environmental Assessment for the Misaine Bank Area 11
Figure 3-1: Surficial Geology of the Misaine SEA Area
Basins on the Misaine Bank are filled with clay and silt from the La Have clay and Laurentian silt unit, and the Emerald silt unit (MacLean and King 1971). The La Have clay is dark grey clayey silt that grades to sandy silt. The Laurentian silt unit is the equivalent to this unit as it occurs in the Laurentian Channel. The Emerald silt unit consists of poorly sorted clayey and sandy silt, often with some gravel. This unit underlies the La Have clay in depressions in the Misaine Bank area.
Underlying these units in most areas of the Misaine Bank is the Scotian Shelf drift and Laurentian drift unit. This unit is formed from glacial till, composed of sand with silt and clay and some gravel. The sediment is poorly sorted and consists of quartzite, granite and sandstone fragments.
Seismic studies show that these sediments are derived from the onshore bedrock, so they have a composition similar to these granites and sedimentary rocks. The sediments and sedimentary rocks overlying the bedrock on the Misane Bank can be as thick as 50 metres (Josenhans et al. 2004).
3.2 Oceanography of the Scotian Shelf
The Misaine Bank lies north of the western sector of Banquereau Bank. It is located southeast of Cape Breton Island, and it is bordered by the Laurentian Channel from the northeast and the Sable Island Bank from the southwest. It is approximately 130

12 Strategic Environmental Assessment for the Misaine Bank Area
kilometres long by 65 kilometres wide with depths varying between 70 and 100 metres over a rocky and broken bottom.
The geographic location of Misaine Bank and its topographic characteristics confer the bank distinctive hydrographic and hydrodynamic conditions that differ from those of the surrounding areas.
A brief description of the oceanographic conditions of water bodies surrounding Misaine Bank is offered below.
3.2.1 General Conditions on the Scotian Shelf
Circulation patterns on the Shelf primarily result from the convergence of three major ocean currents.
• the Nova Scotia Current flows southwesterly out of the Gulf of St. Lawrence through the Cabot Strait. A portion of this year round current then turns westward near Cape Breton Island and moves along the Nova Scotia coast. East of Cape Breton Island, the rest of the outflow continues to move seaward over the shelf and on the western side of the Laurentian Channel.
• the cool Labrador Current flows southwesterly from the Labrador Sea and shelf until it joins with the offshore branch of the Nova Scotia Current. It then moves along the edge of the Scotian Shelf.
• the warm Gulf Stream Current flows south of the Scotian Shelf in a northeasterly direction. Clockwise flows around the offshore banks and counterclockwise flows around the deep basins characterize circulation patterns in the area.
Current modeling efforts on the Scotian Shelf have revealed the presence of partial gyres that encourage retention of particles and marine organisms such as plankton. (Cong et al. 1996, Hannah et al. 2001). The retention areas produced by these gyres are thought to be of biological importance for events such as spawning.
Phenomena known as internal waves occur at the shelf edge where the steep topography interacts with the diurnal tides. These waves produce a mixing of water layers across the thermocline and draw nutrients and phytoplankton down to deeper layers. This occurrence is particularly prevalent on the Southwest Peak of Banquereau Bank.
Surficial geology consists primarily of sand and gravel deposits of various sizes in water depths of less than 100 metres, while sand with silt and clay mixtures are found in the deeper areas. A long sand-ridge system stretches from Sable Island Bank to Banquereau Bank including Sable Island, and is perhaps the remnants of a barrier island system, now long submerged (Amos and Knoll 1987).
Strategic Environmental Assessment for the Misaine Bank Area 13
3.2.2 Laurentian Channel
The Laurentian Channel is a deep submarine valley of glacial origin ranging in depth from 180-550 metres that originates on the Atlantic continental shelf off Nova Scotia and ends near the mouth of the Saguenay Fjord. It serves as one of the two pathways for communication between the Gulf of St. Lawrence and the Atlantic Ocean and the only one below 200 m. It is generally accepted that part of the offshore branch of the Labrador Current flows westward around the tail of the Grand Banks, along the continental slope to the Laurentian Channel and the Gulf of St. Lawrence (Colbourne 2002). Some studies report that about 50% of the flow around the Tail of the Grand Bank reaches the Laurentian Channel area (Loder et al. 1997).
The Laurentian Channel has been reported to have a vertically structured circulation system (Koutitonsky and Bugden 1991). This leads to saltier, relatively warmer water moving from the Atlantic Ocean into the Gulf of St. Lawrence occupying the deeper layers of the channel, while fresh and colder water resulting from river runoff and ice melting processes lies near the surface and moves generally seaward. According to this scheme, a warm layer forms near the surface, leaving a cool intermediate layer below.
However, Han et al. (1999), using a three-dimensional diagnostic model (forced by baroclinic pressure gradients, seasonal wind stresses and additional barotropic inflows across the Strait of Belle Isle and southern Newfoundland shelf upstream boundaries) to compute circulation fields from high-density seasonal temperature and salinity fields, obtained a rather horizontally structured flow, with an inflow of water from the Atlantic ocean close to the Newfoundland shelf that may reach speed values over 20 cm/sec, while the west half of the strait is generally occupied by outward flows with higher speeds (40 cm/sec) near the surface.
The analysis of current meter data (BIO 2003) covering a one-year period between 1996 and 1997 at four depths ranging from 50 to 680 m, shows that at 50 m, mean monthly current speeds in the area ranged from 0.073 m/s (April) to 0.334 m/s (June). At 150 m, average monthly current speeds in this area ranged from 0.038 m/s (May) to 0.192 m/s (November), while at 680 m, mean currents ranged from 0.003 m/s (June) to 0.041 (May). Maximum current speeds at 50 m at that location ranged from 0.307 m/s (May) to 0.822 m/s (December).
The tidal influence in this area is also important, and locally reverses the direction of the flows (Dinsmore 1972).
3.2.3 Sable Island Bank
Sable Island Bank, located to the southwest of the study area, is one of a series of large, shallow banks that make up the outer Scotian Shelf. The bank is influenced by cool, coastal water and warm, saltier slope water, as well as tides and offshore currents. Tidal currents produce a general clockwise circulation pattern around the edge of the bank.

14 Strategic Environmental Assessment for the Misaine Bank Area
Sand and gravel make up the surficial geology of the bank, with sand predominating (Amos and Nadeau 1988).
3.2.4 Banquereau Bank
Similar to Sable Island Bank, Banquereau Bank is a large shallow bank situated on the outer Scotian Shelf. It also has a clockwise water circulation pattern around the outer edge of the bank. The surficial geology is comprised of sand and gravel with smaller amounts of gravel present (Amos and Nadeau 1988). Organic matter and very fine suspended sediments are thought to move off the bank into canyons, driven by bottom currents. The Southwest Peak of Banquereau Bank has a particularly high level of tidal mixing and is highly productive (Rutherford and Breeze 2002). The northern edges of the bank have many steep sided hanging valleys formed by glacier meltwater running over their edges.
3.2.5 Scotian Shelf Break
Circulation along the Scotian Shelf break is dominated by a southwesterly flow that originates from Greenland and the Labrador Sea (Pickart and Smethie 1993). On occasion, the area is also affected by the Gulf Stream and its associated rings and eddies. The Gulf Stream flows eastward and is located generally south of 40° N, but shifts seasonally. Warm-core eddies are spun off from the Gulf Stream into the cooler Scotian Shelf water, and conversely cold-core eddies form south of the Gulf Stream. A preliminary analysis of the nearby mooring deployed by Bedford Institute of Oceanography (BIO) between June 2000 through November 2000 reveals that observed currents at approximately the 65 m depth averaged less than 20 cm/s. Currents were less than 46 cm/s 99 percent of the time, and peaked at 59 cm/s. Surface currents would be somewhat higher.
3.2.6 Scotian Slope
The Scotian Slope encompasses a large offshore area extending from the outer boundary of the Scotian Shelf (at a depth of approximately 200 metres) to the political and resource management boundaries at depths of between 4000 and 5000 metres. Scientific knowledge for most areas of the Scotian Slope is lacking in many respects. With the exception of the Gully area, no comprehensive studies have been conducted to date. Due to a lack of systematic surveys of seabirds, sea turtles and marine mammals, there is a knowledge gap with respect to information on abundance and distribution. As well, information regarding primary productivity, zooplankton, and benthic invertebrates is scarce.
The water mass found over most of the slope, called warm slope water, occurs when water from the Gulf Stream mixes with the Labrador Current. Slope water can sometimes be transported into the Gully, particularly during summer and fall. The Gully is known to have complex circulation patterns as well as a high degree of vertical mixing. Circulation

Strategic Environmental Assessment for the Misaine Bank Area 15
patterns in the Gully suggest it may play an important role in two ways: (1) in the localized retention of materials and (2) in the larger scale transport of materials onto and off the shelf (DFO 1998a).
3.3 Oceanography of the Misaine Bank Area
The surface of Misaine Bank is extensively marked by channels and canyons, which resulted from glacial ice-melting processes. On occasion, particular relief features (e.g., channels and canyons) will confine the flow within certain paths depending on the location. However the relative simplicity of the current systems around Sable Island (clockwise current circulation with dominant easterly flow on the north and westerly to northwesterly flow on the south) is not present here.
3.3.1 Ocean Currents
Bottom irregularities present physical barriers to the circulation in the area and at the same time makes the modeling of waste dispersion near the bottom a complex issue, due to the intricate character of the interactions between the flow and the irregular bottom floor. Tidal mixing, a key factor in the estimation of settling rates for drilling wastes, needs to be assessed alongside other characteristics of the predominant flows. Some efforts in this direction have been done for other sectors of the Scotian Shelf (Loder et al. 1992), but particular studies for Misaine Bank will be needed.
There is a substantial lack of information on measured current data in Misaine Bank. For that reason, in order to assess the most probable characteristics of the circulation, Webdrogue, a graphical user interface to a drift trajectory program that calculates drift predictions for any point in the model domain (B.I.O, http://www.mar.dfo-mpo.gc.ca/science/ocean/coastal_hydrodynamics/WebDrogue/webdrogue.html) was used.
The drift trajectories were computed using tides, the seasonal mean circulation, and a surface-wind drift. The technique for computing the wind-driven circulation and for combining all the circulation components is described in Hanna et al. (2000).
Five more or less evenly distributed points were arbitrarily selected on Misaine Bank. For these points, drift trajectories were computed at three depths and for different seasons for a period of thirty days. The results are shown in Figures 3-2 to 3-4. In these figures the starting point of the drift trajectories is marked with a coloured dot. According to the result of the simulations, currents in the eastern sector of Misaine Bank tend to flow to the east and southeast until they reach the shelf break, and then go around the edge of the Scotian Shelf, eventually turning to the southwest. This general pattern is observed for almost all the seasons and depths included in the analysis. The consistent appearance of flows bordering the eastern Scotian Shelf break in a clockwise direction may be related to

16 Strategic Environmental Assessment for the Misaine Bank Area
the presence in the area of the seaward flows reported for the western Laurentian Channel by Han et al. (1999).
The picture in the western sector of Misaine Bank is less certain. The simulations there show currents with southwest directions at 0 and 25 m, while at 100 m currents go to the northeast or form cyclonic or anticyclonic gyres around the starting point.
It is important to note that due to the irregular configuration of the bottom topography in the area, these simulations' results should not be considered definitive, since they are not a good substitute of direct marine current measurements.
Tidal currents in the area may reach almost 20 cm/sec and the major axis of the tidal variability is oriented at a northeast/southwest direction.
According to the data collected at the Marine Environmental Data Service’s Misaine Bank hydrographic station (http://www.meds-sdmm.dfo-mpo.gc.ca), temperature at the surface ranges from slightly below 0°C in February to around 16°C in August (Figures 3-5 and 3-6), which is one of the highest temperature variability ranges anywhere in the Atlantic Ocean (DFO 2003).
This wide temperature variability dramatically diminishes with depth, and near the bottom it is reduced to a range from 1°C in May to 2.5°C in the months of December and January.
Figure 3-7 shows the annual variability of the vertical profiles of temperature and salinity for Misaine Bank according to the BIO’s Climatic Hydrographic Database (http://www.mar.dfo-mpo.gc.ca/science/ocean/database/data_query.html). During the months from June to October, a relatively strong thermocline develops in the upper 50 m of the water column, while from January to April, there is a consistent temperature growth with depth.
The vertical distribution of temperature and salinity in Misaine Bank differs from the picture we encounter on the adjacent Scotian Slope. The communication between Misaine Bank and the Scotian Slope below 50 m is hampered by the threshold that separates Banquereau Bank from the adjacent slope to the south. This is evident in the vertical distributions of temperature and salinity shown in Figure 3-7. Location of the Louisbourg oceanographic monitoring line is shown in Figure 3-8. Thus, the layer of warm water (above 10°C) present at around 100 – 150 m on the Scotian Slope is absent on Misaine Bank.

Strategic Environmental Assessment for the Misaine Bank Area 17
Fall Spring
Summer Winter
Figure 3-2: Modeled Drift Trajectories at the Surface

18 Strategic Environmental Assessment for the Misaine Bank Area
Fall Spring
Summer Winter
Figure 3-3: Modeled Drift Trajectories at 25 m

Strategic Environmental Assessment for the Misaine Bank Area 19
Fall Spring
Summer Winter
Figure 3-4: Modeled Drift Trajectories at 100 m

20 Strategic Environmental Assessment for the Misaine Bank Area
Figure 3-5: Annual Temperature and Salinity Variability for Misaine Bank

Strategic Environmental Assessment for the Misaine Bank Area 21
Figure 3-6: Seasonal Cycle of Temperature and Salinity for Misaine Bank

22 Strategic Environmental Assessment for the Misaine Bank Area
Figure 3-7: Vertical Section of Temperature and Salinity Distributions on the
Louisbourg Line during June 1999 (Misaine Bank lies within the first right hand 100 km of the section).

Strategic Environmental Assessment for the Misaine Bank Area 23
Figure 3-8: Location of the Louisbourg Oceanographic Monitoring Line
3.4 Winds
Wind statistics were generated from the AES40 Wind and Wave hindcast dataset compiled by Oceanweather Inc. The period covered by the dataset is 1954 to 2003. Grid Point 5467 (45.6250N, 59.1667W) was chosen because it is the closest to the centre of the Misaine Bank SEA Area. Following standard meteorological convention, wind direction refers to the direction from which the wind is blowing.
The prevailing wind direction during summer months is south to southwest. In winter the prevailing wind direction is west to northwest. Higher wind speeds are typically from the west or northwest direction and are associated with intense low pressure centres situated over the Gulf of St. Lawrence, western Newfoundland or southeastern Labrador.
Annual tables of wind speed versus direction and the corresponding wind rose diagrams are presented below (Table 3-1 and Figure 3-9). Monthly wind statistics are provided in Appendix A.

24 Strategic Environmental Assessment for the Misaine Bank Area
NE E SE S SW W NW N Total
0 - <5 0.4 0.4 0.5 0.8 1.0 0.9 0.6 0.4 4.9
5 - <10 1.5 1.4 1.8 3.0 4.5 3.6 2.5 1.9 20.2
10 - <15 1.7 1.6 2.2 3.8 6.5 5.0 3.6 2.4 26.8
15 - <20 1.3 1.1 1.5 2.8 5.0 4.3 3.7 2.1 21.9
20 - <25 0.7 0.8 0.9 1.5 2.4 3.4 2.9 1.2 13.8
25 - <30 0.4 0.5 0.6 0.8 0.9 2.1 1.7 0.5 7.4
30 - <35 0.2 0.2 0.3 0.3 0.3 1.1 0.8 0.2 3.4
35 - <40 0.1 0.1 0.1 0.1 0.1 0.4 0.2 0.1 1.2
40 - <45 0.0 0.0 0.0 0.0 0.0 0.1 0.1 0.0 0.3
45 - <50 0.0 0.0 0.0 0.0 0.0 0.0 0.0 0.0 0.1
50 - <55 0.0 0.0 0.0 0.0 0.0 0.0 0.0 0.0 0.0
Total 6.3 6.2 7.9 13.1 20.8 20.8 16.1 8.9 100.0
Annual Percentage Frequency Occurrence of Wind Speed by DirectionSource: AES40 Grid Point 5467 (45.6250N, 59.1667W) 1954 - 2003
Win
d Sp
eed
(kno
ts)
Wind Direction (blowing from)
Figure 3-9: Annual Wind Direction vs. Wind Speed
Table 3-1

Strategic Environmental Assessment for the Misaine Bank Area 25
3.5 Waves
Wave statistics were generated from the AES40 Wind and Wave hindcast dataset compiled by Oceanweather Inc. The period covered by the dataset is 1954 to 2003. Grid Point 5467 (45.6250N, 59.1667W) was chosen because it is the closest to the centre of the Misaine Bank Environmental Assessment Area. Following standard oceanographic convention, wave direction refers to the direction to which the waves are traveling.
Most waves originate from the south through northwest (traveling in the north through southeast directions). This is directly related to the prevailing wind directions discussed in the previous section. Higher waves generally originate from the southerly through westerly directions (traveling north through east). High waves from the west can be attributed to the high wind speeds from this direction, while high waves from the south and southwest are the result of the predominant flow in the western North Atlantic combined with long ‘fetch’ or length of the wave generation area in these directions.
An annual table of significant wave height versus primary wave direction (Table 3-2) and the corresponding wave rose diagrams (Figure 3-10) are presented below. Monthly statistics are provided in Appendix A.
Table 3-2
NE E SE S SW W NW N Total
0.0 - <1.0 2.7 1.7 1.1 0.8 0.7 0.8 1.1 2.2 11.0
1.0 - <2.0 12.4 7.9 6.1 4.1 2.7 2.5 3.6 7.5 46.9
2.0 - <3.0 5.0 5.1 4.0 2.3 1.6 1.5 1.7 2.9 24.1
3.0 - <4.0 2.0 2.8 1.7 0.9 0.7 0.7 0.8 1.2 10.8
4.0 - <5.0 0.9 1.1 0.5 0.3 0.3 0.3 0.3 0.6 4.4
5.0 - <6.0 0.4 0.4 0.2 0.1 0.1 0.1 0.2 0.3 1.7
6.0 - <7.0 0.2 0.1 0.0 0.1 0.1 0.1 0.1 0.1 0.7
7.0 - <8.0 0.1 0.1 0.0 0.0 0.0 0.0 0.0 0.0 0.2
8.0 - <9.0 0.0 0.0 0.0 0.0 0.0 0.0 0.0 0.0 0.1
9.0 - <10.0 0.0 0.0 0.0 0.0 0.0 0.0 0.0 0.0 0.0
10.0 - <11.0 0.0 0.0 0.0 0.0 0.0 0.0 0.0 0.0 0.0
11.0 - <12.0 0.0 0.0 0.0 0.0 0.0 0.0 0.0 0.0 0.0
Total 23.5 19.2 13.7 8.5 6.3 6.1 7.8 14.8 100.0
Source: AES40 Grid Point 5467 (45.6250N, 59.1667W) 1954 - 2003
Wave Direction (travelling to)
Annual Percentage Frequency Occurrence of Wave Height by Direction
Sign
ific
ant W
ave
Hei
ght (
met
res)

26 Strategic Environmental Assessment for the Misaine Bank Area
Figure 3-10: Annual Primary Wave Direction vs. Significant Wave Height

Strategic Environmental Assessment for the Misaine Bank Area 27
3.6 Noise
The generic seismic assessment provides a comparison of ambient and seismic noise levels (Davis et al. 1998). The assessment modeled sound propagation over Sable Island Bank in four directions from Sable Island. The modeling showed that noise from typical airgun arrays would diminish to values of 150 to 160 dB within 4.5 to 14.5 km, depending on bottom type, water depth, and sea state.
The ambient noise field off the Scotian Shelf has been the subject of several studies. Ambient open ocean noise at Sea State 4 (wind speed 18-20 knots/hour; significant wave heights 1.8-2.3 m) ranges from 75 to 90 dB between 100 and 1000 Hz. In contrast, information available on underwater noise within the surf zone predicts noise levels would be between 110 – 120 dB in the 100-1000 Hz band at a distance of 200 m from the surf under winds of 25-35 knots (Wilson et al. 1985).
Noise levels at 20 Hz are strongly influenced by vocalizing finback whales when they are in the area. From 50 to 100-200 Hz, noise is dominated by shipping. Above 200 Hz, the noise field is dominated by wind stress on the ocean surface.
Figure 3-11 shows the vertical distribution of the speed of sound in Misaine Bank for March and August, computed from BIO’s Climatic Hydrographic Database. These two months represent the extremes of the hydrographic variability in the area, occurring during late winter and late summer.
According to Figure 3-10, there will be favourable conditions for the propagation of acoustic signals within the entire water column throughout the year. During the cold months, the temperature inversion guarantees the existence of a surface duct, since the lowest speeds of sound will be near the surface. Accordingly, acoustic rays will bounce from the surface and eventually bend back to it due to the prevailing sound speed gradient.
During the warm season, there will be a speed minimum around 75 m. This depth would serve as the axis of an acoustic channel along which sound would propagate long distances.
Due to the relatively shallow depths of the Misaine Bank, the sound signals are likely to be channeled in a waveguide bounded above by the surface and below by the ocean bottom. Therefore, the irregular character of the ocean floor at Misaine Bank (extensively incised by channels and canyons) will interfere with the smooth propagation of the acoustic signals, generating a great deal of reflection and scattering which, along with the horizontal changes in condition of the ocean floor (in Misaine Bank, areas of gravel bottom alternate with areas covered mostly be sand with gravel mixed in) will make the collection and interpretation of acoustic seismic signals a challenging task.

28 Strategic Environmental Assessment for the Misaine Bank Area
1440 1450 1460 1470 1480 1490 1500 1510-250
-200
-150
-100
-50
0
Speed of Sound (m/sec)
Dep
th, (
m)
AVERAGE VERTICAL DISTRIBUTION OF THE SPEED OF SOUND AT MISAINE BANK IN MARCH AND AUGUST
MARCHAUGUST
Figure 3-11: Sound Speed Profiles in Misaine Bank Computed from Mean
Temperature and Salinity
4 BIOLOGICAL ENVIRONMENT Several recent papers focus on the ecosystems of the Scotian Shelf including: O’Boyle (2000), Coffen-Smout et al. (2001), Breeze et al. (2002), Zwanenburg et al. (2002), DFO (2003), and Breeze and Maris Consulting (2004).
4.1 Primary Productivity
Primary productivity in the Misaine Bank area is supported by nutrients carried from the Gulf of St. Lawrence and from deeper waters of the Laurentian Channel. Phytoplankton biomass, reflecting primary productivity, has been increasing on the eastern Scotian Shelf since the 1970s and 1980s (DFO 2005). The SEA area shows seasonal fluctuations in phytoplankton concentrations similar to those found over much of the Scotian Shelf: a large spring bloom dominated by diatoms, and a smaller fall bloom dominated by dinoflagellates.
The Misaine SEA area supports a higher plant biomass than the rest of the Scotian Shelf at certain times of the year. This biomass, however, is not as great as in certain high productivity areas of the shelf such as southwest Nova Scotia, and areas near the coast.

Strategic Environmental Assessment for the Misaine Bank Area 29
Chlorophyll a, an indicator of plant biomass and potential for primary productivity, may be more sustained than in other parts of the shelf (Breeze et al. 2002).
4.2 Zooplankton
Zooplankton communities on the northern Scotian Shelf are dominated by calanoid copepods, in particular Calanus species. Deeper waters of the study area on the shelf, particularly in the basins, support krill, primarily the carnivorous/herbivorous Meganictyphanes norvegica, and the phytoplankton-feeding Thysanoessa spp. Krill are known to be important in the deep channels and basins that border Misaine; in basins around the margin (e.g., St. Anns); and in the Laurentian Channel adjacent to the SEA area (Breeze et al. 2002; Sameoto and Cochrane 1996). Euphausiids migrate vertically to surface waters at night and descend to deep water (> 200 m) in the basins during the day. The abundance of copepods and eupausiids on the Eastern Scotian Shelf has been increasing since the late 1990s (DFO 2005), but euphausiid biomass is lower than for copepods. Higher concentrations of zooplankton have been found in the SEA study area than on the Scotian Shelf as a whole (O’Boyle et al. 1984; Breeze et al. 2002). Zooplankton biomass peaks in May-June and in the autumn, following peaks in phytoplankton biomass (Breeze et al 2002).
Much of the SEA area is deeper than the spring/summer mixed layer where primary production is concentrated. Zooplankton dominate the plankton community in the deeper waters, consuming more of the overall production than in shallower areas. Macrozooplankton tend to be more important in these deeper areas.
4.3 Benthic Communities
In terms of benthic studies, coverage within the Misaine Bank SEA area is poor. The benthic data is largely from photographs of the ocean bottom.
Benthic communities in the SEA area are not likely to be particularly productive for most non-commercial species because of the deep waters and cold temperatures on much of Misaine Bank. Organic matter produced in the water column is used extensively by zooplankton and so few nutrients reach the seabed. Photos of the Misaine Bank seabed (Josenhans et al. 2004) show communities of surface-deposit-feeding polychaetes and amphipods. Deeper silt/clay bottoms likely support burrowing anemones, as well as northern shrimp and snow crab, which occur on clay bottoms in the channels and depressions.
The benthic community is likely to support suspension feeders only on eastern Banquereau Bank, at the far southeast corner of the SEA area. Banquereau supports populations of the suspension-feeding Stimpson’s Surfclam (Mactromeris polynyma) and northern propeller clams (Cyrtodaria siliqua).

30 Strategic Environmental Assessment for the Misaine Bank Area
Along the margin of the study area bordering the Laurentian Channel, glacial till and attendant cobble and boulders could support shelf edge benthic communities of attached fauna, such as anemones and deep sea corals. On the Stone Fence, an area of till 61 km southeast of the study area, deep sea corals occur at depths below 300 metres to approximately 1000 metres (MacIsaac et al. 2001; Jacques Whitford Environment 2003).
The intensive shrimp and snow crab fisheries in the SEA area is associated with an expansion of low temperatures over the Eastern Scotian Shelf in the 1980s and 1990s (Zwanenburg et al. 2002). Temperatures have returned to more average levels, and production in these fisheries may also be returning to those existing earlier. The lower temperatures were also associated with an increase in abundance of several fish species, including capelin, turbot, and sand lance. Low numbers of cod, a major predator, may also have contributed to the increases in population sizes of macroinvertebrates (Zwanenburg 2003).
4.4 Commercial Marine Invertebrates
Northern shrimp (Pandalus borealis), snow crab (Chionoecetes opilio), lobster (Homarus americanus), Jonah crab (Cancer borealius), and rock crab (Cancer irroratus) are commercial invertebrate species occurring within and around the study area.
4.4.1 Snow Crab
Snow crab is a significant component of the Scotian Shelf biomass, including the SEA area. Snow crabs occur at depths between 60 and 300 metres, preferring habitat with soft, mud bottoms, in water ranging from –1°C to 6°C. Smaller crabs favour rockier habitats that can provide more shelter. Snow crabs are a food source for groundfish such as cod, halibut, and American plaice, and are also preyed upon by skate, seals, and other crabs. They feed on fish, shrimp, and other small benthic invertebrates (DFO 2005).
Female snow crabs produce their eggs in the spring. Between 35 000 and 46 000 eggs are normally fertilized and carried under the female’s abdomen for up to two years. Eggs hatch between spring and early summer; larvae are pelagic, feeding on plankton, until autumn or early winter when they settle to the ocean floor. Immature snow crabs moult twice a year until their fifth instar, after which moulting occurs once per year until a final moult. For males, the terminal moult occurs between instars 9 and 14, and for females, between 9 and 11. Sexual maturity can occur by the ninth instar and legal commercial fishery size is normally reached by the twelfth instar (8-9 years). After terminal moult, females can reproduce two to three times over a period of five to six years, depending upon environmental conditions. Current recruitment levels are below average on the Scotian Shelf (DFO 2005).

Strategic Environmental Assessment for the Misaine Bank Area 31
4.4.2 Northern Shrimp
Northern shrimp have a large biomass on the Scotian Shelf and short-term prospects the fishery remain positive. Shrimp prefer waters between 2°C and 6°C, with soft, muddy bottoms, at depths of 10 to 500 metres. Concentrations of shrimp occur in deep offshore holes on the Eastern Scotian Shelf. These include the Louisbourg Hole, which is located in the SEA area, and smaller holes located mostly south of Misaine Bank (DFO 2004a).
During the day, shrimp feed on detritus, polychaete worms, and small crustaceans on the ocean bottom. At night, shrimp rise through the water column to feed on crustaceans such as copepods, amphipods, and euphausiids. They are prey to groundfish such as cod, silver hake, redfish, Atlantic halibut, and other flatfish.
On the Scotian Shelf, northern shrimp first mature as males at the age of two and, after four years, change sex to become females. Total lifespan is approximately five to eight years. Spawning occurs between late summer and early fall. Fertilized eggs are attached to the female’s abdomen during the incubation period that lasts approximately eight months. After this period, eggs hatch and the pelagic larvae spend three to four months feeding near the water’s surface before settling to the bottom. (DFO 2004a).
4.4.3 Other Species
Nova Scotia represents the northern extent of east coast Jonah crab distribution. In Nova Scotia, Jonah crabs occur primarily at depths of 50 – 300 m, in water temperatures of 8°C to 14°C (DFO 2000a). These crabs are fished west of the study area. Although Jonah crabs are not an important commercial species on Misaine, they are most likely present (DFO 2000a).
Rock crabs are more widely distributed and are found from Labrador to South Carolina in shallow waters less than 20 m deep and mainly on sandy bottoms (DFO 2000b). On Misaine Bank, rock crabs are not commonly fished, but are a bycatch species (DFO 2000b).
Lobsters are most common in coastal waters, but they can also be found along the outer edge of the continental shelf from Sable Island to North Carolina. Coastal lobster fisheries exist close to the study area (LFA’s 31A, 30, 27), and lobster may also occur within the Misaine SEA area in low numbers. Lobsters migrate seasonally moving to more shallow water in the summer and deeper in the winter (DFO 2004f).
4.5 Marine Fish
Fish are the most abundant and diverse group of vertebrates in the ocean, with 538 species recorded in the Canadian Atlantic Region alone. The marine fishes likely to be found in Nova Scotia’s coastal waters may be divided into five groups: small fishes of estuaries and tidal inlets, groundfish, pelagic species, mesopelagic species, and exotic

32 Strategic Environmental Assessment for the Misaine Bank Area
warm-water and eastern-arctic species. The shallow-water environments offer more opportunities for specialization and therefore have high species diversity. Further offshore, the species diversity is lower but the biomass is high.
A number of marine fish are commonly associated with the study area. Major commercial species include Atlantic cod (Gadus morhua), Atlantic halibut (Hippoglossus hippoglossus), Greenland halibut (Reinhardtius hippoglossoides), haddock (Melanogrammus, aeglefinus), pollock (Pollachius virens), redfish (Sebastes sp.), flounder (sp.), American plaice (Hippoglossoides platessoides), white hake (Urophycis tenuis), skate (Raja sp.), Atlantic herring (Clupea harengus), and Atlantic mackerel (Scomber scombrus). Sand lance, (Ammodytes americanus), ocean pout (Macrozoarces americanus) and Atlantic sea raven (Hemitripterus americanus) are some of the more common non-commercial species.
4.5.1 Seasonal Distributions
During the winter months most groundfish species are found in deeper warmer waters along bank edges and adjoining basins. These include cod, American plaice, and witch and yellowtail flounder. Some flounder and most skate (Raia sp.) remain on the banks throughout the winter. As surface waters warm in the spring, groundfish move into shallower water on the banks.
In summer, most groundfish species disperse over the tops of the banks. These include Atlantic cod, silver hake, American plaice, wolffish and halibut. Porbeagle (Lamna nasus) and dogfish sharks (Squalus sp.) are found across the Shelf. Squid (Illex illecebrosus) are widely distributed, with some concentrations along the Shelf Edge.
In early autumn, migratory summer residents move offshore and south. Atlantic mackerel move through the area to wintering grounds along the Shelf beginning in October. Tuna and swordfish have left the Shelf by November. Squid move offshore toward the Gulf Stream in October and November. In late autumn, most groundfish species move into deeper waters along the bank edges and the basins. Spiny dogfish migrate out of the area in November and December.
4.5.2 Commercial Groundfish
Atlantic cod are found in cool-temperature to subarctic waters from the inshore to the edge of the continental shelf. They occur from depths of 460 m to the surface in temperatures between 3°C and 8°C, but they are most commonly associated with the bottom. Cod feed on copepods, amphipods, barnacle larva, and other small crustaceans. As juvenile cod grow they continue to eat crustaceans such as euphausiids, mysids, shrimp, small lobsters, spider crabs and hermit crabs. Young adult and older cod eat mainly fish of any species they can catch, including other cod. Cod eggs are buoyant, pelagic, spherical, and are about 1.2 – 1.6 mm in diameter (Scott and Scott 1988; DFO 2003b).

Strategic Environmental Assessment for the Misaine Bank Area 33
Winter skate live on sandy or gravel bottom. They prefer water shallower than 110 m, but they have been caught at depths of up to 370 m. This species is temperature tolerant, and has been found at temperature between –1.2°C and 15°C. Polychaetes and amphipods are their primary food, but they also eat fish, isopods, and decapods. Sand lance, also common on Misaine Bank, can be a major part of their diet. Skate eggs are large; the case is 5.5 to 8.6 cm long by 3.5 to 5.2 cm wide (Scott and Scott 1988; DFO 2002a).
Flatfish are bottom dwelling fish that have both eyes on one side of their head. The American plaice and yellowtail flounder are two comercially important flatfish in the study area. American plaice generally live at depths between 70 and 270 m, but they have been found from as deep as 700 m. They are a coldwater species that prefer temperatures just below 0°C to 1.5oC, but they can tolerate water as warm as 13°C. They eat polychaetes, echinoderms, molluscs, crustaceans, and fish.
Yellowtail flounder are also a cold-water fish. They prefer sand or sand and mud bottoms at depths between 30 and 365 m, but prefer depths less than 90 m. Yellowtail are found in waters between 2°C to 6°C, but prefer water between 3.1 – 4.8o C. Yellowtail flounder feed mainly on polychaete worms and amphipods, but also consume other crustaceans such as shrimp, cumaceans, isopods and other small invertebrates (Scott and Scott 1988; DFO 2002b).
Witch flounder are a long-lived, slow growing species. They live in depths between 50 – 300 m and have been recorded as deep as 1570 m, at preferred temperatures between 2°C and 6°C. They are often found on the Shelf slope and muddy bottom, and prefer deep holes and channels. The spawn on the Shelf between May and October with peak activity in the summer. Witch flounder eat primarily worms and other benthic invertebrates (DFO 2002c).
Atlantic halibut are the largest of the flatfish and they range widely over all of Canada’s East Coast fishing areas. They prefer depths of between 200 and 500 m and temperatures near 5°C, but not below 2.5°C. Young halibut are found in shallower water and as the fish mature they migrate to deeper waters. Until a halibut reaches approximately 30 cm, it feeds almost exclusively on invertebrates, mainly crustaceans and marine annelids. Prey includes both invertebrates and fish when a halibut reaches between 30 and 80 cm length. Large halibut (over 80 cm) eat mainly fish. Halibut spawn from late winter until early spring in deep waters. Halibut eggs are 3.0 mm spheres that are neutrally buoyant but sink as development progresses (Scott and Scott 1988; DFO 2001a).
Redfish comprise three species of the genus Sebastes. Redfish live near and above the bottom and eat crustaceans, copepods, amphipods and euphausiids as young fish. As they increase in size, other fish species become more important in their diet. All three species of redfish are ovoviviparous, meaning they give birth to live young. While a mature cod may release 2 million eggs, a mature redfish will extrude only 30 000 eggs and hatch and release less than 15,000 young.

34 Strategic Environmental Assessment for the Misaine Bank Area
The three species of Sebastes in the study area are the Acadian redfish, golden redfish, and deepwater redfish. They remain on or near the bottom in the day, rising to feed at night. The deepwater redfish (Sebastes mentella) lives in depths from 350 – 700 m, but rises higher in the water column than the other two species. The golden redfish (Sebastes marinus) lives at intermediate depths. Acadian redfish (Sebastes fasciatus) is the shallowest water redfish species, living in water as shallow as a few metres and as deep as 600 m. These redfish prefer a temperature range from 2.8 to 8.3 oC (Scott and Scott 1988; DFO 2002c).
4.5.3 Large Pelagics
Tuna and swordfish, the major large pelagic species, are uncommon within the Misaine SEA area.
Porbeagle Sharks (Lamna nasus) can be considered as a pelagic, epipelagic, or littoral shark. They are most common offshore on continental shelves, but they also move into coastal areas. Porbeagle sharks can grow to over 3 m and live for 30 years. Porbeagle eat mainly small fish, such as herring, gaspereau, and mackerel, but also feed on cod, white and red hake, cusk, haddock, and squid. They prefer cool to cold water and are usually found in water between 6°C and 16°C. Porbeagle sharks are ovoviparous, with young extruded at a length of 60 – 75 cm in late summer (Scott and Scott 1988; DFO 2001b).
4.5.4 Pelagic and Estuarial
Capelin have become relatively common within the Misaine SEA area in recent years. They are a cold deep-water species that inhabit the Atlantic ocean’s offshore banks and coastal areas. They migrate inshore in early June and spawn on beaches. Capelin eat planktonic organisms such as euphasiids (the main staple of their diet), copepods, amphipods and other planktonic invertebrates.
4.6 Eggs, Larvae, & Spawning
Avoidance of important spawning areas at potential spawning times by seismic survey operations has been identified as an important measure to minimize potential ecosystem impacts (Thomson et al. 2001; DFO 2004b).
Spawning areas and times can be identified by two main sources: data from the Scotian Shelf Ichthyoplankton Program (SSIP) and scientific literature based upon specific research. The SSIP was a comprehensive egg and larval survey of the Scotian Shelf conducted from 1978 to 1982.
In this study, two sources of SSIP data were used. First, data for stations falling within or near the Misaine SEA area were extracted from a subset of the SSIP dataset comprising double oblique bongo tows. Various gear types were used in the survey in addition to oblique bongo tows. These included tows with surface neuston nets, and stepped and

Strategic Environmental Assessment for the Misaine Bank Area 35
surface bongo tows. Oblique bongo data was used for the subset because it provided a good overview of the organisms sampled, provided a simpler data structure, and was a more manageable size. The second data set was a series of maps processed by DFO and produced for the Electronic Atlas of Ichthyoplankton on the Scotian Shelf of North America (EAISSNA). These maps (Stewart et al. 2003) cover all gear types by month for all species and species combinations.
4.6.1 Methodology
Seasonal distributions of eggs and larvae are described for two reasons. First, eggs and larvae can be damaged or killed if within about 5 metres of firing airguns (Davis et al. 1998). Second, the distribution of eggs, especially early stage eggs, is a good indication of the timing and location of spawning.
The first step in the analysis was identifying the species and timing associated with eggs found within the Misaine SEA area. SSIP stations falling within or close to the Misaine SEA area (Figure 4-1) were extracted from the oblique bongo database and numbers summarized by species and month (Table 4-1). Numbers of eggs and larvae were adjusted for volume of water strained and reported as numbers per m3.
Figure 4-1: SSIP Stations within the Misaine SEA Area
Additional information on spawning was obtained for these species from the literature and summarized. Finally, the maps of monthly egg distributions for all SSIP gear types for the Scotian Shelf provided in Stewart (2003) were reviewed to determine the relative importance of egg abundance within the Misaine SEA area in relation to the broader

36 Strategic Environmental Assessment for the Misaine Bank Area
Scotian Shelf. For example, peak egg counts could be located in areas outside the Misaine SEA area. This would suggest that spawning is more likely located outside the SEA area, and eggs are simply carried into the area where they were sampled.
4.6.2 Eggs and Larvae from SSIP Oblique Bongo Tows
Average numbers of eggs per sampling period are summarized in Table 4-1 by species and month. Numbers of larvae from the same dataset are provided in Appendix A.
Table 4-1: Average Numbers of Fish Eggs by Month within the Misaine SEA Area (individuals/m3)
Species Jan. Feb. March April May June July Aug. Sept. Oct. Nov. Dec.
Fish unkown 0.000 0.000 0.000 0.000 0.017 0.000 0.000 0.000 0.000 0.000 0.000 0.000
COD 0.001 0.000 0.000 0.000 0.033 0.001 0.000 0.000 0.000 0.000 0.000 0.001
PLAICE 0.000 0.000 0.017 0.000 0.523 0.000 0.000 0.000 0.000 0.000 0.000 0.000
MACKEREL 0.000 0.000 0.000 0.000 0.000 0.001 0.000 0.000 0.000 0.000 0.000 0.000
WITCH 0.000 0.000 0.000 0.000 0.001 0.000 0.000 0.001 0.000 0.000 0.000 0.000
ROCKLING 0.000 0.000 0.000 0.000 0.000 0.001 0.007 0.005 0.001 0.000 0.000 0.000
YELLTAIL 0.000 0.000 0.000 0.000 0.016 0.000 0.000 0.000 0.000 0.000 0.000 0.000
CUNNER 0.000 0.000 0.000 0.000 0.000 0.000 0.000 0.001 0.001 0.000 0.000 0.000
CUSK 0.000 0.000 0.000 0.000 0.000 0.000 0.003 0.000 0.000 0.000 0.000 0.000
HAKRBFWP 0.000 0.000 0.000 0.000 0.001 0.000 0.000 0.006 0.001 0.000 0.000 0.000
COD_HAK 0.000 0.000 0.000 0.000 0.000 0.000 0.000 0.000 0.000 0.000 0.001 0.000
SILVHAKE 0.000 0.000 0.000 0.000 0.002 0.000 0.000 0.004 0.000 0.002 0.000 0.000
CODHADWF 0.000 0.000 0.002 0.000 0.219 0.009 0.003 0.006 0.018 0.000 0.001 0.004
CUSKMACK 0.000 0.000 0.000 0.000 0.002 0.001 0.000 0.000 0.000 0.000 0.000 0.000
CUNYTAIL 0.000 0.000 0.000 0.000 0.124 0.019 0.000 0.008 0.001 0.000 0.000 0.000
POLLOCK 0.000 0.000 0.000 0.000 0.002 0.000 0.000 0.000 0.000 0.000 0.000 0.003
TOTAL 0.001 0.000 0.019 0.000 0.940 0.032 0.013 0.031 0.022 0.002 0.002 0.008
Some eggs can be identified only to a species group at early stages of development. For example, HAKRBFWP refers to hake and flounder eggs, whereas CODHADWF refers to a possible mix of cod, haddock and witch flounder.
This SSIP dataset indicates that May is by far the period of peak egg abundance within the Misaine SEA area (Figure 4-2). During May, eggs of Atlantic cod, American plaice, witch and yellowtail flounder, silver hake, cusk/mackerel, cunner/yellowtail flounder, and pollock are found. Rockling is the only species with eggs found only during months other than May, and the numbers of eggs are comparatively low. Cod, plaice and yellowtail founder are the only species for which relatively high numbers of eggs were reported. The scientific literature was examined to determine if spawning was likely to occur within the Misaine SEA area for these three species.

Strategic Environmental Assessment for the Misaine Bank Area 37
Figure 4-2: Monthly Abundance of eggs within the Misaine SEA Area from an SSIP
Dataset
4.6.3 Literature Reports of Spawning
The eggs of cod, American plaice and yellowtail flounder are all buoyant and found on or near the surface of the ocean early in development (Scott and Scott 1988).
Precise spawning locations for cod have been difficult to identify because a number of groups spawn widely across the Scotian Shelf at different times of the year (Scott and Scott 1988). Recent stock status reports by DFO consider four general populations of cod. These include Western/Sable and Banquereau populations, smaller Middle and Canso Bank populations, and coastal spawning groups (DFO 2003b). Recent research vessel surveys indicate that spawning biomass and cod recruitment remains at historically low levels. Spatial distribution of sample catches conducted within the Misaine SEA area show autumn aggregations towards the inshore, suggesting the Misaine cod may be part of the coastal population.
American plaice spawn on the Scotian Shelf from winter to early summer, with peak spawning activity in the spring. Most spawning occurs within 90 metres water depth and all within 180 metres (Scott and Scott 1988). Spawning is thought to occur across the entire Shelf to the Shelf Edge, with highest egg concentrations on the southeastern Shelf from the Laurentian Channel to Emerald Bank (Breeze et al. 2002).
Yellowtail flounder spawn throughout the year to depths of 90 m. The largest spawning concentrations occur in July on Western Bank and southern Sable Island Bank (Scott and Scott 1988). Spawning is also reported on Banquereau, Sable Island, Western, Brown's, Emerald and Roseway Banks, but not Misaine Bank (Breeze et al. 2002).

38 Strategic Environmental Assessment for the Misaine Bank Area
4.6.4 EAISSNA Maps of SSIP Data
The Maritime populations of Atlantic cod are low in abundance and classified as a species of concern under COSEWIC, as well as are listed under Schedule 3 of SARA. The potential status of the species under SARA increases the importance of minimizing any potential adverse impacts on spawning populations. Thus, EAISSNA maps for all gear types were reviewed, with particular attention to surface tows because early stages of cod eggs are buoyant and tend to be found near or on the surface of the ocean (Scott and Scott 1988).
Figures 4-3 and 4-4 illustrate the Scotian Shelf wide distribution of early stage eggs of cod, haddock and witch flounder from double oblique bongo tows and surface bongo tows. These are considered to probably represent cod eggs because haddock are uncommon in this area and witch flounder eggs were only found in low numbers in the same survey data.
Figure 4-3 supports the extract of SSIP data used to prepare Table 4-1. It also illustrates that major egg concentrations are located at the entrance to Chedabucto Bay and on Banquereau Bank, but not within the Misaine SEA area.
Figure 4-3: Concentrations of Probable Cod Eggs on the Scotian Shelf from SSIP
Double Oblique Bongo Tows

Strategic Environmental Assessment for the Misaine Bank Area 39
Figure 4-4 shows a small possible concentration of eggs in the west of the study area, but this could be drift from either of the other two areas.
Figure 4-4: Concentrations of Probable Cod Eggs on the Scotian Shelf from SSIP
Surface Bongo Tows

40 Strategic Environmental Assessment for the Misaine Bank Area
Similar to cod, yellowtail flounder eggs are concentrated in the Banquereau Bank area, potentially drifting northward into the Misaine SEA area (Figure 4-5).
Figure 4-5: Concentrations of Yellowtail Eggs on the Scotian Shelf from SSIP
Surface Bongo Tows
In contrast to cod and yellowtail, Figure 4-6 illustrates that American plaice eggs are concentrated within the Misaine SEA area and widely distributed.

Strategic Environmental Assessment for the Misaine Bank Area 41
Figure 4-6: Concentrations of American Plaice Eggs on the Scotian Shelf from SSIP
Surface Bongo Tows
Table 4-2 represents a summary of the potential for spawning to occur within the Misaine SEA area, and the occurrence of eggs and larvae, based on review of the literature and SSIP data.
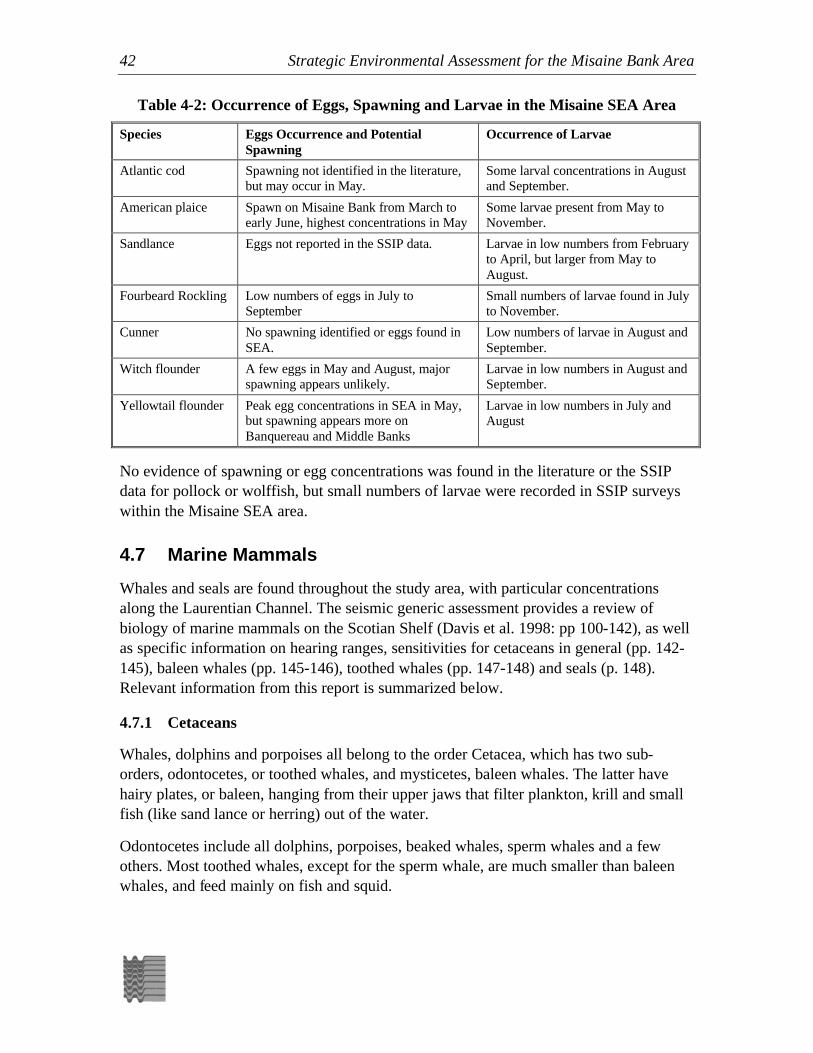
42 Strategic Environmental Assessment for the Misaine Bank Area
Table 4-2: Occurrence of Eggs, Spawning and Larvae in the Misaine SEA Area
Species Eggs Occurrence and Potential Spawning
Occurrence of Larvae
Atlantic cod Spawning not identified in the literature, but may occur in May.
Some larval concentrations in August and September.
American plaice Spawn on Misaine Bank from March to early June, highest concentrations in May
Some larvae present from May to November.
Sandlance Eggs not reported in the SSIP data. Larvae in low numbers from February to April, but larger from May to August.
Fourbeard Rockling Low numbers of eggs in July to September
Small numbers of larvae found in July to November.
Cunner No spawning identified or eggs found in SEA.
Low numbers of larvae in August and September.
Witch flounder A few eggs in May and August, major spawning appears unlikely.
Larvae in low numbers in August and September.
Yellowtail flounder Peak egg concentrations in SEA in May, but spawning appears more on Banquereau and Middle Banks
Larvae in low numbers in July and August
No evidence of spawning or egg concentrations was found in the literature or the SSIP data for pollock or wolffish, but small numbers of larvae were recorded in SSIP surveys within the Misaine SEA area.
4.7 Marine Mammals
Whales and seals are found throughout the study area, with particular concentrations along the Laurentian Channel. The seismic generic assessment provides a review of biology of marine mammals on the Scotian Shelf (Davis et al. 1998: pp 100-142), as well as specific information on hearing ranges, sensitivities for cetaceans in general (pp. 142-145), baleen whales (pp. 145-146), toothed whales (pp. 147-148) and seals (p. 148). Relevant information from this report is summarized below.
4.7.1 Cetaceans
Whales, dolphins and porpoises all belong to the order Cetacea, which has two sub-orders, odontocetes, or toothed whales, and mysticetes, baleen whales. The latter have hairy plates, or baleen, hanging from their upper jaws that filter plankton, krill and small fish (like sand lance or herring) out of the water.
Odontocetes include all dolphins, porpoises, beaked whales, sperm whales and a few others. Most toothed whales, except for the sperm whale, are much smaller than baleen whales, and feed mainly on fish and squid.

Strategic Environmental Assessment for the Misaine Bank Area 43
In general, distributions of cetaceans reflect the abundance and availability of favoured prey. The energy needs of the large whales are enormous; for example, the blue whale, which feeds solely on krill/euphausiids, needs to consume between two and four tonnes a day. Whales must find areas where their prey concentrate, which often tend to be areas of high productivity – upwellings, strong tidal currents, shelf edges, and the like.
The seismic class assessment provides a thorough review of biology of marine mammals on the Scotian Shelf (Davis et al. 1998: pp 100-142), as well as specific information on hearing ranges, sensitivities for cetaceans in general (pp. 142-145), baleen whales (pp. 145-146), and toothed whales (pp. 147-148).
Table 4-3 summarizes the species known to occur on the Scotian Shelf and Slope, with an estimate of how likely they might be to occur in the Misaine SEA area.

44 Strategic Environmental Assessment for the Misaine Bank Area
Table 4-3: Marine Mammal Species that Occur on the Scotian Shelf
Common Name Scientific Name Likelihood of occurrence in study area
ORDER CETACEA (SUBORDER ODONTOCETI - Toothed Whales)
Atlantic long-finned pilot whale Globicephala melaena high
Beluga Whale Delphinapterus leucas low
Blainville's beaked whale Mesoplodon densirostris low
Dwarf sperm whale Kogia simus low
Killer whale Orcinus orca very low
Northern bottlenose whale Hyperoodon ampullatus low
Pygmy sperm whale Kogia breviceps low
Sowerby’s beaked whale Mesoplodon bidens medium
Sperm whale Physeter macrocephalus high
True's beaked whale Mesoplodon mirus low
Atlantic harbour porpoise Phocoena phocoena medium
Atlantic white-sided dolphin Lagenorhynchus acutus high
Bottlenose dolphin Tursiops truncatus low
Common dolphin Delphinus delphis high
Risso's dolphin Grampus griseus low
Striped dolphin Stenella caeruleoalba low
White-beaked dolphin Lagenorhynchus albirostris high
ORDER CETACEA (SUBORDER MYSTECETI - Baleen Whales)
Blue whale Balaenoptera musculus high
Fin whale Balaenoptera physalus high
Humpback whale Megaptera novaeangliae high
Minke whale Balaenoptera acuterostrata high
Right whale Eubalaena glacialis low
Sei whale Balaenoptera borealis medium
ORDER CARNIVORA (FAMILY PHOCIDAE - Seals)
Grey Seal Halichoerus grypus high
Harbour Seal Phoca vitulina medium
Harp Seal Phoca groenlandicus Low
Hooded Seal Cystophora cristata Low
Ringed Seal Phoca hispida Low
The distribution of marine mammals over the Scotian Shelf is poorly documented on both temporal and spatial scales. There are three main databases from which marine mammal distributions are derived:

Strategic Environmental Assessment for the Misaine Bank Area 45
• historical whale harvesting and sighting records from May to November 1966 to 1972 (Sutcliffe and Brodie 1977);
• the University of Rhode Island cetacean assessment program (CETAP 1982); and
• offshore observed records collected during seismic operations (OGOP 2000; 2001).
The Sutcliffe and Brodie (1977) data, together with numerous other databases, were replotted and made available in a series of charts, by month and species (Kenney 1994). Nonetheless, whaling data is limited by poor spatial and temporal coverage. Few records exist for the eastern Scotian Shelf, including the Misaine SEA area, or in the winter.
Researchers at Dalhousie University have conducted numerous cruises on the Scotian Shelf since 1988 and compiled a large database of sightings primarily in and near the Gully (Whitehead et al. 1997). Corresponding deep water regions along the edge of the Laurentian Channel have not been studied to the same extent.
Whale distributions off Nova Scotia are known to change seasonally. Most northern hemisphere baleen whales tend to feed in higher latitudes in summer, and move south for the winter; mating and calving usually take place on the winter grounds.
The Laurentian Channel and the Shelf Edge are migration routes for whales moving in and out of the Gulf of St. Lawrence, an important summer feeding ground for blue whales, fins, humpbacks, and numerous other baleen and toothed species, driven by the Gulf's high plankton productivity.
The location of the Misaine SEA, on the eastern Shelf Edge adjacent to the Laurentian Channel, means that species moving in and out of the Gulf would cross through it, or move alongside it. Whale movements in the Gulf are comparatively well documented, and species occurrence in the Gulf can serve as a proxy for those likely to transit the Misaine area.
Table 4-4 summarizes distribution and prey of cetaceans rated highly likely to occur in the Misaine SEA area.

46 Strategic Environmental Assessment for the Misaine Bank Area
Table 4-4: Summary of the Distribution and Primary Prey of Toothed and Baleen Whales Probably Common in the Misaine Area
Common Name Distribution Food Preferences
Atlantic long-finned pilot Whale
NW Atlantic; large inshore pods from June to November; strandings in Cape Breton
Squid, cod, mackerel, groundfish
Sperm whale Worldwide ; common on the Scotian Shelf and Slope in water from 200 to 1,500 m deep
Squid, fish
Atlantic white-sided dolphin
North Atlantic; in Gulf of St. Lawrence in summer ; common along shelf edge in waters >200m
Sand lance, schooling pelagic fish, squid
Short-beaked common dolphin
Worldwide on edge of banks and continental shelf in water from 100-1,000 m
Mackerel, herring, capelin, squid
White-beaked dolphin North Atlantic, more common in Gulf of St. Lawrence than Scotian Shelf
Squid, cod, capelin
Blue whale
Worldwide; migrates to/from summer feeding grounds in Gulf of St. Lawrence and southern Greenland
Euphausiids
Fin whale Worldwide; winters from ice edge south to Florida; migrates to/from summer feeding grounds in Gulf of St. Lawrence; often seen in Bay of Fundy, offshore Nova Scotia, Chedabucto Bay
Euphausiids, sand lance, mackerel, squid, herring, copepods
Humpback whale Widely distributed over shallow banks and in shelf waters off Nova Scotia, from spring to fall; Bay of Fundy, offshore Cape Breton, Gulf of St. Lawrence
Euphausiids, sand lance, capelin
Minke whale W Atlantic, May northward migration; concentrates in Gulf of St. Lawrence in summer
Sand lance and other small fish, krill
The endangered blue whales are the earliest migrants, appearing along the Shelf Edge in March, when they would be expected to occur in or around the Misaine SEA area. Fewer than 250 mature individuals are known in the North Atlantic, and there are strong indications of a low calving rate and low recruitment to the studied population (COSEWIC 2005).
In general, blue whales are highly nomadic, with low local resident times (Reeves et al. 1998), visiting the Gulf less regularly and for shorter period than fin whales. They range widely among their summer feeding grounds (Sears and Larsen 2002), and are found in spring, summer and fall in the Gulf of St. Lawrence (Figure 4-7), especially off eastern Nova Scotia and along the north shore of the Gulf, from the St. Lawrence River estuary

Strategic Environmental Assessment for the Misaine Bank Area 47
to the Strait of Belle Isle (Waring et al. 2004). In general, they begin to leave in late October and most are gone from the Gulf, and presumably the Misaine SEA area, by December (Jerry Conway, Advisor, Marine Mammals, DFO, 2005, pers. comm.). They have been documented occasionally during the winter in the Gulf, and some are known to feed on plankton concentrations along the edge of pack ice in the Cabot Strait.
Source: Sears (1999)
Figure 4-7: Movement Patterns of Blue Whales off Atlantic Canada
The highly endangered northern right whale, with a total population of only around 300 individuals, has been intensively studied in the western North Atlantic since 1980 (Waring et al. 2004). Their main summer feeding grounds are the Bay of Fundy and the southwestern Scotian Shelf; they prefer water depths of 100 m to 150 m on the continental shelf, near steep bottom slopes (Brown et al. 1995). The right whale's historical summer feeding grounds included the Gulf of St. Lawrence; two different right whales were identified in July of 2000 off Mingan Island by the Mingan Island Cetacean Study team (Jerry Conway, Advisor, Marine Mammals, DFO, 2005, pers. comm.). It is therefore possible that individuals could be found on the eastern Scotian Shelf, but in very low numbers. The likelihood of right whales occurring in the Misaine SEA area appears very low, although the potential does exist.
In summer, humpback, sei, fin, minke, pilot and blue whales are more common on the Shelf itself than are sperm and northern bottlenose whales, which prefer deeper water.

48 Strategic Environmental Assessment for the Misaine Bank Area
The northern bottlenose whale does not appear to frequent the edge of the Laurentian Channel; its distribution concentrates around the Gully, Haldimand and Shortland Canyons.
Migrations out of the study area to the south begin in October and November, with most migrants out of the area by January.
Small toothed whales, dolphins and porpoises may be in the study area year round. However, in general, most species frequent the Shelf and Shelf Edge during summer and early fall, moving to the southwest as winter approaches. This may coincide with seasonal distributions of favoured prey (Kenney 1994).
4.7.2 Seals
Four species of seals are known or expected to occur in the Misaine SEA area, none of which is a species of concern under SARA. Populations of grey, harp, and hooded seals are on the increase, all of which favour offshore waters. The population status of the harbour seal, a primarily inshore species, is less certain. The seismic class assessment provides specific information on hearing ranges and sensitivities for seals (p. 148).
4.8 Marine Turtles
Three Atlantic marine turtle species have been recorded in Nova Scotia waters: Kemp’s Ridley (Lepidochelys kempii), loggerhead (Caretta caretta) and Atlantic leatherback turtles (Dermochelys coriacea).
The leatherback is the largest living turtle. A migratory sea turtle, it breeds in tropical or subtropical waters, and moves to temperate waters at other times of the year in search of food, mainly jellyfish. On the east coast of Canada, leatherbacks are often sighted between June and October, moving south to nest from November to April. Major areas of feeding concentrations are off southwestern Nova Scotia, near Halifax, and in Sydney Bight, with a generally northward movement in June and a southward movement in October (CWS 1999).
4.9 Sea Birds
The seabird fauna of the Scotian Shelf is characterized by a variety of pelagic species widely distributed offshore throughout the year, and by concentrations of seabirds nesting in coastal colonies from late spring through summer. The offshore seabird community is composed primarily of shearwaters and storm-petrels during the summer months, and alcids and fulmars during the winter.
Throughout the year, the greatest concentrations of pelagic species are near the edge of the continental shelf and on the shallow fishing banks (Thomson et al. 2001). Seabirds include summer and winter residents, as well as those migrating to other areas.

Strategic Environmental Assessment for the Misaine Bank Area 49
Seabirds are common on the offshore Scotian Shelf throughout the year. Resident summer and winter pelagic species are abundant and widely distributed, and migrant species transit the area. Inshore, concentrations of seabirds nest at coastal colonies from late spring through summer, and different populations of waterfowl are common throughout the year, some breeding, some wintering. Distributions reflect oceanographic conditions and habitat availability and appear to be driven by underwater currents and food sources (Thomson et al. 2000).
Most common in the offshore Misaine study area are northern fulmars (Fulmarus glacialis), greater and sooty shearwaters (Puffinus gravis and P. griseus), Leach's and Wilson's storm-petrels, (Oceanodroma leucorhoa and Oceanites oceanicus), gulls (Larus spp.), terns (Sterna spp.), alcids (Alle; Uria; Alca; Fratercula; and Cepphus spp.), northern gannets (Sula bassanus) and black-legged kittiwake (Rissa tridactyla). Closer to shore and along the coasts are breeding colonies and winter habitat for a variety of sea ducks and other waterfowl, including common eiders (Somateria mollissima), double-crested and great cormorants (Phalacrocorax auritus, P. carbo), and Canada geese (Branta canadensis) (Breeze et al. 2002; Brown 1986; Lock et al. 1994; Tufts 1986).
A database of PIROP (Program Integré des Recherches sur les Oiseaux Pelagiques) seabird observations off Canada’s East Coast is maintained by the Canadian Wildlife Service. PIROP is the most comprehensive and long-term dataset regarding the offshore distribution of seabirds in the study area and provides an indication of seasonality and abundance of pelagic birds. Data showed that the highest concentrations of pelagic birds are found along the Shelf Edge and in areas of enhanced turbulence, upwelling, and mixing (Breeze et al. 2002).
4.9.1 Seasonal Distributions of Pelagic Birds
Pelagic seabirds use the Misaine Bank SEA area year-round; resident populations are found in summer and winter, as well as those migrating through to other areas. Abundance peaks from April to June; the highest numbers of birds are found along the edge of the Laurentian Channel, but relatively high concentrations are spread through most of the study area. Overall distributions shift to the south-west as the year progresses, with fewer birds in the study area from July to September, though still wide-spread throughout it. Offshore numbers are relatively low, or lacking altogether from October to December, but concentrations are found close inshore and along the western edge of the study area.
In winter, from January to April, high numbers of birds are found over the deeper parts of the bank, and along the edge of the Laurentian Channel. In general, the edge of the Scotian Shelf is wintering or migration habitat for dovekies (Alle alle), phalaropes (Phalaropus spp.), and, in summer, shearwaters. In winter, alcids (mainly dovekies and murres (Uria sp.), fulmars and kittiwakes are the most common species; shearwaters and storm-petrels are most common in summer.

50 Strategic Environmental Assessment for the Misaine Bank Area
Of the main offshore species, greater shearwaters (Puffinus gravis) are most abundant from July to September while sooty shearwaters (Puffinus griseus) are most abundant between April and June. Northern fulmars are present throughout the year, but are most abundant between October and December, and least abundant between January and April.
The lowest numbers of gulls, jaegers (Stercorarius sp.) and skuas (Catharacta skua) are present during the period from April to June. At this time, gulls and kittiwakes are gathered at coastal breeding colonies foraging mainly in close proximity to the colonies. Northern gannets are most abundant during June and July. Terns generally stay within six kilomtres of their colonies and are unlikely to occur within the study area.
Large numbers of Leach’s storm-petrels arrive in Canadian waters in May. They remain abundant until early autumn when they migrate south following the end of the breeding season.
Wilson’s storm-petrels breed in the Southern Hemisphere on Antarctica and adjacent islands. They spend the austral winter in the Northern Hemisphere. Migrating birds begin to appear in large numbers in May and remain abundant until August, when they begin to migrate south. Wilson’s storm-petrel is the more abundant of the two species.
4.9.2 Foraging Patterns and Prey Species
Productive areas containing high concentrations of preferred prey species will likely be highly used by seabirds; for example, seabirds often congregate where plankton is concentrated in areas of tidal- or wind-induced upwellings and fronts where water masses meet (Breeze et al. 2002).
Breeding seasons, colony locations and movements of seabirds are largely dependent on spatial and temporal variations in the abundance of food species. Most birds breed in other areas; however, the study area provides an important feeding source for pelagic birds year-round. In NAFO Division 4VsW, seabird annual food consumption is estimated to be some 60,000 tonnes, about two-thirds of the consumption of grey seals in the same area (O’Boyle 2000).
4.9.3 Coastal Waterfowl and Seabirds
A number of Important Bird Areas (IBAs), provincially protected Wilderness Areas, and Migratory Bird Sanctuaries are located along the southern coast of Cape Breton (Table 5-1 in Section 5-1, Special Places). They contain breeding habitat for seabirds and coastal waterfowl, resting and feeding areas for migratory birds, and winter habitat for northern breeders.
Of particular note along the coast are the great cormorant breeding colonies. Most (around 70%) of North America's great cormorants are found in Nova Scotia, and the colonies adjacent to the study area together contain about 20% of the North American

Strategic Environmental Assessment for the Misaine Bank Area 51
breeding population. At Gabarus, the ranges of the great cormorant and the double-crested cormorant overlap, and the colony on Sugar Loaf Island, off Cape Gabarus, is one of only five rookeries in the province used by both species.
Annual Christmas bird counts provide an overview of species present along the coasts in the late fall and winter. A wide variety of other species have been recorded in smaller numbers, including the endangered harlequin duck (Histrionicus histrionicus). Species commonly found at Louisbourg Historic Site are:
• sea ducks, particularly long-tailed (formerly oldsquaw, Clangula hyemalis), common eider (Somateria mollissima), American black (Anas rubripes), red-breasted merganser (Mergus serrator), white-winged scoter (Melanitta fusca) and common goldeneye (Bucephala clangula);
• herring, great black-backed, and Iceland gulls;
• black guillemot (Cepphus grille);
• purple sandpiper (Calidris maritime);
• and dovekies.
On the east coast, past Scaterie Island, Glace Bay records show a different species distribution. The three gull species, the Canada goose (Branta canadensis, not found in the Louisbourg records), and the American black duck were present in very large numbers, with many more than on the south coast. However, no eiders, guillemot, sandpiper nor scoter were seen, many fewer mergansers, and almost no dovekies. Only the common goldeneye was seen in roughly comparable numbers in both locations.
4.10 Species at Risk
The Species at Risk Act (SARA) established Schedule 1 as the official list of wildlife and plant species at risk. It classifies those species as extirpated, endangered, threatened, or of special concern.
The Committee on the Status of Endangered Wildlife in Canada (COSEWIC) has assigned national status to species at risk in Canada for over 25 years. Under SARA, COSEWIC continues to provide scientific assessments of species status, and submits them to the Minister of the Environment. The federal government, through the Governor in Council, then decides which species are added to the official list after a period of review and public notice. Recovery planning and implementation for listed SARA species, (and others assessed as at risk by COSEWIC), will be developed and implemented through the collaborative National Recovery Program (RENEW, 2004).
When Parliament passed SARA in 2002, Schedule 1 included 233 species, which COSEWIC had already reassessed using new assessment criteria and current data. Schedule 2 included endangered or threatened species, and Schedule 3 species of special

52 Strategic Environmental Assessment for the Misaine Bank Area
concern, that COSEWIC had designated at risk over the years, but had not yet reassessed as of the end of 2001. These species are now undergoing reassessment using revised criteria before they can be considered for addition to Schedule 1. Once done, these reassessments are sent to the Minister of Environment to undergo the listing process (Environment Canada, 2003).
Table 4-5 summarizes those marine species which may occur in the study area and which have COSEWIC/SARA designations in categories other than Not At Risk.

Strategic Environmental Assessment for the Misaine Bank Area 53
Table 4-5: Species with COSEWIC/SARA Designations in the Study Area
Common name Latin name SARA Schedule #
Range/Population Risk category COSEWIC/
SARA Schedule 1
Year Assessed
FISH Atlantic salmon* Salmo salar 1 Atlantic Ocean; Inner
Bay of Fundy Endangered (both) 2001
Northern wolffish Anarhichas denticulatus
1 Atlantic Ocean Threatened (both) 2001
Spotted wolffish Anarhichas minor 1 Atlantic Ocean Threatened (both) 2001 Atlantic wolffish Anarhichas lupus 1 North Atlantic Ocean Special Concern
(both) 2000
Atlantic cod Gadus morhua 3, under consideration
for 1
Maritimes population Special Concern (COSEWIC)
2003
Cusk Brosme brosme under consideration
for 1
Atlantic Ocean Threatened (COSEWIC)
2003
Porbeagle shark Lamna nasus under consideration
for 1
Atlantic Ocean Endangered (COSEWIC)
2004
MAMMALS Blue whale* Balaenoptera
musculus 1 Atlantic and Pacific
Oceans Endangered (both) 2002
Fin whale* Balaenoptera physalus
3 Atlantic and Pacific Oceans
Special Concern (COSEWIC)
1987
Harbour porpoise Phocoena phocoena
2 (Threatened)
Northwest Atlantic Ocean
Special Concern (COSEWIC)
2003
Northern bottlenose whale
Hyperoodon ampullatus
3; under consideration
for 1
Scotian Shelf population
Endangered (COSEWIC); Special
Concern (SARA)
2002
North Atlantic right whale *
Eubalaena glacialis
1 Atlantic and Pacific Oceans
Endangered (both) 2003
Sowerby’s beaked whale
Mesoplodon bidens
3 Atlantic Ocean Special Concern (COSEWIC)
1989
TURTLES Leatherback sea turtle* Dermochelys
coriacea 1 Atlantic and Pacific
Oceans Endangered (both) 2001
BIRDS Barrows goldeneye Bucephala
silandica 1 Eastern population Special Concern
(both) 2000
Harlequin duck Histrionicus histrionicus
1 Eastern population Special Concern (both)
2001
Ivory gull Pagophila eburnea 1 Northern population Special Concern (both)
2001
Roseate tern* Sterna dougallis 1 Atlantic, Indian and Pacific Oceans
Endangered (both) 1999
Source: COSEWIC 2004; SARA 2005; US FWS 2005. * = also listed as endangered by the United States

54 Strategic Environmental Assessment for the Misaine Bank Area
5 HUMAN ACTIVITY
5.1 Special Areas
Special areas of concern to this SEA would include features such as fishing closures, whale conservation areas, areas of corals, other marine protected areas or munitions dumps. No specific management or closed areas exist within the Misaine SEA area. However, deep sea corals may be found in the area and a potential management plan for their protection is described. Sensitive coastal areas along the eastern shore of Cape Breton are also described because of their proximity to the SEA area. It should also be noted that MARLANT (Department of National Defense) conducts approximately 105 exercises in the western part of the SEA area annually.
5.1.1 Coral Areas
Cold water corals are the focus of increasing conservation attention as some species are particularly sensitive to human activities, and they appear to be important biodiversity hotspots (Freiwald et al. 2004). The Misaine SEA area is included in the draft Coral Conservation Plan (Maritimes Region, 2005 – 2010). The plan is a component of the Eastern Scotian Shelf Integrated Management Plan, but includes all waters off the Atlantic coasts of Nova Scotia and New Brunswick, an area larger than the ESSIM planning area. The plan focuses on those coral species found at depths below 150 m, in areas with particular environmental characteristics; it was released for comment in February 2005, and a revision is expected in June (DFO 2005b).
The plan sets out a number of objectives for conservation, management and research; of these, the following are particularly relevant to the Misaine SEA:
• conserve the health and integrity of coral communities, including minimizing the impacts from human activities;
• implement a flexible and adaptive approach to management and decision-making;
• balance coral conservation with human use;
• support and promote scientific research on corals, including understanding and assessing the impacts of human activities on corals, distribution of corals, and evaluating current and proposed management measures to conserve corals; and
• foster information-sharing and collaboration on coral research.
Deep water coral reefs may provide habitat, feeding grounds, recruitment and nursery functions for a range of deep-water organisms, including commercial species of crustaceans and fish. However, the full ecological importance of corals is still unknown. Areas where coral ecosystems occur share several common characteristics:

Strategic Environmental Assessment for the Misaine Bank Area 55
• the seasonal storm wave base does not disturb the seabed;
• strong currents prevent sediment deposition and create hard substrate;
• water flows funnel through narrow passages like submerged canyons, straits, channels, or fjord troughs, and
• nearby nutrient-rich waters trigger high phyto and zooplankton levels, providing plentiful food (Freiwald et al. 2004).
Two major coral groups, totaling some 25 to 30 species are known or thought to occur in the Atlantic waters off Nova Scotia. Hard (or stony) corals, Scleractinia, occur both as colonial species that build large reefs, and as solitary forms. Most stony coral species off Nova Scotia are solitary, non-reef building species such as the cup coral, Flabellum alabastrum. One important reef-building species, Lophelia pertusa, has been identified (DFO 2005c). It is the most common habitat-forming, reef-building cold water coral, growing in bush-like colonies that merge into very large reef structures; it has been recorded at depths from 39 m to 3,383 metres.
A large Lophelia pertusa reef was confirmed by ROV surveys in the Stone Fence area on the edge of Banquereau Bank (see Figure 5-1), at the mouth of the Laurentian Channel, in 2003 (Freiwald et al. 2004). It is the only known location with living Lophelia p. in Atlantic Canadian waters. The reef and the area surrounding it are heavily damaged from fishing gear and recovery may take decades. The Lophelia Coral Conservation Area was established in 2004 to protect a small area, centred on the reef with a one nautical mile buffer zone around it, containing both living and damaged areas of the reef complex. It is closed to all fishing activities, which primarily affects otter trawling for redfish and longlining for halibut. The area does not include all sites in the Stone Fence and Laurentian Channel with corals (DFO 2005c).
The large, diverse group of octocorals (Octocorallia) is distantly related to the stony corals and includes soft corals, sea fans, sea whips and sea pens. They have been recorded at depths as shallow as eight meters, although most are found in deeper waters on the Scotian Slope, in the channels between the fishing banks, or in canyons. The soft corals anchor to hard substrate and form large, long-living colonies; many, like the gorgonian octocorals, grow in a tree-like shape that can extend several metres above the sea floor. 'Gardens' or 'forests' comprised of these trees are found in a number of sites off Nova Scotia, often in association with Lophelia p., including the Stone Fence (DFO 2005c).
Cup corals (Flabellum spp.) have been collected and observed on many parts of the Scotian Slope. They are also found on soft sediments in basins of the Scotian Shelf and Gulf of Maine, often with sea pens (Pennatulids) and small gorgonian corals that are able to anchor in soft muds (Freiwald et al. 2004).

56 Strategic Environmental Assessment for the Misaine Bank Area
In and near the study area, the holes of Misaine Bank and the edge of the Laurentian Channel (particularly along St. Ann's Bank and Artimon Bank) have been identified as areas of deep sea coral distribution based on fishermen's local ecological knowledge (Gass 2004). Two trawl records of Acanthogorgia armata are from the edge of the Misaine goles on the eastern Scotian Shelf, found at a depth of 164 m; others have been found at up to 1400 m. These Misaine records represent slightly shallower than normal occurrences (Gass 2004).
However, the areas near Misaine Bank have not yet been visually surveyed by scientists. They have been listed among the priority research areas in the Draft Coral Conservation Plan (Freiwald et al. 2004).
5.1.2 Sensitive Coastal Areas
Table 5-1 reviews special places along the coast of southern Cape Breton, including provincial and national parks, Important Bird Areas (IBA), federal Migratory Bird Sanctuaries, and provincially designated Wilderness Protected Areas. Figure 5-1 shows the location of sensitive coastal features, including the Fortress of Louisburg National Historic Site.
Figure 5-1: Location of Sensitive Coastal Features and the Stone Fence Coral
Protection Area

Strategic Environmental Assessment for the Misaine Bank Area 57
Table 5-1: Designated Special Areas along South Coast of Cape Breton Island
Location Designation Species of Interest
Basque Islands and Michaud Point
IBA NS045, Point Michaud Provincial Park.
Great Cormorant breeding colony on Basque Island with about 4% of the N. Amer. population. Common Eider breeding colony; staging area for Canada geese and other waterfowl; park has 3 km sand beach, dunes.
Fourchu Head Rocks IBA NS047 Great Cormorant breeding colony with at least 2% of the N. Amer. population.
Gabarus Harbour Rock IBA NS049; Gabarus Wilderness Area, including Green Island
Great and Double-crested Cormorant breeding areas; concentrations of immature eiders in fall and winter. Green Island most southerly nesting colony of Black-Legged Kittiwakes; migratory shorebird staging area; Great Cormorant breeding Colony with at least 2% of N. Amer. population.
Glace Bay Big Glace Bay Lake IBA NS007, Migratory Bird Sanctuary;
Northern Head and South Head, Glace Bay IBA NS053; near Marconi National Historic Site of Canada at Table Head
Lake is major Canada Geese migratory staging area, smaller numbers of other migrants and waterfowl;
Heads have Great Cormorant breeding colonies with about 7% of estimated North American population. Some Harlequin ducks in winter in the Bay.
Isle Madame Pondville Beach Provincial Park; Lennox Passage Provincial Park
PB: 1 km sand beach, dunes, salt marsh, lagoon; LP: beach
Louisbourg area Harbour Rocks IBA NS049; Portnova Islands/Chameau Rock IBA NS006;
Fortress of Louisbourg National Historic Site of Canada
Great Cormorant breeding colonies with at least 5% of the N. Amer. population; some Harlequin ducks in winter; major national historic site.
Scatarie Island/Main-a-Dieu IBA NS052, Scaterie Island Wilderness Area
Leach's Storm-Petrel breeding area; large numbers of migrating Whimbrels feed inland
St. Peters Battery Provincial Park;
St. Peters Canal National Historic Site of Canada; St. Peters National Historic Site of Canada
Provincial park has beach and historic sites.

58 Strategic Environmental Assessment for the Misaine Bank Area
5.2 Ship Traffic
Figure 5-2 shows the marine vessel traffic across the East Coast of Canada, measured in trips per year in each grid square (CEF 2004). Data sources were the ECAREG/NORDREG database, reporting points from ships traveling through Atlantic Canada and stopping at Canadian ports; and Lloyds of London ship movement data, which encompasses other ships moving through waters off the Canadian coast, primarily between the USA and Europe. Darker shades correspond to greater concentrations. These data indicate the Misaine SEA area has a moderate intensity of ship traffic compared to other parts of the Scotian Shelf.
Figure 5-2: Estimated Merchant, Cruise and Fishing Vessel Traffic Density circa
2001
5.3 Fishing Activity
5.3.1 Abundance and Management
Fisheries are managed by a complex set of regulations within management areas, which vary by species or species group. Most finfish and shellfish important in the Misaine SEA area are managed within the divisions and unit areas illustrated in Figure 5-3. Most of the Misaine SEA area falls within Unit Area 4VSb and Crab Fishing Area 23.

Strategic Environmental Assessment for the Misaine Bank Area 59
Figure 5-3: Fisheries Management Areas for Finfish, Snow Crab and Lobster
5.3.1.1 Shrimp and Crab
The northern shrimp stocks on the Misaine Bank (SFA 14) are at high levels, but the fishery is not necessarily located in areas of highest biomass because of the natural segregation of desired age classes. The overall indicators for this stock are good; with spawning biomass, total biomass, and recruitment all being high (DFO 2004a).
The snow crab TAC was reduced in 2004 from 2003 but the immediate prospects for recruitment remain poor. Spawning and total biomass are both declining. Lowered harvesting levels have been recommended again for 2005 (DFO 2005a).
Jonah crabs are taken as bycatch within the Misaine SEA area, but their stock status is uncertain (DFO 2000a).
5.3.1.2 Groundfish
The Atlantic cod fishery has been in moratorium since 1993. On Misaine Bank (4VsW), Atlantic cod are a bycatch only species. The spawning biomass remains the lowest on record, with no indications that the recovery of the fishery is occurring or imminent (DFO 2003b).
American plaice and yellowtail flounder (4VW) are managed as one stock complex. These flatfish stocks are at low levels within the Misaine SEA area. Landings for 2001 were one-quarter of the TAC. Spawning biomass, recruitment and distribution of the

60 Strategic Environmental Assessment for the Misaine Bank Area
stock are also at low levels, although indications for recruitment are improving (DFO 2002b).
The stock structure of Monkfish (4VWX) is presently not well understood. Monkfish have been fished as bycatch since 1995. Recruitment is improving, but spawning biomass is below average and total biomass is low (DFO 2002d).
Atlantic halibut (4VWX3NOP) is one of the most widely distributed fish on the Scotian Shelf. Overall indications for this stock are good. Although the spawning biomass is not known, recruitment and total biomass are improving steadily (DFO 2001a).
An evaluation of pollock stocks (4VWX) has shown that the stock structure is divided into two parts: a fast growing western component, and a slower growing eastern component that includes the study area. Overall the indicator for the eastern stock is low, however, total biomass and recruitment are increasing (DFO 2004c).
Only half of the TAC for redfish was taken in 2001. Nonetheless, overall stock indications are stable (DFO 2002c).
The stock structure of witch flounder is not known but it is managed as a single stock on the Scotian Shelf (4VWX). Landings from all areas have declined in recent years, but overall indicators are intermediate. The spawning biomass is at intermediate levels, but recruitment is good (DFO 2002c).
Winter skate abundance is near historic lows, with biomass, spawning biomass, and recruitment all low. Low fecundity, late maturity, and slow growth makes this species susceptible to overexploitation (DFO 2002a).
5.3.1.3 Pelagic and Estuarial
Colder than normal bottom temperatures led to what appears to be a sustained capelin population on the Scotian Shelf. There is not a directed fishery for capelin on the Shelf, but experimental licences have been granted in the past (1995 - 1996). Overall indications are that the stock is increasing (DFO 1998b).
The herring stocks (4VWX) consist of a number of different spawning populations. Overall indications are that the stock is increasing (DFO 2004d).
5.3.1.4 Summary of Stock Status
Table 5-2 provides an overview of the status of the commercially important species in the study area from the latest DFO stock status reports available.

Strategic Environmental Assessment for the Misaine Bank Area 61
Table 5-2: Stock Status of Species on Eastern Scotian Shelf
Species Landings (‘000t) (year)
TAC (‘000t) (year)
Overall Indicator
Spawning Biomass
Recruitment Distribution
Capelin (4VW)
.01 (1996)
Bycatch Increasing Uncertain, Likely
increasing
Increasing Increasing
Cod (4VsW)
.08 (2002)
Bycatch Collapsed Lowest Recorded
< Average < Average
Cusk (4VWX)
1.14 (2001)
Bycatch
Low Low No sign No Major Change
Flatfish* (4VW)
.70 (2001)
3.0 (2001)
Very Low Very Low Low & Improving
Low
Halibut (4VWX3NOPs)
.5
(2001)
1.15
(2001)
Improving Unknown Improving Widely distributed
Herring (Banks)
1.0
(2003)
12.0
(2003)
Declining Decreasing Slightly
Steady Widely distributed
Monkfish (4VWX5Zc)
1.0
(2001)
Bycatch
(2001)
< Average < Average Improving Average
Pollock (4VWX5Zc)
6.54 (2004)
10.0 (2004)
West, average
East, low
Uncertain, Likely
Increasing
Increasing Widely Distributed
Porbeagle Shark .9 (2000)
.85 (2000)
Seriously Depleted
Low Low Widely distributed
Redfish (4Wdehkl1X)
4.7 (2001)
9.00 (2001)
Apparently stable
Uncertain/ Apparently
Stable
Moderate Widely Distributed
Winter Skate .15 (2002)
.2 (2002)
Low Low Low Near Historical
Low
Witch Flounder (4VWX)
.61 (2001)
No Specific Quota
Intermediate Intermediate Strong Average
Wolfish (4VWX5YZc)
.112 (2001)
Bycatch Low Very Low > Average < Average
Northern Shrimp (SFA 13-15)
3.5 (2004)
3.5 (2004)
Good High High Widely distributed
Snow Crab (Eastern NS)
10.6 (2003)
10.6 (2003)
Decreasing Decreasing Low Widely Distributed
Source: DFO Stock Status Reports (DFO 2005a; 2004c; 2004d; 2002a; 2002b; 2002c; 2002d; 2001a; 1998c;

62 Strategic Environmental Assessment for the Misaine Bank Area
5.3.2 Pre- and Post-Moratorium Fishing Activity
Table 5-3 shows the average annual pre-Moratorium and post-Moratorium landings for Fisheries Management Divisions 4Vn, 4Vs, and 4W. Major commercial species caught on or near Misaine Bank include snow crab, shrimp, halibut, Greenland halibut, shark, and in some years, Atlantic herring.
The closure of the cod fishery and restrictions on fishing many other groundfish in 1993 led to a drastic reduction of groundfish landings in all three divisions; however, the overall catch reduction is proportionally smaller in 4W. Declines in herring and mackerel landings in 4Vn and 4W also occurred during this period. Total landings for large pelagic species, such as tuna, remained approximately the same pre and post moratorium. Catches of large pelagics were generally restricted to offshore areas of 4Vs, outside of the SEA area, and 4W. Landings of shark, particularly porbeagle and blue, were highest in 4W. Large numbers of skate were landed in 4Vs after the moratorium, accounting for the large increase in landings for this division. Other finfish includes estuarial species such as alewife and shad. Alewife was particularly abundant in inshore areas of Divisions 4Vn and 4W, but not 4Vs.
Shellfish landings increased considerably in all divisions post moratorium. The snow crab catch increased significantly in 4Vs and 4W after the codfish closure. Lobster catches in 4VW and 4Vn decreased but the value of this fishery increased. The lobster fishery is restricted to coastal waters on the eastern Scotian Shelf, and thus no fishery for lobster occurs in 4Vs. Other invertebrate species including squid and sea urchins are caught primarily in 4W. Squid is generally restricted to offshore areas.

Strategic Environmental Assessment for the Misaine Bank Area 63
Table 5-3: Average Annual Pre-Moratorium and Post-Moratorium Landings for Fisheries Management Divisions 4Vn, 4Vs, and 4W
PRE-MORATORIUM (1988-1993) POST-MORATORIUM (1977-2001)
Average annual
landing (thousands mt)
Average landed value/year (millions $)
Average annual landing
(thousands mt)
Average landed value/year (millions $)
Species 4Vn 4Vs 4W 4Vn 4Vs 4W 4Vn 4Vs 4W 4Vn 4Vs 4W Major Groundfish 28.6 37.1 30.4 12.7 19.4 19.2 2.68 3.41 13.3 2.54 3.09 11.6
Lobster 3.02 0 0.96 18.7 0 6.99 1.41 0 0.77 16.5 0 10.0 Snow Crab 0.72 0.03 0.50 1.63 0.07 1.20 1.08 1.79 2.61 4.60 7.99 11.6 Herring 3.96 0.01 12.2 0.51 0 1.61 2.16 0 10.2 0.36 0 1.49 Mackerel 1.85 0.01 1.56 0.57 0 0.54 0.60 0.37 0.27 0.27 0.66 0.14 Large Pelagics
0 0.11 0.50 0.02 0.70 3.47 0 0.10 0.57 0.01 0.74 5.27
Sharks and Skates 0.01 0.03 0.37 0.01 0.02 0.26 0.02 0.58 0.51 0.03 0.36 0.82
Other Finfish 0.11 0 0.11 0.06 0 0.09 0.16 0 0.09 0.09 0.03 0.25
Shellfish 0.16 3.54 3.50 0.21 2.92 3.79 0.66 19.6 4.54 1.06 19.8 7.74 Other Inverts 0 0 0.35 0 0 0.16 0.07 0 1.07 0.17 0 1.64
Other 0.01 0.12 0.05 0 0.05 0.02 0 0 0.43 0 0 0.43 Total 38.5 41.0 50.5 34.5 23.2 37.4 8.85 25.9 28.7 25.6 32.6 42.5 Source: DFO Catch and Effort Statistics
Figure 5-4 is a comparison of pre and post moratorium annual average landed values for major groundfish and shellfish in NAFO fisheries divisions 4Vn, 4Vs, and 4W. Lobster is excluded from this analysis because there is no directed fishery of this species within the SEA area (DFO 2004b). In all three divisions, average annual landed values of groundfish decreased significantly after the cod moratorium and other groundfish restrictions were imposed in 1993, although the commercial groundfishery maintained a proportionally higher level of total fishery value in division 4W.
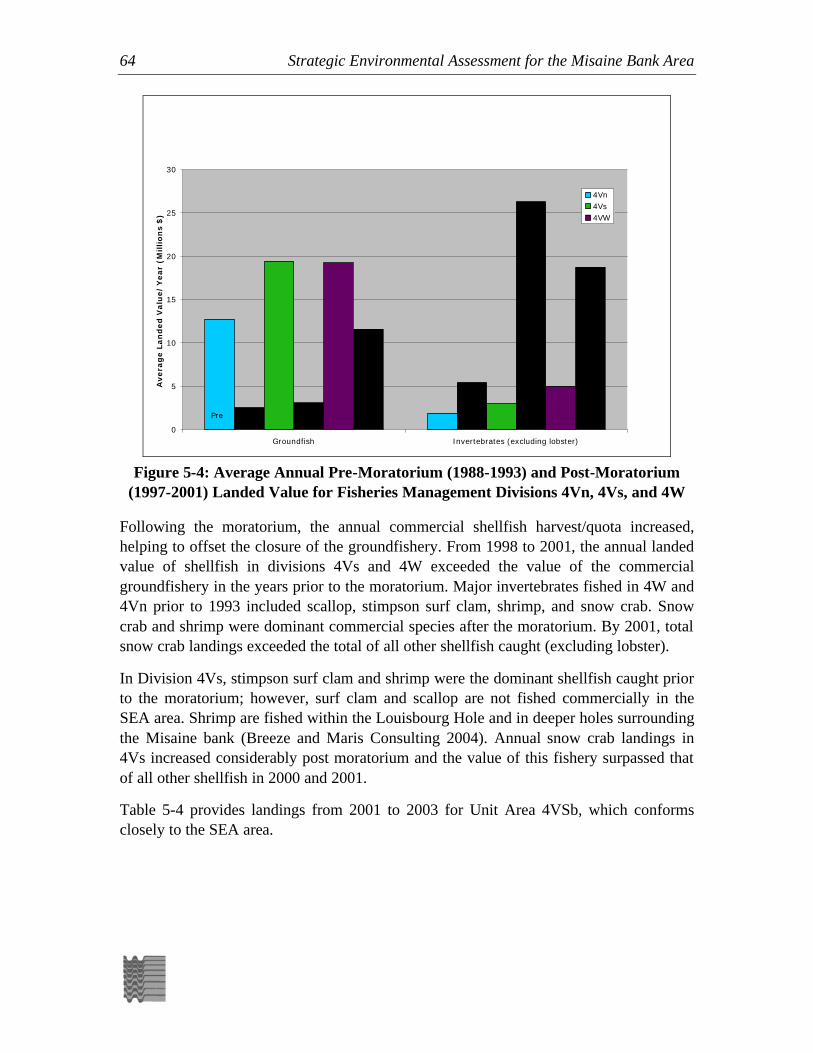
64 Strategic Environmental Assessment for the Misaine Bank Area
0
5
10
15
20
25
30
Groundfish Invertebrates (excluding lobster)
Avera
ge L
an
ded
Valu
e/Y
ear
(Million
s $
)
4Vn4Vs4VW
Pre Post
Figure 5-4: Average Annual Pre-Moratorium (1988-1993) and Post-Moratorium
(1997-2001) Landed Value for Fisheries Management Divisions 4Vn, 4Vs, and 4W
Following the moratorium, the annual commercial shellfish harvest/quota increased, helping to offset the closure of the groundfishery. From 1998 to 2001, the annual landed value of shellfish in divisions 4Vs and 4W exceeded the value of the commercial groundfishery in the years prior to the moratorium. Major invertebrates fished in 4W and 4Vn prior to 1993 included scallop, stimpson surf clam, shrimp, and snow crab. Snow crab and shrimp were dominant commercial species after the moratorium. By 2001, total snow crab landings exceeded the total of all other shellfish caught (excluding lobster).
In Division 4Vs, stimpson surf clam and shrimp were the dominant shellfish caught prior to the moratorium; however, surf clam and scallop are not fished commercially in the SEA area. Shrimp are fished within the Louisbourg Hole and in deeper holes surrounding the Misaine bank (Breeze and Maris Consulting 2004). Annual snow crab landings in 4Vs increased considerably post moratorium and the value of this fishery surpassed that of all other shellfish in 2000 and 2001.
Table 5-4 provides landings from 2001 to 2003 for Unit Area 4VSb, which conforms closely to the SEA area.

Strategic Environmental Assessment for the Misaine Bank Area 65
Table 5-4: Landings (thousands of metric tonnes) for Unit Area 4VSb by Major Species or Species Group, 2001 to 2003
Species or Group 2001 2002 2003
American plaice 11.16 42.94 10.90
Redfish 216.53 138.84 98.95
Atlantic halibut 0.00 0.86 0.08
Skates 9.91 0.00 0.00
Other groundfish 34.65 3.73 1.75
Sharks 0.00 0.21 0.00
Large pelagics 0.25 0.54 0.00
Lobster 0.36 0.00 0.00
Snow crab 1,660.17 1477.28 1,383.22
Shrimp 133.21 8.62 10.82
Other shellfish 1.53 7.31 1.76
Total 2,067.76 1680.33 1,507.48 Source: DFO Catch and Effort Database
Maps of catch locations for the same time period are provided in the following sections for the major fisheries within this area.
5.3.3 Snow Crab and Shrimp
The SEA area is contained within Crab Fishery Area (CFA) 23; an extended season ran from June 1 to October 18 in 2004 (DFO 2005a). Snow crab was the major commercial species caught in 4VSb from 2001 to 2003 (Figure 5-5). Annual catches occurred throughout the SEA area, but were generally concentrated in deeper holes and trenches on the Misaine Bank, particularly on the western portion. Major catches also occurred in areas northwest of Misaine Bank, and along the western edge of the Laurentian Channel. A significant reduction in the snow crab catch occurred in 2003; with most crab caught off the Misaine Bank, primarily northwest and to the south and east towards Banquereau Bank. Further reductions in the crab fishery occurred in 2004 and are recommended for 2005.
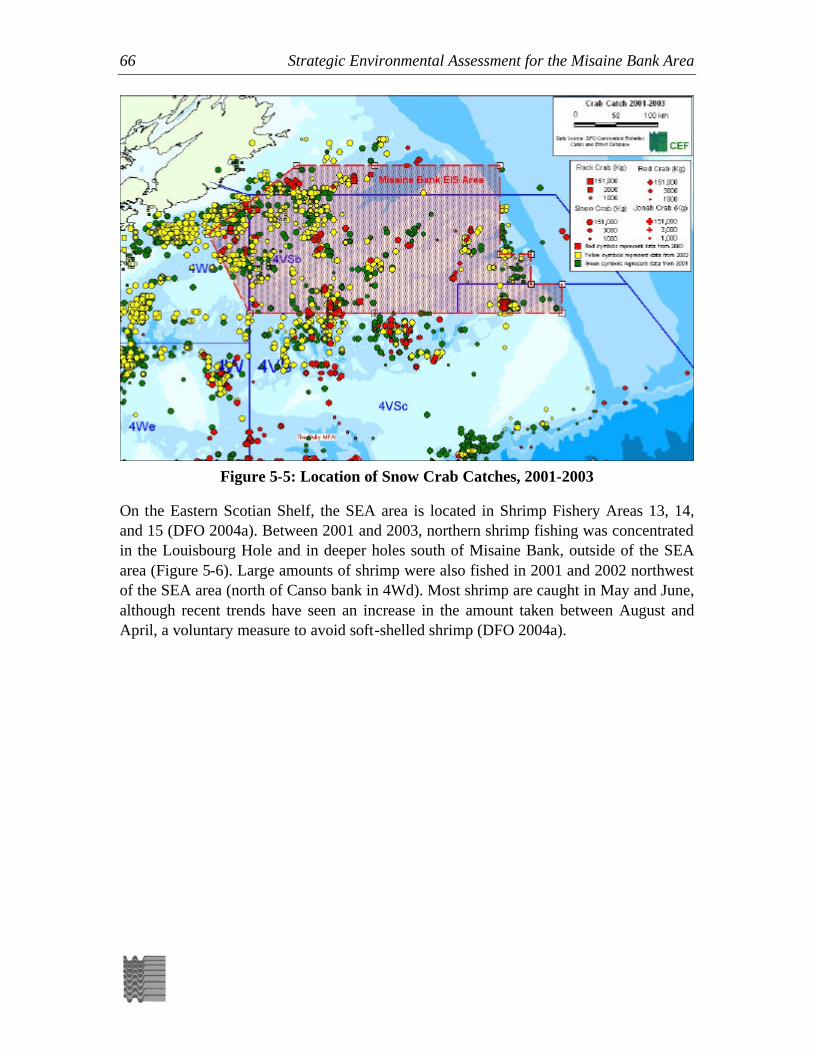
66 Strategic Environmental Assessment for the Misaine Bank Area
Figure 5-5: Location of Snow Crab Catches, 2001-2003
On the Eastern Scotian Shelf, the SEA area is located in Shrimp Fishery Areas 13, 14, and 15 (DFO 2004a). Between 2001 and 2003, northern shrimp fishing was concentrated in the Louisbourg Hole and in deeper holes south of Misaine Bank, outside of the SEA area (Figure 5-6). Large amounts of shrimp were also fished in 2001 and 2002 northwest of the SEA area (north of Canso bank in 4Wd). Most shrimp are caught in May and June, although recent trends have seen an increase in the amount taken between August and April, a voluntary measure to avoid soft-shelled shrimp (DFO 2004a).

Strategic Environmental Assessment for the Misaine Bank Area 67
Figure 5-6: Location of Northern Shrimp Catches, 2001-2003
5.3.4 Groundfish
Figure 5-7 indicates a minor redfish catch occurred within the SEA area between 2001 and 2003 in deeper waters off Misaine Bank to the east and west. The majority of redfish were caught outside the SEA area along the Laurentian channel to the outer shelf.

68 Strategic Environmental Assessment for the Misaine Bank Area
Figure 5-7: Location of Redfish Catches, 2001 to 2003
Other groundfish caught between 2001 and 2003 included cod, American plaice, haddock, and turbot; however, this was not a significant part of the commercial fishery in the SEA area. Most groundfish were caught in 2003, with much fewer numbers landed in the previous two years. Small catches occurred in deeper areas on and south of the Misaine Bank, the Louisbourg Hole, the western edge of the Laurentian Channel, and nearshore regions northwest of 4VSb (Figure 5-8).

Strategic Environmental Assessment for the Misaine Bank Area 69
Figure 5-8: Location of Groundfish Catches, 2001 to 2003
DFO Fisheries catch and effort statistics indicated that there was no significant commercial fishery for halibut within the SEA area between 2001 and 2003. Halibut were fished primarily on the outer shelf near the Laurentian Channel and along the southwestern edge of Banquereau Bank.
5.3.5 Emerging and Experimental Fisheries
Hagfish has been taken for some time by a small inshore fishery with around nine licences in 4VSW, predating the emerging fisheries policy. Annual landings have been as much as 1000 tonnes, with skins for leather and meat primarily marketed to Korea. An experimental offshore hagfish licence has been recently issued and, as of early 2005, the licence holder is planning to survey an area that might overlap slightly with the Misaine SEA area along the eastern and possibly the southern limits. A licence holder is required to make all possible efforts to minimize or avoid any gear conflicts, and they are provided with contact information by DFO with respect to any potential offshore petroleum related activities, such as seismic surveys (Peter Hurley, DFO Science, pers. comm., 2005).
Two offshore exploration licences have been issued for sea cucumber, one for 4W, the other for 4Vs; fishing can occur anywhere in the areas as long as it is at least 80 km from shore. The 4W licence has taken 400 tonnes in the past 18 months; a work plan for the 4Vs licence is in progress. Three inshore (80 kms and less) licences take up to 4000 tonnes annually.

70 Strategic Environmental Assessment for the Misaine Bank Area
Sea cucumber is fished at depths from 9 to 90 m; depths are limited by gear, not species occurrence. The maximum depth at which they can be found is unknown. The species is eaten in Asia and research is proceeding on potential pharmaceutical uses to combat heart disease and arthritis. Should a saleable extract be developed, the fishery is likely to grow dramatically. The potentially likely issues regarding oil and gas activities relate to the establishment of exclusion zones, and potential interactions between gear and pipelines (Mark Lundy, DFO Molluscan Fisheries, pers. comm., 2005).
6 ASSESSMENT METHODS AND CONSULTATION
6.1 Overview
The methodology employed will emphasize the environmental components of greatest concern to potentially affected parties (i.e. resource users), a method widely accepted and popularized by Beanlands and Duinker (1983).
The generic screening reports describing the environmental impacts of seismic exploration and exploratory drilling on the Scotian Shelf (Davis et al. 1998; Thomson et al. 2000) provide the primary basis of this assessment, focusing on Valued Ecosystem Components (VECs) relevant to the study area. VECs may represent “key” or “indicator” species, mixed species groups, communities, and/or ecosystems. They may also reflect issues that are of social, cultural, or economical significance (e.g., commercial fisheries).
The methodology will include an evaluation of the potential cumulative effects with regard to the identified VECs. The omission of a particular issue as a VEC does not relate to its perceived importance in general, but rather to its connection to exploration activities through identifiable pathways.
6.1.1 Regulatory Context
Federal Acts that may apply include, but are not limited to:
• Fisheries Act;
• Oceans Act;
• Navigable Waters Protection Act;
• Canadian Environmental Protection Act;
• Migratory Birds Convention Act;
• Canada Wildlife Act, and
• Species at Risk Act.
Numerous federal guidelines will also apply to potential petroleum exploration activities.

Strategic Environmental Assessment for the Misaine Bank Area 71
The Nova Scotia Environment Act does not apply to offshore oil and gas exploration projects.
6.1.2 Information on Exploration Activities and Impacts
Information on the potential impacts associated with oil and gas exploration include reports prepared by or for the Department of Fisheries and Oceans (Gordon et al. 2000; DFO 2004b and e), Environmental Studies Research Funds (Buchanan et al. 2003), and the Canadian Environmental Assessment Agency (Hurley and Ellis 2004). Two reports funded by the oil and gas industry describe the general environmental effects of seismic surveys (Davis et al. 1998) and exploratory drilling (Thomson et al. 2000) on the Scotian Shelf.
In 1999, a DFO Regional Advisory Process (RAP) was carried out to generate a peer-reviewed summary of the Georges Bank ecosystem and potential impacts from petroleum exploration activities. With respect to exploratory drilling, it was concluded that routine operational exploratory drilling activity is likely to have only localized impacts on the ecosystem components reviewed (Boudreau et al. 1999). It was also concluded that exploration drilling would lead to a temporary loss of access to some portion of the fishing grounds, although the area lost would be relatively small. A low probability of a large release of petroleum product from a well blowout also exists. If such an incidence occurred it could potentially have population and ecosystem level impacts.
A workshop on the environmental effects of offshore hydrocarbon development was held at the Bedford Institute of Oceanography, March 2-3, 2000. The purpose of the workshop was to share information on relevant research, industry sponsored Environmental Effects Monitoring (EEM) programs, review lessons learned to date, and to discuss the way forward. It was recognized that an extensive scientific database on the effects of offshore hydrocarbon development is available from other regions, especially the North Sea and the Gulf of Mexico, and that basic principles can be applied from one region to another (Gordon et al. 2000).
The generic assessment of the effects of exploratory drilling on and adjacent to the Scotian Shelf (Thomson et al. 2000) used a scenario approach based on five sites representing different areas to evaluate impacts.
In 2003, LGL Ltd. and CEF Consultants Ltd. prepared a review of environmental effects monitoring programs on the East Coast for the Environmental Studies Research Funds. The study reviewed information obtained from monitoring programs and interviewed industry, government and stakeholder contacts concerning the potential impacts from exploratory drilling and the effectiveness of monitoring programs (Buchanan et al. 2003).
Hurley and Ellis (2004) continued the review of environmental effects monitoring for exploratory drilling through a data and literature review for the Canadian Environmental Assessment Agency.

72 Strategic Environmental Assessment for the Misaine Bank Area
In 2004, DFO produced two reports on the impacts of seismic surveys. DFO (2004b) summarized the Department's view of scientific information related to the impacts of seismic sound of fish, invertebrates, marine turtles and marine mammals. DFO (2004e) described the results of specific environmental effects monitoring of a seismic survey off western Cape Breton on snow crab.
6.2 Results of Consultation
As an integral component of this SEA, a consultation process was developed to include a variety of organizations and stakeholders. These groups (see Table 6-1) were identified through the CNSOPB Fishery’s Advisory Committee and the DFO’s consultation lists. A broad range of issues and concerns were raised during this process. The main concerns of stakeholders,, including those raised by the crab and shrimp fisheries, conservation groups, and First Nations, are described in more detail below.
Fisheries groups expressed numerous concerns about the potential impacts of oil and gas activities on their industry, most notably the potential effects of seismic surveying on the snow crab fishery. Concerns were raised about the scarcity of scientific knowledge of snow crab biology and migratory patterns in the SEA area. Other issues, such as existing quota allocations, current fishing pressure, and declining stocks, have caused stakeholders to question the overall health of the snow crab fishery. These issues are of particular concern in sensitive sites such as the Louisbourg Hole and other fishing holes in and around Misaine Bank.
The shrimp fishery expressed concerns about opening the Misaine Bank area to oil and gas exploration and development because the largest proportion of shrimp biomass is expected to be in this area (Louisbourg Hole and other holes in and around Misaine Bank) for the next one to three years. Potential conflicts with oil and gas activities during sensitive and important seasons related to both the fishery and biology of the shrimp were raised. Vulnerability of shrimp to seismic activity during their reproductive and soft-shelled stages was questioned.
NGOs, particularly the World Wildlife Fund (WWF) and the Ecology Action Centre (EAC), emphasized the current lack of scientific study in the Misaine Bank. The SEA area, due to its topography, may represent unique habitat and associated biodiversity, such as deep sea corals, which occur in the adjacent Laurentian Channel. A moratorium on development on the Eastern Shelf was recommended by NGOs, in order to fully integrate the SEA into the developing ESSIM initiative and to further explore the potential for designation of a Marine Protected Area in the SEA area.

Strategic Environmental Assessment for the Misaine Bank Area 73
Table 6-1: Stakeholder Consultations for the Misaine SEA
Organization Type of Issues Represented
Area 21 to 24 Snow Crab Fishermen's Associations Fishing activity and sustainability
C.R.A.B. Fishing activity and sustainability
Atlantic Canadian Mobile Shrimp Association Fishing activity and sustainability
Atlantic Herring Co-op Fishing activity and sustainability
Bedford Institute of Oceanography Research Surveys
Canso Fishermen’s Co-operative Fishing activity and sustainability
Clearwater Fine Foods Fishing activity and sustainability
C.R.A.B. Fishing activity and sustainability
Confederacy of Mainland Mi'kmaq Interests of Aboriginal Peoples
Atlantic Canadian Mobile Shrimp Association Fishing activity and sustainability
East Cape Breton Fishermen's Association Fishing activity and sustainability
Eastern NS Mobile Gear Association Fishing activity and sustainability
Eastern Fishermen’s Federation AND Eastern Shore Fishermen’s Protection Association
Fishing activity and sustainability
Ecology Action Centre Environmental protection
Guysborough County Inshore Fishermen’s Association Fishing activity and sustainability
Maritime Fishermen's Union Fishing activity and sustainability
Membertou First Nation Interests of Aboriginal Peoples
Netukulimkewe'l Commission (Native Council of Nova Scotia)
Interests of Aboriginal Peoples
Nova Scotia Sword Fishermen’s Association. Fishing activity and sustainability
Richmond County Inshore Fishermen’s Association Fishing activity and sustainability
Sambro Fisheries Fishing activity and sustainability
Scotia Fundy Mobile Gear Fishermen's Association Fishing activity and sustainability
Seafood Producers Assoc. of NS Fishing activity, processing and sustainability
Sierra Club of Canada Environmental protection
Slope Snow Crab Fishermen Fishing activity and sustainability
Unama'ki Institute of Natural Resources Interests of Aboriginal Peoples
W.T. Grover Fisheries Fishing activity and sustainability
Wagmatcook First Nation Interests of Aboriginal Peoples
Waycobah First Nation Interests of Aboriginal Peoples
World Wildlife Fund Environmental protection
First Nations in the area are represented by the Confederation of Mainland Mi’kmaq and the Union of Nova Scotia Indians, both of whom work cooperatively through the Assembly of Nova Scotia Chiefs. The Confederation has requested to consult directly

74 Strategic Environmental Assessment for the Misaine Bank Area
with the Crown (provincial and federal levels). These consultations are of a legal nature regarding benefits and legal rights and have no particular bearing on the information gathering process of the SEA. To address this issue, a First Nations Traditional Knowledge Study was recommended in addition to engaging in consultation with the Union of Nova Scotia Indians who is not currently represented in the SEA process.
Oil and gas exploration has the potential to interfere with some research activities, notably DFO science surveys that are designed to measure abundance. This SEA looks to the future beyond which these surveys are planned, but project specific EAs can request research survey schedules and locations from DFO to ensure interference does not occur. DFO was contacted as part of the consultation process in relation to research programs and emerging fisheries that may occur but are not currently captured by the catch and effort system.
6.2 Issues Scoping and Selection of Valued Ecosystem Components
6.2.1 Issues Scoping
Issue scoping is an important part of the issue identification process. Scoping included the following:
• stakeholder and regulatory review and comment on the draft scoping document;
• review of regulatory issues and guidelines;
• review of previous environmental assessments for offshore oil and gas exploration, including previous SEAs on the East Coast, and
• research of publications on specific issues of concern.
6.2.2 Boundaries
The administration boundaries for this SEA are described in Section 1.2, Rationale for this SEA.
The spatial boundary for this assessment is the proposed SEA area and the adjacent area within which adverse impacts could be reasonably expected to occur. Definition of the SEA area incorporated a minimum distance to shore of 30 kilometres. The eastern coast of Cape Breton is considered within the scope of this project in relation to possible hydrocarbon spills in association with exploration drilling. From an ecosystem perspective, information is focused within the SEA area but compared to the eastern Scotian Shelf, Sydney Bight, and the Laurentian Channel.
Temporal boundaries for the assessment are limited to the oil and gas exploration phase; insufficient information on the types of hydrocarbon resources and potential development

Strategic Environmental Assessment for the Misaine Bank Area 75
options are available to assess possible development impacts. Opening of the area for exploration will also take time. Review of this SEA, preparation of a possible call for bids, submission of bids and review, could take a number of years. For historic comparison, fisheries data from the early 1990s (pre-moratorium) are included to provide insight into possible future changes in the current fisheries.
6.2.3 Selection of Valued Ecosystem Components
Based on the results of stakeholder consultations, a review of the regulatory issues and guidelines, other environmental assessments for oil and gas exploration projects (e.g., the generic assessments), and the professional judgment of the study team, a list of Valued Ecosystem Components (VECs) were selected for this assessment:
• marine fish and invertebrates;
• commercial fish species (e.g., snow crab and shrimp);
• benthic communities and fish habitat;
• fish and invertebrate eggs and larvae;
• fisheries and fishing activity;
• sea and coastal birds;
• species at risk;
• marine mammals and sea turtles;
• air quality, including greenhouse gas emissions, and
• special areas.
The VEC selection process looks at the range of ecosystem components that could be affected by exploration activities. These include fundamental and widely distributed components such as plankton and birds. During the assessment process current knowledge is assessed and potential pathway linkages determined. The final selection is based on the role of the ecological component in combination with potential pathways. If an impact pathway is not identified, the component is not included as a VEC.
It is recognized that plankton is the basis of the marine ecosystem and that impacts to plankton could have ripple effects throughout the system. However, the proportion of plankton exposed to lethal impacts is so low that is it not conceivable that a significant impact could be foreseen. Thus, plankton is not included as a VEC in this analysis.
Inclusion of water and sediment quality as specific VECs was considered during scoping. Water quality on the Scotian Shelf, including Misaine Bank, is essentially a function of the dynamic physical oceanography and is typically characterized by temperature and salinity profiles. The impact of contaminant discharges or other exploration activities are usually considered in relation to effects on organisms, such as fish, to conform to requirements of the Fisheries Act. In production scenarios, specific concerns, such as the

76 Strategic Environmental Assessment for the Misaine Bank Area
discharge of NORMs (Naturally Occurring Radioative Materials) in produced water, are independent of a target organism. However, these types of discharges are not normally associated with exploration activities.
A similar argument can be made for sediment quality. Impacts of exploration activities, such as the potential discharge of muds and cuttings from drilling, are traditionally evaluated in relation to impacts on benthic communities. Guidelines for sediment quality are relevant where ocean disposal regulations are triggered, as was the case with the Cohasset Decommissioning. Activities associated with exploration, in general, do not trigger these guidelines. Discharge of contaminants related to exploration activities, affecting water or sediment, will be assessed for potential impacts by focusing on final receptors of concern.
6.3 Environmental Effects Assessment Framework
The CEA Act defines valuation criteria for the significance of adverse residual (post-mitigation) environmental effects. These criteria include, among other factors:
• magnitude;
• geographic extent;
• duration and frequency;
• reversibility; and
• ecological context.
Environmental standards, guidelines and objectives are also used to establish significance.
Where existing knowledge indicates that an interaction is not likely to result in an effect, certain issues may not warrant further analysis. Mitigative measures are considered in the analysis, and the residual effect on VECs predicted. In cases where results are likely to result in an effect, the prediction of residual effects follows three steps:
• determining whether the environmental effects are adverse;
• determining whether the adverse environmental effects are significant; and
• determining whether a significant environmental effect is likely to occur.
The effects assessment for each VEC concludes with a summary of the residual environmental effects.
6.3.1 Data Deficiencies
Most information on eggs and larvae dates from the SSIP surveys undertaken in the late 1970s and early 1980s. Since then, changes in relative species abundance and, at least for cod, shifts in spawning activity, have been observed. Fortunately, the Misaine SEA area

Strategic Environmental Assessment for the Misaine Bank Area 77
is not an area where finfish spawning is concentrated compared to other parts of the Scotian Shelf.
The Misaine SEA area is an important area for commercial fishing of snow crab and shrimp. The effects of seismic survey operations on snow crab has been specifically evaluated off Newfoundland and western Cape Breton, but little information exists on the effect of seismic operations on shrimp. Reproduction of both snow crab and shrimp may be important within the SEA area, but little information exists on seasonal migrations of snow crab or mating within the SEA area. The effect of drilling wastes has focused primarily on sea scallop, and the evaluation of impacts in the Misaine Bank SEA area will depend in part on how applicable these studies are to crab and shrimp.
6.4 Environmental Planning and Management
The SEA examines potential environmental impacts at the regional level to determine if oil and gas exploration should opened for exploration licensing, and if specific planning and management steps should be taken to minimize potential impacts. This is also the first SEA to be completed following release of the Draft ESSIM Plan, which provides guidance on integrated ocean management for the area. This SEA will focus on identifying specific ecological or human use issues within the SEA area, which differ from other parts of the Scotian Shelf where oil and gas exploration has been permitted. It will also examine where measures may be implemented at the regional level to minimize impacts of this type of exploration. Additional measures may be identified based on specific sensitivities of the SEA area identified through review of the environmental setting or through advances in our general understanding of potential effects and mitigating measures.
7 EFFECTS ANALYSIS
7.1 ESSIM and Criteria for Ecological Significance
Canada's Ocean Act became law in December of 1996. This Act and its supporting policy, Canada’s Oceans Strategy, affirm DFO’s mandate as the lead federal authority for oceans and provides the national policy context for integrated ocean management. To promote integrated ocean management, a prototype oceans management plan has been developed for the Eastern Scotian Shelf (DFO 2005b). The ESSIM (Eastern Scotian Shelf Integrated Management) Draft Management Plan provides general guidance on assessing ocean impacts related to oil and gas exploration, and thus provides important guidance to this SEA.
The ESSIM Draft Management Plan contains specific reference to oil and gas environmental impact assessment and regulation. Under consideration of Marine

78 Strategic Environmental Assessment for the Misaine Bank Area
Ecosystem Management and Conservation, the plan requires development of an objectives-based framework that applies ecosystem objectives to oil and gas environmental assessments, and exploration and development planning. In addition, DFO and Environment Canada identify ecologically and biologically significant areas. Development and implementation of the regional coral conservation plan is also linked to oil and gas exploration. In relation to the benthic community ecosystem and habitat issues, the EESIM draft plan suggests a conservation plan for protection be developed to deal with oil and gas industry issues (DFO 2005b).
Specific to seismic surveys, the ESSIM plan requires incorporation of national standards and procedures for mitigation of impacts into the regional regulatory process. The plan suggests mitigation should be developed for other marine sound-generating activities, including exploration and production drilling. It also supports continued collaborative research by DFO, NRCan, Environment Canada, and the CNSOPB into effects of sound on fish, invertebrates, marine mammals and turtles. Continued assessment of cumulative impacts is also suggested, along with development of a high-resolution circulation model by DFO to support environmental assessments, monitoring and decision making (DFO 2005b).
7.1.1 Ecological Significance
DFO prepared a discussion paper on ecologically significant areas on the Scotian Shelf and Slope in 2004 (Breeze and Maris Consulting 2004). It relied on a definition of ecological significance from another parallel initiative by Schaefer et al. (in press):
Ecologically significant areas are those which have valued ecological attributes. Valued ecological attributes contribute to the functioning and sustainability of the ecosystem, the maintenance and conservation of genetic, species, population and/or habitat diversity, and/or other similar vital ecological functions. These attributes are present to a higher degree than most/all other areas within the region.
These attributes may be valued for their use by humans (both direct and indirect), such as when they contribute to sustainability of a commercial fishery. Or they may be valued simply for their existence or bequest value, such as when something is valued because it can be passed on to future generations.
Criteria proposed for selection of ecologically significant areas include:
As first-order criteria:
• biological productivity;
• biodiversity (species and genetic diversity):
• reproductive areas;
• migration or bottleneck areas (non-reproductive);

Strategic Environmental Assessment for the Misaine Bank Area 79
• habitat for endangered/threatened species;
• rare/unique habitats and habitat for rare species, and
• naturalness.
And as second-order criteria:
• dependency/survival;
• fragility/sensitivity, and
• significance in terms of scale.
Appropriate indicators were also identified for each of these criteria. Examples of indicators include high surface chlorophyll concentrations as an indicator or biological productivity, or areas that are a refuge from human activity because of difficult access as an indicator of naturalness.
7.1.2 Initial Evaluation of the Misaine SEA Area
Breeze and Maris Consulting (2004) provide an analysis of the ecological sensitivity of the majority of the Misaine SEA area (Table 7-1).
The review carried out by Breeze and Maris Consulting (2004) included an analysis of areas that were little affected by past bottom trawling activity and could thus represent more 'natural' areas. Misaine and Canso Banks, along with the Western Gully, were identified as areas where little trawling traditionally occurred. The review concluded that the shrimp and snow crab were fished in the deeper colder holes, but that red crab, Jonah crab, scallop and surf clam were not fished on Misaine Bank. While the area was ranked as more natural than most other areas, less information was available on the ecology of Misaine and Canso Banks than on other parts of the Scotian Shelf. Potential recovery time after disturbance was raised as an issue, but neither appeared ecologically significant in an initial review of available information.

80 Strategic Environmental Assessment for the Misaine Bank Area
Table 7-1: Ecological Sensitivity of Areas within the Misaine SEA Area
Area Information Availability
Criteria Potential High Value (Yes/No)
Misaine Bank Poor Biological productivity No
Biodiversity No
Reproductive areas No
Bottleneck areas No
Habitat for endangered/threatened species
No
Rare/unique habitats and species No
naturalness No
Shrimp Holes near Misaine and Canso Banks
Poor-Fair Biological productivity Yes
Biodiversity No
Reproductive areas Potentially
Bottleneck areas No
Habitat for endangered/threatened species
No
Rare/unique habitats and species No
naturalness No
Deeper shrimp holes, including the large Lousibourg Hole, are found north and south of Misaine Bank. Breeze and Maris Consulting (2004) found these areas to be important in terms of biological productivity, and potentially as a reproductive area. High organic content of the fine silt bottom sediments are a major factor in the high biological productivity. The area appears to act as a source of larvae for areas of the Shelf to the southwest. In addition to fishing for snow crab and shrimp, the areas fall within MARLANT exercise areas Q2 and Q3. Again, the level of information on the ecology of these holes was less than for most of the Shelf.
In addition to these two areas, the edge of the Laurentian Channel is known to be a major migration route for marine mammals in and out of the Gulf of St. Lawrence, and over-wintering area for many finfish, and in some channels and canyons, an area of deep sea corals. None of the Misaine SEA area, however, is known to be particularly ecologically sensitive.
7.2 Seismic Surveys
Potential impacts from seismic surveys have been described in a generic assessment of seismic survey impacts on the Scotian Shelf (Davis et al. 1998) and a more recent review by DFO (DFO 2004b). Overall, pathways for environmental effects related to seismic surveys on the Scotian Shelf include:

Strategic Environmental Assessment for the Misaine Bank Area 81
• injury from pressure waves;
• disturbance or masking of communication by noise leading to behavioural change; and
• interference with marine vessel traffic, particularly fishing vessels and gear.
Impacts associated with the following issues will be addressed for each VEC:
• effects on special places;
• effects on fish and invertebrates, and fish/invertebrate eggs and larvae;
• effects on marine mammals and turtles, and
• effects on fishing activity.
Some seismic surveys are conducted using oil-filled streamer lines, and ruptures releasing oil into the local marine environment have occurred. Losses of hydrocarbons, principally kerosene, ranged from 0.009 to 0.57 m3 in 14 incidents between 2003 and 2004 (CNSOPB Environment Spill Reporting). Only one incident occurred in 2004. All incidents were classified as minor.
Vertical Seismic Profiles (VSPs), essentially small scale seismic surveys, may be done during exploratory drilling. These profiles use airgun arrays similar to regular seismic surveys, but are generally very localized (one or two lines within a couple of kilometres of the rig) and of short duration (one day). Any effects from VSPs would be covered by the discussion of seismic surveys in general.
7.3 Exploratory Drilling
Potential effects from exploratory drilling include impacts resulting from routine activities, and those occurring from accidental releases of hydrocarbons. Pathways through which routine activities may impact the receiving environment include:
• presence of structures;
• lights and flares;
• disturbance and noise;
• routine discharges; and
• discharges of drilling muds and cuttings.
The pathway for impacts of most concern is the accidental release or uncontrolled discharge of oil, condensate, gas, or gas hydrates into the marine environment. Other small accidental releases of contaminants may also occur.
The vast majority of offshore wells are drilled without incident. However, there is a relatively small probability of an accident occurring that results in the release of hydrocarbons into the environment.

82 Strategic Environmental Assessment for the Misaine Bank Area
Historically, one blowout has occurred for every 180 exploration wells drilled on the United States Outer Continental Shelf (S.L. Ross 2001). The chances are extremely low that spilled oil would be involved, even in small amounts. If a blowout did occur, chances are that it would last only a short time. Thomson et al. (2000) noted that approximately 21% of offshore blowouts are brought under control in less than 1 hour, 58% were controlled in less than 1 day, and 84% in less than one week.
Recent reports of spills reported to the CNSOPB are summarized in Table 7-2.
Table 7-2: Spill Incidents Reported to the CNSOPB, 2002-2004
Year Number of Spills
Classification Description
2004 6 Minor Gas, hydro carbons, Iospar M, oil, Shell tellus 46, diesel
1 Significant Synthetic drilling mud (331 m3)
1 Moderate Diesel fuel (4 m3)
2003 30 Minor Hydraulic oil, MEG, Isopar M, hydraulic fliud, Streamer fluid X, keosene, Synthetic based mud, hydrocarbon, residual fuel, lubrication oil, oil, KCL/methanol/grease, diesel.
1 Significant MEG and Hydrate inhibitor (20 m3)
2002 21 Minor Oil, SBM, WBM spacer, natural gas, hydraulic oil, hydrocarbon, condensate, light oil.
1 Moderate Conduit line fluid (7.29 m3)
Improvements in performance can no doubt be achieved and monitoring and reporting should continue. However, this level of contamination of the marine environment is minor compared to ongoing discharges of oily wastes from shipping passing through the area (CEF 2004). About 300,000 seabirds are killed each winter in the waters of Atlantic Canada by chronic operational discharges of oil at sea (Wiese 2002).
7.4 Potential Effects on VECS
The following sections describe the general effect of seismic surveys, exploratory drilling, and well site surveys on the VECs identified in Section 6.2.3. Each of these impacts will be examined in detail in environmental assessments prepared for a specific project where more site-specific analysis can occur. The following section deals with the particular sensitivities of the Misaine SEA area in comparison to other parts of the Scotian Shelf and Laurentian Channel where oil and gas exploration is already ongoing.
7.4.1 Seismic Surveys
The principle concern associated with seismic surveys is the effect of underwater noise on marine organisms, ranging from the direct mortality of eggs and larvae within five metres of the airguns, to disruption of fish spawning activities and marine mammal

Strategic Environmental Assessment for the Misaine Bank Area 83
migrations. A detailed discussion of these impacts is provided in Thomson et al. (2000). This review has been updated by DFO (2004b). Both sources have been used to prepare the following summary of impacts.
Considerable study of the effect of airgun discharge on eggs and larvae of a wide range of species has been undertaken. Beyond a distance of approximately five metres, no impact is observed (Thomson et al. 2000). The scientific community is in general agreement that the potential for significant impact on eggs and larvae is unlikely unless they happen to be very concentrated within the lethal range of the airguns, which is highly unlikely (Thomson et al. 2001; DFO 2004b).
For finfish, no direct mortality has been observed from seismic survey operations, but changes in behaviour have been well documented in various studies. Effects include a startle response, change in swimming behaviour, and a change in vertical distribution with fish frequently moving close to the bottom (DFO 2004b). These changes are usually short term, lasting over a matter of days, and may extend about 30 kilometres from the sound source (Jacques Whitford Environment 2003). Sublethal effects have been observed with exposure at relatively short range (less than one kilometre), but these effects are not directly life threatening and recovery may occur (McCauley et al. 2003). Potential effects on spawning, either through disruption of behaviour or masking of communication, are considered the highest potential risk for impact leading to reduced abundance (DFO 2004b).
In relation to shellfish, available evidence suggests that macroinvertebrates are less vulnerable to these types of injury because few invertebrates have internal air spaces, such as air bladders in many fish (Jacques Whitford Environment 2003). The balance structures in invertebrates, such as the statolith in snow crab, are also simpler than ears in fish, and thus may be less vulnerable to injury. Behavioural effects, similar to those on fish, may also occur (DFO 2004b). A more detailed discussion of this work is provided in Section 7.5.4.
Effects on sea turtles and marine mammals generally relate to behavioural effects, such as disruption of feeding or migrations (DFO 2004b). Sublethal effects, specifically injury to ears, are more likely to happen with the slower swimming sea turtles. Marine mammals and sea turtles are expected to avoid active seismic survey sounds sources and not suffer injury.
7.4.2 Exploratory Drilling
7.4.2.1 Presence of Structures
Migrating birds could be attracted to and land on offshore drilling platforms and supply boats. It is also possible that large numbers of shorebirds may fly over the area during their southward migration. However, protocols have been developed to handle birds that land on vessels or rigs to minimize any impacts, and the frequency of events has

84 Strategic Environmental Assessment for the Misaine Bank Area
remained relatively low. Impacts on marine and terrestrial birds caused by the presence of structures are expected to be minimal.
Navigational, warning, and working lights on the rigs and supply vessels can attract nocturnal birds, especially during foggy or overcast conditions. Minimal impacts have been reported from existing rigs or supply vessels on the East Coast.
Flares pose more of an immediate danger because in addition to attracting birds, they can physically harm them. However, flaring during exploration only occurs for short periods, and only if hydrocarbons are found.
Sub-sea structures, such as the legs of jack-up rigs, can alter the local distribution of fish because of attraction to reef-like structures. Epifauna will gradually develop on these structures, increasing their attractiveness. However, the relatively short duration and limited sub-sea components of a rig drilling an exploration well would not lead to any significant effects (Hurley and Ellis 2004).
For safety reasons, an exclusion zone extends 500 m around a rig. This exclusion zone would have minor impacts on the fishery, but possibly a significant impact on a few individual fishers if they rely on a small area for a large proportion of their catch.
Most rigs are fairly quiet because the machinery is located above the water surface. The incremental sound made by supply boats and an individual drilling rig would not add significantly to existing ambient noise levels. Thus, impacts on fish, marine mammals and birds are expected to be negligible to minor.
Once an exploratory well is tested, it is usually abandoned and the wellhead is removed to prevent any seafloor obstructions. This usually involves plugging the well and cutting the well casing just below the surface of the seafloor. An ROV survey is done to ensure there are no seafloor obstructions that could snag fishing or other gears.
7.4.2.2 Routine Discharges
There may be up to 100 people on a drilling rig at any given time, and discharges of gray (e.g., deck drainage and showers) and black (sanitary waste) water occur. Due to the relatively small amount of discharged organic matter and nutrients, the impacts on receiving waters have been determined to be negligible in the past.
Other types of routine discharges and treated oily wastes, including ballast water, bilge water, deck drainage, discharges from machinery spaces, and cooling water, are generally transported ashore for treatment and disposal. If, however, discharge into the marine environment does occur, wastes are treated as per the Offshore Waste Treatment Guidelines before disposal. Impacts of treated oily wastes on the marine environment are expected to be negligible.

Strategic Environmental Assessment for the Misaine Bank Area 85
7.4.2.3 Air Discharges
Sources of air discharges include fugitive emissions (barite and cement dust, halons, and volatile organic compounds) and operational emissions (vessel exhaust, exhaust fumes from diesel generators, and flaring). If well testing occurs, flaring is the largest likely emission source from exploration drilling. Emissions estimates from flaring are highly variable and dependent on flaring rate, flaring time (hours/days of flaring), and gas composition.
Experience in the Nova Scotia offshore area over the past three decades provided the assumptions used to create Table 7-3. An assumed flaring time and rate of 24 hours and 560,000 m3/day, and a value of 5 ppm H2S were used in the calculations. Estimates of gas composition (emission factors) were obtained from previous work (Devon 2004).
Table 7-3: Emissions Associated with Flaring for One Well
Pollutant Emission Factor(kg/1000 m3) Total Emissions(tonnes)
NOx 1.1 0.616
SO2 0.27 *(H2S in ppmv/100) 0.00756
PM2.5 0.61 0.342
Benzene 0.0025 0.0014
Total PAHs 0.000048 0.000027
CO2 (CO2E) 1913 1100
CH4 (CO2E2) 0.04*23 0.515
N2O (CO2E2) 0.04*296 663
Emissions from the drilling platform and associated equipment (generators etc.) would likely be the next largest emissions source. Estimates of carbon dioxide of up to 22,443 tons/well for a drill ship and 16,161 tonnes per well were estimated for a recent drilling project assuming a typical operation lasting 90 days (CNSOPB 2005).
The typical emissions from flaring are less than the longer-term emissions from a drill ship and supply vessels. The potential impact of these air emissions is typical of larger marine operations normally operating within Atlantic coastal waters and does not justify detailed analysis in environmental assessments for specific exploration projects, but the issue should be mentioned in discussion of cumulative impacts.
7.4.2.4 Muds and Cuttings
Typically, a small mound of cuttings and mud form directly below the drilling rig. Modeling carried out for the generic assessment indicates that the small quantities of cuttings involved in exploratory drilling at the depths likely encountered in the Misaine SEA area result in mounds tens of metres in diameter, smothering benthic organisms over an area of a few hundreds of square metres (Thomson et al. 2000; Buchanan et al. 2003).

86 Strategic Environmental Assessment for the Misaine Bank Area
Recovery of the benthic community may occur within months or may take up to a year (Buchanan et al. 2003).
Contaminants discharged with WBM (Water Based Mud) have been shown to sometimes increase heavy metals in sediments within 250 to 500 m of the drill site, but these metals are not in a bioavailable form and biological effects have been minor. If SBMs (Synthetic Based Muds) are used, smothering still appears to be the main effect, but SBMs tend to clump cuttings together more than WBMs, reducing dispersal Buchanan et al. 2003).
In addition to smothering, small quantities of drilling wastes are carried across the seabed by bottom currents. The general fate and effects of drilling wastes are discussed by Milligan et al. (1996). The sea scallop (Placopecten magellanicus) is a suspension feeder and generally considered a sensitive and valued benthic species. The observed effects of WBMs and dispersion wastes are associated with the impairment of feeding processes, not direct toxicity. The chronic lethality of low levels (>10 mg 1-1) of WBMs was very low; scallop mortality in these exposures was similar to the controls in which no drilling wastes were added (Cranford et al. 1999).
Buchanan et al. (2003) also noted that cement may be discharged to the marine environment during exploratory drilling. Quantities of up to 26 m3 have been released and, if it forms a hardened pile, will act as an artificial reef and be colonized by epifauna.
7.4.2.5 Settlement and Dispersion of Drilling Wastes
Impacts on the benthic community can occur from cuttings and mud that accumulate in a pile below the drill rig (nearfield), or over relatively long distances from dispersion of fines within the benthic boundary layer (farfield). The generic assessment (Thomson et al. 2000) predicts that discernable effects on the benthic communities would be limited to an area of a few 100 m from the source.
7.4.3 Well Site Surveys
Prior to setting up most rigs, a well site or hazard survey will be conducted to make sure conditions will support the rig legs (or spuds) or anchors, and that there are no potential shallow gas accumulations in the near surface that the well bore would penetrate. Well site surveys acquire high-resolution seismic data, sub-bottom profiles; side scan sonar images and bathymetry concurrently. Grab samples and bottom camera photographs are usually taken where appropriate. The actual geometry of the surveys may be adjusted during acquisition to account for water depth. The choice of sub-bottom profiler (shallow or deep tow) is dependent on water depth.
The impacts of well site surveys are extremely localized. Effects of the seismic and sub-bottom profiler systems are similar to those of a large scale seismic survey, but only occur for a short period of time (hours) over a very localized area, e.g., hundreds of square metres.

Strategic Environmental Assessment for the Misaine Bank Area 87
7.4.4 Potential Effects on Fisheries
Concerns about the effect of oil and gas exploration on fisheries are integrated into this section because many of the concerns are common to both seismic surveys and exploratory drilling. Both activities involve vessels traversing valued fishing areas. Concerns include:
• loss of access and exclusion zones around rigs;
• interference with fishing activity, particularly interference between drift longlines and seismic streamers;
• communication and navigation safety;
• damage to gear, particularly floats for fixed gear, which results in loss of gear;
• reduced fish and shellfish catches;
• potential tainting of catch and subsequent loss of market, and
• potential oil spills.
Most recently, specific concern has been raised about potential effects of seismic sound sources on snow crab, which is dealt with in the following section.
7.5 Special Sensitivities of the Area
Key sensitivities of the SEA area related to potential interactions with oil and gas exploration are:
• naturalness of the area (limited bottom trawling);
• productivity and reproduction;
• lack of information on benthic communities;
• differing views on potential impacts on lucrative commercial fisheries for shrimp and snow crab;
• potential for deep water corals;
• sensitive coastal areas (affected by accidental spills of hydrocarbons), and
• potential adverse impacts on species of concern under SARA.
Each of these issues are examined in relation to opening the Misaine SEA area to exploration and the potential for mitigation.
7.5.1 Naturalness
The topography and surficial geology of the Misaine SEA has limited bottom trawling in the area, which has tended to preserve its naturalness compared to most other parts of the Scotian Shelf (Breeze and Maris Consulting 2004). Specific areas, however, have not been identified as needing protection. The effect of oil and gas exploration is of relatively

88 Strategic Environmental Assessment for the Misaine Bank Area
short duration and limited spatial impact compared to the large-scale bottom trawling that has occurred over much of the Scotian Shelf. Project specific environmental assessments, including cumulative assessments, should consider potential effects on naturalness within the SEA area.
7.5.2 Productivity and Reproduction
The deep shrimp holes around Misaine Bank are noted for their productivity, and the area in general is thought to supply shrimp larvae across the Shelf (Breeze and Maris Consulting 2004). The productivity appears to be primarily associated with the high organic content of the silt deposits in the deep holes. Generally bottom temperatures in the area are cold, tending to restrict productivity.
The deep shrimp holes are also important for snow crab, and some reproduction may occur in this area. Crab fishermen reported in consultations that they feel Louisbourg Hole is an important area for reproduction of snow crab, but clear evidence of its role is not available from DFO survey data.
7.5.3 Lack of Information on Benthic Communities
Mapping of benthic habitat is more limited than in many other parts of the Scotian Shelf. Natural Resources Canada took bottom grabs for benthos on their 2002 survey, but coverage was poor. Multibeam or sidescan mapping isn't available, and thus benthic samples could not be integrated into a broad habitat classification system and mapped. DFO has not carried out any recent benthic habitat surveys of the area.
The undulating topography of the area provides a degree of isolation between benthic communities, increasing the potential for genetic diversity. The area also serves as a refugia from human activities, further increasing diversity. Unfortunately, available information is too limited to evaluate the degree to which genetic diversity may be higher in the area.
7.5.4 Concerns About Impacts on Shrimp and Crab Fisheries
An Environmental Studies Research Fund (ESRF) study was carried out off southern Newfoundland in 2002 (Christian et al. 2003) to provide specific information on the impacts of seismic airgun discharges on snow crab. Fishermen from many parts of Atlantic Canada had expressed concerns about possible impacts on their highly valuable fishery. Results of the study indicated no direct mortality or obvious effects on adult crab behaviour, health, or catch rates. However, questions remained about sublethal impacts, particularly on eggs and gonads, which could affect future reproduction.

Strategic Environmental Assessment for the Misaine Bank Area 89
Questions about possible sublethal effects and a requirement to conduct environmental effects monitoring guided design of a monitoring program of a small1 seismic survey conducted off western Cape Breton in November of 2003. The study used caged crabs and examined short-term (12 days) and medium-term (five months) differences in the behaviour, morphology and physiology of snow crab at test and control sites. Snow crabs from both groups were also observed under laboratory conditions for differences in mortality, conditions and behaviour over a six-month period (Chadwick 2005).
Results of the study showed no significant difference in mortality or external morphology between test and control sites. However, attennules, statocysts, gill characteristics, hepatopancreas and ovarian structures did differ between the two sites, with test sites showing abnormalities (Chadwick 2005). Antennules, gills, and statocysts returned to normal within five months. Changes to the hepatopancreas and ovaries suggested subtle, long-term effects may have occurred. Peer review indicated that the results of the study could have been a result of the experimental design or indicative of real but subtle impacts from the seismic airgun discharges (Chadwick 2005).
Species specific studies have not been done to document the impact of seismic surveys on shrimp, leading to a similar situation with the commercial shrimp fishery. Effects are expected to be be minor, based on interpolation from other information on other invertebrates. Northern shrimp do not make noise, eliminating a concern of possible masking of communication (Koeller, P., DFO Science, pers. comm., 2005).
Crab and shrimp fishermen are concerned about potential risk to their livelihood. They are logically resistant to accepting any risk, and work to minimize their exposure. The current restructuring in the crab fishery (Gardner et al. 2005) further complicates the issue and raises tensions.
One view of the current situation with respect to snow crab is that two specific studies (Christian 2003; Chadwick 2005) have been conducted that were unable to document any specific problem. An opposing view is that questions remain and there is a risk of long term impacts on recruitment to the fishery. Viewing the snow crab as a common property suggests that a comparison of the potential effect of commercial fishing versus seismic surveys on the crab population might be reasonable.
Reported landings for eastern Nova Scotia were 9,629 tonnes in the 2004 fishing season, and fishable biomass reduced 41% in Sydney Bight and 15% on the Scotian Shelf over the year (DFO 2005a). The potential effect of seismic surveys results in no immediate
1 The survey used a low power array. In situ measurements at the site indicated sound levels of 190 dB re µPa at 236 m, and a maximum rms sound pressure level of 178 db re µPa was observed at the caged snow crab test site (Chadwick 2005). Standard seismic survey airgun arrays tend to use sound pressure levels of about 260 dB re µPa.

90 Strategic Environmental Assessment for the Misaine Bank Area
mortality and at worst has only a subtle longer-term effect. At the same time, the Misaine SEA area may be important to reproduction of both snow crab and shrimp, increasing the vulnerability of an exceedingly valuable fishery.
Consultation has suggested fishermen of both snow crab and shrimp, as well as ENGOs, would like to see a prohibition on oil and gas exploration in the area until more information is available. A compromise position that appears reasonable would be to exclude the Louisbourg Hole from the Misaine SEA area, because of its potential importance both ecologically and for commercial fishing, until more detailed studies are undertaken to allow more quantification of the value of the area and the potential for adverse effects.
7.5.5 Deep Water Corals
Deep water corals are known to occur in canyons and fans along within the Laurentian Channel. The Stone Fence off Banquereau Bank has been identified as an important coral area and is now protected, but no areas have been identified within the Misaine SEA area. St. Ann's Bank and Artimon Bank, near Misaine bank, have been identified as areas where deep sea coral occur based on fishermen's local ecological knowledge (Gass 2004). However, the deeper water holes closer to Misaine Bank have been identified as priority areas for research related to corals (DFO 2005c). It will therefore be critical that well site surveys include a thorough reconnaissance component to determine if corals are present.
7.5.6 Sensitive Coastal Areas
Specific sensitive ecosystem areas or special management areas, such as marine protected areas, are not located within the Misaine SEA area. However, numerous highly sensitive areas, including sandy beaches, national historic sites, such as Fortress Louisbourg, and important bird colonies. are located along the eastern coast of Cape Breton. The potential for impact on these sensitive coastal area is limited to accidental events, where hydrocarbons are carried ashore by wind, waves and currents.
To evaluate the potential for hydrocarbons to reach this vulnerable shoreline, a number of trajectory simulations were run, as outlined in Section 3.3. Trajectories for the four seasons are presented in Figure 7-1.
The trajectories illustrate the dominant effects of offshore winds and the Nova Scotia current, which operate to carry surface spills away from the coast. Winds could push a spill towards the coast, but it is unlikely that they would persist in a shoreward direction for long enough to drive large volumes of oil ashore given a minimum distance of 30 kilometres.

Strategic Environmental Assessment for the Misaine Bank Area 91
Figure 7-1: Modeled Drift Trajectories at
the Surface by Season
Specific assessment of the potential risk to these sensitive shorelines should, however, be examined when the specific location and timing of an exploratory drilling project is known.
Summer Winter

92 Strategic Environmental Assessment for the Misaine Bank Area
7.5.7 Species at Risk
The Species at Risk Act requires protection of species considered endangered, threatened, or of concern. The species of particular concern potentially occurring within the Misaine SEA area include the leatherback turtle and the blue whale. Sea turtles cross the Shelf to reach important feeding areas along the coast of Nova Scotia and in Sydney Bight. Blue whales migrate along the Shelf Edge, as well as the Laurentian Channel, to feed in the Gulf of St. Lawrence.
In terms of potential adverse impacts from oil and gas exploration, the Misaine SEA area does not pose risks different than many other parts of the Scotian Shelf or Slope where exploration is ongoing. However, a new seismic code of practice has been developed by DFO in consultation with relevant provincial and territorial governments and other federal departments (see Appendix A). This code of practice will further reduce the potential for impact on SARA designated species. Example requirements include:
• a qualified Marine Mammals Observer must check a safety zone of 500 m from the centre of the seismic source array for at least 30 minutes prior to start-up of the array;
• an array must be immediately shut down when an endangered or threatened marine mammal or sea turtle is observed within the safety zone, and
• at times of low visibility, passive acoustic monitoring, if a SARA listed vocalizing whale is reasonably expected in the area.
8 EFFECTS OF THE ENVIRONMENT ON POTENTIAL PROJECTS The physical environment in the form of wind, waves and ice has a profound effect on the planning and execution of exploration activities in the offshore. Extreme weather and ice conditions may affect program scheduling for operations, including provision of supplies and services to offshore facilities.
Detailed analysis of weather and ice conditions is a routine part of project planning for exploration activities. Forecasts of weather and ice conditions are an important part of the selection of seismic, drilling and support equipment deployed. Meteorological and oceanographic monitoring programs are frequently part of offshore exploration activities. The collection of seismic information is particularly affected by weather, but this is more a data quality issue related to ambient noise levels than one of safety.
The short duration of exploration activities reduces concerns about earthquakes. Still, this issue should be examined in assessments of site-specific projects. Similarly, ice is not usually a major issue with respect to exploration activities on the eastern Scotian Shelf, but a specific project schedule may pose issues that need to be addressed. Operation at

Strategic Environmental Assessment for the Misaine Bank Area 93
times when freezing of salt spray may occur is an important safety issue that needs to be specifically addressed in the selection of equipment and timing of operations.
In relation to exploratory drilling, a hazards survey is conducted before the rig is placed at the well site, to ensure conditions are safe.
In terms of weather conditions, rigs and supply vessels are designed to withstand 1 in 100 year events. Rigs and vessels are required to be certified to withstand these kinds of events before they are allowed to operate in the area.
NEB et al. (1994) provides an overview of requirements for the operators of drilling or production installations related to environmental data. The primary objective of monitoring physical environmental data is to ensure safe and prudent conduct of operations, emergency response, and spill counter measures.
Climate change is affecting our ability to forecast extreme conditions, increasing the need for monitoring and research. The Misaine SEA area, however, is closer to shore, and thus safer than many areas currently open to oil and gas exploration. To some degree the land also offers protection from storms coming from the west. Thus, the Misaine SEA area does not pose unusual risk for oil and gas exploration. Still, climate change should be specifically considered in project specific environmental assessments to ensure unusual safety risks do not exist.
9 CUMULATIVE EFFECTS The Cumulative Effects Assessment Practitioners Guide (Hegmann et al. 1999) defines cumulative effects as:
“changes to the environment that are caused by an action in combination with other past, present and future human actions.”
A Cumulative Effects Assessment (CEA) is intended to assess the potential effects of a project in relation to other past, ongoing and reasonably foreseeable human activities and developments. The assessment typically enlarges the scale of an environmental impact assessment to a regional level, and considers a longer time interval than the assessment of project effects (Hegmann et al. 1999).
The assessment must consider other planned or reasonably foreseeable activities on the Scotian Shelf and Slope that might interact in a cumulative fashion with potential exploration activities within the Misaine SEA area. Table 9-1 provides the number of environmental assessments considered by the CNSOPB in fiscal years 2001 to 2004, as an indication of overall oil and gas industry activity.
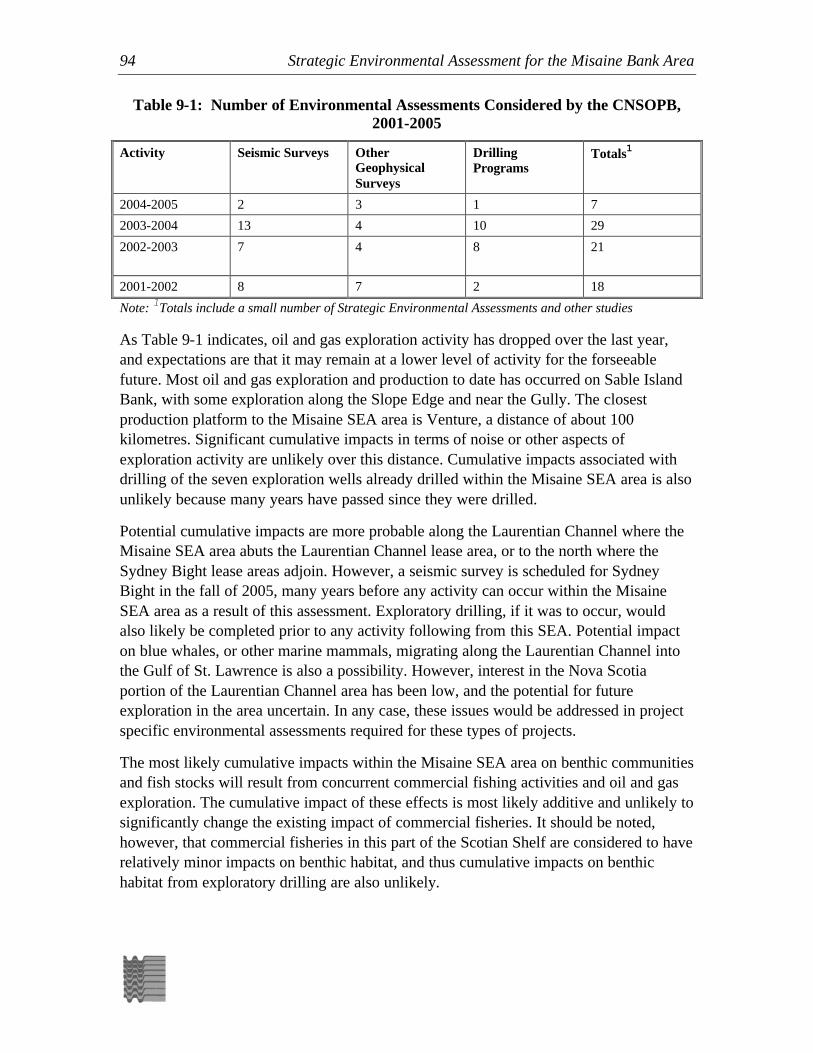
94 Strategic Environmental Assessment for the Misaine Bank Area
Table 9-1: Number of Environmental Assessments Considered by the CNSOPB, 2001-2005
Activity Seismic Surveys Other Geophysical Surveys
Drilling Programs
Totals1
2004-2005 2 3 1 7
2003-2004 13 4 10 29
2002-2003 7 4 8 21
2001-2002 8 7 2 18
Note: 1Totals include a small number of Strategic Environmental Assessments and other studies
As Table 9-1 indicates, oil and gas exploration activity has dropped over the last year, and expectations are that it may remain at a lower level of activity for the forseeable future. Most oil and gas exploration and production to date has occurred on Sable Island Bank, with some exploration along the Slope Edge and near the Gully. The closest production platform to the Misaine SEA area is Venture, a distance of about 100 kilometres. Significant cumulative impacts in terms of noise or other aspects of exploration activity are unlikely over this distance. Cumulative impacts associated with drilling of the seven exploration wells already drilled within the Misaine SEA area is also unlikely because many years have passed since they were drilled.
Potential cumulative impacts are more probable along the Laurentian Channel where the Misaine SEA area abuts the Laurentian Channel lease area, or to the north where the Sydney Bight lease areas adjoin. However, a seismic survey is scheduled for Sydney Bight in the fall of 2005, many years before any activity can occur within the Misaine SEA area as a result of this assessment. Exploratory drilling, if it was to occur, would also likely be completed prior to any activity following from this SEA. Potential impact on blue whales, or other marine mammals, migrating along the Laurentian Channel into the Gulf of St. Lawrence is also a possibility. However, interest in the Nova Scotia portion of the Laurentian Channel area has been low, and the potential for future exploration in the area uncertain. In any case, these issues would be addressed in project specific environmental assessments required for these types of projects.
The most likely cumulative impacts within the Misaine SEA area on benthic communities and fish stocks will result from concurrent commercial fishing activities and oil and gas exploration. The cumulative impact of these effects is most likely additive and unlikely to significantly change the existing impact of commercial fisheries. It should be noted, however, that commercial fisheries in this part of the Scotian Shelf are considered to have relatively minor impacts on benthic habitat, and thus cumulative impacts on benthic habitat from exploratory drilling are also unlikely.

Strategic Environmental Assessment for the Misaine Bank Area 95
10 SUMMARY OF SPECIAL CONCERNS AND MITIGATING MEASURES Analysis of potential impacts suggests that the Misaine SEA area is not more sensitive to the potential effects of oil and gas than other areas of the Scotian Shelf. It is, however, less affected by past human activities, particularly bottom trawling, than many other areas opened to exploration previously. The area also has uncommon topography and may support unusual benthic communities in the numerous deep holes of cold water.
Fisheries for snow crab and northern shrimp within the Misaine SEA area are highly lucrative. The Laurentian Channel, on the eastern edge of the area, is an important migration route for marine mammals. The endangered blue whale, which enters the Gulf of St. Lawrence to feed in the summer, is of particular concern. Also, numerous coastal sites along eastern Cape Breton are sensitive to potential accidental spills of hydrocarbons.
Lack of information on benthic habitat within the area and its relationship to seismic effects, particularly on shrimp, are a concern. Less scientific information has been gathered within the Misaine SEA area than most other areas where oil and gas exploration has occurred. To reflect this lack of information, and concern by commercial fishermen about the potential importance of the area to the sustainability of their fisheries, it is recommended that Louisbourg Hole be a priority area for the collection of additional baseline information. A review of its ecological importance should be conducted once sufficient new information is available. It is also recommended that, if well site surveys are to be conducted in the area, biological information be collected and made publicly available for incorporation into a baseline database.
New guidelines for seismic surveys have been developed by DFO, in conjunction with other agencies (http://www.dfo-mpo.gc.ca/canwaters-eauxcan/infocentre/media/seismic-sismique/intro_e.asp). These guidelines would be adopted for the Misaine SEA area, should it become open to exploration, and will ensure minimal impacts on marine mammals and species of concern listed under SARA.
Other mitigation measures considered in this assessment include:
• prohibition of selected or all exploration activities in selected areas;
• baseline studies or effects monitoring;
• modified rules for seismic operations dealing with ramping up, response to sightings, or night time operations;
• use of specially trained observers to deal with specific issues, and
• zero discharge from exploratory drilling operations.
96 Strategic Environmental Assessment for the Misaine Bank Area
These additional mitigation measures can be applied broadly to exploration activities within the Misaine SEA area. They address the specific sensitivities identified in this SEA, and conform to the guidance provided in ESSIM. They will work to ensure that the residual impacts from oil and gas exploration remain at acceptably low levels. Additional mitigation, particularly with reference to the timing of activities to avoid especially sensitive periods are addressed in project-specific environmental assessments that may follow this SEA should a call for bids be issued.
The Misaine SEA area is less affected by past human activities, particularly bottom trawling, than other areas opened to exploration previously, and likely supports productive and possibly uncommon benthic communities. Nonetheless, with appropriate mitigation in place, no reason could be found to exclude exploration for oil and gas from the area.
11 REFERENCES Amos, C.L. and Knoll, R. 1987. The Quaternary Sediments of Banquereau, Scotian Shelf.
Geological Society of America Bulletin 99:244-260.
Amos, C.L. and Nadeau, O.C. 1988. Surficial Sediments of the Outer Banks, Scotian Shelf, Canada. Canadian Journal of Earth Sciences 25 (12): 1923-1944.
Beanlands, G.E. and P.N. Duinker. 1983. An Ecological Framework for Environmental Impact Assessment in Canada. Institute for Resource and Environmental Studies, Halifax.
Bedford Institute of Oceanography. (2003) Monthly Current Statistics. http://www.mar.dfo-mpo.gc.ca/science/ocean/current_statistics/s054n.
Biron, M.L., L.Savoie, R. Campbell, E. Wade, M. Moryasu and P. DeGrace, 2002. Assessment of the 2001 Snow Crab (Chionoecetes opilio) Fishery Off Eastern Nova Scotia (Areas 20 to 24). Can. Sci. Advis. Sec. 2002/011: 67p.
Black, J. 2000. Fishery Effort Trends on the Eastern Scotian Shelf. In O’Boyle, R. (Editor). 2000. Proceedings of a Workshop on the Ecosystem Considerations for the Eastern Scotian Shelf Integrated Management (ESSIM) Area. held at Bedford Institute of Oceanography 19-23 June, 2000. CSAS Proceedings Series 2000/14: 58-61.

Strategic Environmental Assessment for the Misaine Bank Area 97
Boudreau, P.R., D.C. Gordon, G.C. Harding, J.W. Loder, J. Black, W.D. Bowen, S. Campana, P.J. Cranford, K.F. Drinkwater, L. Van Eeckhaute, S. Gavaris, C.G. Hannah, G. Harrison, J.J. Hunt, J. McMillan, G.D. Melvin, T.G. Milligan, D.K. Muschenheim, J.D. Neilson, F.H. Page, D.S. Pezzack, G. Robert, D. Sameoto and H. Stone. 1999. The Possible Environmental Impacts of Petroleum Exploration Activities on the Georges Bank Ecosystem. Can. Tech. Rep. Fish. Aquat. Sci. 2259. 106p.
Breeze, H. and Maris Consulting. 2004. Review of Criteria for Selecting Ecologically Significant Areas of the Scotian Shelf and Slope: A Discussion Paper. DFO Ocean and Coastal Management Report 2004-04, Halifax, NS: 96p.
Breeze, H., D.G. Fenton, R.J. Rutherford and M.A. Silva. 2002. The Scotian Shelf: an Ecological Overview for Ocean Planning. Can. Tech. Rep. Fish. Aquat. Sci. 2393: 259 p.
Brown, R.G.B. 1986. Revised Atlas of Canadian Seabirds. Canadian Wildlife Service. Dartmouth, NS. 111p.
Brown, M., J.M. Allen and S.D. Kraus. 1995. The Designation of the Seasonal Right Whale Conservation Areas in the Waters of Atlantic Canada. In: Shackell, N., and M. Willison (eds.) Marine Protected Areas and Sustainable Fisheries. Science and Management of Protected Areas Association. Wolfville, Nova Scotia, Canada.
Buchanan, R.A., Cook, J.A. and A. Mathieu. 2003. Environmental Effects Monitoring for Exploration Drilling. Environmental Studies Research Funds ESRF– 018. Calgary, Alberta.
C. Smith. 1997. Hydrography and Baroclinic Circulation in the Scotian Shelf Region: Winter versus Summer. Can. J. Fish. Aquat. Sci. Vol. 54(Suppl. 1), 1997
Canadian Environmental Assessment Agency. 1997. Guide to the Preparation of a Comprehensive Study for Proponents and Responsible Authorities.
Canadian Wildlife Service (CWS). 1999b. Leatherback Turtle. in Species at Risk: Species Search. http://www.speciesatrisk.gc.ca/Species/English/SearchDetail.cfm
CEF Consultants Ltd. 2004. Data Adequacy of Establishing a Special Area under MARPOL. Prepared for Environment Canada, Ottawa.
CETAP (Cetacean and Turtle Assessment Program). 1982. A Characterization of Marine Mammals and Turtles in the Mid-and North-Atlantic Areas of the U.S. Outer Continental Shelf. Final Report. Contract No. AA551-CT8-48. Bureau of Land Management U.S. Dept. of the Interior. Washington, DC: 586p.
98 Strategic Environmental Assessment for the Misaine Bank Area
Chatwick, M. 2005. Proceedings of the Peer Review on Potential Impacts of Seismic Energy on Snow Crab. DFO Can. Sci. Advis. Sec. Proceed. Ser. 2004/045: 46p.
Christian, J.R., A.Mathieu, D.H. Thomson, D. White and R.A. Buchanan. 2003. Effect of Seismic Energy on Snow Crab (Chionoecetes opilio). Environmental Studies Research Fund, Calgary, Report 144: 106 p.
CNSOPB (Canada Nova Scotia Offshore Petroleum Board). 2005. Comprehensive Study Report: Exploration Drilling on EL 2407 - BEPCo Canada Company.
CNSOPB (Canada-Nova Scotia Offshore Petroleum Board). 2002. Strategic Environmental Assessment of Potential Exploration Rights Issuance for Eastern Sable Island Bank, Western Banquereau Bank, the Gully Trough and the Eastern Scotian Slope. Halifax, N.S. http://www.CNSOPB.ns.ca/Environment/evironment.html. Accessed December 3, 2002.
Coffen-Smout, S., R.G. Halliday, G. Herbert, T. Potter and N. Witherspoon. 2001. Ocean Activities and Ecosystem Issues on the Eastern Scotian Shelf: An assessment of Current Capabilities to Address Ecosystem Objectives. CSAS Res. Doc. 2001/095.
Colbourne E. (2002). Oceanographic Conditions in NAFO Subdivisions 3Pn and 3Ps During 2001 with Comparisons to the Previous Year and the Long Term (1971 – 2000) Average. DFO Res. Doc. 2002/024.
Cong, L., Sheng, J., Thompson, K.R. 1996. A Retrospective Study of Particle Retention on the Outer Banks of the Scotian Shelf 1956-1993. Canadian Technical Report of Hydrography and Oceans Sciences 170.
Conway, J. pers. comm. Advisor, Marine Mammals; Resource Management, Maritimes Region, Department of Fisheries and Oceans.
COSEWIC (Committee on the Status of Endangered Wildlife in Canada). 2004. Canadian Species at Risk, November 2004. 58 pp.
Cranford, P.J., D.C. Gordon, K. Lee, S.L. Armsworthy and G..H.. Tremblay. 1999. Chronic Toxicity and Physical Disturbance Effects of Water and Oil-based Drilling Fluids and Some Major Constituents on Adult Sea Scallops (Placopecten magellanicus). Mar. Envir. Res. 48: 225-256.
Davis, D., and S. Browne (eds.). 1996. Natural History of Nova Scotia, Volume 1: Topics & Habitats. on-line edition: http://museum.gov.ns.ca/mnh/nature/nhns: 264-272.

Strategic Environmental Assessment for the Misaine Bank Area 99
Davis, R.A., D.H. Thomson and C.I. Malme. 1998. Environmental Assessment of Seismic Exploration on the Scotian Shelf. Prepared by LGL Ltd. for Mobil Oil Canada Properties Ltd., Shell Canada Ltd., and Imperial Oil Ltd. for the Canada/Nova Scotia Petroleum Board, Halifax.
Desharnais, F. and N.E.B. Collison. 2001. Background Noise Levels in the Area of the Gully, The Laurentian Channel and Sable Bank. Defence Research Establishment Atlantic, DREA ECR 2001-028, April 2001, Dartmouth, NS.
Devon Canada Corporation. 2004. Beaufort Sea Exploration Drilling Program Application, Comprehensive Study Report. Prepared for Devon Canada Corporation by KAVIK-AXYS, April 15, 2005.
DFO (Department of Fisheries and Oceans). 2005a. Eastern Nova Scotia Snow Crab. DFO Can. Sci. Advis. Sec. Sci. Advis. Rep. 2005/032: 11p.
DFO (Department of Fisheries and Oceans). 2005b. Eastern Scotian Shelf Integrated Ocean Management Plan (2006-2011). Oceans and Coastal Management Report 2005-02: 81p.
DFO (Department of Fisheries and Oceans). 2005c. Coral Conservation Plan (2005 – 2010): Draft for Discussion. ESSIM Planning Office. Bedford Institute of Oceanography. Dartmouth, Nova Scotia.
DFO (Department of Fisheries and Oceans). 2005d. 2003 State of the Ocean: Chemical and Biological Oceanographic Conditions in the Gulf of Maine – Bay of Fundy, Scotian Shelf and Southern Gulf of St. Lawrence. Ecosystem Status Report 2004/005.
DFO (Department of Fisheries and Oceans). 2005e. Statement of Canadian Practice on the Mitigation of Seismic Noise in the Marine Environment. http://www.dfo-mpo.gc.ca/canwaters-eauxcan/infocentre/media/seismic-sismique/intro_e.asp (Last accessed June 2005)
DFO (Department of Fisheries & Oceans Canada). 2004a. Northern Shrimp on the Eastern Scotian Shelf (SFA 13-15). DFO Sci. Stock Status Rep. 2004/045.
DFO (Department of Fisheries & Oceans Canada). 2004b. Review of Scientific Information on Impacts of Seismic Sound on Fish, Invertebrates, Marine Turtles and Marine Mammals. DFO Sci. Habitat Status Rep. 2004/002: 15 p.
DFO (Department of Fisheries & Oceans Canada). 2004c. Eastern Nova Scotia Snow Crab. DFO Sci. Stock Status Rep. 2004/028.
100 Strategic Environmental Assessment for the Misaine Bank Area
DFO (Department of Fisheries & Oceans Canada). 2004d. Proceedings of the Maritimes Regional Advisory Process of the Eastern Scotian Shelf Snow Crab. Can. Sci. Advis. Sec. 2004/023 32p.
DFO (Department of Fisheries & Oceans Canada). 2004e. Potential Impacts of Seismic Energy on Snow Crab. DFO Sci. Habitat Status Rep. 2004/003.
DFO (Department of Fisheries & Oceans Canada). 2004f. Eastern Cape Breton Lobster (LFAs 27-30). DFO Science Stock Status Report 2004/32: 9p.
DFO (Department of Fisheries & Oceans Canada). 2004g. Pollock in 4VWX and 5Zc. DFO Can. Sci. Advis. Sec. Stock Status Report 2004/049.
DFO (Department of Fisheries & Oceans Canada). 2004h. 4VWX Herring. Can. Science Advis. Sec. Stock status Rep. 2004/034
DFO (Department of Fisheries & Oceans Canada). 2004i. Unit 2 Redfish. Can Sci. Advis. Sec. Stock Status Report 2004/016.
DFO (Department of Fisheries & Oceans Canada). 2004j. White Hake in the Southern Gulf of St. Lawrence (Div. 4T). DFO Can. Sci. Advis. Sec. Stock Status Report 2004/007.
DFO (Department of Fisheries & Oceans Canada). 2004k. Witch Flounder (Divs. 4RST). DFO Science Stock Status Report 2004/008.
DFO (Department of Fisheries & Oceans Canada). 2004l. Cod in the Southern Gulf of St. Lawrence. DFO Science Stock Status Report 2004/003.
DFO (Department of Fisheries & Oceans Canada). 2003a. State of the Eastern Scotian Shelf Ecosystem. DFO Can. Sci. Advis. Sec. Ecosystem Status Report 2003/004.
DFO (Department of Fisheries & Oceans Canada). 2003b. Eastern Scotian Shelf Cod. DFO Sci. Stock Status Report. 2003/020.
DFO (Department of Fisheries & Oceans Canada). 2003c. Silver Hake on the Scotian Shelf (Div. 4VWX). DFO Can. Sci. Advis. Sec. Stock Status Rep. 2003/052.
DFO (Department of Fisheries & Oceans Canada). 2002a. Winter Skate on the Eastern Scotian Shelf (4VsW). DFO Sci. Stock Status Rep. A3-29 (2002).
DFO (Department of Fisheries & Oceans Canada). 2002b. American Plaice and Yellowtail Flounder on the Eastern Scotian Shelf (Div. 4VW). DFO Sci. Stock Status Report A3-34 (2002).
DFO (Department of Fisheries & Oceans Canada). 2002c. Updates on Selected Scotian Shelf Groundfish Stocks in 2002. DFO Science Stock Status Report A3-35 (2002).

Strategic Environmental Assessment for the Misaine Bank Area 101
DFO (Department of Fisheries & Oceans Canada). 2002d. Monkfish on the Scotian Shelf and Northeast Georges Bank (4VWX and 5Zc). DFO Sci. Stock Status Report A3-30 (2002).
DFO (Department of Fisheries & Oceans Canada). 2002e. Haddock on the Eastern Scotian Shelf (Div. 4TVW). DFO Sci. Stock Status Rep. A3-06 (2002).
DFO (Department of Fisheries & Oceans Canada). 2002f. White Hake in 4VWX and 5. DFO Sci. Stock Status Rep. A3-10 (2002).
DFO (Department of Fisheries & Oceans Canada). 2002g. Wolffish on the Scotian Shelf, Georges Bank, and in the Bay of Fundy (4VWX and 5Yze). DFO Sci. Stock status Rep. A3-31 (2002).
DFO (Department of Fisheries & Oceans Canada). 2001a. Atlantic Halibut on the Scotian shelf and southern Grand Bank (Div. 4VWX3NOP). DFO Sci. Stock Status Report A3-23.
DFO (Department of Fisheries & Oceans Canada). 2001b. Porbeagle Shark in NAFO Subarea 3-6. DFO Sci. Stock Status Rept. B3-09 (2001).
DFO (Department of Fisheries & Oceans Canada). 2000a. Scotian Shelf (LFA 33) Jonah Crab (Cancer borealis). DFO Science Stock Status Report C3-09(2000).
DFO (Department of Fisheries & Oceans Canada). 2000b. Rock Crab – Eastern Nova Scotia. DFO Science Stock Status report C3-05 (2000).
DFO (Department of Fisheries & Oceans Canada). 1998a. The Gully - A Scientific Review of its Environment and Ecosystems. Maritimes Regional Habitat Status Report 98/1E: 236p.
DFO (Department of Fisheries & Oceans Canada). 1998b. Scotian Shelf Capelin. DFO Sci. Stock Status Report B3-06 (1998).
Dinsmore, R.P. (1972) Ice and Its Drift into the North Atlantic Ocean. In: Symposium on Environmental Conditions in the Northwest Atlantic 1960-1969: 89-127.
Environment Canada. 2003. Species at Risk Act, A Guide. http://www.sararegistry.gc.ca/the_act/default_e.cfm. (last accessed March 2005).
Fanning, P. and R. Mohn. 2000. Trends in Exploited and Bycatch Species: Finfish Fisheries. In: O’Boyle, R. (Editor). 2000. Proceedings of a Workshop on the Ecosystem Considerations for the Eastern Scotian Shelf Integrated Management (ESSIM) Area. held at Bedford Institute of Oceanography 19-23 June, 2000. CSAS Proceedings Series 2000/14.

102 Strategic Environmental Assessment for the Misaine Bank Area
Fenton, D. pers. comm. Biologist, Oceans and Coastal Management Division, Bedford Institute of Oceanography, Department of Fisheries and Oceans.
Freiwald, A., Fosså, J.H., Grehan, A., Koslow, T., Roberts, J.M. 2004. Cold-water Coral Reefs. UNEP-WCMC, Cambridge, UK.
Gardner, M., J. Mullally, and S. Beaton. 2005. Advisory Panel on Access and Allocation: Eastern Nova Scotian Snow Crab Fishery. Report to the Hon. Geoff Regan, Minister of Fisheries.
Gass, S. 2004. An Assessment of the Distribution and Status of Deep Sea Corals in Atlantic Canada by Using Both Scientific and Local Forms of Knowledge. M. Sc. Thesis. School for Resource and Environmental Studies. Dalhousie University.
Gordon, D.C. Jr., L.D. Griffiths, G.V. Hurley, A.L. Muecke, D.K. Muschenheim and P.G. Wells (eds). 2000. Understanding the Environmental Effects of Offshore Hydrocarbon Development. Can. Tech. Rep. Fish. Aquat. Sci. 2311.
Han G., J.W. Loder, P.C. Smith. 1999. Seasonal-Mean Hydrography and Circulation in the Gulf of St. Lawrence and on the Eastern Scotian and Southern Newfoundland Shelves. Journal of Physical Oceanography. No. 6, 1999: 1279-1301.
Hannah, C. G., J. A. Shore and J. W. Loder. 2000. The Retention-Drift Dichotomy on Browns Bank: A Model Study of Interannual Variability. Can. J. Fish. Aquat. Sci. 57: 2506-2518.
Hannah, C.G., Shore, J.A., Loder, J.W. and Naimie, C.E. 2001. Seasonal Circulation on the Western and Central Scotian Shelf. Journal of Physical Oceanography 31: 591-615.
Hegmann, G., C. Cocklin, R. Creasey, S. Dupuis, A. Kennedy, L. Kingsley, W. Ross, H. Spaling, D. Stalker and AXYS Environmental Consulting Ltd. 1999. Cumulative effects assessment practitioners guide.. Prepared for the Canadian Environmental Assessment Agency by the Cumulative Effects Assessment Working Group. February 1999, Cat. No. En106-44/1999E.
Hurley, Peter. 2005. Personal Communication. Senior Assessment Biologist. Marine Fish Division. Bedford Institute of Oceanography. Fisheries and Oceans Canada
Hurley, G. and J. Ellis. 2004. Environmental Effects of Exploratory Drilling Offshore Canada: Environmental Effects Monitoring Data and Literature Review – Final Report. Prepared for the Canadian Environmental Assessment Agency (CEA) Regulatory Advisory Committee (RAC).

Strategic Environmental Assessment for the Misaine Bank Area 103
Jacques Whitford Environment Ltd. 2003. Strategic Environmental Assessment Laurentian Subbasin. Prepared for the Canada Newfoundland Offshore Petroleum Board, St. John's, NL: 264 p.
Jacques Whitford Environment Ltd. 2005. Addendum to Environmental Assessment Report on Exploratory Drilling on EL 2407. Prepared by Jacques Whitford Ltd. in association with SL Ross Environmental Research Ltd. and Coastal Oceans Associates Inc. for BEDCO Canada Company, Project NSD18634: 131 p.
Josenhans, H., E. King and V. Kostylev. 2004. Surficial Geological and Habitat Studies of the Eastern Scotian Shelf. CSS Hudson Cruise: 2003029, Geological Survey of Canada.
Kenney, R. D. 1994. Distribution charts of marine mammals on the Scotian Shelf 1966 through 1992. In: Reeves, R.R., and Brown, M.W. 1994. Marine Mammals and the Canadian Patrol Frigate Shock Trials: A Literature Review and Recommendations for Mitigating Impacts. East Coast Ecosystems Research Organization. prepared for National Defence Headquarters, Ottawa.
Lock, A., R. Brown and S. Gerriets. 1994. Gazetteer of Marine Birds in Atlantic Canada: An Atlas of Seabird Vulnerability to Oil Pollution. Canadian Wildlife Service, Environmental Conservation Branch, Environment Canada, Atlantic Region. 137 p.
Loder, J.W., G. Han, C.G. Hanna, D.A. Greenberg and P.C. Smith (1997). Hydrography and Baroclinic Circulation in the Scotian Shelf Region: Winter vs. Summer. Canadian Journal of Fisheries and Aquatic Science, 54 (Suppl. 1): 40:56.
Loder, J.W., R.I. Perry, K.F. Drinkwater, G.C. Harding, W.G. Harrison, E.P.W. Horne, N.S. Oakey, C.T. Taggart, M.J. Tremblay, D. Brickman, J. Grant and M.M. Sinclair. 1992. Physics and Biology of the Georges Bank Frontal System. DFO Science Review 1990 & 91: 57-61.
Lucas, Z.L. and S.K. Hooker. 2000. Cetacean Strandings on Sable Island, Nova Scotia, 1970-1998. Canadian Field-Naturalist 114:45-61.
Lundy, Mark. 2005. Personal Communication. Technician, Molluscan Fisheries. Invertebrate Fisheries Division. Fisheries and Oceans Canada. Dartmouth, Nova Scotia.
MacIsaac, K., C. Bourbonnais, E. Kenchington, D. Gordon Jr., and S. Gass. 2001. Observations on the Occurrence and Habitat Preference of Corals in Atlantic Canada. Pages 58-75, In: J.H.M. Willison (ed.) Proceedings of the First International Symposium on Deep Sea Corals. Ecology Action Centre and the Nova Scotia Museum, Halifax, N.S.

104 Strategic Environmental Assessment for the Misaine Bank Area
MacLaren Plansearch (1991) Limited. 1996. Environmental Impact Statement, Vol. 3, Sable Offshore Energy Project. Prepared for the Sable Offshore Energy Project. Halifax, Nova Scotia.
MacLean, B. and L. King, 1971. Surficial Geology of the Banquereau and Misaine Bank Map Area. Geological Survey of Canada Paper 71-52.
McCauley, R.D., J. Fewtrell, and R.N. Popper. 2003. High Intensity Anthropogenic Sound Damages Fish Ears. J. Acoustic Soc. Amer. 113(1): 638-642.
Milligan, T.G., D.C. Gordon, D. Belliveau, Y. Chen, P.J. Cranford, C. Hannah, J. Loder, and D.K. Muschenheim. 1996. Fate and Effects of Offshore Hydrocarbon Drilling Waste.
NEB, C-NSOPB and C-NOPB. 1994. Guidlines Respecting Physical Environmental Programs during Petroleum Drilling and Production Activities on Frontier Lands. Public Works and Government Services Canada NE23-41/1994E.
O'Boyle, R.N., Sinclair, M., Conover, R.J., Mann, K.H. and Kohler, A.C. 1984. Temporal and Spatial Distribution of Icthyoplankton Communities of the Scotian Shelf in Relation to Biological, Hydrological,and Physiographic Features. Rapp. P.-v Reun. Cons. int. Explor. Mer, 183: 27-40.
O’Boyle, R. (Editor). 2000. Proceedings of a Workshop on the Ecosystem Considerations for the Eastern Scotian Shelf Integrated Management (ESSIM) Area, held at Bedford Institute of Oceanography 19-23 June, 2000. CSAS Proceedings Series 2000/14.
OGOP (Oil and Gas Observer Program). 2001. Offshore Seismic Exploration Observer Data. Seafood Producers Association of Nova Scotia.
OGOP (Oil and Gas Observer Program). 2000. Offshore Seismic Exploration Observer Data. Seafood Producers Association of Nova Scotia.
Pickart, R.S., and W.M. Smethie, Jr., How does the Deep Western Boundary Current Cross the Gulf Stream? J. Phys. Oceanogr., 23, 2602-2616, 1993.
Reeves, R. R., P.J. Clapham, R L. Brownell, Jr., and G. K. Silber. 1998. Recovery Plan for the Blue Whale (Balaenoptera Musculus). National Marine Fisheries Service. Silver Spring, Maryland.
RENEW. 2004. Recovery of Nationally Endangered Wildlife in Canada. Annual Report No. 14. Ottawa, Ontario. 36 pp.
Richardson, W.J., C.R. Green Jr., C.I. Malme, and D.H. Thomson 1995. Marine Mammals and Noise. Academic Press, San Diego: 576 p.

Strategic Environmental Assessment for the Misaine Bank Area 105
Rutherford, R.J. and Breeze, H. 2002. The Gully Ecosystem. Canadian Manuscript Report of Fisheries and Aquatic Sciences 2615.
S.L. Ross Environmental Research Ltd. 2001. Blowout and Spill Probabilities for Exploration Drilling off Cape Breton, Nova Scotia. Hunt Oil Company of Canada, Inc.: 11p
Sameoto, D. and N. Cochrane. 1996. Euphausiids on the Eastern Continental Shelf. DFO Atl. Fish. Res. Doc. 96/119.
SARA (Species At Risk Act Public Registry). 2005. Species List. http://www.sararegistry.gc.ca/species/default_e.cfm. (last accessed March 2005).
Scott, W.B. and M.G. Scott. 1988. Atlantic Fishes of Canada. Canadian Bulletin of Fisheries and Aquatic Sciences No. 219. University of Toronto Press, Toronto. 731p.
Sears, R. 1999. Blue Whale dispersal off Atlantic Canada. in: Rorqual 1999, v. 10. on-line edition: http//www.rorqual.com/newslett.htm.
Sears, R. and F. Larsen. 2002. Long Range Movements of a Blue Whale (Balaenoptera Musculus) between the Gulf of St. Lawrence and West Greenland. Marine Mammal Science. Vol. 18(1):281–285.
Shackell, N.L. and K.T. Frank, 2000. Larval Fish Diversity on the Scotian Shelf. Can. J. Aquat. Sci. 57:1747-1760.
Steele, D.H., J.M. Green and J. Carter. 1979. A Biological and oOeanographic Study of the Atlantic Southeast Coast Marine Region. Report prepared for Parks Canada, Department of Indian and Northern Affairs.
Stewart, P.L., R.M. Branton, G.A. Black, H.A. Levy and T.L. Robinson. 2003. EAISSNA – An Electronic Atlas of Ichthyoplankton on the Scotian Shelf of North America. Can. Tech. Rep. Fish. Aquat. Sci. 2514: 179p.
Sutcliffe, W.H. and P. F. Brodie. 1977. Whale Distribution in Nova Scotia Waters. Tech. Rept. Environ. Can. Fish. Mar. Serv. 722: 83p.
Thomson, D.H., J.W. Lawson and A. Muecke. 2001. Workshop to Develop Methodologies for Conducting Research on the Effects of Seismic Exploration on the Canadian East Coast Fishery. Prepared for Environmental Studies Revolving Funds and the Canada-Nova Scotia Offshore Petroleum Board by LGL Ltd. and Griffiths Muecke Associates, Halifax.

106 Strategic Environmental Assessment for the Misaine Bank Area
Thomson, D.H., R.A. Davis, R. Belore, E. Gonzalez, J. Christian, V.D. Moulton and R.E. Harris. 2000. Environmental Assessment of Exploration Drilling off Nova Scotia. Rep. from LGL Ltd., King City, Ont., S.L. Ross Environmental Research Ltd., Ottawa, Ont., and Coastal Oceans Associates, Halifax, NS, for Canada/Nova Scotia Offshore Petroleum Board and Mobil Oil Canada Properties, Halifax, Nova Scotia. LGL Report No. TA 2281: 380p.
Tufts, R.W. 1986. The birds of Nova Scotia. 3rd Ed. Halifax, NS: Nova Scotia Museum.
Turnpenny, A.W.H. & Nedwell, J.R. 1994. The Effects on Marine Fish, Diving Mammals and Birds of Underwater Sound Generated by Seismic Surveys. Fawley Aquatic Research Laboratories Ltd, Fawley, Southampton SO45 1TW. Available from United Kingdom Offshore Operators Association, 3 Hans Crescent, London, SW1X 0LN.
US FWS (United States Fish and Wildlife Service). 2005. Species Information: Threatened and Endangered Animals and Plants. http://endangered.fws.gov/wildlife.html. Last accessed March 2005.
Waring, G.T., Pace, R.B., Quintal, J.M., Fairfield, C.P. Maze-Foley, K. (Eds.). 2004. U.S. Atlantic and Gulf of Mexico Marine Mammal Stock Assessments – 2003. NOAA Technical Memorandum NMFS-NE-182. http://www.nefsc.noaa.gov/nefsc/publications/tm/tm182/. Last accessed May, 2005.
Whitehead, H. S. Gowans, A. Faucher, and S.W. McCarrey. 1997. Population analysis of Northern Bottlenose Whales in The Gully, Nova Scotia. Mar. Mamm. Sci. 13(2).
Wiese, Francis K. 2002. Ph.D. Thesis, Memorial University of Newfoundland.
Wilson, O.B., Jr., S.N. Wolf and F. Ingenito (in Davis et al. 1998). 1985. Measurements of Acoustic Ambient Noise in Shallow Water due to Breaking Surf. J. Acoust. Soc. Am. 78(1): 190-195.
Zwanenburg, K. and J. West. 2000. Trends in Fish Biomass – Implications of Converting Trawlable to True Biomass Estimates. in O’Boyle, R. (Ed.). Proceedings of a Workshop on the Ecosystem Considerations for the Eastern Scotian Shelf Integrated Management (ESSIM) Area: Bedford Institute of Oceanography 19-23 June, 2000. CSAS Proceedings Series 2000/14: 65-66 pp.
Zwanenburg, K.C.T., D. Bowen, A. Bundy, K. Drinkwater, K. Frank, R.N. O’Boyle, D. Sameoto, and M. Sinclair. 2002. Decadal Changes in the Scotian Shelf (Canada) Large Marine Ecosystem: A Work in Progress. in Breeze, H., D.G. Fenton, R.J. Rutherford and M.A. Silva. 2002. The Scotian Shelf: An Ecological Overview for Ocean Planning. Can. Tech. Rep. Fish. Aquat. Sci. 2393.

Glossary
µPa Micropascal (unit of pressure), usually referenced at 1 m from the sound source
2D 2 Dimensional (of seismic)
3D 3 Dimensional (of seismic)
Acute Of relatively short duration
Barite Barium sulphate- a naturally occurring heavy mineral added to drilling mud as a weighting agent to increase its specific gravity, and thus the hydrostatic head of the mud column
Benthic Relating to organisms living in or on the seabed
Bentonite Naturally occurring clay mineral; used in drilling fluids to increase viscosity
Bioaccumulation The uptake of elements or compounds within organisms
Biodiversity Diversity of species
Biomass Living material; e.g. The total mass of a species or of all living organisms present in a habitat; usually excluding shell mass
Bongo net A round cannister (resembling a bongo drum) with a net at one end used to sample plankton
Cetaceans Aquatic mammals including whales, dolphins and porpoises
cm Centimeters
Condensate Liquid hydrocarbons, sometimes produced along with natural gas
Contaminants Substances which may cause impurity or pollution
Copepod small crustaceans, usually planktonic
Cuttings pile Pile of mainly rock chips deposited on the seabed as a result of drilling
dB Decibel, a log-based unit of pressure - 6 dB represents a doubling of the intensity
Demersal Living at or near the bottom of the sea
Drill cuttings Rock chips produced as a result of drilling

108 Strategic Environmental Assessment for the Misaine Bank Area
Drilling mud Mixture of clays, water and chemicals used to cool and lubricate the drill bit, return rock cuttings to the surface and to exert hydrostatic pressure to maintain well control
ENGO Environmental Non-Governmental Organization
Environmental Effect Any change to the environment of its use
Environmental Impact Assessment Systematic review of the environmental effects a proposed project may have on the surrounding environment
Epifauna Organisms living on the surface of the seabed
Epipelagic Relating to towards the surface of the water column
Exploration well Well drilled to determine whether hydrocarbons are present in a particular area
Flare Controlled burning of gas for pressure relief (or during well testing for disposal of excess gas)
Fugitive emissions Very small chronic escape of gas and liquids from the equipment and pipe work
g Grams (weight measurement)
Gadoid Fish of the cod family
Greenhouse effect Rise in the Earth’s temperature due to infra-red radiation being trapped in the atmosphere by water vapour, carbon dioxide and other gases
Greenhouse gas Gas which contributes to the Greenhouse effect; includes gases such as carbon dioxide and methane
Hydrocarbon Compounds containing only the elements carbon and hydrogen, including oil and natural gas
Hz Hertz (unit of frequency)
km Kilometers
m Meters
Macrofauna Larger benthic fauna, defined as >0.5mm or 1.0 mm in size
Macroinvertebrate Larger, free-floating animals in plankton that can be seen by the naked eye

Strategic Environmental Assessment for the Misaine Bank Area 109
mg Milligrams
Neuston The surface of the ocean
Organic Compounds Materials containing carbon combined with hydrogen, often with other elements
Pelagic Organisms living in the water column of the sea
Phytoplankton Free-floating microscopic plants (algae) including diatoms and dinoflagellates
Plankton Free-floating microscopic organisms
ppm Parts per million
Produced water Water removed from the reservoir along with oil and natural gas
ROV Remote Operated Vehicle, a small, unmanned submersible used to collect video, photographs and samples from the deep sea
SBM Synthetic oil-Based Mud
SEA Strategic Environmental Assessment or Appraisal
Seismic Surveying technique used to determine the structure of the underlying rocks by passing acoustic shock waves into the strata and detecting and measuring the reflected signals. Depending on the spacing of the survey lines, data processing method and temporal elements, the seismic is referred to as either 2-D, 3-D or 4-D.
Shallow gas Gas accumulation present near the surface of the seabed
Sidescan Sonar Side-looking sonar system used to map seabed features
Spud Installation of conductor; the date of commencement of a drilling operation
Thermocline Stable boundary between two layers of water of different temperatures
Venting Release of gas to atmosphere for operational or emergency reasons
Zooplankton Free-floating animals, often microscopic

APPENDIX A
ADDITIONAL INFORMATION FOR THE ENVIRONMENTAL SETTING

Strategic Environmental Assessment for the Misaine Bank Area 111
Figure A–1: January Wind Direction vs. Wind Speed
Table A-1
NE E SE S SW W NW N Total
0 - <5 0.1 0.1 0.1 0.1 0.1 0.1 0.1 0.1 0.6
5 - <10 0.7 0.5 0.8 0.9 1.3 1.4 1.5 1.2 8.2
10 - <15 1.7 1.4 1.3 1.8 2.6 3.8 3.7 2.3 18.5
15 - <20 1.3 1.2 1.4 1.7 3.2 6.4 5.8 2.1 23.3
20 - <25 0.9 1.1 1.0 1.4 3.2 6.7 6.0 1.7 22.0
25 - <30 0.7 1.0 0.9 1.1 1.8 5.1 3.6 0.8 15.0
30 - <35 0.3 0.5 0.5 0.6 0.5 3.0 2.0 0.5 7.9
35 - <40 0.2 0.1 0.3 0.4 0.4 1.2 0.5 0.2 3.3
40 - <45 0.0 0.1 0.1 0.1 0.0 0.5 0.3 0.1 1.1
45 - <50 0.0 0.0 0.0 0.0 0.0 0.1 0.0 0.0 0.1
50 - <55 0.0 0.0 0.0 0.0 0.0 0.0 0.0 0.0 0.0
Total 5.9 5.9 6.4 8.2 13.0 28.2 23.4 8.9 100.0
January Percentage Frequency Occurrence of Wind Speed by DirectionSource: AES40 Grid Point 5467 (45.6250N, 59.1667W) 1954 - 2003
Win
d Sp
eed
(kno
ts)
Wind Direction (blowing from)

112 Strategic Environmental Assessment for the Misaine Bank Area
Figure A–2: February Wind Direction vs. Wind Speed
Table A-2
NE E SE S SW W NW N Total
0 - <5 0.1 0.1 0.1 0.1 0.1 0.2 0.2 0.1 1.1
5 - <10 1.4 1.2 0.9 1.1 1.4 1.9 2.0 1.4 11.3
10 - <15 1.8 1.6 1.7 1.8 2.7 4.5 4.4 3.1 21.5
15 - <20 1.5 1.3 1.3 1.7 3.4 5.9 6.3 2.6 24.0
20 - <25 1.0 1.2 1.0 1.3 2.3 5.8 5.2 1.7 19.5
25 - <30 0.6 0.8 0.7 1.1 1.2 3.9 4.0 0.9 13.0
30 - <35 0.3 0.5 0.6 0.5 0.6 1.8 1.8 0.4 6.5
35 - <40 0.1 0.3 0.4 0.0 0.1 0.7 0.5 0.2 2.3
40 - <45 0.1 0.0 0.0 0.0 0.0 0.2 0.1 0.1 0.6
45 - <50 0.0 0.0 0.0 0.0 0.0 0.1 0.0 0.0 0.2
50 - <55 0.0 0.0 0.0 0.0 0.0 0.0 0.0 0.0 0.0
Total 6.9 6.9 6.8 7.6 11.9 25.0 24.4 10.6 100.0
February Percentage Frequency Occurrence of Wind Speed by DirectionSource: AES40 Grid Point 5467 (45.6250N, 59.1667W) 1954 - 2003
Win
d Sp
eed
(kno
ts)
Wind Direction (blowing from)

Strategic Environmental Assessment for the Misaine Bank Area 113
Figure A–3: March Wind Direction vs. Wind Speed
Table A-3
NE E SE S SW W NW N Total
0 - <5 0.2 0.3 0.3 0.3 0.3 0.4 0.4 0.2 2.4
5 - <10 1.5 1.5 1.5 1.7 2.4 2.1 2.1 2.1 14.9
10 - <15 2.4 1.8 1.9 2.1 3.4 4.1 3.9 3.0 22.5
15 - <20 2.3 1.3 1.6 2.2 3.7 4.9 5.5 3.6 25.1
20 - <25 1.2 1.1 1.3 1.4 2.3 4.1 3.6 2.2 17.2
25 - <30 0.7 0.8 0.9 1.0 1.3 2.4 2.1 0.9 10.1
30 - <35 0.8 0.4 0.6 0.4 0.6 1.3 0.9 0.5 5.6
35 - <40 0.4 0.1 0.2 0.1 0.1 0.4 0.2 0.1 1.5
40 - <45 0.1 0.0 0.1 0.0 0.1 0.1 0.2 0.2 0.7
45 - <50 0.0 0.0 0.0 0.0 0.0 0.0 0.0 0.0 0.1
50 - <55 0.0 0.0 0.0 0.0 0.0 0.0 0.0 0.0 0.0
Total 9.6 7.4 8.3 9.2 14.0 19.9 18.8 12.9 100.0
March Percentage Frequency Occurrence of Wind Speed by DirectionSource: AES40 Grid Point 5467 (45.6250N, 59.1667W) 1954 - 2003
Win
d Sp
eed
(kno
ts)
Wind Direction (blowing from)

114 Strategic Environmental Assessment for the Misaine Bank Area
Figure A–4: April Wind Direction vs. Wind Speed
Table A-4
NE E SE S SW W NW N Total
0 - <5 0.5 0.5 0.6 0.6 1.0 1.0 0.6 0.6 5.4
5 - <10 1.9 2.0 1.9 2.6 3.7 3.7 2.8 2.6 21.1
10 - <15 2.2 2.4 2.2 2.8 4.5 4.9 4.7 3.3 27.0
15 - <20 2.2 2.0 2.0 2.6 3.9 3.8 3.5 3.0 23.0
20 - <25 1.1 1.7 1.4 1.2 2.4 2.7 2.1 1.4 14.0
25 - <30 0.6 0.8 0.8 0.6 0.9 1.2 1.0 0.6 6.5
30 - <35 0.3 0.3 0.2 0.3 0.2 0.3 0.3 0.3 2.2
35 - <40 0.2 0.2 0.1 0.0 0.0 0.1 0.0 0.1 0.8
40 - <45 0.0 0.0 0.0 0.0 0.0 0.1 0.0 0.0 0.1
45 - <50 0.0 0.0 0.0 0.0 0.0 0.0 0.0 0.0 0.1
50 - <55 0.0 0.0 0.0 0.0 0.0 0.0 0.0 0.0 0.0
Total 9.0 10.0 9.2 10.7 16.4 17.7 15.0 12.0 100.0
April Percentage Frequency Occurrence of Wind Speed by DirectionSource: AES40 Grid Point 5467 (45.6250N, 59.1667W) 1954 - 2003
Win
d Sp
eed
(kno
ts)
Wind Direction (blowing from)
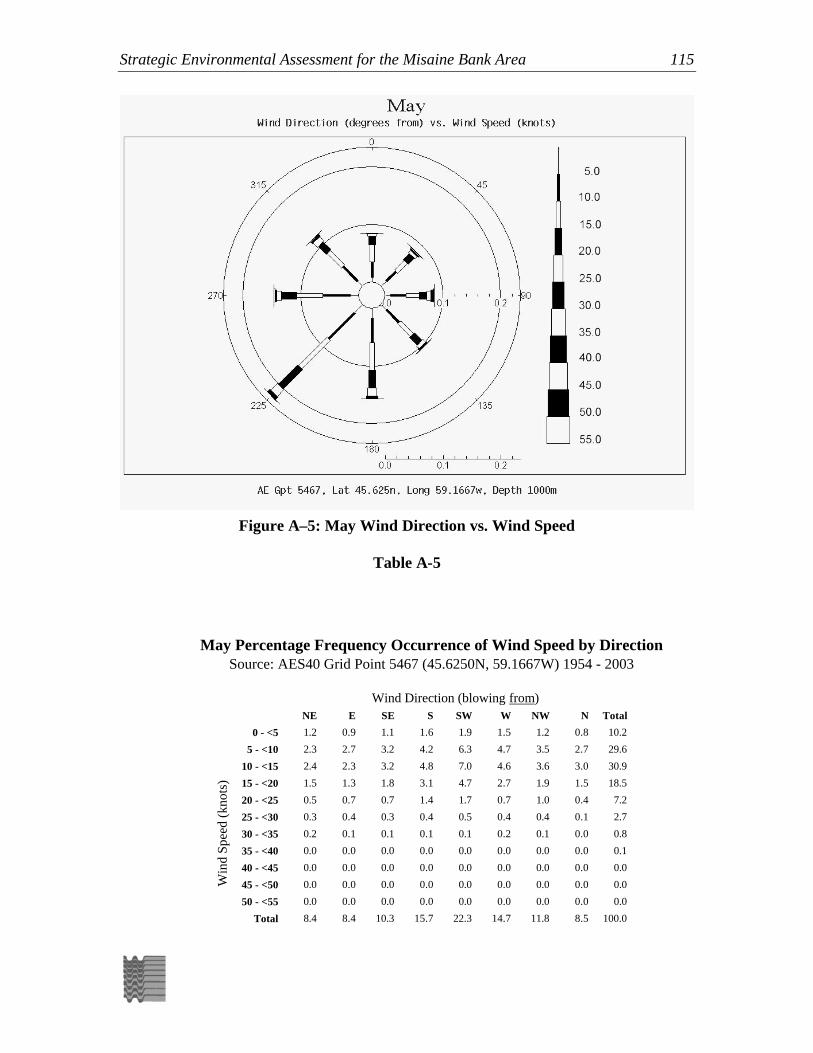
Strategic Environmental Assessment for the Misaine Bank Area 115
Figure A–5: May Wind Direction vs. Wind Speed
Table A-5
NE E SE S SW W NW N Total
0 - <5 1.2 0.9 1.1 1.6 1.9 1.5 1.2 0.8 10.2
5 - <10 2.3 2.7 3.2 4.2 6.3 4.7 3.5 2.7 29.6
10 - <15 2.4 2.3 3.2 4.8 7.0 4.6 3.6 3.0 30.9
15 - <20 1.5 1.3 1.8 3.1 4.7 2.7 1.9 1.5 18.5
20 - <25 0.5 0.7 0.7 1.4 1.7 0.7 1.0 0.4 7.2
25 - <30 0.3 0.4 0.3 0.4 0.5 0.4 0.4 0.1 2.7
30 - <35 0.2 0.1 0.1 0.1 0.1 0.2 0.1 0.0 0.8
35 - <40 0.0 0.0 0.0 0.0 0.0 0.0 0.0 0.0 0.1
40 - <45 0.0 0.0 0.0 0.0 0.0 0.0 0.0 0.0 0.0
45 - <50 0.0 0.0 0.0 0.0 0.0 0.0 0.0 0.0 0.0
50 - <55 0.0 0.0 0.0 0.0 0.0 0.0 0.0 0.0 0.0
Total 8.4 8.4 10.3 15.7 22.3 14.7 11.8 8.5 100.0
May Percentage Frequency Occurrence of Wind Speed by DirectionSource: AES40 Grid Point 5467 (45.6250N, 59.1667W) 1954 - 2003
Win
d Sp
eed
(kno
ts)
Wind Direction (blowing from)

116 Strategic Environmental Assessment for the Misaine Bank Area
Figure A–6: June Wind Direction vs. Wind Speed
Table A-6
NE E SE S SW W NW N Total
0 - <5 1.2 1.0 1.2 1.8 2.2 2.3 1.4 1.4 12.4
5 - <10 2.6 2.1 2.7 5.5 8.1 5.4 3.3 2.6 32.2
10 - <15 1.3 1.7 2.3 5.7 11.6 5.0 2.5 1.6 31.5
15 - <20 0.6 0.7 1.5 3.8 7.1 1.6 1.1 0.5 16.8
20 - <25 0.3 0.4 0.5 1.4 2.1 0.5 0.4 0.1 5.7
25 - <30 0.1 0.1 0.1 0.3 0.3 0.1 0.1 0.1 1.3
30 - <35 0.0 0.0 0.0 0.0 0.0 0.0 0.1 0.0 0.2
35 - <40 0.0 0.0 0.0 0.0 0.0 0.0 0.0 0.0 0.0
40 - <45 0.0 0.0 0.0 0.0 0.0 0.0 0.0 0.0 0.0
45 - <50 0.0 0.0 0.0 0.0 0.0 0.0 0.0 0.0 0.0
50 - <55 0.0 0.0 0.0 0.0 0.0 0.0 0.0 0.0 0.0
Total 6.1 5.9 8.3 18.4 31.4 14.7 9.0 6.3 100.0
June Percentage Frequency Occurrence of Wind Speed by DirectionSource: AES40 Grid Point 5467 (45.6250N, 59.1667W) 1954 - 2003
Win
d Sp
eed
(kno
ts)
Wind Direction (blowing from)

Strategic Environmental Assessment for the Misaine Bank Area 117
Figure A–7: July Wind Direction vs. Wind Speed
Table A-7
NE E SE S SW W NW N Total
0 - <5 0.6 0.5 1.1 2.3 3.1 2.3 1.2 0.7 11.8
5 - <10 1.1 1.1 3.1 6.9 10.5 6.6 2.6 1.5 33.3
10 - <15 0.4 1.1 2.4 7.1 14.2 5.1 2.2 0.7 33.2
15 - <20 0.2 0.5 0.8 4.8 8.2 1.7 0.5 0.3 17.0
20 - <25 0.1 0.1 0.2 1.2 1.8 0.2 0.2 0.1 3.9
25 - <30 0.0 0.0 0.1 0.3 0.2 0.1 0.1 0.1 0.8
30 - <35 0.0 0.0 0.0 0.0 0.0 0.0 0.0 0.0 0.1
35 - <40 0.0 0.0 0.0 0.0 0.0 0.0 0.0 0.0 0.0
40 - <45 0.0 0.0 0.0 0.0 0.0 0.0 0.0 0.0 0.0
45 - <50 0.0 0.0 0.0 0.0 0.0 0.0 0.0 0.0 0.0
50 - <55 0.0 0.0 0.0 0.0 0.0 0.0 0.0 0.0 0.0
Total 2.4 3.3 7.7 22.6 37.9 16.0 6.8 3.3 100.0
July Percentage Frequency Occurrence of Wind Speed by DirectionSource: AES40 Grid Point 5467 (45.6250N, 59.1667W) 1954 - 2003
Win
d Sp
eed
(kno
ts)
Wind Direction (blowing from)

118 Strategic Environmental Assessment for the Misaine Bank Area
Figure A–8: August Wind Direction vs. Wind Speed
Table A-8
NE E SE S SW W NW N Total
0 - <5 0.4 0.7 0.6 1.4 1.8 1.7 0.9 0.7 8.1
5 - <10 1.1 1.5 2.3 5.3 8.9 6.7 3.1 1.6 30.6
10 - <15 1.1 1.1 2.4 6.5 13.2 7.0 3.3 1.5 36.1
15 - <20 0.4 0.7 0.9 3.3 7.6 3.1 1.8 0.9 18.7
20 - <25 0.3 0.2 0.4 0.7 1.7 0.8 0.6 0.3 5.0
25 - <30 0.1 0.1 0.0 0.3 0.2 0.4 0.2 0.1 1.3
30 - <35 0.1 0.0 0.0 0.0 0.1 0.0 0.0 0.0 0.2
35 - <40 0.0 0.0 0.0 0.0 0.0 0.0 0.0 0.0 0.0
40 - <45 0.0 0.0 0.0 0.0 0.0 0.0 0.0 0.0 0.0
45 - <50 0.0 0.0 0.0 0.0 0.0 0.0 0.0 0.0 0.0
50 - <55 0.0 0.0 0.0 0.0 0.0 0.0 0.0 0.0 0.0
Total 3.5 4.3 6.6 17.5 33.5 19.7 9.9 5.0 100.0
August Percentage Frequency Occurrence of Wind Speed by DirectionSource: AES40 Grid Point 5467 (45.6250N, 59.1667W) 1954 - 2003
Win
d Sp
eed
(kno
ts)
Wind Direction (blowing from)

Strategic Environmental Assessment for the Misaine Bank Area 119
Figure A–9: September Wind Direction vs. Wind Speed
Table A-9
NE E SE S SW W NW N Total
0 - <5 0.2 0.4 0.5 0.7 0.5 0.4 0.6 0.5 3.9
5 - <10 1.9 1.6 2.2 3.5 5.5 4.3 3.4 2.7 25.0
10 - <15 2.1 1.8 2.0 4.8 7.1 6.8 4.4 2.9 32.0
15 - <20 0.9 0.9 1.4 3.2 5.5 4.2 4.0 2.2 22.3
20 - <25 0.4 0.5 0.7 1.7 2.8 2.2 2.3 0.9 11.4
25 - <30 0.2 0.2 0.2 0.4 1.0 0.9 1.0 0.3 4.2
30 - <35 0.1 0.1 0.1 0.1 0.1 0.3 0.3 0.1 1.0
35 - <40 0.0 0.0 0.0 0.1 0.0 0.1 0.0 0.0 0.2
40 - <45 0.0 0.0 0.0 0.0 0.0 0.0 0.0 0.0 0.0
45 - <50 0.0 0.0 0.0 0.0 0.0 0.0 0.0 0.0 0.0
50 - <55 0.0 0.0 0.0 0.0 0.0 0.0 0.0 0.0 0.0
Total 5.8 5.4 7.0 14.4 22.6 19.2 15.9 9.6 100.0
September Percentage Frequency Occurrence of Wind Speed by DirectionSource: AES40 Grid Point 5467 (45.6250N, 59.1667W) 1954 - 2003
Win
d Sp
eed
(kno
ts)
Wind Direction (blowing from)

120 Strategic Environmental Assessment for the Misaine Bank Area
Figure A–10: October Wind Direction vs. Wind Speed
Table A-10
NE E SE S SW W NW N Total
0 - <5 0.2 0.2 0.4 0.3 0.3 0.3 0.2 0.2 2.0
5 - <10 1.0 1.3 1.5 2.0 3.0 2.9 2.3 1.7 15.6
10 - <15 1.6 1.4 2.5 3.3 5.2 5.3 3.9 2.9 26.0
15 - <20 1.5 0.7 1.7 2.9 5.1 6.5 4.6 3.2 26.4
20 - <25 0.8 0.7 1.4 1.7 3.4 4.7 3.6 2.2 18.4
25 - <30 0.4 0.3 0.7 0.8 0.8 2.3 1.8 0.8 8.0
30 - <35 0.1 0.2 0.3 0.3 0.2 0.8 0.6 0.1 2.5
35 - <40 0.1 0.0 0.1 0.0 0.1 0.3 0.2 0.1 0.9
40 - <45 0.1 0.0 0.0 0.0 0.0 0.0 0.0 0.0 0.1
45 - <50 0.1 0.0 0.0 0.0 0.0 0.0 0.0 0.0 0.1
50 - <55 0.0 0.0 0.0 0.0 0.0 0.0 0.0 0.0 0.0
Total 5.9 4.7 8.6 11.3 18.1 23.3 17.1 11.1 100.0
October Percentage Frequency Occurrence of Wind Speed by DirectionSource: AES40 Grid Point 5467 (45.6250N, 59.1667W) 1954 - 2003
Win
d Sp
eed
(kno
ts)
Wind Direction (blowing from)

Strategic Environmental Assessment for the Misaine Bank Area 121
Figure A–11: November Wind Direction vs. Wind Speed
Table A-11
NE E SE S SW W NW N Total
0 - <5 0.1 0.2 0.2 0.1 0.2 0.1 0.1 0.0 1.0
5 - <10 1.1 0.9 0.8 1.3 1.6 1.8 2.0 1.5 10.9
10 - <15 1.5 1.8 2.3 2.8 4.2 4.8 3.5 2.4 23.3
15 - <20 1.7 1.8 2.0 2.8 4.0 5.5 4.4 2.6 24.7
20 - <25 1.1 1.2 1.1 2.5 2.8 5.6 4.1 1.9 20.3
25 - <30 0.6 0.6 0.9 1.4 1.3 3.3 3.3 0.8 12.2
30 - <35 0.1 0.3 0.4 0.5 0.5 1.9 1.4 0.3 5.4
35 - <40 0.1 0.1 0.1 0.2 0.2 0.6 0.4 0.2 1.8
40 - <45 0.0 0.0 0.0 0.0 0.0 0.1 0.1 0.1 0.5
45 - <50 0.0 0.0 0.0 0.0 0.0 0.0 0.0 0.0 0.1
50 - <55 0.0 0.0 0.0 0.0 0.0 0.0 0.0 0.0 0.0
Total 6.4 6.8 7.8 11.6 14.7 23.6 19.3 9.7 100.0
November Percentage Frequency Occurrence of Wind Speed by DirectionSource: AES40 Grid Point 5467 (45.6250N, 59.1667W) 1954 - 2003
Win
d Sp
eed
(kno
ts)
Wind Direction (blowing from)

122 Strategic Environmental Assessment for the Misaine Bank Area
Figure A–12: December Wind Direction vs. Wind Speed
Table A-12
NE E SE S SW W NW N Total
0 - <5 0.0 0.1 0.0 0.1 0.0 0.1 0.1 0.0 0.4
5 - <10 1.0 0.9 0.8 1.1 1.4 1.7 1.2 1.2 9.3
10 - <15 1.6 1.1 1.6 2.1 2.6 4.4 3.0 2.2 18.6
15 - <20 1.3 1.3 1.5 2.1 3.0 5.7 5.6 2.4 22.9
20 - <25 0.9 0.9 1.4 1.8 2.8 6.6 5.6 1.9 21.8
25 - <30 0.5 0.7 1.1 1.4 1.7 4.6 3.6 0.9 14.5
30 - <35 0.3 0.4 1.0 0.5 0.6 3.1 1.9 0.4 8.3
35 - <40 0.1 0.1 0.4 0.3 0.3 1.4 0.7 0.1 3.4
40 - <45 0.0 0.1 0.1 0.0 0.1 0.4 0.2 0.1 1.0
45 - <50 0.0 0.0 0.0 0.0 0.0 0.0 0.0 0.0 0.1
50 - <55 0.0 0.0 0.0 0.0 0.0 0.0 0.0 0.0 0.0
Total 5.7 5.5 7.8 9.3 12.6 28.1 21.9 9.3 100.0
December Percentage Frequency Occurrence of Wind Speed by DirectionSource: AES40 Grid Point 5467 (45.6250N, 59.1667W) 1954 - 2003
Win
d Sp
eed
(kno
ts)
Wind Direction (blowing from)

Strategic Environmental Assessment for the Misaine Bank Area 123
Figure A–13: January Wave Direction vs. Wave Height
Table A-13
NE E SE S SW W NW N Total
0.0 - <1.0 0.5 0.3 0.3 0.3 0.3 0.2 0.2 0.4 2.3
1.0 - <2.0 4.0 5.9 5.8 2.9 2.0 1.5 1.6 2.9 26.5
2.0 - <3.0 4.6 9.4 7.2 3.1 2.0 1.8 2.0 2.1 32.2
3.0 - <4.0 2.7 7.0 4.3 1.7 1.0 1.4 0.9 1.5 20.5
4.0 - <5.0 2.0 3.6 1.5 0.7 0.6 0.6 0.6 1.3 10.8
5.0 - <6.0 1.1 1.2 0.6 0.3 0.3 0.4 0.4 0.7 4.8
6.0 - <7.0 0.4 0.5 0.1 0.2 0.2 0.2 0.2 0.4 2.1
7.0 - <8.0 0.1 0.3 0.1 0.1 0.0 0.0 0.0 0.1 0.6
8.0 - <9.0 0.1 0.1 0.0 0.0 0.0 0.0 0.0 0.1 0.3
9.0 - <10.0 0.0 0.0 0.0 0.0 0.0 0.0 0.0 0.0 0.0
10.0 - <11.0 0.0 0.0 0.0 0.0 0.0 0.0 0.0 0.0 0.0
11.0 - <12.0 0.0 0.0 0.0 0.0 0.0 0.0 0.0 0.0 0.0
Total 15.5 28.2 19.8 9.2 6.3 6.0 5.9 9.3 100.0
Source: AES40 Grid Point 5467 (45.6250N, 59.1667W) 1954 - 2003
Wave Direction (travelling to)
January Percentage Frequency Occurrence of Wave Height by Direction
Sign
ific
ant W
ave
Hei
ght (
met
res)

124 Strategic Environmental Assessment for the Misaine Bank Area
Figure A–14: February Wave Direction vs. Wave Height
Table A-14
NE E SE S SW W NW N Total
0.0 - <1.0 0.6 0.6 0.6 0.4 0.4 0.4 0.4 0.3 3.7
1.0 - <2.0 4.3 6.3 7.1 3.6 2.6 2.2 2.2 2.5 30.8
2.0 - <3.0 3.6 9.1 6.8 3.6 2.8 2.2 2.1 2.3 32.4
3.0 - <4.0 2.9 5.6 3.4 1.7 1.1 1.5 1.2 1.4 18.7
4.0 - <5.0 1.8 2.4 1.3 0.6 0.6 0.7 0.6 1.2 9.2
5.0 - <6.0 0.5 0.6 0.4 0.4 0.2 0.2 0.5 0.6 3.4
6.0 - <7.0 0.2 0.3 0.1 0.2 0.1 0.1 0.1 0.1 1.1
7.0 - <8.0 0.2 0.1 0.0 0.0 0.1 0.1 0.1 0.0 0.6
8.0 - <9.0 0.0 0.0 0.0 0.0 0.0 0.1 0.0 0.0 0.1
9.0 - <10.0 0.1 0.0 0.0 0.0 0.0 0.0 0.0 0.0 0.1
10.0 - <11.0 0.0 0.0 0.0 0.0 0.0 0.0 0.0 0.0 0.0
11.0 - <12.0 0.0 0.0 0.0 0.0 0.0 0.0 0.0 0.0 0.0
Total 14.1 24.9 19.7 10.4 7.8 7.4 7.2 8.6 100.0
Source: AES40 Grid Point 5467 (45.6250N, 59.1667W) 1954 - 2003
Wave Direction (travelling to)
February Percentage Frequency Occurrence of Wave Height by Direction
Sign
ific
ant W
ave
Hei
ght (
met
res)

Strategic Environmental Assessment for the Misaine Bank Area 125
Figure A–15: March Wave Direction vs. Wave Height
Table A-15
NE E SE S SW W NW N Total
0.0 - <1.0 0.8 0.8 0.7 0.8 0.8 0.7 0.8 0.6 6.0
1.0 - <2.0 4.7 5.6 6.2 4.6 3.9 2.9 2.6 4.0 34.6
2.0 - <3.0 4.3 6.3 5.2 4.3 3.5 2.1 2.0 2.4 30.0
3.0 - <4.0 3.4 3.9 1.9 1.6 1.6 1.1 1.6 1.7 16.8
4.0 - <5.0 1.3 1.4 0.6 0.6 0.9 1.0 0.9 0.7 7.4
5.0 - <6.0 0.5 0.5 0.1 0.3 0.5 0.2 0.5 0.5 3.1
6.0 - <7.0 0.4 0.2 0.1 0.0 0.4 0.2 0.2 0.2 1.6
7.0 - <8.0 0.0 0.0 0.0 0.0 0.2 0.0 0.0 0.1 0.3
8.0 - <9.0 0.0 0.0 0.0 0.0 0.2 0.0 0.0 0.0 0.2
9.0 - <10.0 0.0 0.0 0.0 0.0 0.0 0.0 0.0 0.0 0.0
10.0 - <11.0 0.0 0.0 0.0 0.0 0.0 0.0 0.0 0.0 0.0
11.0 - <12.0 0.0 0.0 0.0 0.0 0.0 0.0 0.0 0.0 0.0
Total 15.4 18.8 14.8 12.2 12.0 8.1 8.5 10.3 100.0
Source: AES40 Grid Point 5467 (45.6250N, 59.1667W) 1954 - 2003
Wave Direction (travelling to)
March Percentage Frequency Occurrence of Wave Height by Direction
Sign
ific
ant W
ave
Hei
ght (
met
res)

126 Strategic Environmental Assessment for the Misaine Bank Area
Figure A–16: April Wave Direction vs. Wave Height
Table A-16
NE E SE S SW W NW N Total
0.0 - <1.0 2.1 1.6 1.3 1.2 1.2 0.7 0.7 1.2 10.0
1.0 - <2.0 7.9 8.3 6.9 5.8 3.3 3.5 3.5 5.3 44.4
2.0 - <3.0 5.3 4.0 3.4 3.5 2.6 2.9 3.2 3.6 28.4
3.0 - <4.0 2.1 1.8 1.1 1.1 1.4 1.0 1.3 1.4 11.2
4.0 - <5.0 1.1 0.5 0.2 0.2 0.4 0.6 0.3 0.5 3.8
5.0 - <6.0 0.3 0.2 0.0 0.1 0.2 0.2 0.2 0.2 1.4
6.0 - <7.0 0.1 0.0 0.0 0.0 0.2 0.2 0.1 0.0 0.6
7.0 - <8.0 0.0 0.0 0.0 0.0 0.0 0.1 0.0 0.0 0.1
8.0 - <9.0 0.0 0.0 0.0 0.0 0.0 0.0 0.0 0.0 0.0
9.0 - <10.0 0.0 0.0 0.0 0.0 0.0 0.0 0.0 0.0 0.0
10.0 - <11.0 0.0 0.0 0.0 0.0 0.0 0.0 0.0 0.0 0.0
11.0 - <12.0 0.0 0.0 0.0 0.0 0.0 0.0 0.0 0.0 0.0
Total 18.8 16.5 13.0 11.9 9.3 9.2 9.2 12.3 100.0
Source: AES40 Grid Point 5467 (45.6250N, 59.1667W) 1954 - 2003
Wave Direction (travelling to)
April Percentage Frequency Occurrence of Wave Height by Direction
Sign
ific
ant W
ave
Hei
ght (
met
res)

Strategic Environmental Assessment for the Misaine Bank Area 127
Figure A–17: May Wave Direction vs. Wave Height
Table A-17
NE E SE S SW W NW N Total
0.0 - <1.0 3.8 2.7 2.4 1.4 1.4 1.3 1.6 3.4 18.0
1.0 - <2.0 13.7 7.7 5.8 5.2 4.6 4.3 6.8 10.2 58.2
2.0 - <3.0 4.5 1.9 1.5 1.2 1.7 1.8 1.5 3.2 17.2
3.0 - <4.0 1.2 0.4 0.4 0.3 0.3 0.7 0.4 1.1 4.8
4.0 - <5.0 0.4 0.2 0.1 0.0 0.2 0.2 0.2 0.3 1.5
5.0 - <6.0 0.0 0.0 0.0 0.0 0.0 0.1 0.0 0.0 0.2
6.0 - <7.0 0.0 0.0 0.0 0.0 0.0 0.0 0.0 0.0 0.1
7.0 - <8.0 0.0 0.0 0.0 0.0 0.0 0.0 0.0 0.0 0.0
8.0 - <9.0 0.0 0.0 0.0 0.0 0.0 0.0 0.0 0.0 0.0
9.0 - <10.0 0.0 0.0 0.0 0.0 0.0 0.0 0.0 0.0 0.0
10.0 - <11.0 0.0 0.0 0.0 0.0 0.0 0.0 0.0 0.0 0.0
11.0 - <12.0 0.0 0.0 0.0 0.0 0.0 0.0 0.0 0.0 0.0
Total 23.6 12.8 10.3 8.1 8.2 8.4 10.4 18.2 100.0
Source: AES40 Grid Point 5467 (45.6250N, 59.1667W) 1954 - 2003
Wave Direction (travelling to)
May Percentage Frequency Occurrence of Wave Height by Direction
Sign
ific
ant W
ave
Hei
ght (
met
res)

128 Strategic Environmental Assessment for the Misaine Bank Area
Figure A–18: June Wave Direction vs. Wave Height
Table A-18
NE E SE S SW W NW N Total
0.0 - <1.0 4.6 3.1 1.6 1.4 1.4 1.9 2.1 5.1 21.1
1.0 - <2.0 21.9 8.0 5.1 3.6 3.5 3.6 4.9 12.3 62.7
2.0 - <3.0 5.1 1.5 0.8 0.5 0.6 0.6 1.2 3.0 13.4
3.0 - <4.0 0.6 0.2 0.1 0.1 0.2 0.1 0.3 0.8 2.5
4.0 - <5.0 0.1 0.0 0.0 0.1 0.0 0.0 0.0 0.1 0.3
5.0 - <6.0 0.0 0.0 0.0 0.0 0.0 0.0 0.0 0.0 0.0
6.0 - <7.0 0.0 0.0 0.0 0.0 0.0 0.0 0.0 0.0 0.0
7.0 - <8.0 0.0 0.0 0.0 0.0 0.0 0.0 0.0 0.0 0.0
8.0 - <9.0 0.0 0.0 0.0 0.0 0.0 0.0 0.0 0.0 0.0
9.0 - <10.0 0.0 0.0 0.0 0.0 0.0 0.0 0.0 0.0 0.0
10.0 - <11.0 0.0 0.0 0.0 0.0 0.0 0.0 0.0 0.0 0.0
11.0 - <12.0 0.0 0.0 0.0 0.0 0.0 0.0 0.0 0.0 0.0
Total 32.3 12.8 7.6 5.6 5.8 6.1 8.5 21.3 100.0
Source: AES40 Grid Point 5467 (45.6250N, 59.1667W) 1954 - 2003
Wave Direction (travelling to)
June Percentage Frequency Occurrence of Wave Height by Direction
Sign
ific
ant W
ave
Hei
ght (
met
res)

Strategic Environmental Assessment for the Misaine Bank Area 129
Figure A–19: July Wave Direction vs. Wave Height
Table A-19
NE E SE S SW W NW N Total
0.0 - <1.0 6.5 2.6 1.3 0.7 0.6 0.7 1.9 5.8 20.2
1.0 - <2.0 28.0 9.1 4.0 1.9 1.3 1.7 4.3 16.1 66.4
2.0 - <3.0 5.3 0.9 0.4 0.3 0.2 0.6 0.7 3.6 12.0
3.0 - <4.0 0.4 0.1 0.1 0.0 0.0 0.0 0.1 0.6 1.3
4.0 - <5.0 0.1 0.0 0.0 0.0 0.0 0.0 0.0 0.1 0.2
5.0 - <6.0 0.0 0.0 0.0 0.0 0.0 0.0 0.0 0.0 0.1
6.0 - <7.0 0.0 0.0 0.0 0.0 0.0 0.0 0.0 0.0 0.0
7.0 - <8.0 0.0 0.0 0.0 0.0 0.0 0.0 0.0 0.0 0.0
8.0 - <9.0 0.0 0.0 0.0 0.0 0.0 0.0 0.0 0.0 0.0
9.0 - <10.0 0.0 0.0 0.0 0.0 0.0 0.0 0.0 0.0 0.0
10.0 - <11.0 0.0 0.0 0.0 0.0 0.0 0.0 0.0 0.0 0.0
11.0 - <12.0 0.0 0.0 0.0 0.0 0.0 0.0 0.0 0.0 0.0
Total 40.3 12.5 5.8 2.9 2.1 3.1 7.1 26.2 100.0
Source: AES40 Grid Point 5467 (45.6250N, 59.1667W) 1954 - 2003
Wave Direction (travelling to)
July Percentage Frequency Occurrence of Wave Height by Direction
Sign
ific
ant W
ave
Hei
ght (
met
res)

130 Strategic Environmental Assessment for the Misaine Bank Area
Figure A–20: August Wave Direction vs. Wave Height
Table A-20
NE E SE S SW W NW N Total
0.0 - <1.0 5.7 3.3 1.7 0.6 0.5 0.9 1.8 4.3 18.6
1.0 - <2.0 25.3 11.3 6.1 3.2 2.0 2.2 4.3 12.6 67.0
2.0 - <3.0 4.5 1.9 1.1 0.9 0.4 0.7 0.8 2.0 12.3
3.0 - <4.0 0.5 0.4 0.1 0.1 0.2 0.2 0.1 0.2 1.7
4.0 - <5.0 0.2 0.0 0.0 0.0 0.1 0.0 0.0 0.0 0.3
5.0 - <6.0 0.0 0.0 0.0 0.0 0.0 0.0 0.0 0.0 0.0
6.0 - <7.0 0.0 0.0 0.0 0.0 0.0 0.0 0.0 0.0 0.1
7.0 - <8.0 0.0 0.0 0.0 0.0 0.0 0.0 0.0 0.0 0.0
8.0 - <9.0 0.0 0.0 0.0 0.0 0.0 0.0 0.0 0.0 0.0
9.0 - <10.0 0.0 0.0 0.0 0.0 0.0 0.0 0.0 0.0 0.0
10.0 - <11.0 0.0 0.0 0.0 0.0 0.0 0.0 0.0 0.0 0.0
11.0 - <12.0 0.0 0.0 0.0 0.0 0.0 0.0 0.0 0.0 0.0
Total 36.2 16.9 8.9 4.8 3.1 4.0 7.0 19.2 100.0
Source: AES40 Grid Point 5467 (45.6250N, 59.1667W) 1954 - 2003
Wave Direction (travelling to)
August Percentage Frequency Occurrence of Wave Height by Direction
Sign
ific
ant W
ave
Hei
ght (
met
res)

Strategic Environmental Assessment for the Misaine Bank Area 131
Figure A–21: September Wave Direction vs. Wave Height
Table A-21
NE E SE S SW W NW N Total
0.0 - <1.0 3.4 1.7 1.6 1.3 1.0 1.0 1.5 2.1 13.4
1.0 - <2.0 13.5 10.4 7.8 5.7 2.9 3.1 3.7 8.5 55.5
2.0 - <3.0 6.1 4.4 4.4 1.9 1.0 1.1 1.5 3.4 23.8
3.0 - <4.0 1.5 0.8 0.9 0.5 0.3 0.5 0.4 0.7 5.7
4.0 - <5.0 0.3 0.1 0.1 0.1 0.2 0.1 0.0 0.2 1.1
5.0 - <6.0 0.1 0.1 0.0 0.1 0.1 0.1 0.0 0.0 0.4
6.0 - <7.0 0.0 0.0 0.0 0.0 0.1 0.0 0.0 0.0 0.1
7.0 - <8.0 0.0 0.0 0.0 0.0 0.0 0.0 0.0 0.0 0.0
8.0 - <9.0 0.0 0.0 0.0 0.0 0.0 0.0 0.0 0.0 0.0
9.0 - <10.0 0.0 0.0 0.0 0.0 0.0 0.0 0.0 0.0 0.0
10.0 - <11.0 0.0 0.0 0.0 0.0 0.0 0.0 0.0 0.0 0.0
11.0 - <12.0 0.0 0.0 0.0 0.0 0.0 0.0 0.0 0.0 0.0
Total 24.9 17.6 14.8 9.5 5.4 5.9 7.0 14.8 100.0
Source: AES40 Grid Point 5467 (45.6250N, 59.1667W) 1954 - 2003
Wave Direction (travelling to)
September Percentage Frequency Occurrence of Wave Height by Direction
Sign
ific
ant W
ave
Hei
ght (
met
res)

132 Strategic Environmental Assessment for the Misaine Bank Area
Figure A–22: October Wave Direction vs. Wave Height
Table A-22
NE E SE S SW W NW N Total
0.0 - <1.0 1.7 1.3 0.8 0.7 0.5 0.7 1.0 1.5 8.1
1.0 - <2.0 9.9 9.6 7.4 5.5 2.8 1.9 4.1 5.6 46.8
2.0 - <3.0 6.2 7.0 4.9 3.7 1.6 1.0 2.0 3.0 29.3
3.0 - <4.0 2.3 3.0 1.6 0.9 0.7 0.5 1.0 1.2 11.2
4.0 - <5.0 0.7 0.7 0.3 0.1 0.3 0.1 0.2 0.5 3.0
5.0 - <6.0 0.2 0.3 0.1 0.1 0.2 0.0 0.2 0.1 1.1
6.0 - <7.0 0.1 0.1 0.0 0.0 0.0 0.0 0.0 0.1 0.3
7.0 - <8.0 0.0 0.0 0.0 0.0 0.0 0.0 0.0 0.0 0.1
8.0 - <9.0 0.0 0.0 0.0 0.0 0.0 0.0 0.0 0.0 0.1
9.0 - <10.0 0.0 0.0 0.0 0.0 0.0 0.0 0.0 0.0 0.1
10.0 - <11.0 0.0 0.0 0.0 0.0 0.0 0.0 0.0 0.0 0.0
11.0 - <12.0 0.0 0.0 0.0 0.0 0.0 0.0 0.0 0.0 0.0
Total 21.0 21.9 15.1 10.9 6.2 4.4 8.5 12.0 100.0
Source: AES40 Grid Point 5467 (45.6250N, 59.1667W) 1954 - 2003
Wave Direction (travelling to)
October Percentage Frequency Occurrence of Wave Height by Direction
Sign
ific
ant W
ave
Hei
ght (
met
res)
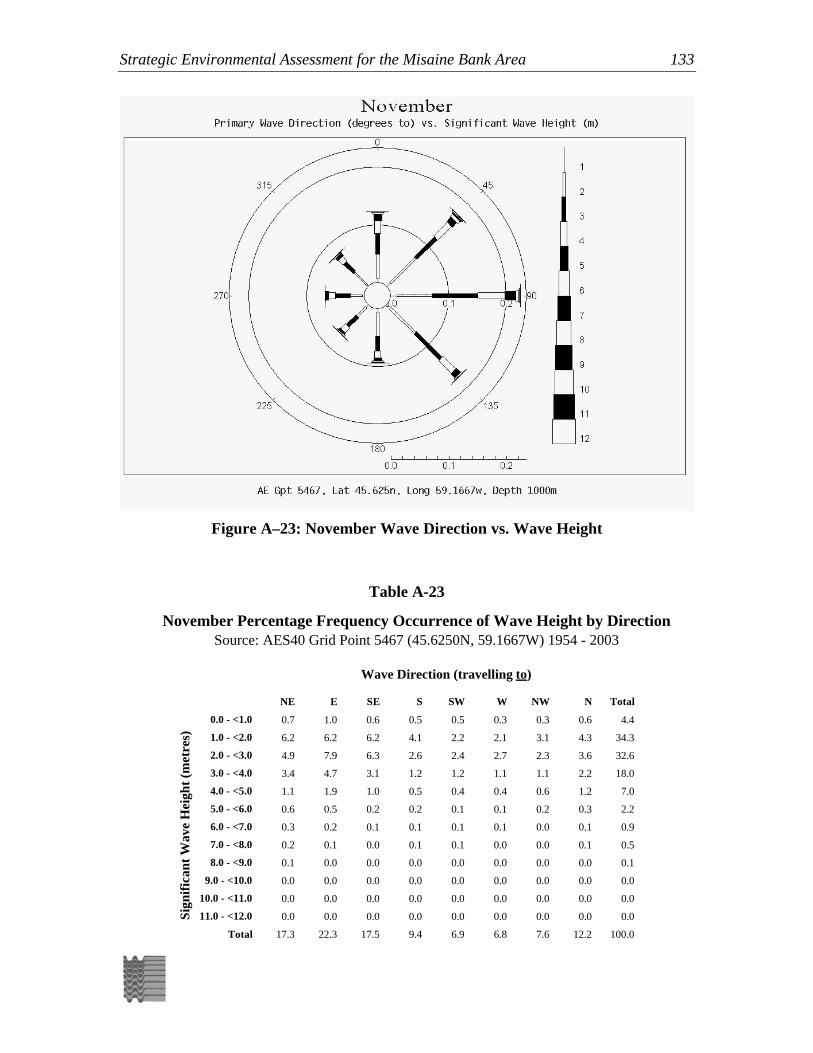
Strategic Environmental Assessment for the Misaine Bank Area 133
Figure A–23: November Wave Direction vs. Wave Height
Table A-23
NE E SE S SW W NW N Total
0.0 - <1.0 0.7 1.0 0.6 0.5 0.5 0.3 0.3 0.6 4.4
1.0 - <2.0 6.2 6.2 6.2 4.1 2.2 2.1 3.1 4.3 34.3
2.0 - <3.0 4.9 7.9 6.3 2.6 2.4 2.7 2.3 3.6 32.6
3.0 - <4.0 3.4 4.7 3.1 1.2 1.2 1.1 1.1 2.2 18.0
4.0 - <5.0 1.1 1.9 1.0 0.5 0.4 0.4 0.6 1.2 7.0
5.0 - <6.0 0.6 0.5 0.2 0.2 0.1 0.1 0.2 0.3 2.2
6.0 - <7.0 0.3 0.2 0.1 0.1 0.1 0.1 0.0 0.1 0.9
7.0 - <8.0 0.2 0.1 0.0 0.1 0.1 0.0 0.0 0.1 0.5
8.0 - <9.0 0.1 0.0 0.0 0.0 0.0 0.0 0.0 0.0 0.1
9.0 - <10.0 0.0 0.0 0.0 0.0 0.0 0.0 0.0 0.0 0.0
10.0 - <11.0 0.0 0.0 0.0 0.0 0.0 0.0 0.0 0.0 0.0
11.0 - <12.0 0.0 0.0 0.0 0.0 0.0 0.0 0.0 0.0 0.0
Total 17.3 22.3 17.5 9.4 6.9 6.8 7.6 12.2 100.0
Source: AES40 Grid Point 5467 (45.6250N, 59.1667W) 1954 - 2003
Wave Direction (travelling to)
November Percentage Frequency Occurrence of Wave Height by Direction
Sign
ific
ant W
ave
Hei
ght (
met
res)
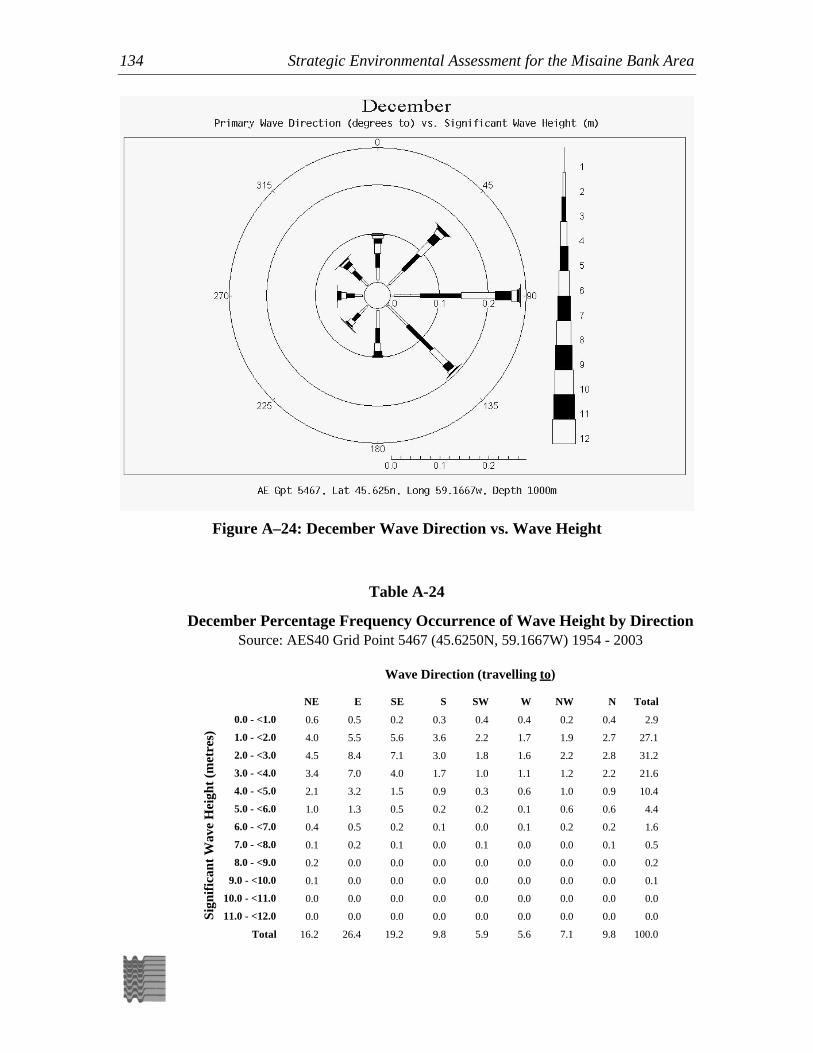
134 Strategic Environmental Assessment for the Misaine Bank Area
Figure A–24: December Wave Direction vs. Wave Height
Table A-24
NE E SE S SW W NW N Total
0.0 - <1.0 0.6 0.5 0.2 0.3 0.4 0.4 0.2 0.4 2.9
1.0 - <2.0 4.0 5.5 5.6 3.6 2.2 1.7 1.9 2.7 27.1
2.0 - <3.0 4.5 8.4 7.1 3.0 1.8 1.6 2.2 2.8 31.2
3.0 - <4.0 3.4 7.0 4.0 1.7 1.0 1.1 1.2 2.2 21.6
4.0 - <5.0 2.1 3.2 1.5 0.9 0.3 0.6 1.0 0.9 10.4
5.0 - <6.0 1.0 1.3 0.5 0.2 0.2 0.1 0.6 0.6 4.4
6.0 - <7.0 0.4 0.5 0.2 0.1 0.0 0.1 0.2 0.2 1.6
7.0 - <8.0 0.1 0.2 0.1 0.0 0.1 0.0 0.0 0.1 0.5
8.0 - <9.0 0.2 0.0 0.0 0.0 0.0 0.0 0.0 0.0 0.2
9.0 - <10.0 0.1 0.0 0.0 0.0 0.0 0.0 0.0 0.0 0.1
10.0 - <11.0 0.0 0.0 0.0 0.0 0.0 0.0 0.0 0.0 0.0
11.0 - <12.0 0.0 0.0 0.0 0.0 0.0 0.0 0.0 0.0 0.0
Total 16.2 26.4 19.2 9.8 5.9 5.6 7.1 9.8 100.0
Source: AES40 Grid Point 5467 (45.6250N, 59.1667W) 1954 - 2003
Wave Direction (travelling to)
December Percentage Frequency Occurrence of Wave Height by Direction
Sign
ific
ant W
ave
Hei
ght (
met
res)

Strategic Environmental Assessment for the Misaine Bank Area 135
Table A-25: Average Numbers of Fish larvae by Month within the Misaine SEA Area (individuals/m3)
Species Jan. Feb. March April May June July Aug. Sept. Oct. Nov. Dec.
BOTHUS 0.000 0.000 0.000 0.000 0.000 0.000 0.000 0.000 0.000 0.000 0.000 0.000
COD 0.000 0.001 0.000 0.000 0.000 0.001 0.000 0.000 0.000 0.000 0.003 0.000
HADDOCK 0.000 0.000 0.000 0.000 0.000 0.000 0.001 0.000 0.000 0.000 0.000 0.000
W_HAKE 0.000 0.000 0.000 0.000 0.000 0.001 0.000 0.002 0.002 0.000 0.000 0.000
R_HAKE 0.000 0.000 0.000 0.000 0.000 0.000 0.000 0.001 0.009 0.000 0.001 0.000
S_HAKE 0.000 0.000 0.000 0.000 0.000 0.000 0.000 0.002 0.011 0.004 0.001 0.000
CUSK 0.000 0.000 0.000 0.000 0.000 0.000 0.000 0.000 0.000 0.000 0.000 0.000
POLLOCK 0.000 0.000 0.000 0.000 0.000 0.001 0.000 0.000 0.000 0.000 0.000 0.000
OS_HAKE 0.000 0.000 0.000 0.000 0.000 0.000 0.000 0.000 0.000 0.000 0.000 0.000
REDFISH 0.000 0.000 0.001 0.000 0.007 0.011 0.015 0.000 0.000 0.000 0.000 0.000
HAKE_MER 0.000 0.000 0.000 0.000 0.000 0.000 0.000 0.000 0.014 0.000 0.000 0.000
PLAICE 0.000 0.000 0.000 0.000 0.004 0.001 0.004 0.000 0.000 0.000 0.001 0.000
WITCH 0.000 0.000 0.000 0.000 0.000 0.000 0.000 0.002 0.001 0.000 0.000 0.000
YELLTAIL 0.000 0.000 0.000 0.000 0.000 0.000 0.003 0.008 0.000 0.000 0.000 0.000
WINTER_F 0.000 0.000 0.000 0.000 0.000 0.000 0.000 0.000 0.000 0.000 0.000 0.000
FLOUNDER 0.000 0.000 0.000 0.000 0.000 0.000 0.000 0.000 0.000 0.000 0.000 0.000
WOLFFISH 0.000 0.000 0.000 0.000 0.001 0.000 0.000 0.000 0.000 0.000 0.000 0.000
HERRING 0.000 0.003 0.000 0.000 0.001 0.004 0.000 0.000 0.000 0.000 0.000 0.000
CAPELIN 0.000 0.001 0.000 0.000 0.001 0.000 0.000 0.002 0.000 0.000 0.000 0.000
MACKEREL 0.000 0.000 0.000 0.000 0.000 0.000 0.000 0.000 0.000 0.000 0.000 0.000
FISH 0.000 0.001 0.001 0.000 0.007 0.012 0.001 0.003 0.003 0.009 0.000 0.000
GADOIDS 0.000 0.000 0.000 0.000 0.000 0.000 0.000 0.000 0.000 0.000 0.000 0.000
ROCK_4B 0.000 0.000 0.000 0.000 0.000 0.000 0.005 0.016 0.011 0.013 0.032 0.000
CUNNER 0.000 0.000 0.000 0.000 0.000 0.000 0.000 0.005 0.000 0.000 0.000 0.000
COCOS_LF 0.000 0.000 0.000 0.000 0.000 0.001 0.000 0.000 0.000 0.000 0.000 0.000
H_HYGOMI 0.000 0.000 0.000 0.000 0.000 0.000 0.000 0.000 0.000 0.000 0.000 0.000
WINDPANE 0.000 0.000 0.000 0.000 0.000 0.000 0.000 0.000 0.000 0.000 0.000 0.000
LANTFISH 0.000 0.000 0.000 0.000 0.001 0.000 0.000 0.000 0.000 0.000 0.000 0.000
GLACIERL 0.000 0.000 0.000 0.000 0.000 0.000 0.000 0.001 0.000 0.000 0.000 0.000
PERSIDE 0.000 0.000 0.000 0.000 0.000 0.000 0.000 0.000 0.000 0.000 0.000 0.000
DRAGFISH 0.000 0.000 0.000 0.000 0.000 0.000 0.000 0.000 0.000 0.000 0.000 0.000
HORNED_L 0.000 0.000 0.000 0.000 0.000 0.000 0.000 0.000 0.000 0.000 0.000 0.000
METAL_LF 0.000 0.000 0.000 0.000 0.000 0.000 0.000 0.000 0.000 0.000 0.000 0.000
SPOT_LF 0.000 0.000 0.000 0.000 0.000 0.000 0.000 0.000 0.000 0.000 0.000 0.000
LSCALELF 0.000 0.000 0.000 0.000 0.000 0.000 0.000 0.000 0.000 0.000 0.000 0.000
HAKE_URO 0.000 0.000 0.000 0.000 0.000 0.000 0.000 0.014 0.040 0.000 0.003 0.000
ROCKHAKE 0.000 0.000 0.000 0.000 0.000 0.000 0.000 0.000 0.001 0.000 0.003 0.000
LEFTEYEF 0.000 0.000 0.000 0.000 0.000 0.000 0.000 0.000 0.000 0.000 0.000 0.000
GADIDAE 0.000 0.000 0.000 0.000 0.000 0.000 0.000 0.000 0.000 0.000 0.000 0.000

136 Strategic Environmental Assessment for the Misaine Bank Area
Species Jan. Feb. March April May June July Aug. Sept. Oct. Nov. Dec.
LAB_RF 0.000 0.000 0.000 0.000 0.000 0.000 0.000 0.000 0.000 0.000 0.000 0.000
BNTHSEMA 0.000 0.000 0.000 0.000 0.000 0.000 0.000 0.000 0.000 0.000 0.000 0.000
HER_CAPE 0.000 0.000 0.000 0.000 0.000 0.000 0.000 0.000 0.000 0.000 0.000 0.000
LHORN_S 0.000 0.000 0.000 0.000 0.001 0.000 0.000 0.000 0.000 0.000 0.000 0.000
SHORN_S 0.000 0.000 0.000 0.000 0.001 0.000 0.000 0.000 0.000 0.000 0.000 0.000
SCULPIN 0.000 0.000 0.000 0.000 0.000 0.000 0.000 0.000 0.000 0.000 0.000 0.000
GATORF 0.000 0.000 0.000 0.000 0.001 0.000 0.000 0.000 0.000 0.000 0.000 0.000
STICKLEB 0.000 0.000 0.000 0.000 0.000 0.000 0.000 0.000 0.000 0.000 0.000 0.000
MONKFISH 0.000 0.000 0.000 0.000 0.000 0.000 0.000 0.000 0.000 0.000 0.000 0.000
SEASNAIL 0.000 0.000 0.000 0.000 0.000 0.000 0.000 0.000 0.000 0.000 0.000 0.000
LUMPFISH 0.000 0.000 0.000 0.000 0.000 0.000 0.000 0.000 0.000 0.000 0.000 0.000
AMER_SL 0.000 0.000 0.000 0.000 0.000 0.000 0.003 0.000 0.000 0.000 0.000 0.000
EEL 0.000 0.000 0.000 0.000 0.000 0.000 0.000 0.000 0.000 0.000 0.000 0.000
NORTH_SL 0.000 0.000 0.000 0.000 0.000 0.000 0.006 0.000 0.000 0.000 0.000 0.000
SANDLANC 0.000 0.002 0.014 0.000 1.078 0.473 0.009 0.001 0.000 0.000 0.000 0.003
RGUNNEL 0.000 0.000 0.000 0.000 0.000 0.000 0.000 0.000 0.000 0.000 0.000 0.000
BLENNY 0.000 0.000 0.001 0.000 0.006 0.002 0.000 0.000 0.000 0.000 0.000 0.000
SHANNY_A 0.000 0.000 0.000 0.000 0.003 0.001 0.000 0.000 0.000 0.000 0.000 0.000
SHANNY_R 0.000 0.000 0.000 0.000 0.000 0.000 0.001 0.000 0.000 0.000 0.000 0.000
WRYMOUTH 0.000 0.000 0.000 0.000 0.001 0.000 0.000 0.000 0.000 0.000 0.000 0.000
SHANNY 0.000 0.000 0.000 0.000 0.006 0.006 0.000 0.000 0.000 0.000 0.000 0.000
BUTTERF 0.000 0.000 0.000 0.000 0.000 0.000 0.000 0.000 0.000 0.000 0.000 0.000
SAURY 0.000 0.000 0.000 0.000 0.000 0.000 0.000 0.000 0.001 0.000 0.000 0.000
BCUDINA 0.000 0.000 0.000 0.000 0.000 0.000 0.000 0.000 0.000 0.000 0.000 0.000
PUFFER 0.000 0.000 0.000 0.000 0.000 0.000 0.000 0.000 0.000 0.000 0.000 0.000
ANGLEMOU 0.000 0.000 0.000 0.000 0.000 0.000 0.000 0.000 0.000 0.000 0.000 0.000
SNAKEF 0.000 0.000 0.000 0.000 0.000 0.000 0.000 0.000 0.000 0.000 0.000 0.000
GOBIES 0.000 0.000 0.000 0.000 0.000 0.000 0.000 0.000 0.000 0.000 0.000 0.000
TOTAL 0.000 0.008 0.017 0.000 1.119 0.514 0.048 0.057 0.093 0.026 0.044 0.003