
Mis Project
22
MIS Project The Reporting tools, Decision Support Software tools and different types of Dashboards
-
Upload
ram-mohan-atmakuri -
Category
Documents
-
view
920 -
download
1
Transcript of Mis Project
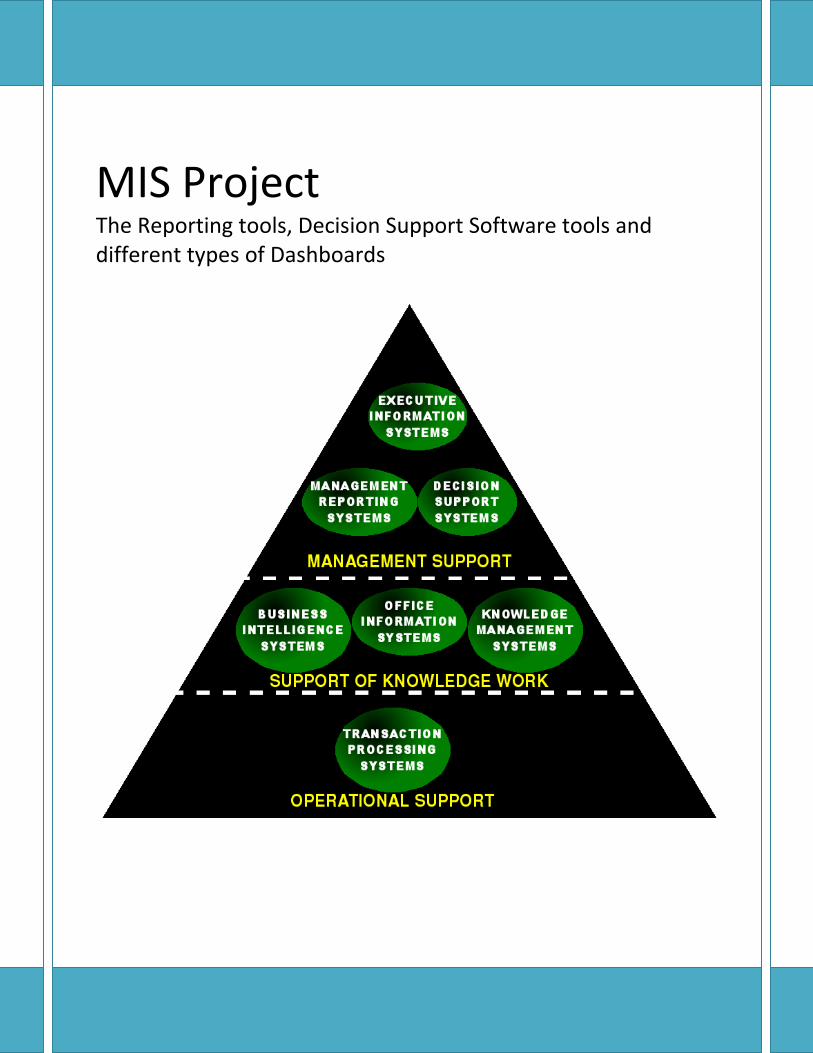
MIS Project The Reporting tools, Decision Support Software tools and different types of Dashboards

MIS Project
2 | P a g e
IFIM BSCHOOL Bangalore
Contents
DECISION SUPPORT SYSTEM (DSS) ......................................................................... 3
Introduction ................................................................................................................................. 5
Theory Development ................................................................................................................... 6
THE STRUCTURE OF DSS ...................................................................................................... 7
KEY DSS FUNCTIONS ............................................................................................................. 9
Types of DSS ............................................................................................................................ 10
DSS UNCERTAINTIES AND LIMITATIONS....................................................................... 12
DASHBOARDS ...................................................................................................................... 14
Types of dashboards .................................................................................................................. 14
Interface design styles ............................................................................................................... 14
History ....................................................................................................................................... 15
Benefits of digital dashboards ................................................................................................... 15
Corporate dashboards ................................................................................................................ 16
Dashboard for CEO's ............................................................................................................. 16
Dashboard for CFO's ............................................................................................................. 17
Dashboard for IT ................................................................................................................... 17
Dashboard for sales and marketing ....................................................................................... 18
Reporting tools ........................................................................................................................ 19
Query plus Data Mining and Reporting .................................................................................... 19
LogiXML by LogiXML ............................................................................................................ 19
Custom CRM Reporting ........................................................................................................... 20
Benefits of custom CRM reporting: ...................................................................................... 20
CONTROL by KCI Computing ................................................................................................ 20
Discover Analytics by On Demand Analysis ............................................................................ 21
Bibliography ............................................................................................................................ 22

MIS Project
3 | P a g e
IFIM BSCHOOL Bangalore
Declaration
We here declaring that report on ―The Reporting tools,
Decision Support Software tools and different types of
Dashboards‖ are original work done by us, submitted in
partial fulfillment of our academic project in Management
Information System of 3rd Term.
This report is correct to the best of our knowledge and it
has not been published anywhere else.
Group num 9
Place: Bangalore Ram Mohan
Shubha M.G
Sourav Pramanik
Monika
Manish

MIS Project
4 | P a g e
IFIM BSCHOOL Bangalore
Acknowledgement
We acknowledge that we are thankful to our respected professor Prof. Anupama for guiding us to
complete the project with honest attention. Without her kind help, the project completion would
not have been possible.
Her presence had a great significance in encouraging us, our warm gratitude to her....
We are thankful to our team members who gave their support and commitment to make this
project successful. As a team, we had a pleasure to work together and share our ideas and efforts
to make the project a remembrance.
We are thankful to the other staff members to provide us the right direction to proceed.

MIS Project
5 | P a g e
IFIM BSCHOOL Bangalore
DECISION SUPPORT SYSTEM (DSS)
Decision support systems are a set of manual or computer-based tools that assist in some
decision-making activity. In today's business environment, however, decision support systems
(DSS) are commonly understood to be computerized management information systems designed
to help business owners, executives, and managers resolve complicated business problems and/or
questions. Good decision support systems can help business people perform a wide variety of
functions, including cash flow analysis, concept ranking, multistage fore-casting, product
performance improvement, and resource allocation analysis. Previously regarded as primarily a
tool for big companies, DSS has in recent years come to be recognized as a potentially valuable
tool for small business enterprises as well.
Introduction
Computerized decision support systems became practical with the development of
minicomputers, timeshare operating systems and distributed computing. The history of the
implementation of such systems begins in the mid-1960s. In a technology field as diverse as
DSS, chronicling history is neither neat nor linear. Different people perceive the field of
Decision Support Systems from various vantage points and report different accounts of what
happened and what was important. As technology evolved new computerized decision support
applications were developed and studied. Researchers used multiple frameworks to help build
and understand these systems. Today one can organize the history of DSS into the five broad
DSS categories explained in Power (2001; 2002; 2004b), including: communications-driven,
data-driven, document driven, knowledge-driven and model-driven decision support systems.
This hypertext document is a starting point in explaining the origins of the various technology
threads that are converging to provide integrated support for managers working alone, in teams
and in organization hierarchies to manage organizations and make more rational decisions.
History is both a guide to future activity in this field and a record of the ideas and actions of
those who have helped advance our thinking and practice. Historical facts can be sorted out and
better understood, but more information gathering is necessary. This web page is a starting point
in collecting more firsthand accounts and in building a more complete mosaic of what was
occurring in universities, software companies and in organizations to build and use DSS.
This document traces decision support applications and research studies related to model and
data-oriented systems, management expert systems, multidimensional data analysis, query and
reporting tools, online analytical processing (OLAP), Business Intelligence, group DSS,
conferencing and groupware, document management, spatial DSS and Executive Information
Systems as the technologies emerge, converge and diverge. All of these technologies have been
used to support decision making. The study of decision support systems is an applied discipline

MIS Project
6 | P a g e
IFIM BSCHOOL Bangalore
that uses knowledge and especially theory from other disciplines. For this reason, many DSS
research questions have been examined because they were of concern to people who were
building and using specific DSS. Hence much of the broad DSS knowledge base provides
generalizations and directions for building more effective DSS (cf., Baskerville & Myers, 2002;
Keen, 1980).
The next section describes the origins of the field of decision support systems. Section 3
discusses the decision support systems theory development that occurred in the late 1970s and
early 1980s. Section 4 discusses important developments to communications-driven, data-driven,
document driven, knowledge-driven and model-driven DSS (cf., Power, 2002). The final section
briefly discusses how DSS practice, research and technology is continuing to evolve.
Theory Development
In the mid- to late 1970s, both practice and theory issues related to DSS were discussed at
academic conferences including the American Institute for Decision Sciences meetings and the
ACM SIGBDP Conference on Decision Support Systems in San Jose, CA in January 1977 (the
proceeding were included in the journal Database). The first International Conference on
Decision Support Systems was held in Atlanta, Georgia in 1981. Academic conferences provided
forums for idea sharing, theory discussions and information exchange.
At about this same time, Keen and Scott Morton‘s DSS textbook (1978) provided the first broad
behavioral orientation to decision support system analysis, design, implementation, evaluation
and development. This influential text provided a framework for teaching DSS in business
schools. McCosh and Scott-Morton‘s (1978) DSS book was more influential in Europe.
In 1980, Steven Alter published his MIT doctoral dissertation results in an influential book.
Alters‘ research and papers (1975; 1977) expanded the framework for thinking about business
and management DSS. Also, his case studies provided a firm descriptive foundation of decision
support system examples. A number of other MIT dissertations completed in the late 1970s also
dealt with issues related to using models for decision support.
Alter concluded from his research (1980) that decision support systems could be categorized in
terms of the generic operations that can be performed by such systems. These generic operations
extend along a single dimension, ranging from extremely data-oriented to extremely model-
oriented. Alter conducted a field study of 56 DSS that he categorized into seven distinct types of
DSS. His seven types include:
1. File drawer systems that provide access to data items.
2. Data analysis systems that support the manipulation of data by computerized
tools tailored to a specific task and setting or by more general tools and operators.

MIS Project
7 | P a g e
IFIM BSCHOOL Bangalore
3. Analysis information systems that provide access to a series of decision-oriented
databases and small models.
4. Accounting and financial models that calculate the consequences of possible
actions.
5. Representational models that estimate the consequences of actions on the basis
of simulation models.
6. Optimization models that provide guidelines for action by generating an optimal
solution consistent with a series of constraints.
7. Suggestion models that perform the logical processing leading to a specific
suggested decision for a fairly structured or well-understood task.
THE STRUCTURE OF DSS
In order to discuss the support of decisions and what DSS tools can or should do, it is necessary
to have a perspective on the nature of the decision process and the various requirements of
supporting it. One way of looking at a decision is in terms of its key components. The first
component is the data collected by a decision maker to be used in making the decision. The
second component is the process selected by the decision maker to combine this data. Finally,
there is an evaluation or learning component that compares decisions and examines them to see
if there is a need to change either the data being used or the process that combines the data.
These components of a decision interact with the characteristics of the decision that is being
made.
STRUCTURED DECISIONS: Many analysts categorize decisions according to the
degree of structure involved in the decision-making activity. Business analysts describe a
structured decision as one in which all three components of a decision—the data, process, and
evaluation—are determined. Since structured decisions are made on a regular basis in business
environments, it makes sense to place a comparatively rigid framework around the decision and
the people making it.
Structured decision support systems may simply use a checklist or form to ensure that all
necessary data is collected and that the decision making process is not skewed by the absence of
necessary data. If the choice is also to support the procedural or process component of the
decision, then it is quite possible to develop a program either as part of the checklist or form. In
fact, it is also possible and desirable to develop computer programs that collect and combine the
data, thus giving the process a high degree of consistency or structure. When there is a desire to
make a decision more structured, the support system for that decision is designed to ensure
consistency. Many firms that hire individuals without a great deal of experience provide them

MIS Project
8 | P a g e
IFIM BSCHOOL Bangalore
with detailed guidelines on their decision making activities and support them by giving them
little flexibility. One interesting consequence of making a decision more structured is that the
liability for inappropriate decisions is shifted from individual decision makers to the larger
company or organization.
UNSTRUCTURED DECISIONS: At the other end of the continuum are unstructured
decisions. While these decisions have the same components as structured ones—data, process,
and evaluation—there is little agreement on their nature. With unstructured decisions, for
example, each decision maker may use different data and processes to reach a conclusion. In
addition, because of the nature of the decision there may only a limited number of people within
the organization that are even qualified to evaluate the decision.
Generally, unstructured decisions are made in instances in which all elements of the business
environment—customer expectations, competitor response, cost of securing raw materials, etc.—
are not completely understood (new product and marketing strategy decisions commonly fit into
this category). Unstructured decision systems typically focus on the individual or team that will
make the decision. These decision makers are usually entrusted with decisions that are
unstructured because of their experience or expertise, and therefore it is their individual ability
that is of value. One approach to support systems in this area is to construct a program that
simulates the process used by a particular individual. In essence, these systems—commonly
referred to as "expert systems"—prompt the user with a series of questions regarding a decision
situation. "Once the expert system has sufficient information about the decision scenario, it uses
an inference engine which draws upon a data base of expertise in this decision area to provide
the manager with the best possible alternative for the problem," explained Jatinder N.D. Gupta
and Thomas M. Harris in the Journal of Systems Management. "The purported advantage of this
decision aid is that it allows the manager the use of the collective knowledge of experts in this
decision realm. Some of the current DSS applications have included long-range and strategic
planning policy setting, new product planning, market planning, cash flow management,
operational planning and budgeting, and portfolio management."
Another approach is to monitor and document the process that was used so that the decision
maker(s) can readily review what has already been examined and concluded. An even more
novel approach used to support these decisions is to provide environments that are specially
designed to give these decision makers an atmosphere that is conducive to their particular tastes.
The key to support of unstructured decisions is to understand the role that individuals experience
or expertise plays in the decision and to allow for individual approaches.
SEMI-STRUCTURED DECISIONS: In the middle of the continuum are semi-
structured decisions, and this is where most of what are considered to be true decision support
systems are focused. Decisions of this type are characterized as having some agreement on the

MIS Project
9 | P a g e
IFIM BSCHOOL Bangalore
data, process, and/or evaluation to be used, but are also typified by efforts to retain some level of
human judgment in the decision making process. An initial step in analyzing which support
system is required is to understand where the limitations of the decision maker may be
manifested (i.e., the data acquisition portion, the process component, or the evaluation of
outcomes).
Grappling with the latter two types of decisions—unstructured and semi-structured—can be
particularly problematic for small businesses, which often have limited technological or work
force resources. As Gupta and Harris indicated, "many decision situations faced by executives in
small business are one-of-a-kind, one-shot occurrences requiring specifically tailored solution
approaches without the benefit of any previously available rules or procedures. This unstructured
or semi-structured nature of these decisions situations aggravates the problem of limited
resources and staff expertise available to a small business executive to analyze important
decisions appropriately. Faced with this difficulty, an executive in a small business must seek
tools and techniques that do not demand too much of his time and resources and are useful to
make his life easier." Subsequently, small businesses have increasingly turned to DSS to provide
them with assistance in business guidance and management.
KEY DSS FUNCTIONS
Gupta and Harris observed that DSS is predicated on the effective performance of three
functions: information management, data quantification, and model manipulation: "Information
management refers to the storage, retrieval, and reporting of information in a structured format
convenient to the user. Data quantification is the process by which large amounts of information
are condensed and analytically manipulated into a few core indicators that extract the essence of
data. Model manipulation refers to the construction and resolution of various scenarios to answer
'what if' questions. It includes the processes of model formulation, alternatives generation and
solution of the proposed models, often through the use of several operations
research/management science approaches."
Entrepreneurs and owners of established enterprises are urged to make certain that their business
needs a DSS before buying the various computer systems and software necessary to create one.
Some small businesses, of course, have no need of a DSS. The owner of a car washing
establishment, for instance, would be highly unlikely to make such an investment. But for those
business owners who are guiding a complex operation, a decision support system can be a
valuable tool. Another key consideration is whether the business's key personnel will ensure that
the necessary time and effort is spent to incorporate DSS into the establishment's operations.
After all, even the best decision support system is of little use if the business does not possess the
training and knowledge necessary to use it effectively. If, after careful study of questions of DSS
utility, the small business owner decides that DSS can help his or her company, the necessary

MIS Project
10 | P a g e
IFIM BSCHOOL Bangalore
investment can be made, and the key managers of the business can begin the process of
developing their own DSS applications using available spreadsheet software.
Types of DSS
Since the definition of Decision Support Systems can be stretched to include almost any
application that processes data there is some confusion as to exactly what constitutes a DSS. In
an effort to clarify the term, DS systems can be separated into seven broad categories, each
aiding decision making by different methods.
* Communications Driven DSS
A C-D DSS is a type of DSS that enhances decision-making by enabling communication and
sharing of information between groups of people. At its most basic level a C-D DSS could be a
simple threaded e-mail. At its most complexes it could be a web-conferencing application or
interactive video.
Communication-Driven DSS will exhibit at least one of the following characteristics:
1. Supports coordination and collaboration between two or more people;
2. Facilitates information sharing; Enables communication between groups of people;
3. Supports group decisions.
* Data-Driven DSS
Data-driven DSS are a form of support system that focuses on the provision of internal (and
sometimes external) data to aid decision making. Most often this will come in the form of a data
warehouse – a database designed to store data in such a way as to allow for its querying and
analysis by users.
Another example of a data-driven DSS would be a Geographic Information System (GIS),
which can be used to visually represent geographically dependant data using maps.
* Document-Driven DSS

MIS Project
11 | P a g e
IFIM BSCHOOL Bangalore
Document-driven DSS are support systems designed to convert documents into valuable
business data. While data-driven DSS rely on data that is already in a standardized format that
lends it to database storage and analysis, document-driven DSS makes use of data that cannot
easily be standardized and stored.
The three primary forms of data used in document driven DSS are:
1. Oral (i.e. transcribed conversations);
2. Written (i.e. reports, memos, e-mail and other correspondence);
3. Video (i.e. TV commercials and news reports).
None of these formats lend themselves easily to standardized database storage and analysis, so
managers require DSS tools to convert them into data that can be valuable in the decision making
process.
Document-driven DSS is the newest field of study in Decision Support Systems. Examples of
document-driven tools can be found in Internet search engines, designed to sift through vast
volumes of unsorted data through the use of keyword searches.
Knowledge-Driven DSS
Knowledge-driven DSS are systems designed to recommend actions to users. Typically,
knowledge-driven systems are designed to sift through large volumes of data, identify
hidden patterns in that data and present recommendations based on those patterns.
Model-Driven DSS
Model-driven support systems incorporate the ability to manipulate data to generate statistical
and financial reports, as well as simulation models, to aid decision-makers. Model-based
decision support systems can be extremely useful in forecasting the effects of changes in
business processes, as they can use past data to answer complex ‗what-if‘ questions for decision
makers.
In addition to these basic types of DSS there are also two additional factors: whether the DSS is
spreadsheet-based, web-based or something else entirely.
Spreadsheet-based DSS

MIS Project
12 | P a g e
IFIM BSCHOOL Bangalore
Model- and Data-driven DS systems can be built using spreadsheets. Spreadsheets offer
decision-makers easy to understand representations of large amounts of data. Additionally,
spreadsheet data is arranged in such a way as to make it easy to convert the data into
visualizations to further aid decision-makers.
Web-based DSS
Any type of DSS can be web-based. The term simply describes any decision support system that
is operated through the interface of a web browser, even if the data used for decision support
remains confined to a legacy system such as a data warehouse.In addition to these basic types of
Decision Support System there are also two separate categories used to define systems.
Enterprise-wide DSS
Enterprise-wide DS systems are systems that are linked into large data warehouses, and offer
decision support to managers at all levels of an enterprise. Enterprise-wide systems will typically
be basic, general use systems that can perform a wide variety of functions.
Desktop DSS
Desktop DS systems are much smaller applications designed to be run from a desktop PC. While
these systems may well be linked into a data warehouse or other large volume of data, they will
typically be more limited in scope. An example of a desktop DSS is Microsoft Excel, the desktop
spreadsheet application.
DSS UNCERTAINTIES AND LIMITATIONS
While decision support systems have been embraced by small business operators in a wide range
of industries in recent years, entrepreneurs, programmers, and business consultants all agree that
such systems are not perfect.
LEVEL OF "USER-FRIENDLINESS": Some observers contend that although
decision support systems have become much more user-friendly in recent years, it remains an
issue, especially for small business operations that do not have significant resources in terms of
technological knowledge.
HARD-TO-QUANTIFY FACTORS: Another limitation that decision makers confront
has to do with combining or processing the information that they obtain. In many cases these
limitations are due to the number of mathematical calculations required. For instance, a
manufacturer pondering the introduction of a new product cannot do so without first deciding on
a price for the product. In order to make this decision, the effect of different variables (including

MIS Project
13 | P a g e
IFIM BSCHOOL Bangalore
price) on demand for the product and the subsequent profit must be evaluated. The
manufacturer's perceptions of the demand for the product can be captured in a mathematical
formula that portrays the relationship between profit, price, and other variables considered
important. Once the relationships have been expressed, the decision maker may now want to
change the values for different variables and see what the effect on profits would be. The ability
to save mathematical relationships and then obtain results for different values is a feature of
many decision support systems. This is called "what-if" analysis, and today's spreadsheet
software packages are fully equipped to support this decision-making activity. Of course,
additional factors must be taken into consideration as well when making business decisions.
Hard-to-quantify factors such as future interest rates, new legislation, and hunches about product
shelf life may all be considered. So even though the calculations may indicate that a certain
demand for the product will be achieved at a certain price, the decision maker must use his or her
judgment in making the final decision.
If the decision maker simply follows the output of a process model, then the decision is being
moved toward the structured end of the continuum. In certain corporate environments, it may be
easier for the decision maker to follow the prescriptions of the DSS; users of support systems are
usually aware of the risks associated with certain choices. If decision makers feel that there is
more risk associated with exercising judgment and opposing the suggestion of the DSS than
there is in simply supporting the process, the DSS is moving the decision more toward the
structured end of the spectrum. Therefore, the way in which a DSS will be used must be
considered within the decision-making environment.
PROCESSING MODEL LIMITATIONS: Another problem with the use of support
systems that perform calculations is that the user/decision maker may not be fully aware of the
limitations or assumptions of the particular processing model. There may be instances in which
the decision maker has an idea of the knowledge that is desired, but not necessarily the best way
to get that knowledge. This problem may be seen in the use of statistical analysis to support a
decision. Most statistical packages provide a variety of tests and will perform them on whatever
data is presented, regardless of whether or not it is appropriate. This problem has been
recognized by designers of support systems and has resulted in the development of DSS that
support the choice of the type of analysis.

MIS Project
14 | P a g e
IFIM BSCHOOL Bangalore
DASHBOARDS
In management information systems, a dashboard is an executive information system user
interface that (similar to an automobile's dashboard) is designed to be easy to read. For example,
a product might obtain information from the local operating system in a computer, from one or
more applications that may be running, and from one or more remote sites on the Web and
present it as though it all came from the same source.
Types of dashboards
Dashboard of Sustainability screen shot illustrating example dashboard layout.
Digital dashboards may be laid out to track the flows inherent in the business processes that they
monitor. Graphically, users may see the high-level processes and then drill down into low level
data. This level of detail is often buried deep within the corporate enterprise and otherwise
unavailable to the senior executives.
Three main types of digital dashboard dominate the market today: stand alone software
applications, web-browser based applications, and desktop applications also known as desktop
widgets. The last are driven by a widget engine.
Specialized dashboards may track all corporate functions. Examples include human resources,
recruiting, sales, operations, security, information technology, project management, customer
relationship management and many more departmental dashboards.
Digital dashboard projects involve business units as the driver and the information technology
department as the enabler. The success of digital dashboard projects often depends on the metrics
that were chosen for monitoring. Key performance indicators, balanced scorecards, and sales
performance figures are some of the content appropriate on business dashboards.
Interface design styles
Like a car's dashboard (or control panel), a software dashboard provides decision makers with
the input necessary to "drive" the business. Thus, a graphical user interface may be designed to
display summaries, graphics (e.g., bar charts, pie charts, bullet graphs, "spark lines," etc.), and
gauges (with colors similar to traffic lights) in a portal-like framework to highlight important
information.

MIS Project
15 | P a g e
IFIM BSCHOOL Bangalore
History
The idea of digital dashboards followed the study of decision support systems in the 1970s. With
the surge of the web in the late 1990s, digital dashboards as we know them today began
appearing. Many systems were developed in-house by organizations to consolidate and display
data already being gathered in various information systems throughout the organization. Today,
digital dashboard technology is available "out-of-the-box" from many software providers. Some
companies however continue to do in-house development and maintenance of dashboard
applications. For example, GE Aviation has developed a proprietary software/portal called
"Digital Cockpit" to monitor the trends in aircraft spare parts business.
In the late 1990s, Microsoft promoted a concept known as the Digital Nervous System and
"digital dashboards" were described as being one leg of that concept.
Benefits of digital dashboards
Digital dashboards allow managers to monitor the contribution of the various departments in
their organization. To gauge exactly how well an organization is performing overall, digital
dashboards allow you to capture and report specific data points from each department within the
organization, thus providing a "snapshot" of performance.
Benefits of using digital dashboards include:
Visual presentation of performance measures
Ability to identify and correct negative trends
Measure efficiencies/inefficiencies
Ability to generate detailed reports showing new trends
Ability to make more informed decisions based on collected business intelligence
Align strategies and organizational goals
Save time over running multiple reports
Gain total visibility of all systems instantly

MIS Project
16 | P a g e
IFIM BSCHOOL Bangalore
Corporate dashboards
Dashboard for CEO's
Dashboard for CFO's
Dashboard for sales and marketing
Dashboard for IT
Dashboard for retail
Dashboard for CEO's

MIS Project
17 | P a g e
IFIM BSCHOOL Bangalore
Dashboard for CFO's
Dashboard for IT

MIS Project
18 | P a g e
IFIM BSCHOOL Bangalore
Dashboard for sales and marketing

MIS Project
19 | P a g e
IFIM BSCHOOL Bangalore
Reporting tools
Query plus Data Mining and Reporting
Query Plus by QualCorp is a state-of-the-art data extraction tool designed to give you instant
access to the critical information you need to make timely business decisions. With Query Plus
you are in the driver‘s seat.
Designed specifically for insurance agencies and built with the novice user in mind, Query Plus
is the key to the information locked away inside your software. Combine fields from any section
of your management software to create custom hybrid datasets never before possible and do it on
the fly. With Query Plus you have the ability set up your own data filters, define custom data
groups, decide the export file format, and much more—all quickly and easily without writing one
single line of code.
For those agencies with advanced reporting needs, there is a customized report designer shipped
along with Query Plus which allows you to create even the most complex reports using your
custom dataset. Though the preferred format for data processing may often be that of Excel
spreadsheets, Query Plus is also the tool of choice for those who want the most robust reporting
features available. By providing a friendly, intuitive, visually-based, wizard-driven report design
environment, Query Plus allows for possibilities that will stretch the imagination of even the
most advanced report users.
Query Plus represents the next generation in data extraction. Taking your input, QueryPlus
dynamically writes complex SQL queries behind the scenes and then displays the results in a
simple, familiar, and flexible grid format where data can be easily manipulated by simply
dragging and dropping. From customer ranking reports to complex accounting reports, Query
Plus allows you to get the critical business data you need to make timely decisions.
LogiXML by LogiXML
LogiXML is the smart choice for Business Intelligence, giving you more power and more choice
with less effort. It's simple to start, easy to use and our no user fees licensing model enables you
to empower your entire organization to get the most value from their data. Our solutions include
Logi Info for developers, Logi Ad Hoc for end users, and the Logi 9 Platform which includes
both plus data integration

MIS Project
20 | P a g e
IFIM BSCHOOL Bangalore
Custom CRM Reporting
Every business has unique processes, requirements, and information tracking. Configure custom
CRM reporting for your business metrics by creating your own reports or extending the pre-built
report templates included in Maximizer CRM with industry-leading Crystal Reports® and/or
Microsoft SQL Reporting Services (SRS)i.
Benefits of custom CRM reporting:
Create and edit your own custom CRM reports to gain further insight into customer
behaviours, new business opportunities and operational inefficiencies
Use the industry-leading Crystal Reports report designer for easy creation of custom
reports
Quickly and easily produce visual summary and drill-down reports with calculations and
conditional formatting
Automatically send updated reports directly to decision makers on a regular basisii
Uncover potential issues (recurrent service problems or poor sales performance), by
setting up automatic alerts when metrics meet certain criteria
Compare and analyze with data in other applications, such as accounting systems, to get a
complete view of relationship health and customer value
CONTROL by KCI Computing
Unified end-to-end solution for all aspects of performance management - budgeting, modeling,
forecasting, OLAP analysis, consolidations & reporting. Excel based front end; industry standard
relational database back-end; dynamic read-write to myriad data sources; drill-thru to transaction
detail and more
Key reporting features include:
―On-the-fly‖ multi-dimensional financial and operational report generation
User defined report formatting
Shareable re-usable formatting templates
Embedded hyperlinks in context
Granular security: Users only see data and reports they have been granted access to
Anyone who can see data can comment on it
Prototype Reports
Navigable reports
Snapshot ―point in time‖ VIEWS
Scheduled reports
Zero effort web publishing requiring only the user‘s internet browser for access

MIS Project
21 | P a g e
IFIM BSCHOOL Bangalore
Discover Analytics by On Demand Analysis
Discover Analytics is a powerful business intelligence and analytics reporting solution integrated
with the Microsoft BI platform. It can deliver your organizations business intelligence data into a
custom Microsoft Excel based application. Can connect to any data source or ERP system,
including SQL Server, DB2, Oracle, SAP and many others. Regardless of your database
structure, this tool can connect to your data. Free Demo with our business intelligence
experts.Customers demand reporting flexibility more than ever before. They aren‘t willing to
settle for static reports or take the time to learn new tools. Leap ahead of the competition by
offering rigorous analytics alongside easy-to-use visibility, data trends, charting, dashboards and
key performance indicators. Complement your software with great Business Intelligence and
watch new customer sales grow.
No code integration necessary
Requires no additional software (other than Excel)
Can be configured locally or in the ―cloud‖ (SaaS)
Rapid Implementation at low cost
One-stop access to user set up, customer deployment, version control and desktop install
ODA has built multiple, full-platform collaborative solutions to handle all aspects of
transactional and reporting systems, from web interfaces to cloud-based SaaS solutions. ODA
has delivered solutions to your industry, whether you‘re in oil, hi-tech, lodging, transportation,
manufacturing, distribution or retail.
Automate manual processes
Improve business transactional flow
Provide rich analytics on your data
Streamline workflows to save time and money

MIS Project
22 | P a g e
IFIM BSCHOOL Bangalore
Bibliography
http://www.business.com/directory/management/operations_management/software/report
ing_software/m/mis-reporting/
http://www.kcicorp.com/html/reporting.html
http://www.ondemandanalysis.com/why-choose.html
http://www.logixml.com/products/managed-reporting.html
http://www.maximizer.com/crm/business-intelligence.html