
MIRAI Corporation · 2019. 11. 21. · 本文ページ 135,000 145,000 155,000 165,000 175,000...
16
投資法人みらい Security code: 3476 Asset Manager: Mitsui & IDERA Partners Co., Ltd. http://3476.jp/en Progress of Mid-term Management Plan - Supplementary Material for the Press Release Dated October 23 and November 1, 2017 - MIRAI Corporation November 2017
Transcript of MIRAI Corporation · 2019. 11. 21. · 本文ページ 135,000 145,000 155,000 165,000 175,000...

章区切り
投資法人みらい
Security code: 3476
Asset Manager: Mitsui & IDERA Partners Co., Ltd.
http://3476.jp/en
Progress of Mid-term Management Plan- Supplementary Material for the Press Release Dated October 23 and November 1, 2017 -
MIRAI Corporation
November 2017
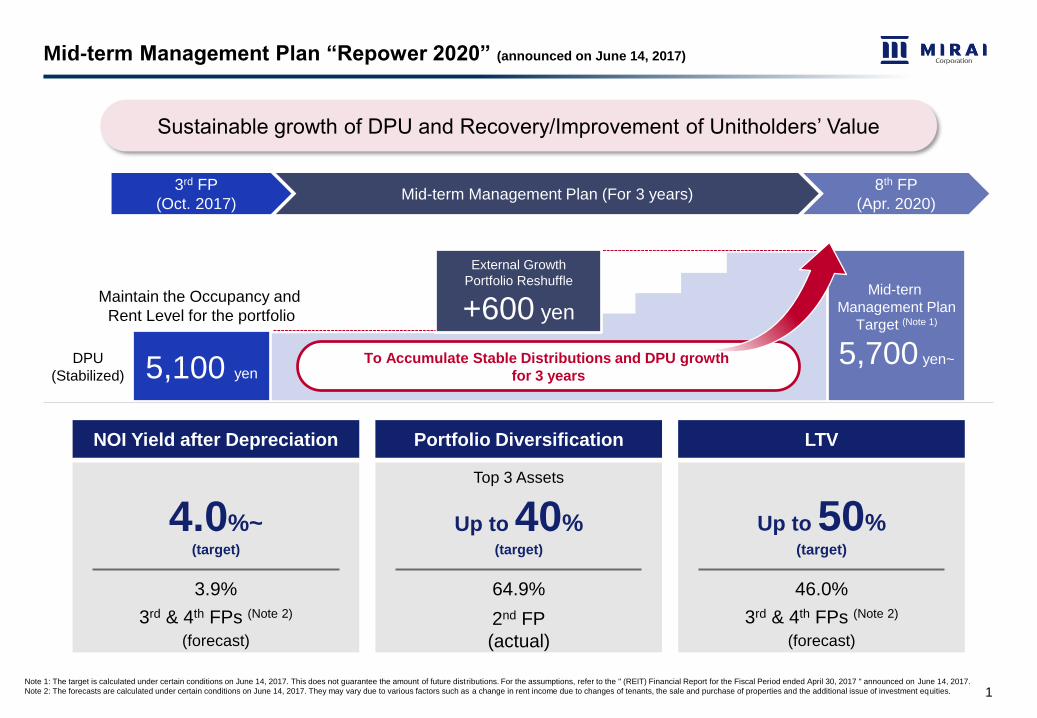
Mid-term Management Plan “Repower 2020” (announced on June 14, 2017)
Sustainable growth of DPU and Recovery/Improvement of Unitholders’ Value
1
3rd FP
(Oct. 2017)
8th FP
(Apr. 2020)
To Accumulate Stable Distributions and DPU growth
for 3 years
DPU
(Stabilized)
Mid-tern
Management Plan
Target (Note 1)
5,700 yen~5,100 yen
Maintain the Occupancy and
Rent Level for the portfolio
NOI Yield after Depreciation LTVPortfolio Diversification
4.0%~(target)
3.9%
3rd & 4th FPs (Note 2)
(forecast)
Top 3 Assets
Up to 40%(target)
64.9%
2nd FP
(actual)
Up to 50%(target)
46.0%
External Growth
Portfolio Reshuffle
+600 yen
Mid-term Management Plan (For 3 years)
Note 1: The target is calculated under certain conditions on June 14, 2017. This does not guarantee the amount of future distributions. For the assumptions, refer to the " (REIT) Financial Report for the Fiscal Period ended April 30, 2017 " announced on June 14, 2017.
Note 2: The forecasts are calculated under certain conditions on June 14, 2017. They may vary due to various factors such as a change in rent income due to changes of tenants, the sale and purchase of properties and the additional issue of investment equities.
3rd & 4th FPs (Note 2)
(forecast)

本文ページ
135,000
145,000
155,000
165,000
175,000
185,000
2017/4/26 2017/5/29 2017/6/26 2017/7/25 2017/8/23 2017/9/21 2017/10/20
MIRAI TSE REIT Index NAV per unit
The unit price of MIRAI increased after the announcement of the results for the 2nd FP and “Repower 2020”, while the TSE REIT
index was stagnant.
We perceive that the actions for the portfolio diversification and the increase of profitability are recognized to a certain extent.
Performance under the results for the 2nd FP and “Repower 2020”
Note: As of November 9, 2017. For the TSE REIT index, the relative value is calculated based on the closing unit price of MIRAI on April 26, 2017.
Unit price
(Yen)
June 14, 2017
Announcement of the results for
the 2nd FP and “Repower 2020”
MIRAI: 166,000 yen
October 20, 2017
MIRAI: 175,100 yen
(+16.7%)
June 14, 2017
TSE REIT: 1,728.32 pt
October 20, 2017
TSE REIT: 1,646.05 pt
(-5.6%)
April 26, 2017
Ex-right date for the 2nd FP
MIRAI: 150,100 yen
TSE REIT: 1,744.39 pt
2
NAV per unit
185,101 yen
November 9, 2017
MIRAI: 166,700 yen
(+11.1%)
November, 2017
TSE REIT: 1,618.68 pt
(-7.2%)
本文ページ
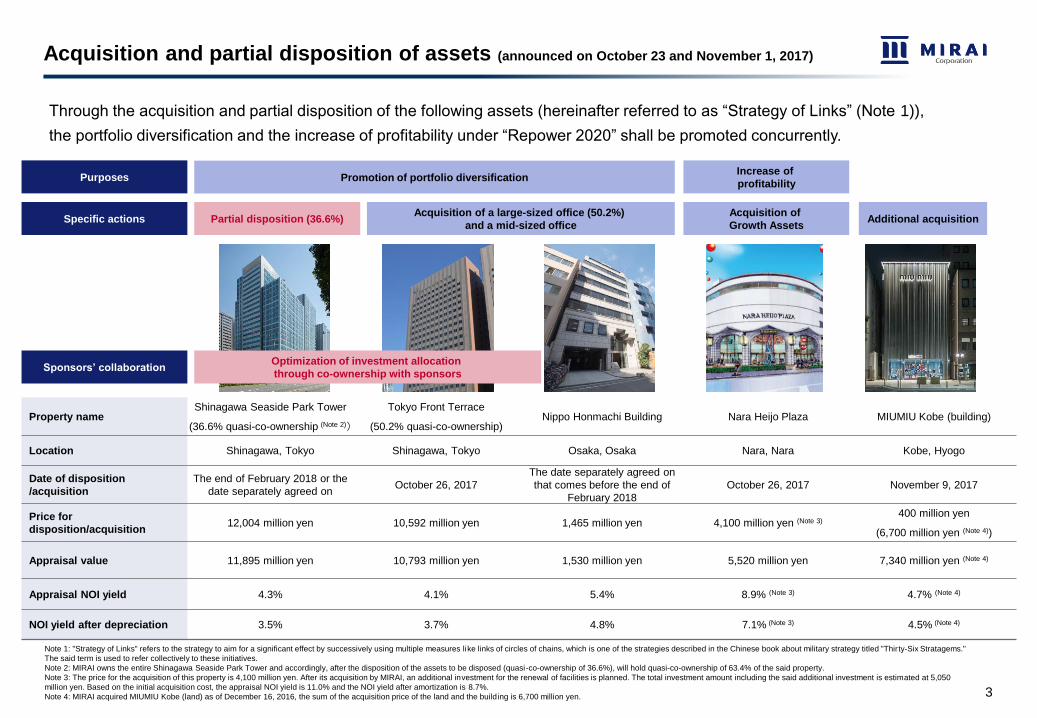
Property nameShinagawa Seaside Park Tower
(36.6% quasi-co-ownership (Note 2))
Tokyo Front Terrace
(50.2% quasi-co-ownership)Nippo Honmachi Building Nara Heijo Plaza MIUMIU Kobe (building)
Location Shinagawa, Tokyo Shinagawa, Tokyo Osaka, Osaka Nara, Nara Kobe, Hyogo
Date of disposition
/acquisition
The end of February 2018 or the
date separately agreed onOctober 26, 2017
The date separately agreed on
that comes before the end of
February 2018
October 26, 2017 November 9, 2017
Price for
disposition/acquisition12,004 million yen 10,592 million yen 1,465 million yen 4,100 million yen (Note 3)
400 million yen
(6,700 million yen (Note 4))
Appraisal value 11,895 million yen 10,793 million yen 1,530 million yen 5,520 million yen 7,340 million yen (Note 4)
Appraisal NOI yield 4.3% 4.1% 5.4% 8.9% (Note 3) 4.7% (Note 4)
NOI yield after depreciation 3.5% 3.7% 4.8% 7.1% (Note 3) 4.5% (Note 4)
Through the acquisition and partial disposition of the following assets (hereinafter referred to as “Strategy of Links” (Note 1)),
the portfolio diversification and the increase of profitability under “Repower 2020” shall be promoted concurrently.
3
Acquisition and partial disposition of assets (announced on October 23 and November 1, 2017)
Note 1: "Strategy of Links" refers to the strategy to aim for a significant effect by successively using multiple measures like links of circles of chains, which is one of the strategies described in the Chinese book about military strategy titled "Thirty-Six Stratagems."
The said term is used to refer collectively to these initiatives.
Note 2: MIRAI owns the entire Shinagawa Seaside Park Tower and accordingly, after the disposition of the assets to be disposed (quasi-co-ownership of 36.6%), will hold quasi-co-ownership of 63.4% of the said property.
Note 3: The price for the acquisition of this property is 4,100 million yen. After its acquisition by MIRAI, an additional investment for the renewal of facilities is planned. The total investment amount including the said additional investment is estimated at 5,050
million yen. Based on the initial acquisition cost, the appraisal NOI yield is 11.0% and the NOI yield after amortization is 8.7%.
Note 4: MIRAI acquired MIUMIU Kobe (land) as of December 16, 2016, the sum of the acquisition price of the land and the building is 6,700 million yen.
Promotion of portfolio diversificationIncrease of
profitability
Partial disposition (36.6%)Acquisition of a large-sized office (50.2%)
and a mid-sized office
Acquisition of
Growth Assets
Optimization of investment allocation
through co-ownership with sponsors
Purposes
Specific actions
Sponsors’ collaboration
Additional acquisition

本文ページ
After “Strategy of Links”
Top 3 assets
51 %
53 %
160 companies
18 properties
105.5 billion yen
54 billion yen
48 %
(Reference) No replacement of
portfolio (Note)
Acquisition of the entire Tokyo Front Terrace
+ continuous ownership of the entire Shinagawa
Seaside Park Tower
Top 3 assets
60 %
51 %
160 companies
18 properties
127.8 billion yen
76 billion yen
56 %
Before “Strategy of Links”
Portfolio
Diversification
Top 3 assets
65 %
Top 10 tenants 57 %
Total number of
tenants 97 companies
Number of
properties 15 properties
AUM (Total
acquisition price) 100.7 billion yen
Total amount of
debts 49 billion yen
LTV 45 %
To efficiently promote the portfolio diversification, we have selected the strategic measures for the partial
replacement of large-sized properties and the co-ownership with sponsors.
Promotion of portfolio diversification ~ compensation for weakness with the capability of management ~
4Note: With loans of 27.0 billion yen, the entire Tokyo Front Terrace (100%) at the price of 21.1 billion yen as well as the Nippo Honmachi Building, Nara Heijo Plaza and MIUMIU Kobe (building) shall be acquired, and the entire
Shinagawa Seaside Park Tower shall be continuously owned.
本文ページ
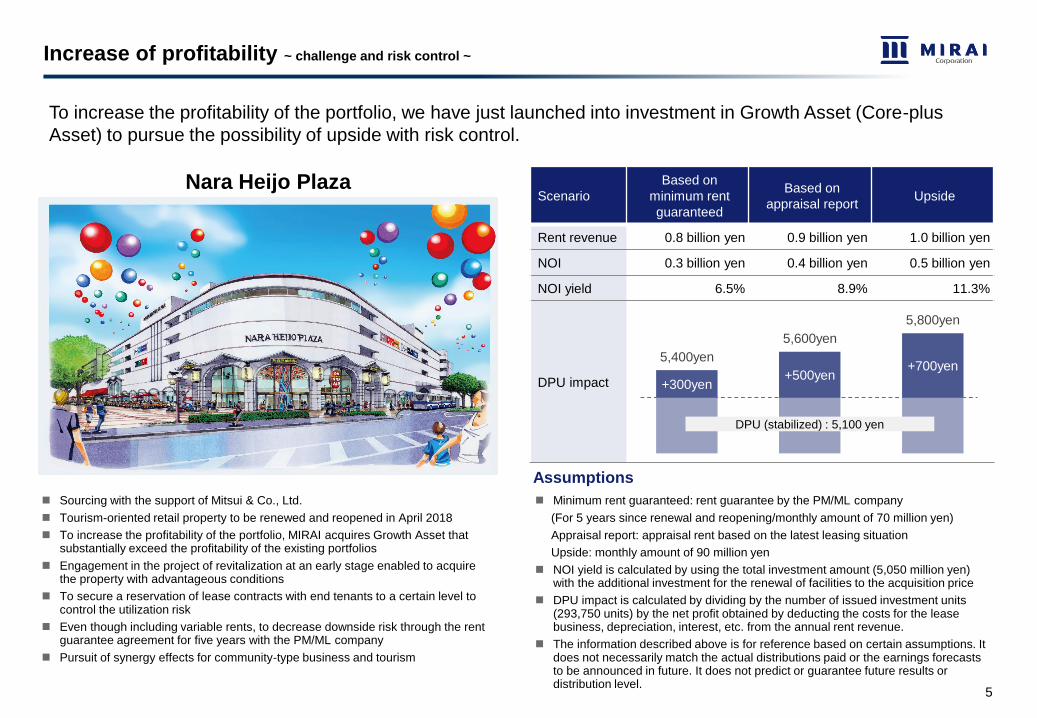
Scenario
Based on
minimum rent
guaranteed
Based on
appraisal report Upside
Rent revenue 0.8 billion yen 0.9 billion yen 1.0 billion yen
NOI 0.3 billion yen 0.4 billion yen 0.5 billion yen
NOI yield 6.5% 8.9% 11.3%
DPU impact
To increase the profitability of the portfolio, we have just launched into investment in Growth Asset (Core-plus
Asset) to pursue the possibility of upside with risk control.
Increase of profitability ~ challenge and risk control ~
Sourcing with the support of Mitsui & Co., Ltd.
Tourism-oriented retail property to be renewed and reopened in April 2018
To increase the profitability of the portfolio, MIRAI acquires Growth Asset that substantially exceed the profitability of the existing portfolios
Engagement in the project of revitalization at an early stage enabled to acquire the property with advantageous conditions
To secure a reservation of lease contracts with end tenants to a certain level to control the utilization risk
Even though including variable rents, to decrease downside risk through the rent guarantee agreement for five years with the PM/ML company
Pursuit of synergy effects for community-type business and tourism
Assumptions
+290円+480円
+800円
Minimum rent guaranteed: rent guarantee by the PM/ML company
(For 5 years since renewal and reopening/monthly amount of 70 million yen)
Appraisal report: appraisal rent based on the latest leasing situation
Upside: monthly amount of 90 million yen
NOI yield is calculated by using the total investment amount (5,050 million yen) with the additional investment for the renewal of facilities to the acquisition price
DPU impact is calculated by dividing by the number of issued investment units (293,750 units) by the net profit obtained by deducting the costs for the lease business, depreciation, interest, etc. from the annual rent revenue.
The information described above is for reference based on certain assumptions. It does not necessarily match the actual distributions paid or the earnings forecasts to be announced in future. It does not predict or guarantee future results or distribution level.
+300yen+500yen
+700yen5,400yen
5,600yen
5,800yen
DPU (stabilized) : 5,100 yen
5
Nara Heijo Plaza
(tentative name)
本文ページ
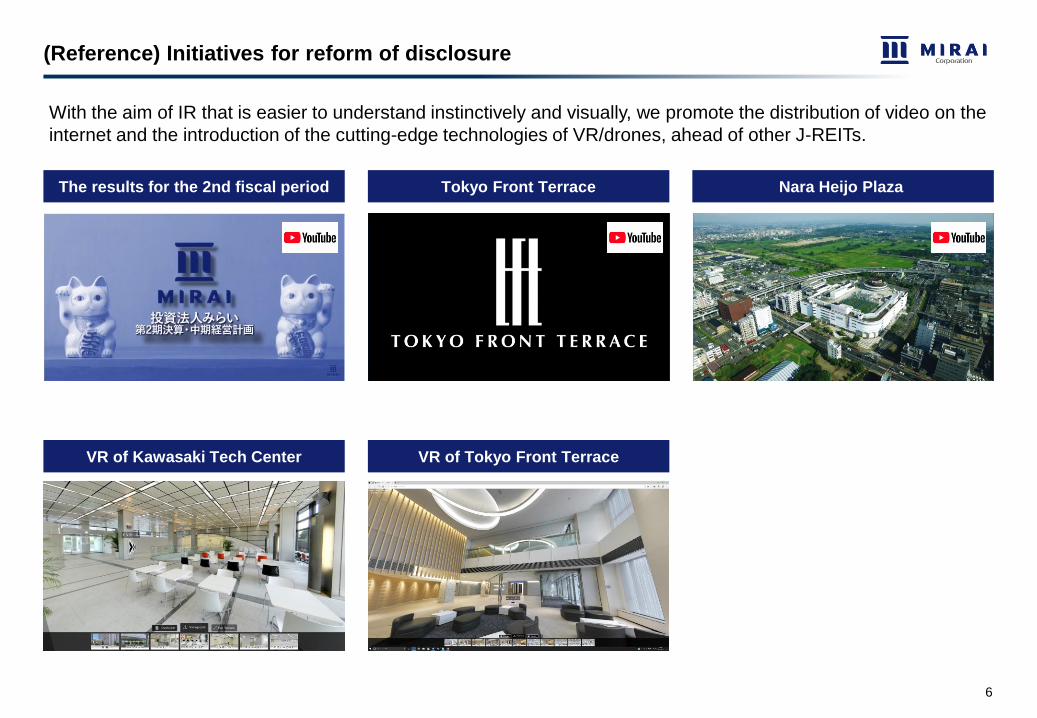
With the aim of IR that is easier to understand instinctively and visually, we promote the distribution of video on the
internet and the introduction of the cutting-edge technologies of VR/drones, ahead of other J-REITs.
(Reference) Initiatives for reform of disclosure
The results for the 2nd fiscal period Tokyo Front Terrace Nara Heijo Plaza
VR of Tokyo Front TerraceVR of Kawasaki Tech Center
6
本文ページ
0
4,000
8,000
12,000
2018 2019 2020 2021 2022 2023 2024 2025 2026 2027
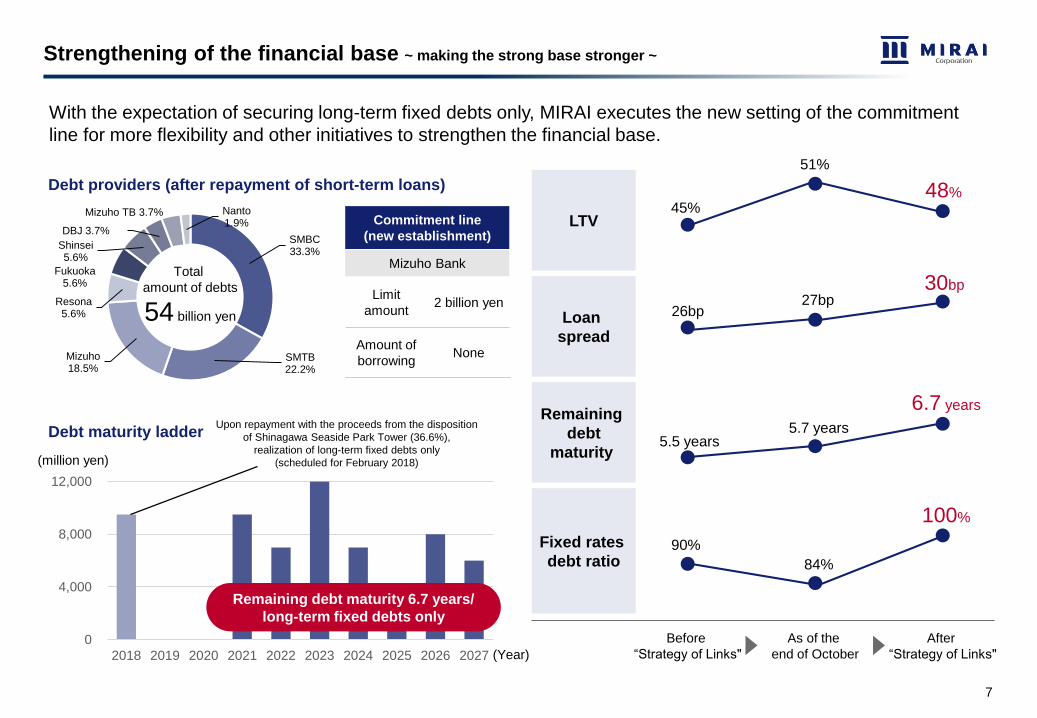
With the expectation of securing long-term fixed debts only, MIRAI executes the new setting of the commitment
line for more flexibility and other initiatives to strengthen the financial base.
Strengthening of the financial base ~ making the strong base stronger ~
Upon repayment with the proceeds from the disposition
of Shinagawa Seaside Park Tower (36.6%),
realization of long-term fixed debts only
(scheduled for February 2018)
Remaining debt maturity 6.7 years/
long-term fixed debts only
LTV
Remaining
debt
maturity
Fixed rates
debt ratio
Loan
spread
6.7 years
100%
90%
48%45%
51%
30bp27bp
5.7 years5.5 years
26bp
84%
Before
“Strategy of Links"
As of the
end of October
After
“Strategy of Links"
Debt providers (after repayment of short-term loans)
SMBC33.3%
SMTB22.2%
Mizuho18.5%
Resona5.6%
Fukuoka5.6%
Shinsei5.6%
DBJ 3.7%
Mizuho TB 3.7% Nanto1.9%
Debt maturity ladder
Total
amount of debts
54 billion yen
Commitment line
(new establishment)
Mizuho Bank
Limit
amount2 billion yen
Amount of
borrowingNone
7
(million yen)
(Year)
本文ページ
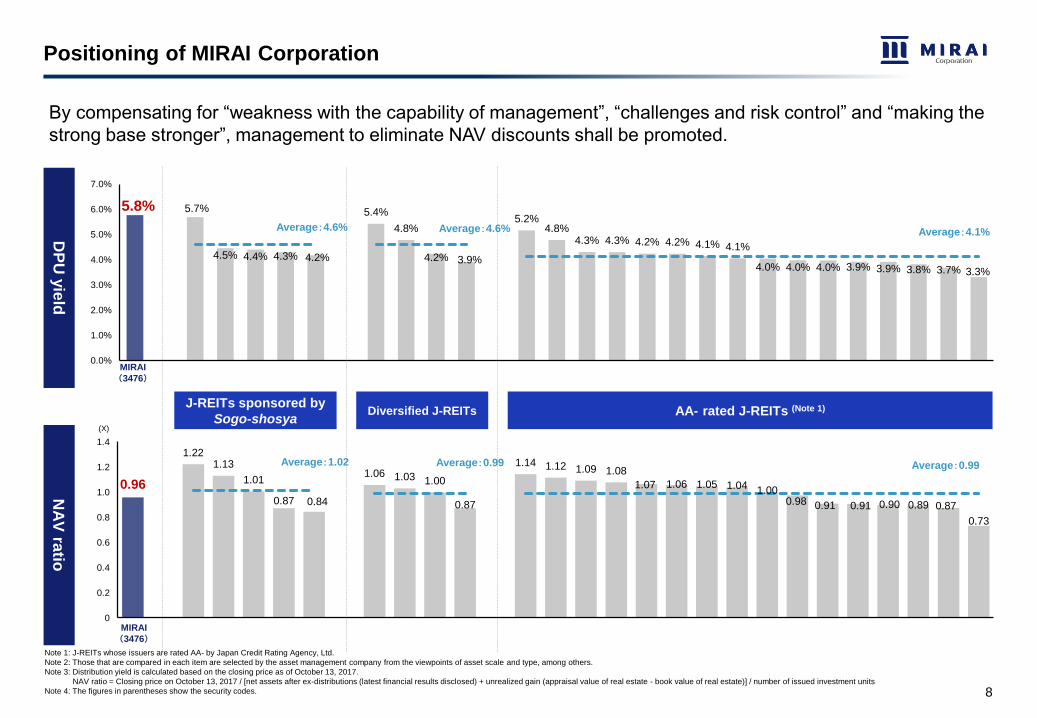
AA- rated J-REITs (Note 1)J-REITs sponsored by
Sogo-shosyaDiversified J-REITs
0.96
1.22 1.13
1.01
0.87 0.84
1.06 1.03 1.00
0.87
1.14 1.12 1.09 1.08
1.07 1.06 1.05 1.04 1.00 0.98 0.91 0.91 0.90 0.89 0.87
0.73
Average:1.02 Average:0.99 Average:0.99
0
0.2
0.4
0.6
0.8
1.0
1.2
1.4
MIRAI
(3476)
5.8% 5.7%
4.5% 4.4% 4.3% 4.2%
5.4%
4.8%
4.2% 3.9%
5.2%4.8%
4.3% 4.3% 4.2% 4.2% 4.1% 4.1%
4.0% 4.0% 4.0% 3.9% 3.9% 3.8% 3.7% 3.3%
Average:4.6% Average:4.6% Average:4.1%
0.0%
1.0%
2.0%
3.0%
4.0%
5.0%
6.0%
7.0%
By compensating for “weakness with the capability of management”, “challenges and risk control” and “making the
strong base stronger”, management to eliminate NAV discounts shall be promoted.
8
Positioning of MIRAI Corporation
Note 1: J-REITs whose issuers are rated AA- by Japan Credit Rating Agency, Ltd.
Note 2: Those that are compared in each item are selected by the asset management company from the viewpoints of asset scale and type, among others.
Note 3: Distribution yield is calculated based on the closing price as of October 13, 2017.
NAV ratio = Closing price on October 13, 2017 / [net assets after ex-distributions (latest financial results disclosed) + unrealized gain (appraisal value of real estate - book value of real estate)] / number of issued investment units
Note 4: The figures in parentheses show the security codes.
(X)
DP
U y
ield
NA
Vra
tio
MIRAI
(3476)
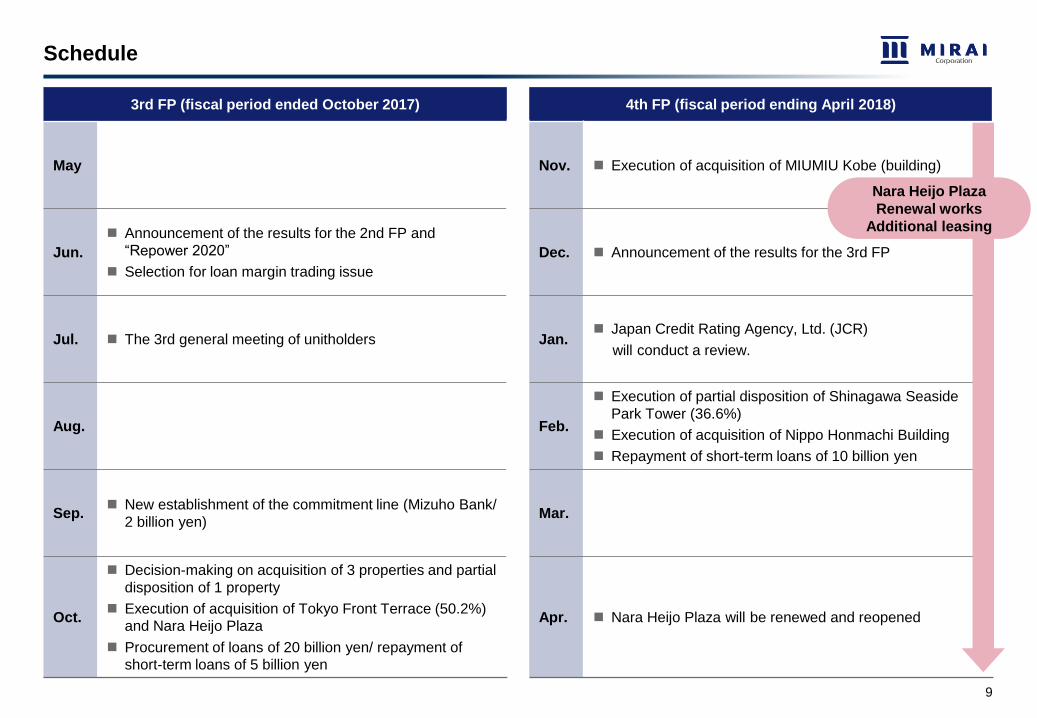
Schedule
9
3rd FP (fiscal period ended October 2017) 4th FP (fiscal period ending April 2018)
May Nov. Execution of acquisition of MIUMIU Kobe (building)
Jun.
Announcement of the results for the 2nd FP and
“Repower 2020”
Selection for loan margin trading issue
Dec. Announcement of the results for the 3rd FP
Jul. The 3rd general meeting of unitholders Jan. Japan Credit Rating Agency, Ltd. (JCR)
will conduct a review.
Aug. Feb.
Execution of partial disposition of Shinagawa Seaside
Park Tower (36.6%)
Execution of acquisition of Nippo Honmachi Building
Repayment of short-term loans of 10 billion yen
Sep. New establishment of the commitment line (Mizuho Bank/
2 billion yen)Mar.
Oct.
Decision-making on acquisition of 3 properties and partial
disposition of 1 property
Execution of acquisition of Tokyo Front Terrace (50.2%)
and Nara Heijo Plaza
Procurement of loans of 20 billion yen/ repayment of
short-term loans of 5 billion yen
Apr. Nara Heijo Plaza will be renewed and reopened
Nara Heijo Plaza
Renewal works
Additional leasing
本文ページ
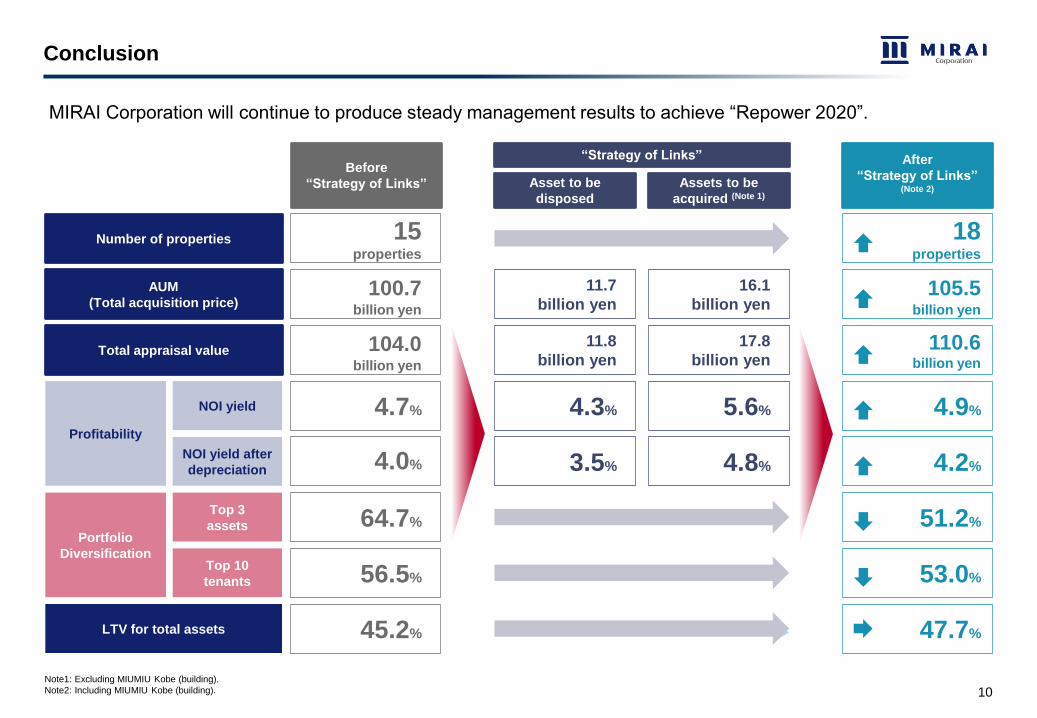
MIRAI Corporation will continue to produce steady management results to achieve “Repower 2020”.
Conclusion
Before
“Strategy of Links”
After
“Strategy of Links” (Note 2)
Asset to be
disposed
Assets to be
acquired (Note 1)
“Strategy of Links”
Profitability
Top 3
assetsPortfolio
DiversificationTop 10
tenants
NOI yield after
depreciation
NOI yield
Number of properties
AUM
(Total acquisition price)
Total appraisal value
15 properties
100.7billion yen
104.0billion yen
4.7%
4.0%
64.7%
56.5%
11.7
billion yen
11.8
billion yen
4.3%
3.5%
16.1
billion yen
17.8
billion yen
5.6%
4.8%
18 properties
105.5billion yen
110.6billion yen
LTV for total assets 45.2% 47.7%
4.9%
4.2%
51.2%
53.0%
10Note1: Excluding MIUMIU Kobe (building).
Note2: Including MIUMIU Kobe (building).

GK Nara Heijo Plaza (Note3)13.5%
AEON Retail7.3%
NTT COMWARE 6.8%
PRADA Japan 5.2%
Super Hotel 4.8%
Tokyo Area
77.4%
Osaka Area
16.6%
Others 6.0%
Office 65.8%
Retail 25.0%
Hotel 9.2%
Ratio by tenants (Note 2)
Ratio by asset type (Note 2)
Three
metropolitan
areas
94.0%
Ratio of area (Note 2)
Office Retail Hotel
Portfolio map (after “Strategy of Links”)
11
Core asset
96.1%
Top 10
tenants
53.0%
Tokyo Front
Terrace
Nara Heijo
Plaza(Note 1)
Note 1: The picture of Nara Heijo Plaza is based on the current plan. It may be different from the actual appearance.
Note 2: The ratio by tenants is calculated based on the annual rent. Others are calculated based on the acquisition price.
Note 3: It is the master lease company of the pass-through type for Nara Heijo Plaza. It enters into the lease contract with a large number of end tenants. The ratio of tenants for it is calculated based on the minimum guarantee under the agreement for rent
guarantee between it, MIRAI and Yamaki Co., Ltd.
75321 121198 10 1716151413
4 18
Nippo
Honmmachi
Building
6
Shinagawa
Seaside
Parktower
Kawasaki
Tech Center
Shinjuku
Eastside
Square
Hillcoat
Higashi-Shinjuku
MIUMIU Kobe Shibuya
World East
Building
AEON Kasai Daiki
Izumi-Chuo
Hotel
Sunroute
Niigata
Daiwa Roynet
Hotel Akita
Super Hotel
Sendai
Hirose-dori
Super Hotel
Osaka
Tennnoji
Super Hotel
Saitama
Omiya
Super Hotel
Kyoto
Karasumagojo
Comfort Hotel
Shin-Yamaguchi
12
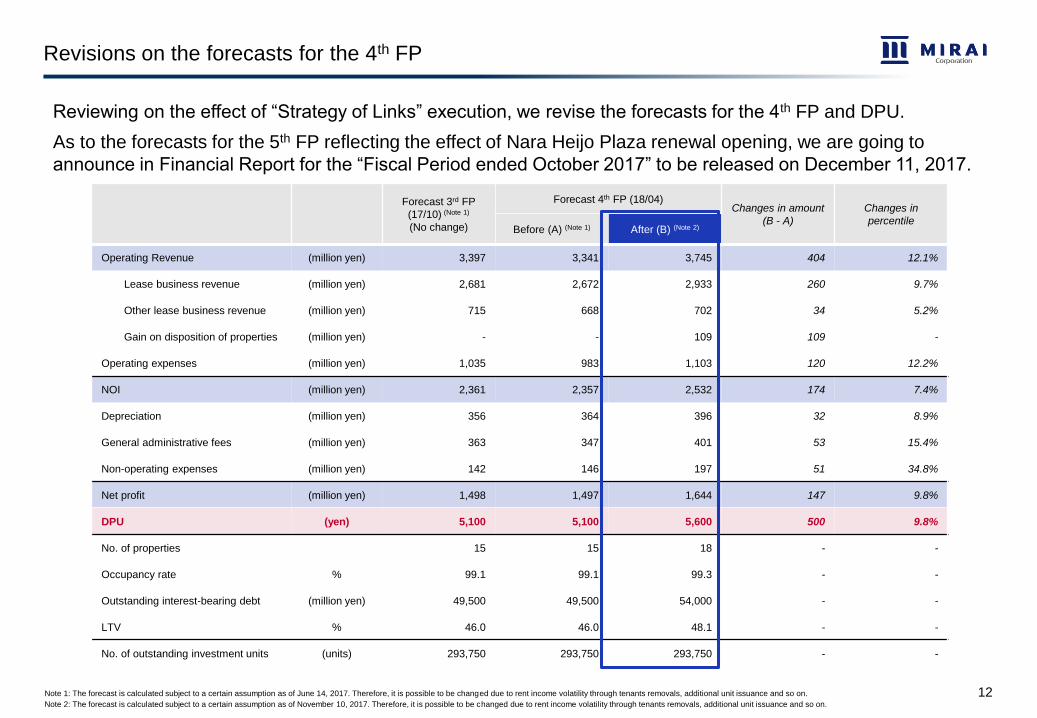
Revisions on the forecasts for the 4th FP
Forecast 3rd FP
(17/10) (Note 1)
(No change)
Forecast 4th FP (18/04)Changes in amount
(B - A)
Changes in
percentileBefore (A) (Note 1) After (B) (Note 2)
Operating Revenue (million yen) 3,397 3,341 3,745 404 12.1%
Lease business revenue (million yen) 2,681 2,672 2,933 260 9.7%
Other lease business revenue (million yen) 715 668 702 34 5.2%
Gain on disposition of properties (million yen) - - 109 109 -
Operating expenses (million yen) 1,035 983 1,103 120 12.2%
NOI (million yen) 2,361 2,357 2,532 174 7.4%
Depreciation (million yen) 356 364 396 32 8.9%
General administrative fees (million yen) 363 347 401 53 15.4%
Non-operating expenses (million yen) 142 146 197 51 34.8%
Net profit (million yen) 1,498 1,497 1,644 147 9.8%
DPU (yen) 5,100 5,100 5,600 500 9.8%
No. of properties 15 15 18 - -
Occupancy rate % 99.1 99.1 99.3 - -
Outstanding interest-bearing debt (million yen) 49,500 49,500 54,000 - -
LTV % 46.0 46.0 48.1 - -
No. of outstanding investment units (units) 293,750 293,750 293,750 - -
Note 1: The forecast is calculated subject to a certain assumption as of June 14, 2017. Therefore, it is possible to be changed due to rent income volatility through tenants removals, additional unit issuance and so on.
Note 2: The forecast is calculated subject to a certain assumption as of November 10, 2017. Therefore, it is possible to be changed due to rent income volatility through tenants removals, additional unit issuance and so on.
Reviewing on the effect of “Strategy of Links” execution, we revise the forecasts for the 4th FP and DPU.
As to the forecasts for the 5th FP reflecting the effect of Nara Heijo Plaza renewal opening, we are going to
announce in Financial Report for the “Fiscal Period ended October 2017” to be released on December 11, 2017.

本文ページ
MEMO

本文ページ
MEMO
本文ページ
Disclaimer
Monetary amounts are rounded down to billions, millions or thousands of yen.
Percentage figures are rounded off to the first decimal place.
This material contains forward-looking business results, plans, and management targets and strategies. Such forward-looking statements are based on current
assumptions and conditions, including those regarding anticipated future developments and business environmental trends, and these assumptions and
conditions may not always be correct. Actual results could differ considerably because of various factors.
This material has not been prepared for the purpose of soliciting the purchase of the investment units of MIRAI Corporation (“MIRAI”) or to solicit the signing of
other financial product transaction contracts. In making investments, investors should do so based on their own judgments and responsibilities.
The investment units of MIRAI are closed-end fund investment units, whereby investment units are not redeemable at the request of investors. Investors wishing
to liquidate their investment units will, in principle, need to sell them to third parties. The market value of the investment units will be influenced by investor
supply and demand at securities exchanges and will fluctuate in accordance with the interest rate situation, economic circumstances, real estate prices, and
other market factors. It is therefore possible that investors will not be able to sell the investment units at their acquisition price and, as a result, may suffer losses.
MIRAI plans to make cash distributions to investors, but whether or not distributions are made and the amount of distributions thereof are not guaranteed under
any circumstances. Gains or losses on the sale of real estate, losses on the disposal of fixed assets accompanying the replacement of structures, and other
factors can cause fiscal-period income to vary significantly, which would result in a change in the amount of distribution to be made.
Information provided herein does not constitute any of the disclosure documents or performance reports required by the Financial Instruments and Exchange Act
or the Act on Investment Trusts and Investment Corporations or by the Securities Listing Regulations of the Tokyo Stock Exchange.
This material is to be read and used at the responsibility of customers. MIRAI and related persons involved in the preparation and publication of this material will
not bear any responsibility for any damage arising from the use of this material (whether for direct or indirect damage, and regardless of the cause thereof).
While every effort has been made to avoid errors and omissions regarding the information presented in this material, the material has been created as an easy
reference for customers, and the presented information may contain inaccuracies or misprints. MIRAI bears no responsibility for the accuracy, completeness,
appropriateness or fairness.
MIRAI holds the copyrights to the information appearing in this material. Copying, altering, publishing, distributing, appropriating, or displaying this information or
using it for commercial purposes without the prior approval of MIRAI is prohibited. In addition, trademarks (trademarks, logos, and service marks) related to
MIRAI appearing in this material are owned by MIRAI, and copying, altering, publishing, distributing, appropriating, or reproducing such trademarks or using
them for commercial purposes without the permission of MIRAI is prohibited.
This material may include properties that are not held by or planned to be acquired by MIRAI.
@MIRAI Corporation. All rights reserved.
Asset Manger: Mitsui & IDERA Partners Co., Ltd.
- Financial Instruments Business Operator (Director of Kanto Finance Bureau (Kinsho) No. 2876)
- Member of The Investment Trusts Association, Japan


![[Shinobi]Mirai Nikki - Prolog](https://static.fdocuments.net/doc/165x107/568bd7171a28ab20349e6faa/shinobimirai-nikki-prolog.jpg)
