Minute 319 Colorado River Delta Environmental Flows Monitoring Initial ... · Minute 319 Colorado...
20
Minute 319 Colorado River Delta Environmental Flows Monitoring Initial Progress Report December 4, 2014
Transcript of Minute 319 Colorado River Delta Environmental Flows Monitoring Initial ... · Minute 319 Colorado...
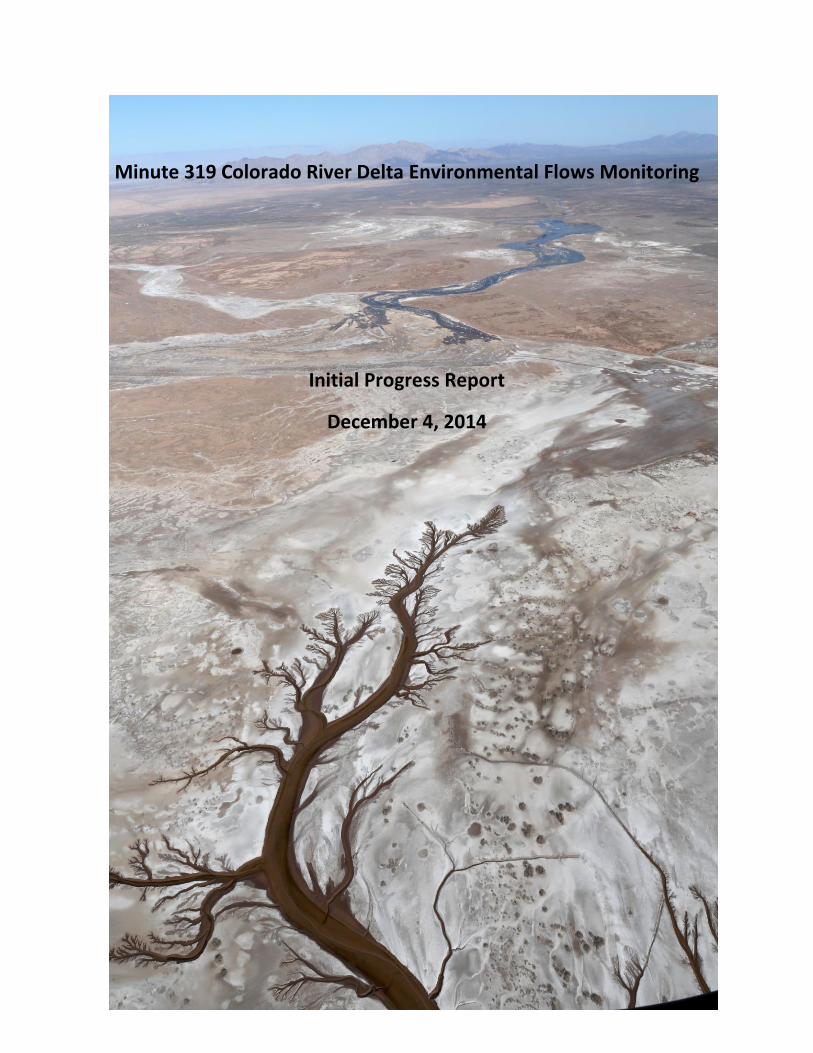
Minute 319 Colorado River Delta Environmental Flows Monitoring
Initial Progress Report
December 4, 2014
1
Authority
This report and study was carried out by the United States and Mexico in accordance with Section III.6-
Water for the Environment and ICMA/ICS Exchange Pilot Program under Minute 319 of the International
Boundary and Water Commission, United States and Mexico entitled “Interim International Cooperative
Measures in the Colorado River basin through 2017 and Extension of Minute 318 Cooperative Measures
to address the continued effects of the April 2010 earthquake in the Mexicali Valley, Baja California”,
dated November 20, 2012. This interim report was prepared as a step in furtherance of Minute No. 319
Art. III.6.f, and includes information on the environmental results achieved by the delivery of water
pursuant to the pilot program.
Participating Agencies
International Boundary and Water Commission
United States and Mexico
For the United States:
Environmental Defense Fund
Sonoran Institute
The Colorado River Basin States
The Nature Conservancy
University of Arizona
U.S. Department of the Interior, Bureau of Reclamation
U.S. Geological Survey
For Mexico:
El Colegio de la Frontera Norte
Comisión Nacional de Áreas Naturales Protegidas
Comisión Nacional del Agua
Pronatura Noroeste
Universidad Autónoma de Baja California
2
Acknowledgements
This report was prepared for the International Boundary and Water Commission by Dr. Karl Flessa
(University of Arizona), Dr. Eloise Kendy (The Nature Conservancy) and Karen Schlatter (Sonoran
Institute) on behalf of all the people and organizations engaged in monitoring in the Colorado River
Delta under Minute 319.
These efforts represent a collaborative effort of many entities who directly and indirectly participated in
all phases of this study promoting a binational partnership among federal agencies, universities, and
non-governmental organizations.
*Cover photo credit, Colorado River connecting to the delta- Francisco Zamora with support from
LightHawk
Pulse Flow and Base Flow Monitoring Funding Provided By:
Alianza WWF – Fundación Carlos Slim Anne Ray Charitable Trust
Anonymous Colegio de la Frontera Norte
Comisión Nacional de Áreas Naturales Protegidas Comisión Nacional del Agua
The David and Lucile Packard Foundation Environmental Defense Fund
International Boundary and Water Commission, United States and Mexico LightHawk
Pronatura Noroeste Raise the River
Sonoran Institute Sonoran Joint Venture
The Nature Conservancy University of Arizona
U.S. Department of the Interior, Bureau of Reclamation U.S. Geological Survey
Universidad Autónoma de Baja California Walton Family Foundation
3
Table of Contents 1.0 INTRODUCTION AND EXECUTIVE SUMMARY................................................................................................. 4
1.1 INTRODUCTION ........................................................................................................................................... 4
1.2 EXECUTIVE SUMMARY ................................................................................................................................ 4
2.0 SUMMARY OF MONITORING METHODOLOGY .............................................................................................. 8
3.0 INITIAL RESULTS ............................................................................................................................................. 9
3.1 PULSE FLOW AND BASE FLOW WATER DELIVERIES ................................................................................... 9
3.2 SURFACE WATER ...................................................................................................................................... 10
3.3 GROUNDWATER ...................................................................................................................................... 14
3.4 GEOMORPHOLOGY .................................................................................................................................. 15
3.5 VEGETATION ............................................................................................................................................ 16
3.6 BIRDS ........................................................................................................................................................ 18
4.0 CONTINUING ACTIVITIES ............................................................................................................................... 19
List of Tables
Table 1. Representatives of the binational Minute 319 Environmental Flows Team ................................. 6
Table 2. Representatives of binational teams responsible for monitoring the ecosystem response of the
pulse flow and base flow. ............................................................................................................................. 7
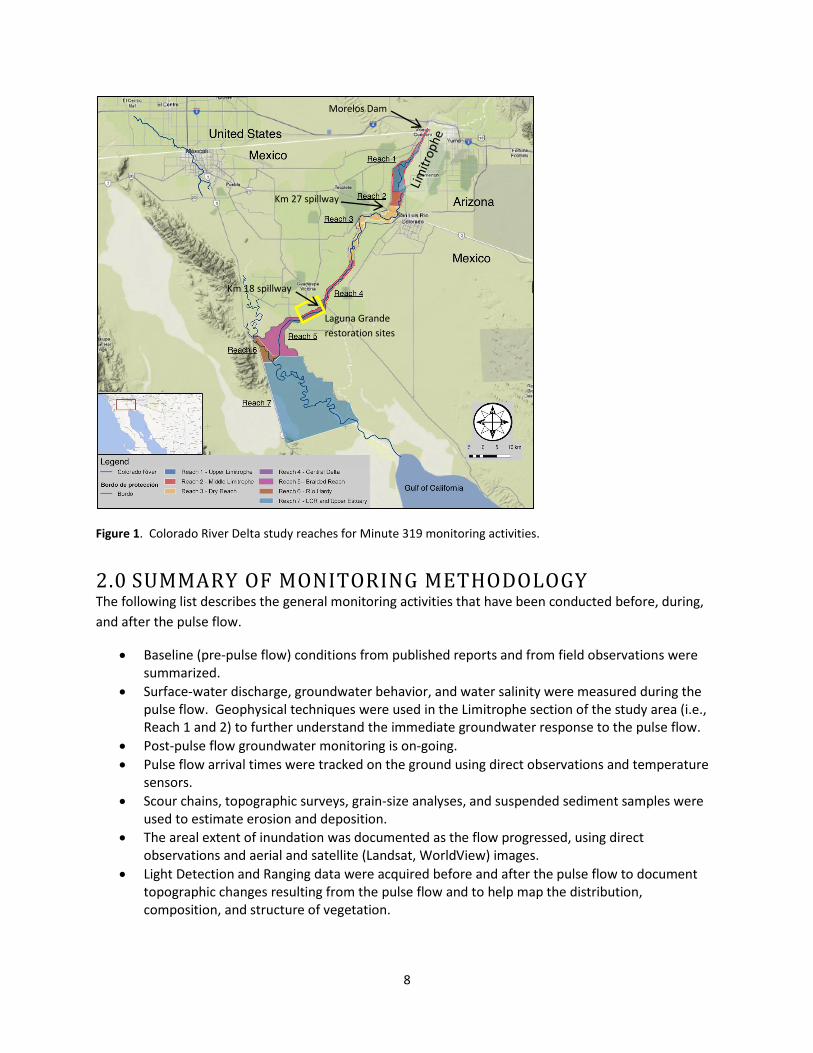
List of Figures Figure 1. Colorado River Delta study reaches for Minute 319 monitoring activities. ................................. 8
Figure 2. Delivered and requested pulse flow water deliveries to the study area.. .................................. 10
Figure 3. Variation in discharge through time at three discharge measuring stations in Reach 3 and
discharges at Morelos Dam and at the Km 27 and Km 18 spillways. ......................................................... 11
Figure 4. Progress of surface pulse flow water. ......................................................................................... 12
Figure 5. View looking north, from tidal waters of the Gulf of California to Colorado River pulse flow... 13
Figure 6. Percentage of total pulse flow remaining as surface flow with increasing distance downstream
from Morelos Dam.. .................................................................................................................................... 13
Figure 7. Example of groundwater response to pulse flow in Reach 4. .................................................... 14
Figure 8. Example of channel change at USGS cross section 12 in the Limitrophe reach .......................... 15
Figure 9. Cottonwood and willow seedlings in the Laguna Grande restoration site on May 17, 2014 ..... 16
Figure 10. Decrease in the Enhanced Vegetation Index from MODIS imagery in Colorado River Delta
river reaches, 2000 to April 9, 2014.. .......................................................................................................... 17
Figure 11. Average avian diversity (Hill´s N2 Diversity Index) per point from 2002 to 2013 at 136 survey
sites along the floodplain of the Colorado River in Mexico, between the Southerly International
Boundary and the confluence of the Colorado with the Hardy River. ....................................................... 18
4
1.0 INTRODUCTION AND EXECUTIVE SUMMARY
1.1 INTRODUCTION Minute No. 319 (Minute 319), Interim International Cooperative Measures in the Colorado River Basin
Through 2017 and Extension of Minute 318 Cooperative Measures to Address the Continued Effects of
the April 2010 Earthquake in the Mexicali Valley, Baja California, was signed by the two Sections of the
International Boundary and Water Commission (IBWC) on November 20, 2012. A component of Minute
319 is Section III.6, Water for the Environment and ICMA/ICS Exchange Pilot Program (ICMA –
Intentionally Created Mexican Allocation; ICS – Intentionally Created Surplus), which outlines that the
“pilot program will arrange for the means to create 158,088 acre-feet (195 mcm) of water for base flow
and pulse flow for the Colorado River Limitrophe and its delta by means of the participation of the
United States, Mexico, and non-governmental organizations.” “Implementation of this Minute will
provide a mechanism to deliver both base flow and pulse flow”…”tentatively during 2014 but no later
than 2016.” “[T]he information developed through implementation of this Minute will be used to
inform future decisions regarding binational cooperative efforts to address proactive actions in the
Colorado River Delta.” “To provide for the delivery of the base flow and pulse flow for environmental
purposes under this Minute, the Commissioners [of both Sections of the IBWC] will direct the
Consultative Council and the Environmental Work Group to prepare a Delivery Plan, which will include a
schedule of monthly flows, delivery points and volumes in an amount of approximately 105,392 acre-
feet (130 mcm) for pulse flow and 52,696 acre-feet (65 mcm) for base flow.” A portion of the funds
provided in Section III.6.d by the United States will provide funding for projects in Mexico which will
generate 50% of this pulse flow. The sources of water to implement this flow shall be from ICMA
created or water deferred by Mexico under Section III.1. The Consultative Council and Environmental
Work Group formed and tasked a binational Environmental Flows Team (Table 1) to develop the
Delivery Plan (membership included representatives of U.S. and Mexican Federal and State agencies and
non-governmental organizations).
As part of the pilot program, Minute 319 required that “resources for a joint investigation of the
different aspects of the pilot program should be obtained. The resources for this investigation should be
provided by the United States and Mexico.” Environmental flows were one of the items to be
investigated through an evaluation of the “the ecosystem response, most importantly the hydrological
response, and secondarily, the biological response.” To achieve this goal, the binational Environmental
Flows Team worked with scientists and experts to develop plans for ecosystem response monitoring.
Ecosystem monitoring was conducted before, during, and after the March 23 to May 18, 2014 pulse
flow. Monitoring activities were conducted in the riparian corridor of the Colorado River Delta (Fig. 1)
by binational teams (Table 2) and these activities will continue through 2017. This Initial Progress
Report summarizes activities and preliminary results through July 24, 2014. Additional reporting will
follow with the preparation of an Interim Report by December 2016 and a Final Report by June 2018.
1.2 EXECUTIVE SUMMARY As provided in Minute 319 of the U.S.-Mexico Water Treaty of 1944, a pulse flow of approximately 130
million cubic meters (105,392 acre-feet) was released to the riparian corridor of the Colorado River
Delta from Morelos Dam at the U.S.-Mexico border. The water was delivered over an eight-week period
5
that began on March 23, 2014 and ended on May 18, 2014. Peak flows were released early in this
period to simulate a spring flood. Some pulse flow water was released to the riparian corridor via
Mexicali Valley irrigation canals.
Base flow volumes totaling 65 mcm (52,696 acre-feet) are also being delivered to new and pre-existing
restoration areas during the term of Minute 319 through December 31, 2017. One hundred and twenty-
nine hectares (320 acres) of non-native vegetation in the Laguna Grande area were cleared and graded
to promote regeneration of native vegetation. Portions of the site were hydro-seeded with native
vegetation and 38 hectares (94 acres) of the site were planted with native trees. In the Miguel Aleman
restoration site, 35 hectares (86 acres) were cleared and graded and of these, 10 hectares (25 acres)
were planted with native trees.
The monitoring program established by Minute 319 assembled baseline information on the hydrology
and biology of the riparian corridor and deployed binational, multi-agency teams of scientists during and
after the pulse flow. Results of these efforts through July 24, 2014 are reported in this interim report.
Ground-based and remotely-sensed data were collected to evaluate the ecosystem response to the
pulse flow.
Surface water from the pulse flow rapidly infiltrated into the sandy subsurface in the first 60 km (37
miles) downstream of Morelos Dam. Scour and deposition modified the channel bed topography, but
bank erosion of the existing channel was minor. Smaller volumes inundated the river channel farther
downstream, including areas that had been prepared for restoration of native vegetation. Pulse flow
surface water reached the Gulf of California on May 15, 2014.
The water table rose in response to the pulse flow. Groundwater effects dampened with increasing
distance from the active channel. The initial slow groundwater-level rise in dry sediment was followed
by more rapid changes in groundwater levels as the sediment saturated. The water table then declined
at varying rates after its peak.
Seeds of both native and non-native vegetation dispersed during the pulse flow release and recession.
Both native and non-native vegetation germinated in response to the pulse flow. Seedlings of native
species were present primarily in Reaches 1 and 4 (Figure 1). Preliminary remote-sensing data and
aerial observations suggest that greenness has increased, compared to prior years, since the pulse flow.
As expected, surveys of resident birds, in the short time since the pulse flow, showed little change over
previous years. Populations of migratory birds are affected by many factors in addition to changes in
the delta’s riparian habitats.
Future work includes additional analyses of hydrologic and biological data collected during and
immediately after the pulse flow, periodic ground-based and remotely-sensed monitoring of new and
pre-existing vegetation, monitoring of ground water behavior in restoration sites, comparison of pre-
and post-pulse flow Lidar data on topography and vegetation cover, and monitoring of bird life. Future
reports are scheduled for December 2016 and June 2018.
6
Table 1. Representatives of the binational Minute 319 Environmental Flows Team
Co-Chairs Osvel Hinojosa, Pronatura Noroeste Jennifer Pitt, Environmental Defense Fund
Team Members
Gilbert Anaya, International Boundary and Water Commission, US Section
Francisco Bernal, International Boundary and Water Commission, Mexican Section
Tom Buschatzke, Arizona Department of Water Resources
Yamilett Carillo, Colorado River Delta Water Trust
Adrian Cortez, International Boundary and Water Commission, US Section
Peter Culp, Squire Patton Boggs
Carlos de la Parra, Colegio de la Frontera Norte
Albert Flores, International Boundary and Water Commission, US Section
José Gutiérrez, CONAGUA
Kasandra Gutiérrez, CONAGUA
Ted Kowalski, Colorado Water Conservation Board
José Luis López Gerardo, CONAGUA
Mario López Pérez, CONAGUA
Jennifer McCloskey, United States Department of the Interior Bureau of Reclamation
Don Ostler, Upper Colorado River Commission
Carlos Pena, International Boundary and Water Commission, US Section
Antonio Rascón, International Boundary and Water Commission, Mexican Section
Adriana Reséndez, International Boundary and Water Commission, Mexican Section
Adriana Rodriguez, CONAGUA
Seth Shanahan, Southern Nevada Water Authority
Eduardo Soto, CONANP
Tanya Trujillo, Colorado River Board of California
Laura Vecerina, United States Department of the Interior, Bureau of Reclamation
Terri Wilson, United States Department of the Interior, Bureau of Reclamation
Amy Witherall, United States Department of the Interior, Bureau of Reclamation
Francisco Zamora, Sonoran Institute
7
Project Management Team
Karl W. Flessa, Co-Chief Scientist, University of Arizona
Carlos de la Parra-Rentería, Co-Chief Scientist, Colegio de la Frontera Norte
Eloise Kendy, The Nature Conservancy
Karen Schlatter, Sonoran Institute
Hydrology Team
Jeff Kennedy, U.S. Geological Survey
James Leenhouts, U.S. Geological Survey
Erich Mueller, U.S. Geological Survey
Jorge Ramírez-Hernández, Universidad Autónoma de Baja California
J. Eliana Rodríguez-Burgueño, Universidad Autónoma de Baja California
Jack Schmidt, U.S. Geological Survey
Margaret Shanafield, Flinders University
Anna Morales, International Boundary and Water Commission, U.S. Section Francisco Bernal, International Boundary and Water Commission, Mexican Section
Vegetation and Wildlife Team
Ed Glenn, University of Arizona Martha Gomez-Sapiens, University of Arizona
Osvel Hinojosa-Huerta, Pronatura Noroeste
Karen Schlatter, Sonoran Institute
Pat Shafroth, U. S. Geological Survey
Eduardo Soto, Comisión Nacional de Áreas Naturales Protegidas
River Corridor Team for the Lower Delta
Karen Schlatter, Sonoran Institute
Francisco Zamora-Arroyo, Sonoran Institute
Remote-Sensing Team
Ed Glenn, University of Arizona
Pamela Nagler, U.S. Geological Survey
Steve Nelson, Independent scientist
Jeff Milliken, Bureau of Reclamation
Francisco Zamora-Arroyo, Sonoran Institute
Table 2. Representatives of binational teams responsible for monitoring the ecosystem response of the pulse flow
and base flow.
8
Figure 1. Colorado River Delta study reaches for Minute 319 monitoring activities.
2.0 SUMMARY OF MONITORING METHODOLOGY The following list describes the general monitoring activities that have been conducted before, during,
and after the pulse flow.
Baseline (pre-pulse flow) conditions from published reports and from field observations were summarized.
Surface-water discharge, groundwater behavior, and water salinity were measured during the pulse flow. Geophysical techniques were used in the Limitrophe section of the study area (i.e., Reach 1 and 2) to further understand the immediate groundwater response to the pulse flow.
Post-pulse flow groundwater monitoring is on-going.
Pulse flow arrival times were tracked on the ground using direct observations and temperature sensors.
Scour chains, topographic surveys, grain-size analyses, and suspended sediment samples were used to estimate erosion and deposition.
The areal extent of inundation was documented as the flow progressed, using direct observations and aerial and satellite (Landsat, WorldView) images.
Light Detection and Ranging data were acquired before and after the pulse flow to document topographic changes resulting from the pulse flow and to help map the distribution, composition, and structure of vegetation.
Laguna Grande
restoration sites
Km 27 spillway
Km 18 spillway
Morelos Dam
9
Topography was surveyed along 21 transects perpendicular to the channel in order to relate the germination, growth, and survival of new vegetation to changes in channel and floodplain topography.
Germination of native and non-native vegetation was surveyed along 21 transects co-located with topographic survey transects and groundwater monitoring sites. The influx of seeds, changes in soil salinity and texture, and vegetation cover along the 21 transects were monitored before and during the pulse flow.
One hundred and twenty-nine hectares (320 acres) of non-native vegetation in the Laguna Grande area were cleared and graded to promote regeneration of native vegetation. Portions of the site were hydro-seeded with native vegetation and 38 hectares (94 acres) of the site were planted with native trees. Detailed surveys of new vegetation, groundwater conditions, soil conditions, and bird populations were conducted.
In the Miguel Aleman restoration site, 35 hectares (86 acres) were cleared and graded and of these, 10 hectares (25 acres) site were planted with native trees.
Vegetation health (“greenness”) assessments that began in 2000 using satellite-based remote-sensing data are on-going.
Photographic images at fixed locations within the riparian corridor shortly before and during the pulse flow were assembled. Repeat photography continues to be collected.
Baseline vegetation and riparian bird surveys (begun in 2002) and marsh bird surveys (begun in 2004) were expanded to include additional areas in the Limitrophe, restoration sites and elsewhere.
Zooplankton and water quality continue to be monitored between the Gulf of California and the lowermost river reaches.
3.0 INITIAL RESULTS
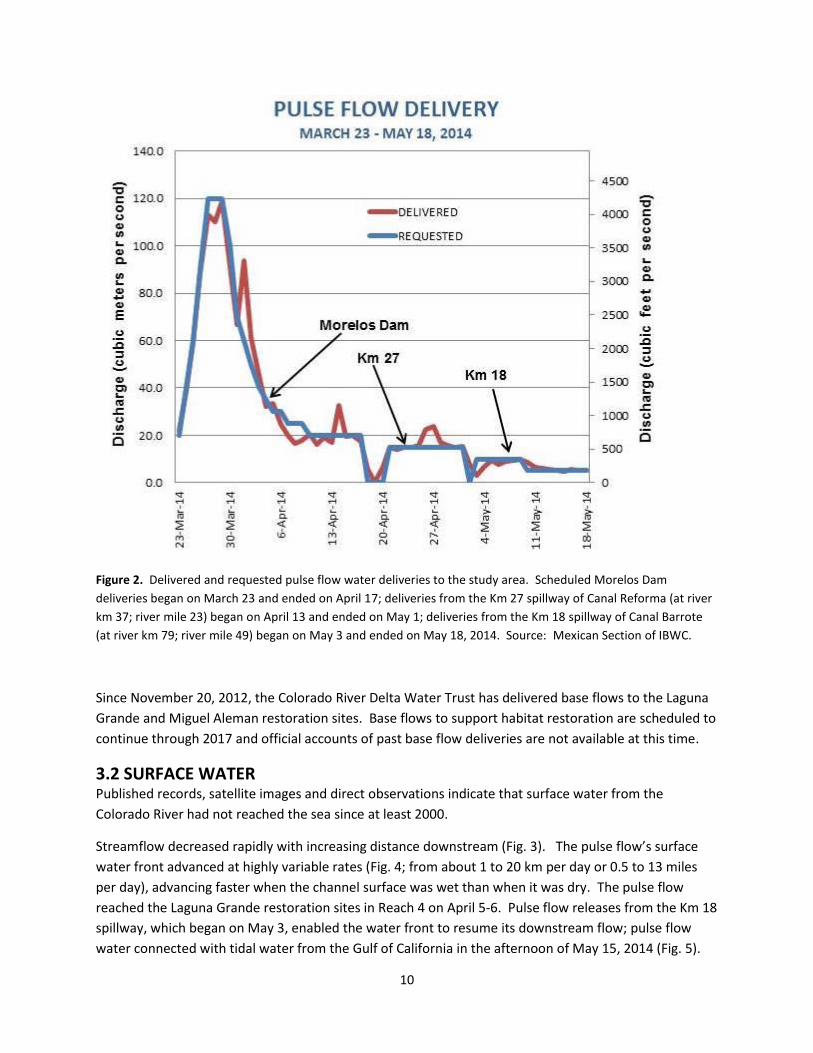
3.1 PULSE FLOW AND BASE FLOW WATER DELIVERIES The pulse flow delivered a total of 1321 million cubic meters (mcm) (107,000 acre-feet [af]) to the
riparian corridor of the Colorado River Delta, starting March 23 and ending on May 18, 2014. Water was
delivered from Morelos Dam, and from the Km 27 spillway of Canal Reforma (river km 37; river mile 23)
and the Km 18 spillway of Canal Barrote (river km 79; river mile 49) (Fig. 1 and Fig. 2).
11 130 mcm were delivered as the pulse flow delivery, and an additional 2 mcm were delivered as operational surplus.
10
Figure 2. Delivered and requested pulse flow water deliveries to the study area. Scheduled Morelos Dam
deliveries began on March 23 and ended on April 17; deliveries from the Km 27 spillway of Canal Reforma (at river
km 37; river mile 23) began on April 13 and ended on May 1; deliveries from the Km 18 spillway of Canal Barrote
(at river km 79; river mile 49) began on May 3 and ended on May 18, 2014. Source: Mexican Section of IBWC.
Since November 20, 2012, the Colorado River Delta Water Trust has delivered base flows to the Laguna
Grande and Miguel Aleman restoration sites. Base flows to support habitat restoration are scheduled to
continue through 2017 and official accounts of past base flow deliveries are not available at this time.
3.2 SURFACE WATER Published records, satellite images and direct observations indicate that surface water from the
Colorado River had not reached the sea since at least 2000.
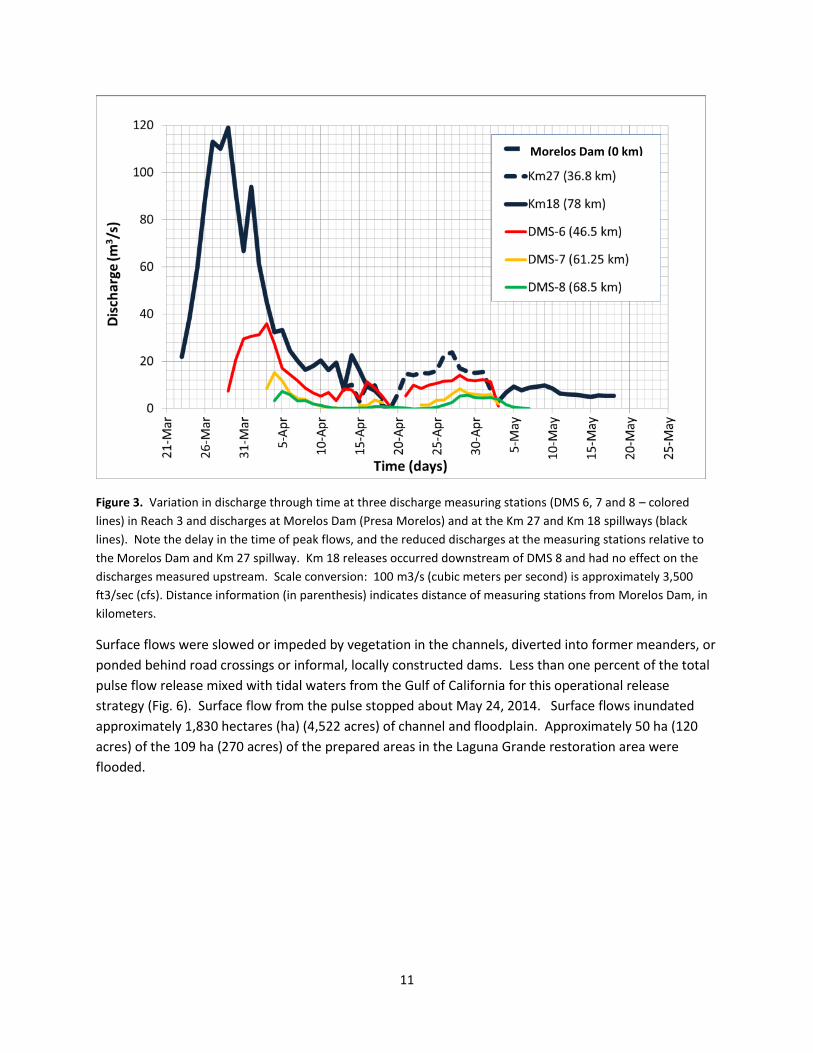
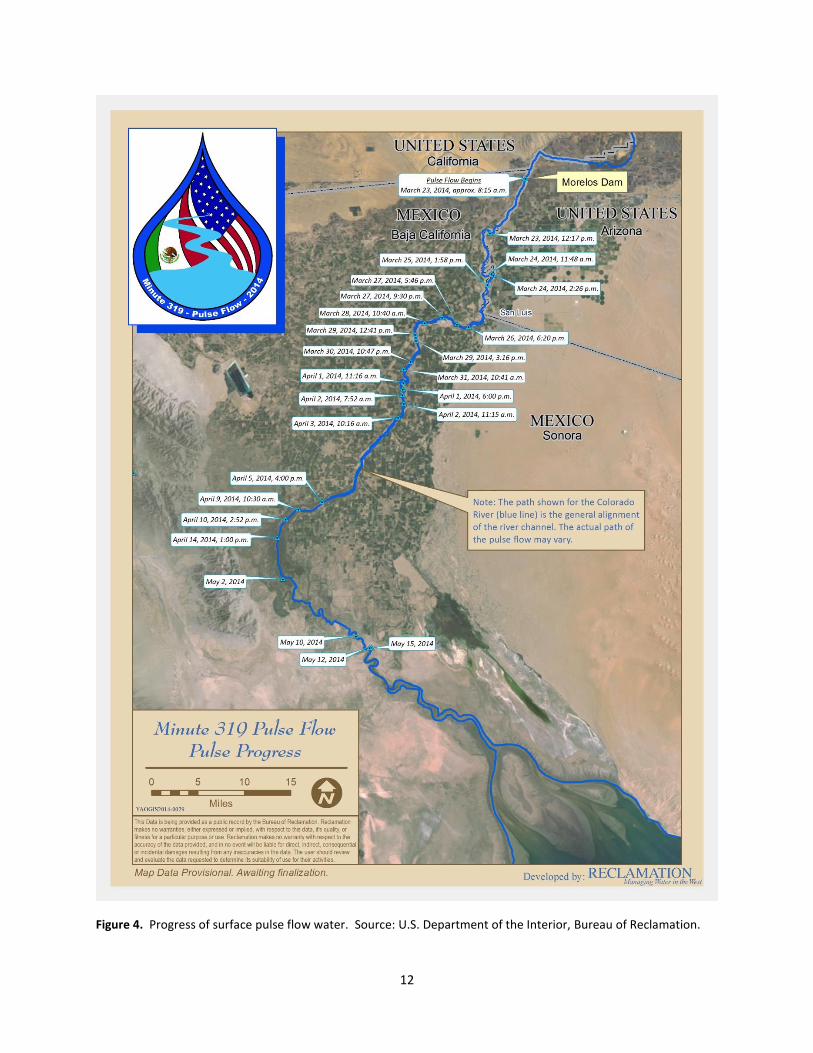
Streamflow decreased rapidly with increasing distance downstream (Fig. 3). The pulse flow’s surface
water front advanced at highly variable rates (Fig. 4; from about 1 to 20 km per day or 0.5 to 13 miles
per day), advancing faster when the channel surface was wet than when it was dry. The pulse flow
reached the Laguna Grande restoration sites in Reach 4 on April 5-6. Pulse flow releases from the Km 18
spillway, which began on May 3, enabled the water front to resume its downstream flow; pulse flow
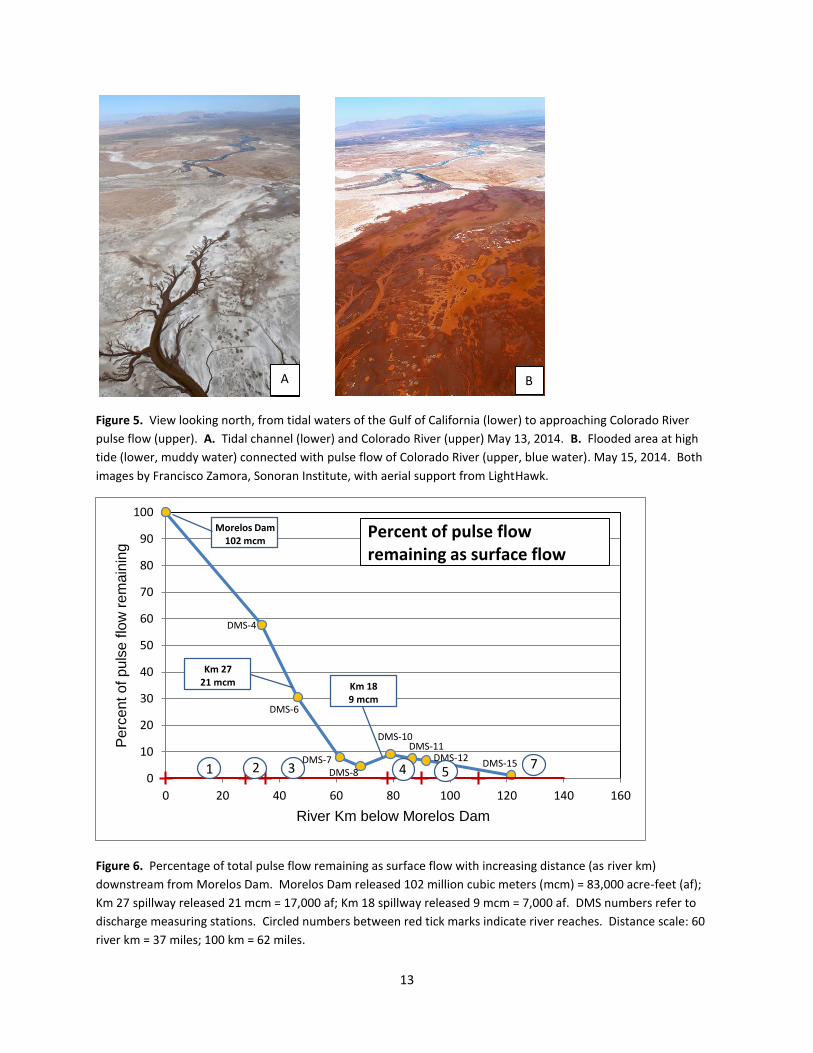
water connected with tidal water from the Gulf of California in the afternoon of May 15, 2014 (Fig. 5).
11
Figure 3. Variation in discharge through time at three discharge measuring stations (DMS 6, 7 and 8 – colored
lines) in Reach 3 and discharges at Morelos Dam (Presa Morelos) and at the Km 27 and Km 18 spillways (black
lines). Note the delay in the time of peak flows, and the reduced discharges at the measuring stations relative to
the Morelos Dam and Km 27 spillway. Km 18 releases occurred downstream of DMS 8 and had no effect on the
discharges measured upstream. Scale conversion: 100 m3/s (cubic meters per second) is approximately 3,500
ft3/sec (cfs). Distance information (in parenthesis) indicates distance of measuring stations from Morelos Dam, in
kilometers.
Surface flows were slowed or impeded by vegetation in the channels, diverted into former meanders, or
ponded behind road crossings or informal, locally constructed dams. Less than one percent of the total
pulse flow release mixed with tidal waters from the Gulf of California for this operational release
strategy (Fig. 6). Surface flow from the pulse stopped about May 24, 2014. Surface flows inundated
approximately 1,830 hectares (ha) (4,522 acres) of channel and floodplain. Approximately 50 ha (120
acres) of the 109 ha (270 acres) of the prepared areas in the Laguna Grande restoration area were
flooded.
Morelos Dam (0 km)
12
Figure 4. Progress of surface pulse flow water. Source: U.S. Department of the Interior, Bureau of Reclamation.
13
Figure 5. View looking north, from tidal waters of the Gulf of California (lower) to approaching Colorado River
pulse flow (upper). A. Tidal channel (lower) and Colorado River (upper) May 13, 2014. B. Flooded area at high
tide (lower, muddy water) connected with pulse flow of Colorado River (upper, blue water). May 15, 2014. Both
images by Francisco Zamora, Sonoran Institute, with aerial support from LightHawk.
Figure 6. Percentage of total pulse flow remaining as surface flow with increasing distance (as river km)
downstream from Morelos Dam. Morelos Dam released 102 million cubic meters (mcm) = 83,000 acre-feet (af);
Km 27 spillway released 21 mcm = 17,000 af; Km 18 spillway released 9 mcm = 7,000 af. DMS numbers refer to
discharge measuring stations. Circled numbers between red tick marks indicate river reaches. Distance scale: 60
river km = 37 miles; 100 km = 62 miles.
0
10
20
30
40
50
60
70
80
90
100
0 20 40 60 80 100 120 140 160
Pe
rce
nt o
f p
uls
e f
low
re
ma
inin
g
River Km below Morelos Dam
DMS-4
DMS-6
DMS-7DMS-8
DMS-10DMS-11
DMS-12DMS-15
Percent of pulse flow remaining as surface flow
1 2 3 4 57
Morelos Dam102 mcm
Km 2721 mcm Km 18
9 mcm
A B
14
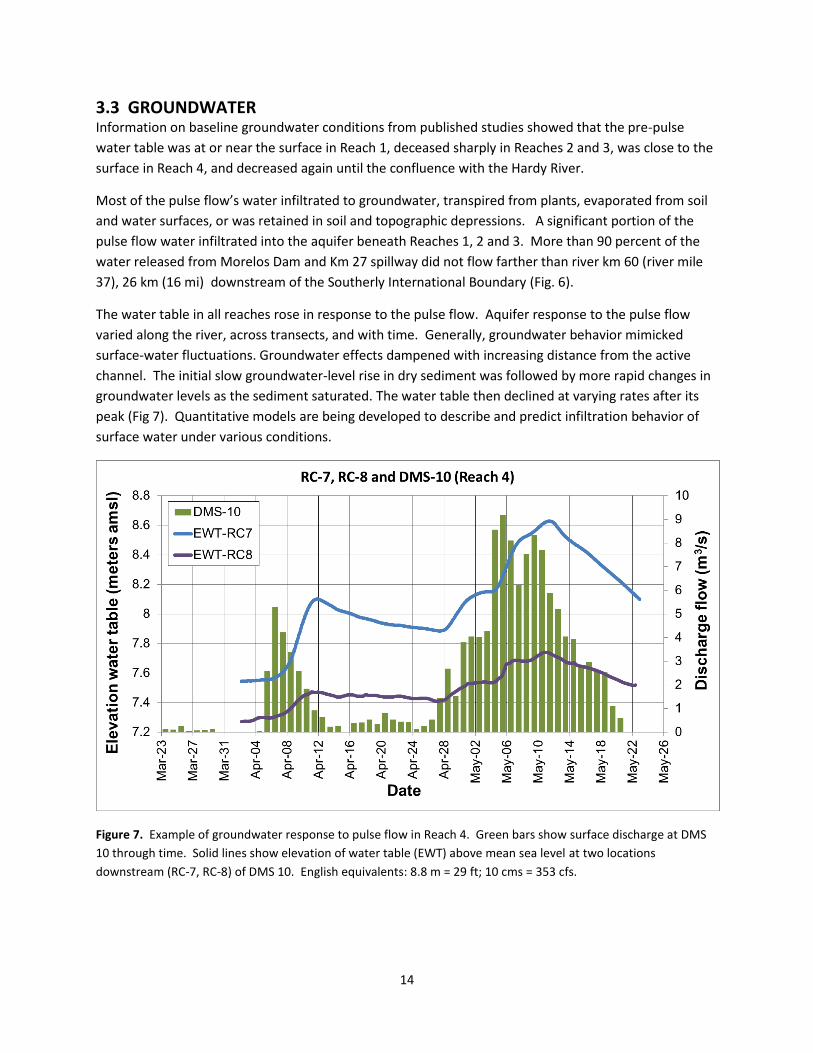
3.3 GROUNDWATER Information on baseline groundwater conditions from published studies showed that the pre-pulse
water table was at or near the surface in Reach 1, deceased sharply in Reaches 2 and 3, was close to the
surface in Reach 4, and decreased again until the confluence with the Hardy River.
Most of the pulse flow’s water infiltrated to groundwater, transpired from plants, evaporated from soil
and water surfaces, or was retained in soil and topographic depressions. A significant portion of the
pulse flow water infiltrated into the aquifer beneath Reaches 1, 2 and 3. More than 90 percent of the
water released from Morelos Dam and Km 27 spillway did not flow farther than river km 60 (river mile
37), 26 km (16 mi) downstream of the Southerly International Boundary (Fig. 6).
The water table in all reaches rose in response to the pulse flow. Aquifer response to the pulse flow
varied along the river, across transects, and with time. Generally, groundwater behavior mimicked
surface-water fluctuations. Groundwater effects dampened with increasing distance from the active
channel. The initial slow groundwater-level rise in dry sediment was followed by more rapid changes in
groundwater levels as the sediment saturated. The water table then declined at varying rates after its
peak (Fig 7). Quantitative models are being developed to describe and predict infiltration behavior of
surface water under various conditions.
Figure 7. Example of groundwater response to pulse flow in Reach 4. Green bars show surface discharge at DMS
10 through time. Solid lines show elevation of water table (EWT) above mean sea level at two locations
downstream (RC-7, RC-8) of DMS 10. English equivalents: 8.8 m = 29 ft; 10 cms = 353 cfs.
15
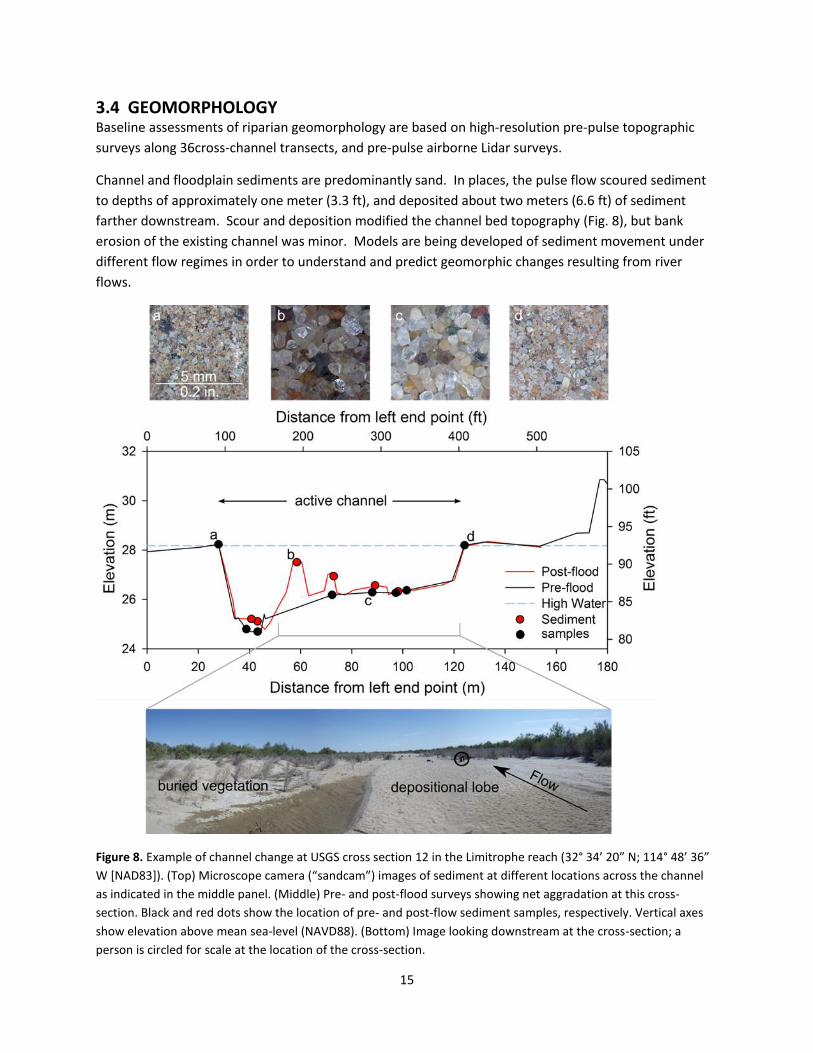
3.4 GEOMORPHOLOGY Baseline assessments of riparian geomorphology are based on high-resolution pre-pulse topographic
surveys along 36cross-channel transects, and pre-pulse airborne Lidar surveys.
Channel and floodplain sediments are predominantly sand. In places, the pulse flow scoured sediment
to depths of approximately one meter (3.3 ft), and deposited about two meters (6.6 ft) of sediment
farther downstream. Scour and deposition modified the channel bed topography (Fig. 8), but bank
erosion of the existing channel was minor. Models are being developed of sediment movement under
different flow regimes in order to understand and predict geomorphic changes resulting from river
flows.
Figure 8. Example of channel change at USGS cross section 12 in the Limitrophe reach (32° 34’ 20” N; 114° 48’ 36”
W [NAD83]). (Top) Microscope camera (“sandcam”) images of sediment at different locations across the channel
as indicated in the middle panel. (Middle) Pre- and post-flood surveys showing net aggradation at this cross-
section. Black and red dots show the location of pre- and post-flow sediment samples, respectively. Vertical axes
show elevation above mean sea-level (NAVD88). (Bottom) Image looking downstream at the cross-section; a
person is circled for scale at the location of the cross-section.
16
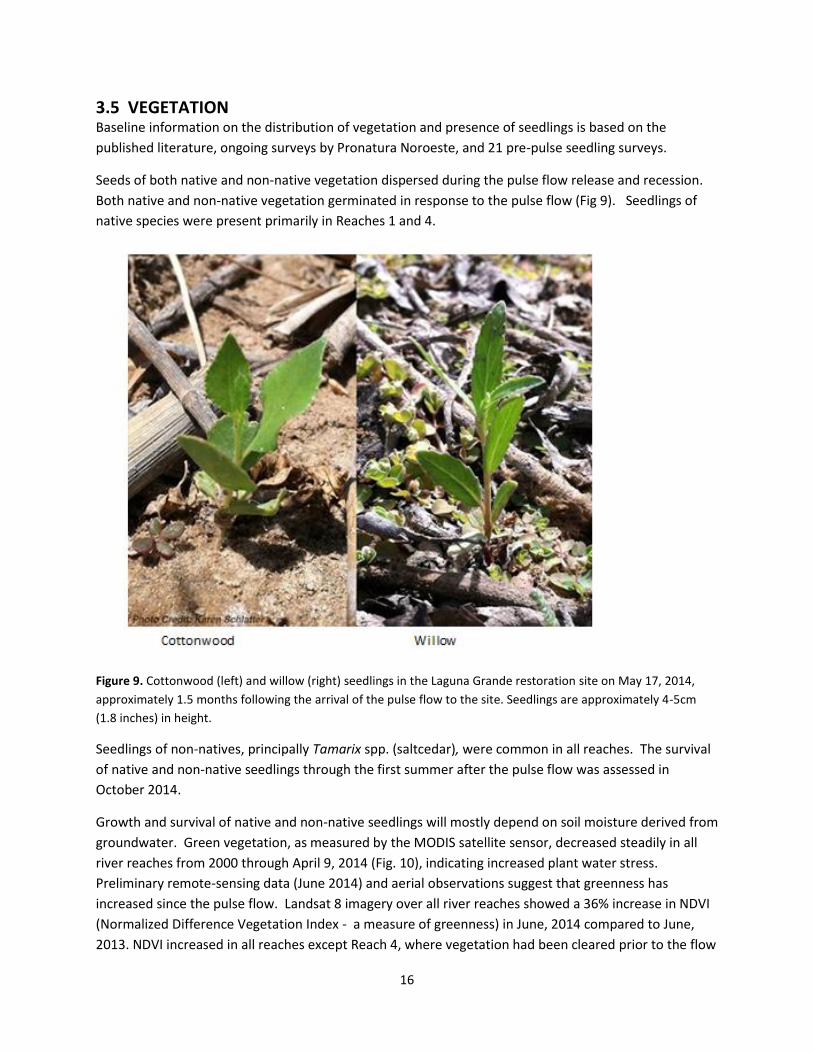
3.5 VEGETATION Baseline information on the distribution of vegetation and presence of seedlings is based on the
published literature, ongoing surveys by Pronatura Noroeste, and 21 pre-pulse seedling surveys.
Seeds of both native and non-native vegetation dispersed during the pulse flow release and recession.
Both native and non-native vegetation germinated in response to the pulse flow (Fig 9). Seedlings of
native species were present primarily in Reaches 1 and 4.
Figure 9. Cottonwood (left) and willow (right) seedlings in the Laguna Grande restoration site on May 17, 2014,
approximately 1.5 months following the arrival of the pulse flow to the site. Seedlings are approximately 4-5cm
(1.8 inches) in height.
Seedlings of non-natives, principally Tamarix spp. (saltcedar), were common in all reaches. The survival
of native and non-native seedlings through the first summer after the pulse flow was assessed in
October 2014.
Growth and survival of native and non-native seedlings will mostly depend on soil moisture derived from
groundwater. Green vegetation, as measured by the MODIS satellite sensor, decreased steadily in all
river reaches from 2000 through April 9, 2014 (Fig. 10), indicating increased plant water stress.
Preliminary remote-sensing data (June 2014) and aerial observations suggest that greenness has
increased since the pulse flow. Landsat 8 imagery over all river reaches showed a 36% increase in NDVI
(Normalized Difference Vegetation Index - a measure of greenness) in June, 2014 compared to June,
2013. NDVI increased in all reaches except Reach 4, where vegetation had been cleared prior to the flow
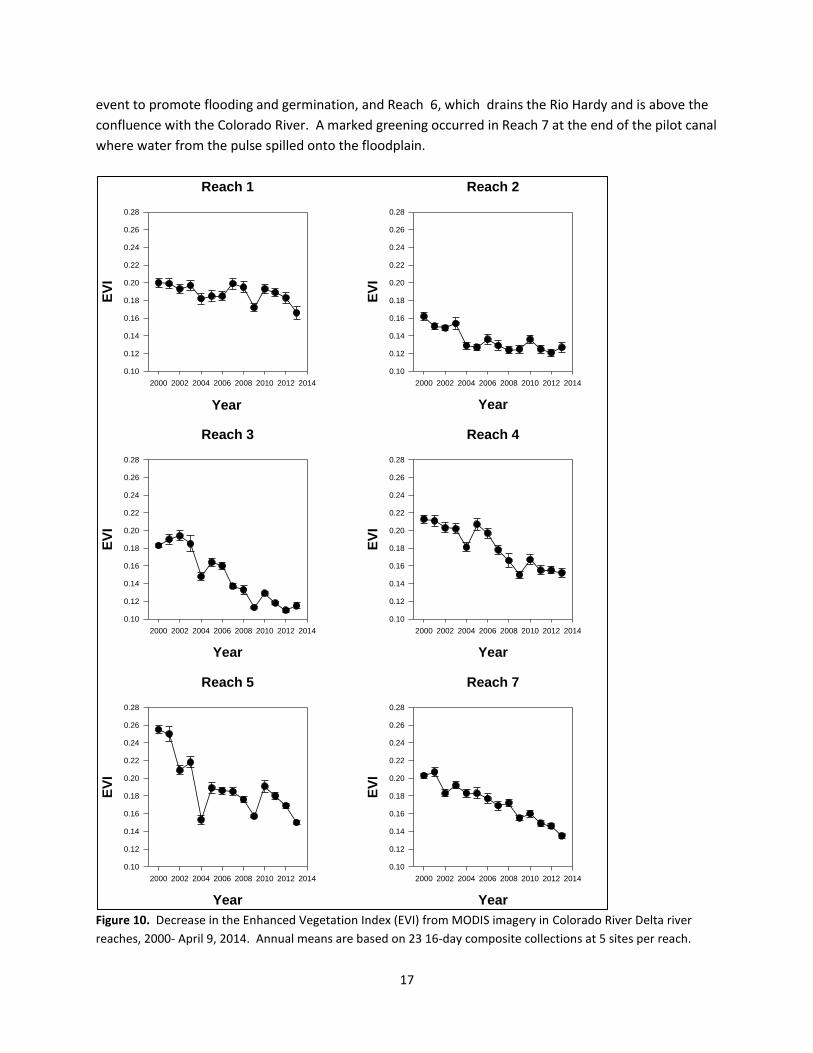
17
event to promote flooding and germination, and Reach 6, which drains the Rio Hardy and is above the
confluence with the Colorado River. A marked greening occurred in Reach 7 at the end of the pilot canal
where water from the pulse spilled onto the floodplain.
Figure 10. Decrease in the Enhanced Vegetation Index (EVI) from MODIS imagery in Colorado River Delta river
reaches, 2000- April 9, 2014. Annual means are based on 23 16-day composite collections at 5 sites per reach.
Reach 1
Year
2000 2002 2004 2006 2008 2010 2012 2014
EV
I
0.10
0.12
0.14
0.16
0.18
0.20
0.22
0.24
0.26
0.28
Reach 2
Year
2000 2002 2004 2006 2008 2010 2012 2014E
VI
0.10
0.12
0.14
0.16
0.18
0.20
0.22
0.24
0.26
0.28
Reach 3
Year
2000 2002 2004 2006 2008 2010 2012 2014
EV
I
0.10
0.12
0.14
0.16
0.18
0.20
0.22
0.24
0.26
0.28
Reach 4
Year
2000 2002 2004 2006 2008 2010 2012 2014
EV
I
0.10
0.12
0.14
0.16
0.18
0.20
0.22
0.24
0.26
0.28
Reach 5
Year
2000 2002 2004 2006 2008 2010 2012 2014
EV
I
0.10
0.12
0.14
0.16
0.18
0.20
0.22
0.24
0.26
0.28
Reach 7
Year
2000 2002 2004 2006 2008 2010 2012 2014
EV
I
0.10
0.12
0.14
0.16
0.18
0.20
0.22
0.24
0.26
0.28
18
Error bars are standard errors of means. Across reaches, EVI decreased by 31%, which corresponds to a 59%
decrease in green foliage density after subtracting out the value for bare soil (about 0.1).
3.6 BIRDS Baseline (pre-pulse) information about birds has been assembled from the published literature and
ongoing surveys of birds conducted by Pronatura Noroeste since 2002.
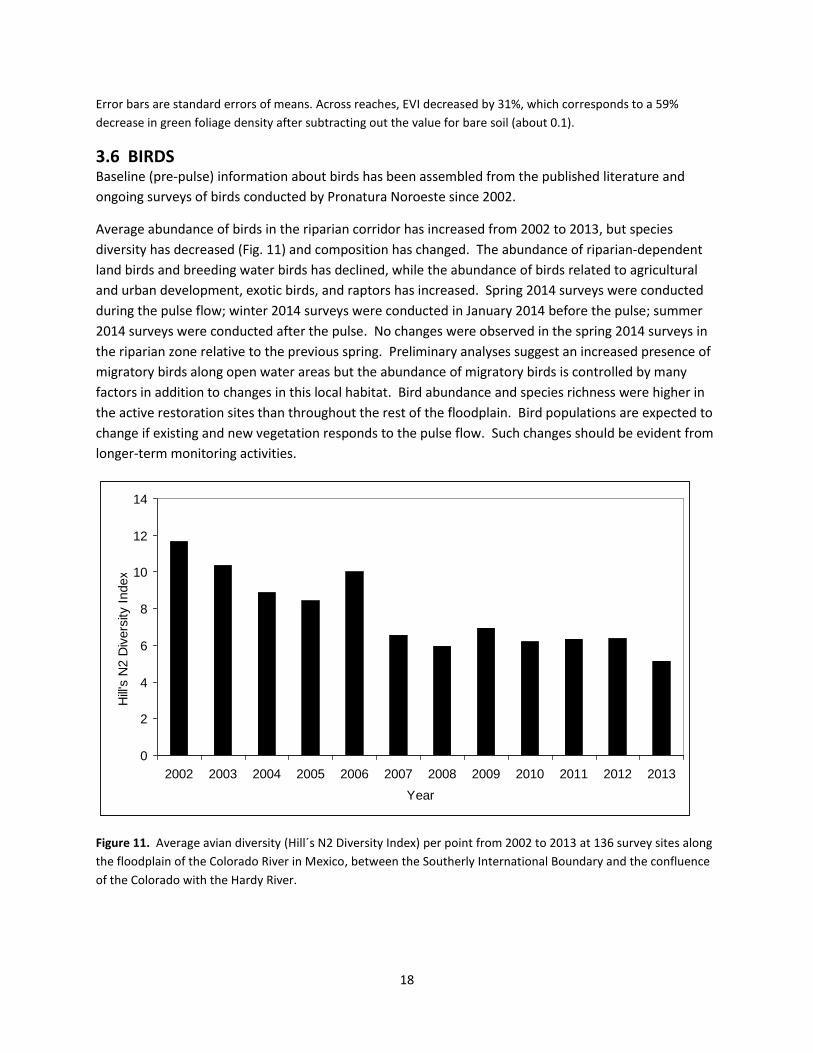
Average abundance of birds in the riparian corridor has increased from 2002 to 2013, but species
diversity has decreased (Fig. 11) and composition has changed. The abundance of riparian-dependent
land birds and breeding water birds has declined, while the abundance of birds related to agricultural
and urban development, exotic birds, and raptors has increased. Spring 2014 surveys were conducted
during the pulse flow; winter 2014 surveys were conducted in January 2014 before the pulse; summer
2014 surveys were conducted after the pulse. No changes were observed in the spring 2014 surveys in
the riparian zone relative to the previous spring. Preliminary analyses suggest an increased presence of
migratory birds along open water areas but the abundance of migratory birds is controlled by many
factors in addition to changes in this local habitat. Bird abundance and species richness were higher in
the active restoration sites than throughout the rest of the floodplain. Bird populations are expected to
change if existing and new vegetation responds to the pulse flow. Such changes should be evident from
longer-term monitoring activities.
Figure 11. Average avian diversity (Hill´s N2 Diversity Index) per point from 2002 to 2013 at 136 survey sites along
the floodplain of the Colorado River in Mexico, between the Southerly International Boundary and the confluence
of the Colorado with the Hardy River.
0
2
4
6
8
10
12
14
2002 2003 2004 2005 2006 2007 2008 2009 2010 2011 2012 2013
Year
Hill
's N
2 D
ivers
ity I
ndex
19
4.0 CONTINUING ACTIVITIES The immediate, direct hydrological effects of the pulse flow will become evident as additional data are
gathered and analyzed. The biological response to the pulse flow will take more time to develop, and
will require additional monitoring, analysis, and synthesis. Existing vegetation response to the pulse
flow and groundwater levels will be tracked, as will the survival and growth of new vegetation, the
success of active restoration efforts, changes in bird populations, and changes in zooplankton.
Hydrology and biology are closely linked in this arid environment. A wealth of high-quality data
continues to be collected to assess the ecosystem response of the pulse flow. Understanding hydrology
and biology response in the riparian zone of the Colorado River Delta is essential to understanding the
effects of the pulse flow of 2014.