Minor Structures for the Improvement of Wave Disturbance ...
11
Research Article Minor Structures for the Improvement of Wave Disturbance in a Small Harbor A. Sulis Center of Environmental Sciences (CINSA), University of Cagliari, 09123 Cagliari, Italy Correspondence should be addressed to A. Sulis; [email protected] Received 12 June 2018; Accepted 8 August 2018; Published 15 October 2018 Academic Editor: Hugo Rodrigues Copyright © 2018 A. Sulis. is is an open access article distributed under the Creative Commons Attribution License, which permits unrestricted use, distribution, and reproduction in any medium, provided the original work is properly cited. A very important aspect in the planning, design, and maintenance of a harbor is to determine the response of the harbor basin to incident waves. e Saras harbor in South Sardinia (Italy) has been experiencing significant wave disturbance that affects the safety of mooring and operational activities. In the framework of a large research, this paper summarises a comprehensive description of new energy absorbing structures that can be seen as an efficient alternative to more traditional structures when limited by economic or technical constraints. Specifically, the paper presents the results of a graphical preliminary approach and a numerical modelling that solves the enhanced Boussinesq equations in two horizontal dimensions. 1. Introduction Harbor tranquillity is an essential condition for safe an- chorage and efficient port operation. Measuring the distri- bution of wave height in a given harbour layout should be related to the ship motion [1]. Here, we focus on the motion of service boats (tug, rescue boat, and coast guard) moored in water of finite depth and the viewpoint of maritime operation is not considered. Service boats remain within the harbor during all weather conditions and navigate at the harbour entrance particularly during severe storm condi- tions. Planning and design of harbor facilities should be based on an comprehensive understanding of the offshore wave modelled from an extreme wave analysis [2] and the estimation of the waves in the harbor for different layout configurations of breakwaters and other protective facilities. Facilities include energy dissipaters in the form of dentated and serrated blocks distributed on the vertical face of quay structures inside the harbor [3]. e amount of wave energy dissipation depends greatly on the slope provided. However, the milder the slope is the more expensive the structure is. In addition, mild slope may not be a technically feasible so- lution particularly in the case of upgrading of existing port- related waterfront structures [4]. Serrated and dentated vertical quay structures are expected to hydrodynamically replace the mild slope structures from dissipating the in- cident wave energy and hence expected to reduce the wave reflection [5]. is paper presents a comprehensive application of graphical and numerical methods to the estimation of harbor tranquillity at the Saras harbor located on the south- west coast of Sardinia, Italy, where the Saras Group owns and operates integrated refinery and gasification plants. A refinery jetty extending 1.6 km into the Mediterranean was constructed to accept tankers of all sizes up to 300′000 DWT. e 10 berths of the jetty, which are about 10 miles south of the port of Cagliari, can take tankers with drafts of 20–39.6 ft. All crude for the refinery and petroleum products is transported by tanker. Service boats (tug, rescue boat, and coast guard) in the Saras harbor provide direct tanker assist service at the jetty. e main aim of the paper is to assess the improvement of harbor tranquillity at the Saras harbor when vertical dentated wall is designed in a large portion of the waterfront where a vertical plane wall exists. e manuscript is organized as follows. Section 2 describes the vertical dentated wall and its design in the Saras harbor. An extreme wave analysis from a 20-year wave dataset is presented in Section 3. e problem of excessive wave disturbance at the Hindawi Advances in Civil Engineering Volume 2018, Article ID 9247407, 10 pages https://doi.org/10.1155/2018/9247407
Transcript of Minor Structures for the Improvement of Wave Disturbance ...

Research ArticleMinor Structures for the Improvement of WaveDisturbance in a Small Harbor
A Sulis
Center of Environmental Sciences (CINSA) University of Cagliari 09123 Cagliari Italy
Correspondence should be addressed to A Sulis asulisunicait
Received 12 June 2018 Accepted 8 August 2018 Published 15 October 2018
Academic Editor Hugo Rodrigues
Copyright copy 2018 A Sulis $is is an open access article distributed under the Creative Commons Attribution License whichpermits unrestricted use distribution and reproduction in any medium provided the original work is properly cited
A very important aspect in the planning design and maintenance of a harbor is to determine the response of the harborbasin to incident waves $e Saras harbor in South Sardinia (Italy) has been experiencing significant wave disturbance thataffects the safety of mooring and operational activities In the framework of a large research this paper summarisesa comprehensive description of new energy absorbing structures that can be seen as an efficient alternative to moretraditional structures when limited by economic or technical constraints Specifically the paper presents the results ofa graphical preliminary approach and a numerical modelling that solves the enhanced Boussinesq equations in twohorizontal dimensions
1 Introduction
Harbor tranquillity is an essential condition for safe an-chorage and efficient port operation Measuring the distri-bution of wave height in a given harbour layout should berelated to the ship motion [1] Here we focus on the motionof service boats (tug rescue boat and coast guard) mooredin water of finite depth and the viewpoint of maritimeoperation is not considered Service boats remain within theharbor during all weather conditions and navigate at theharbour entrance particularly during severe storm condi-tions Planning and design of harbor facilities should bebased on an comprehensive understanding of the offshorewave modelled from an extreme wave analysis [2] and theestimation of the waves in the harbor for different layoutconfigurations of breakwaters and other protective facilitiesFacilities include energy dissipaters in the form of dentatedand serrated blocks distributed on the vertical face of quaystructures inside the harbor [3] $e amount of wave energydissipation depends greatly on the slope provided Howeverthe milder the slope is the more expensive the structure is Inaddition mild slope may not be a technically feasible so-lution particularly in the case of upgrading of existing port-related waterfront structures [4] Serrated and dentated
vertical quay structures are expected to hydrodynamicallyreplace the mild slope structures from dissipating the in-cident wave energy and hence expected to reduce the wavereflection [5]
$is paper presents a comprehensive application ofgraphical and numerical methods to the estimation ofharbor tranquillity at the Saras harbor located on the south-west coast of Sardinia Italy where the Saras Group ownsand operates integrated refinery and gasification plants Arefinery jetty extending 16 km into the Mediterranean wasconstructed to accept tankers of all sizes up to 300prime000 DWT$e 10 berths of the jetty which are about 10 miles south ofthe port of Cagliari can take tankers with drafts of 20ndash396 ftAll crude for the refinery and petroleum products istransported by tanker Service boats (tug rescue boat andcoast guard) in the Saras harbor provide direct tanker assistservice at the jetty $e main aim of the paper is to assess theimprovement of harbor tranquillity at the Saras harbor whenvertical dentated wall is designed in a large portion of thewaterfront where a vertical plane wall exists $e manuscriptis organized as follows Section 2 describes the verticaldentated wall and its design in the Saras harbor An extremewave analysis from a 20-year wave dataset is presented inSection 3 $e problem of excessive wave disturbance at the
HindawiAdvances in Civil EngineeringVolume 2018 Article ID 9247407 10 pageshttpsdoiorg10115520189247407
Saras harbor was explored in both graphical and numericalmodels In Section 4 a graphical method is applied for theestimation of wave height distribution in the harbor Section5 shows the application of a Boussinesq numerical modeland a comparison of results with the graphical method ispresentede nal section gives some suggestions for futuredevelopments
2 Wave Absorbing Structures
e hydrodynamic performance of rough structures hasbeen investigated in previous physical and numerical modelstudies (eg [6ndash9]) considering a wide range of waves bothregular and irregular and level conditions It is found thatthe investigation of [3 5] on wave reection from a dentatedand serrated sloped seawall is a unicum in the literature ephysical modelling results have conrmed that the in-troduction of a number of rectangular blocks in the form ofdents or serrations on a plane vertical seawall hydrody-namically replaces the mild sloped seawall from dissipatingthe incident wave energy and hence reduces the wave re-ection Specically they investigated the eect of waveheight (in terms of wave steepness HsLp being Hs thesignicant wave and Lp the wavelength corresponding to thepeak period) wave period (in terms of relative water depthdLp) and surf similarity parameter (ξ) on the reectioncoecient (Kr) e coecient of wave reection Kr is de-ned as the ration of reected wave height Hr to incidentwave height Hi Here both the incident and reected waveheights refer to the signicant heights Due to the higherenergy dissipation Kr values decrease signicantly withdecrease of the seawall slope for steeper waves either in thecase of plane dentated or serrated walls Here we focus onthe results on random waves acting on vertical seawalls eeect of seawall type on the reection coecient Kr fordierent peak wave periods is provided in Figure 1 For dLp 009 (long wave) the reection characteristics of all threetypes of seawall are almost the same For dLp gt 009compared to plane and serrated seawall dentated seawallassures a signicant reduction for a large range of dLp gt009 while the performance of dentated and serrated isalmost similar for dLp 045 In addition Neelamani andSandhya [5] proposed predictive equations for the reectioncoecient Kr for regular and irregular waves vertical andsloped walls and plane dentated and serrated walls Herethe predictive equation for vertical dentated wall withrandom waves is shown below
Kr dLp
15 dLp( )minus 0 03 009lt
d
Lplt 045 (1)
Goda [1] reports approximate values of reection co-ecients from various sources (Table 1) e range in thecoecient for a vertical wall depends on the degree of waveovertopping
Along the problem of energy dissipation harbourtranquillity is related to the estimation of the propagation ofthe reected waves Based on the theory of geometricaloptics each component of a random sea is assumed to be
reected at an angle equal to the angle of incidence and tocontinue to propagate in that direction An exception is dueto the phenomenon called Mach-stem reection [10 11]Having reected waves a nite length along their crest linesreected waves disperse during propagation away from thesource of reection in a manner similar to the phenomenonof wave diraction Goda [1] proposed an engineering ap-proximation of the spatial distribution of reected waveheight by making use of diraction diagrams of random seawaves for an opening between breakwaters is allowsproperly taking into account directional spectral charac-teristics in 2D propagation of sea waves en the eect ofreected waves on the harbor agitation can be estimated interms of wave heights by the principle of summation ofenergy component as in the following
HT H2i + Hr( )21 + Hr( )22 +
radic (2)
where HT denotes the signicant height of the superposedwaves and (Hr)1 (Hr)2 represent the signicant heightsof the waves reected at various structures SpecicallyEquation (2) is applicable at a distance from the reectivestructure more than one wavelength
21 Saras Harbor Case Study e Saras harbor is located inthe Gulf of Cagliari on the south-west coast of Sardinia ata latitude 39deg 4prime57PrimeN and longitude 9deg 1prime21PrimeE (Figure 2) eharbor protection is achieved by the construction of twomain shore-connected rubble-mound breakwaters (moles
060
065
070
075
080
085
090
095
100
0 01 02 03 04 05
K r
dLp
PlaneDentatedSerrated
Figure 1 Comparison of the reection coecient Kr for planedentated and serrated vertical seawalls Dierent periods areshown corresponding to dLp 009 015 045 and Hsd 014(adapted from [5])
Table 1 Approximate value of reection coecients [1]
Structural type Kr
Vertical wall with crown above water 07sim10Slope of rubble stones 03sim06Vertical structure of energy dissipating type 03sim08Natural beach 005sim02
2 Advances in Civil Engineering
A1 and A2 in Figure 2) with one layer of armor quarry rocksWaterfront structures have a complex layout and arecomposed of seawall (S) and quaywall (Q) (with a berthingface for boats) both of gravity vertical and impermeablestructure types Unfortunately the basin confined by thestructures does not provide safe and efficient port operationdue to wave disturbance As suitable berthing conditions arenot provided minor structural modifications of waterfrontstructures should be considered At this time major mod-ifications as a new harbor layout cannot be proposed foreconomic and authorization constraints$e pattern of wavepropagation into the harbour basin is mainly governed bydiffraction and reflection
$e proposed design for the improvement of the Sarasharbor tranquillity was to provide with wave-absorbingrevetments Specifically in the portion of the waterfrontfrom where the outer sea can be viewed the vertical planeseawall will be covered by a dentated structure of marine-grade stainless steel (Figure 3) Being the entrance too wideas can be seen in Figure 2 the outer sea can be viewed fromevery basin location through the harbor entrance $en thedesign incoming waves are assumed those that would havearrived in the same locations in the absence of the harborSpecifically incoming waves withmean wave direction at theharbour entrance between 0degN and 120degN are simulated inthe following
3 Wave Analysis Extreme andOrdinary Climate
Wave data from this analysis come from the buoy dataprovided by the Italian buoy network RON (Rete OndametricaNazionale Italy) Along the Italian coasts RON includes 15
Figure 2 Saras harbor layout (in addition to the text B sandy beach C rocky revetment red dotted lines define the portion of thewaterfront from where the outer sea can be viewed through the harbor entrance)
2000 z
1850
200
Figure 3 Isometric view of the dentated seawall (adapted from[5])
Advances in Civil Engineering 3
directional wave buoys collecting 20-minute series of waveand meteorological parameters every 30 minutes Significantwave height peak period and mean direction were used inthis study from December 15 2009 to December 31 2014collected from theWatchkeeper buoy with particle-followingsensor technology deployed at a latitude 39deg06prime54PrimeN andlongitude 9deg24prime18PrimeE In Figure 4 a rose chart of significantwave heights illustrates the percentage of wave measure-ments coming from different directions $e rose shows thattwo main directions are consistently predominant inmagnitude and frequency 170ndash180degN () and 260ndash270degN() corresponding to the Scirocco (southeast wind) andLibeccio (southwest wind) winds in the Mediterranean Searespectively
$e extreme wave analysis (EWA) was performed on seastore values Following Boccotti [12] a sea storm as ldquoa se-quence of sea states in which the significant wave height Hsexceeds the threshold Hcrit and does not fall below thisthreshold for a continuous time interval greater than 12hoursrdquo is defined in this study Regarding Hcrit it dependsupon the given location For enclosed seas in the Medi-terranean Sea Sulis et al [2] considered an Hcrit equal to20m Each storm was represented by its peak wave heightduring the storm $e wave dataset was composed of 53wave heights (Figure 5) For maritime design Godarsquos peakover threshold method [1] is one of the main stable modelsapplied to extreme wave analysis [13 14] and the techniquesfor EWA were applied for the use of POT values POT takesin account for the adoption of a second censoring threshold(censoring parameter ]) in order to achieve the higheststochastic independence and homogeneity possible betweenthe samples As ] value selection is critical [15] a sensitive
analysis was performed and ] 1 was selected giving a largedata
Previous research [2] performed a detailed analysis ofextreme wave height estimates by making use of differentcumulative distribution functions (Gumbel FisherndashTippett type 2 Weibull and Generalized Pareto) andfitting methods (least squares method the method ofL-moments the maximum likelihood method and themethod of moments) $e correlation coefficient was usedas degree of goodness to fit in order to assign the ldquooptimalrdquodistribution parameter values that best fit the dataset foreach distribution function and best-fitting method thenthe probability plot correlation coefficient values were usedto compare goodness-of-fit test among distributionfunctions that passed the Chi-square test Sulis et al [2]demonstrated that the least squares method is the best forthe Gulf of Cagliari in terms of unbiasedness and effi-ciency and the GPD and Weibull are generally better thanGumbel and FT-II In the following the application ofWeibull distribution fitted with the least squares method ispresented
f(H) k
A
HminusB
A1113874 1113875
kminus1exp minus
HminusB
A1113874 1113875
k
1113890 1113891 (3)
with the shape parameter k 1 the scale parameter A 077and the location parameter B 133 $e fitted Weibulldistribution in Equation (3) was used to estimate waveheight quantiles for return periods of 2 5 10 20 50 and 100years (Figure 6) Specifically the wave heights Hst estimatedfor 2- and 5-year return periods are equal to 385m and456m To consider the effects of the selected structure overdifferent wave periods two wave scenarios were constructedwith mean periods T0 4 and 9 seconds
North
South
10
86
42
West East
Altezze (m)45ndash54ndash4535ndash4
3ndash3525ndash32ndash25
15ndash21ndash1505ndash1
Figure 4 Rose chart of significant wave height at the Cagliari buoy
4 Advances in Civil Engineering
4 Application of a Graphical Method
e selected wave conditions are summarised in Table 2Specically three incoming waves were considered withmean wave direction MWD 0degN 90degN and 120degN at the
5
45
4
35
3
25
2
15
1
05
00 10 20 30 40 50 60
Figure 5Wave dataset composed of 53 peak wave heights (in terms of signicant heightHs) of storms in the period 2009ndash2014 measured atthe RON buoy
9
8
7
6
5
4Sign
ifica
tion
heig
ht (m
)
100 101
Return period (y)102
3
2
Weilbull distribution90 confidence interval95 confidence interval
Figure 6 Return level estimation with Weibull distribution (Equation (1)) and condence intervals
Table 2 EWA statistics
Hs (m) T0 (s) MWD (degN)385 4 0456 9 0
Advances in Civil Engineering 5
harbor entrance in order to be representative of the allpossible directions (0ndash120degN) Considering a water depth h
65m at mean higher high water level wavelengths at theharbor entrance are Lp asymp 24 and 68m and the apparentopening width of the entrance from the wave direction ofMWD 0degN is Brsquo asymp 70m thus the relative width BrsquoLp asymp 29and 10 In the following the paper focuses on the MWD
0degN that produces the worst case of wave disturbance Apreliminary analysis was carried out with a graphical methodcalled the mirror-imaged diffraction method [1 16] $emethod uses diffraction diagrams for random sea waves [1]transfers the geometry of harbor layout in the plane bya mirror image along the boundary of wave reflection andexamines the reflected waves as waves travelling in themirror-image plane Goda [1] presented several examples ofthe method application and the reader is referred to thistextbook for an exhaustive presentation Points Aj (j 1 2 11) are the locations at which the wave height is to beestimated (Figure 7) Being BrsquoLp asymp 29 for smax 75 therandom wave diffraction diagram is given by [1] at page 85
It is to be noticed that the application slightly underestimatesthe disturbance phenomenon as the secondary wave re-flections are omitted $e resultant wave height at each of theeleven points is estimated using the principle of summation ofwave energy of Equation (2) where the reflected wave heights(Hr)1 (Hr)2 are those calculated in the plane of the twomirror images (Zone B and Zone C) with the vertical seawalland quaywall as reflective structures When the absorbingstructures are considered the diffraction coefficients in ZoneB and Zone C are reduced by a rate equal to the reflectioncoefficient Table 3 shows three different cases in the esti-mation of superimposed waves Case A is the current con-figuration with vertical reflective structures and Case B andCase C are related to the design of dentated vertical seawalls inplace of the existing seawall and quaywall for incident waveswith T0 4 and 9 seconds respectively Using Figure 1 it canbe seen that the reflection coefficient Kr for T0 4 and 9seconds is equal to 07 and 08 Comparing Case Awith Case Band Case C gives useful preliminary information to harbormanagers and designers on the improvement in wave
Figure 7 Mirror-imaged diffraction diagram at the Saras harbor considering a mean direction incident wave of 0degN
Table 3 Superimposition of diffracted and reflected wave heights (location points is shown in Figure 7)
Point Zone A Zone B Zone CRatio of superimposed wave
(A-B)A (A-C)ACase A Case B Case C
A1 074 026 062 100 088 091 12 9A2 068 029 064 098 084 088 14 10A3 058 025 062 089 075 079 16 11A4 048 028 058 080 066 070 18 12A5 039 034 0 052 046 048 12 8A6 049 044 0 066 058 060 12 8A7 054 046 062 094 076 082 19 13A8 061 04 061 095 080 084 16 11A9 068 034 066 101 086 090 15 10A10 069 027 069 101 086 091 15 10A11 0 049 0 049 034 039 30 20
6 Advances in Civil Engineering
disturbance that the construction of these energy dissipatingvertical structures can produce Considering the wider harborarea with eleven points it can be noticed that the improve-ment can assume values in a wide range from 8 to 30Specifically considering the mooring points (A7 A8 A9 A10and A11) the improvement is higher in the shadow zone (A10and A11) while points A7 A8 and A9 are mainly interested byincident waves coming from the wide harbor entrance andthe reflected components are less significant In the lattera lower reflection coefficient in the designed absorbingstructures will not significantly improve the wave disturbanceAs expected dentated structures have a higher performancein reducing the wave disturbance in the case of incomingrandom sea waves with higher dLp values In particular CaseB and Case C are related to dLp 027 and 010 In themooring points (A7 A8 A9 A10 and A11) the energy dis-sipation for shorter waves is always higher than 15 Fromthis preliminary graphical approach the results confirmedthat designed energy absorbing structures are efficient inshadow area of the harbor hit by short storm waves of T0 4For longer waves (T0 gt 9 seconds) the improvement cannotbe very significant
5 Application to a Numerical Method
$e deepwater waves from the EWA with the statistics ofTable 2 were transformed to shallow water using nearshorespectral wind-wave (NSW) model of DHI [17] NWS is
a stationary directionally decoupled parametric modelwhich describes the propagation and decay of short periodand short crested waves in nearshore areas Sulis andAnnis [18] provide details of the nearshore wave trans-formation A detailed bathymetric model at the entranceand in the inner harbor was generated using a single-beamecho-sounder (Figure 8) For examining the inner harborwave propagation in a good trade-off between computa-tional times and accuracy and stability a bathymetry witha grid resolution of 4m times 4m was chosen A model areacovered approximately 120m times 120m and was rotated of35deg in such a way that the offshore boundary is parallel tothe deepwater contours (Figure 9) $is wave andbathymetric configuration was used to assess wave dis-turbance into the Saras harbor using Boussinesq wave(BW) model of DHI [19] $e BW model solves the en-hanced Boussinesq expressed in two horizontal di-mensions [20] in terms of the free surface elevation ξ andthe depth-integrated velocity-components along x-axis(P) and y-axis (Q) Boussinesq equations are solved byimplicit finite difference techniques and the convectiveterms are discretised using central differences and thenormal ADI algorithm for numerical integration Partialreflection from revetment vertical seawall and quaywallwere included in the simulations by specifying porosityvalues corresponding to reflection characteristics of thespecified structures Wave height and ratio of super-imposed waves were simulated for different combinations
4326550
4326500
4326450
4326400
4326350
4326300
4326250
4326200
4326150
4326050
4326000
4325950
4325900
501800
39deg5primeN
501900 502000 502100 502200 502300 502400
4326100
Figure 8 Single beam survey at the Saras harbor
Advances in Civil Engineering 7
of incident wave heights periods and directions as re-ported in Table 2 In the following the paper summaries onthe worst condition of a MWD 0degN that produces themost significant wave penetration into the harbor Con-sidering the Saras harbor orientation with respect to theCagliari Gulf a wave of T0 4 and Hst 385m was chosenfor MWD 0degN Two structural configurations weresimulated the current configuration with vertical im-permeable seawall (Conf 1) and quaywall and the con-figuration with the dentated structures (Conf 2) $e mapsof wave disturbance coefficient for both simulations arereported in Figure 10 for an immediate visual comparisonIt is evident also by a qualitative point of view that theintroduction of energy dissipating structures in forms ofdentated vertical structures significantly reduces the dis-turbance of superimposed waves specifically in themooring area where Conf 1 does not allow service boats for
an essential condition for safe anchorage and efficient portoperation In the mooring area the incoming waves aresignificantly amplified through reflection at the quaywallreaching coefficient values higher than 07 (orange and redvalues in the legend) Conf 2 will assure lower wave distur-bance with the coefficient in the mooring area always lowerthan 06 Considering the A2 point where the maximumsuperimposition was simulated by the BW model themaximum wave height Hmax in the current configurationConf 1 was equal to 955 cm while in the designed config-uration Conf 2 results show Hmax 651 cm with an im-provement in wave disturbance higher than 31
6 Conclusions
$is paper summarizes a large research in the field of wavedisturbance applied to the Saras harbor located in South
110
100
90
80
70
60
50
40
30
20
10
0
Bathymetry (m)Above ndash04667ndash09333 to ndash04667ndash14000 to ndash09333ndash18667 to ndash14000ndash23333 to ndash18667ndash28000 to ndash23333ndash32667 to ndash28000ndash37333 to ndash32667ndash42000 to ndash37333
ndash51333 to ndash46667ndash46667 to ndash42000
ndash56000 to ndash51333ndash60667 to ndash56000ndash65333 to ndash60667ndash70000 to ndash65333Below ndash70000LandUndefined value
0 20 40 60 80 100
Figure 9 Bathymetry at the Saras harbor
8 Advances in Civil Engineering
Sardinia (Italy) where the current harbor configurationdoes not assure safe operational conditions Due totechnical restrictions traditional wave absorber cellscannot be realized and new experimental approach shouldbe considered Among these approaches the dentatedand serrated vertical seawalls appear to give the possibilityof reducing the high wave disturbance particularly forshort wave A graphical method and a Boussinesq nu-merical method were applied to simulate the degree of theimprovement when the designed new structures areconstructed While the graphical approach gives an ap-proximated solution it can be seen as a preliminary step inthe structure design when no detailed information onbathymetry or additional forces (eg wind and tides) areavailable When these additional forces become availablemore accurate numerical methods (eg [21]) can be usedalso provided by well-known commercial software In thispaper the application of a Boussinesq wave model ispresented $e results suggest that the dentated structuralsolution can assure safer condition for service boats in theSaras harbor In addition the comparison between thegraphical and numerical models shows that the lattersimulates a significantly higher improvement in the allmooring area
Data Availability
Data are public (eg wave data)
Conflicts of Interest
$e author declares that there are no conflicts of interestregarding the publication of this paper
References
[1] Y Goda Random Seas and Design of Maritime StructuresAdvanced Series on Ocean Engineering Vol 33 WorldScientific Publishing Singapore 3 edition 2010
[2] A Sulis R Cozza and A Annis ldquoExtreme wave analysismethods in the Gulf of Cagliari (South Sardinia Italy)rdquoOceanand Coastal Management vol 140 pp 79ndash87 2017
[3] S Neelamani and N Sandhya ldquoSurface roughness effect ofvertical and sloped seawalls in incident random wave fieldsrdquoOcean Engineering vol 32 pp 395ndash416 2005
[4] G P Tsinker ldquoRepair rehabilitation maintenance andupgrading of waterfront structures 6th chapterrdquo in PortEngineering Planning Construction Maintenance and Se-curity G P Tsinker Ed John Wiley amp Sons Inc HobokenNJ USA 2004
[5] S Neelamani and N Sandhya ldquoWave reflection character-istics of plane dentated and serrated seawallsrdquo Ocean Engi-neering vol 30 no 12 pp 1507ndash1533 2003
[6] N W H Allsop and A R Channell ldquoWave reflections inharboursrdquo Report OD 102 Hydraulics ResearchWallingfordUK 1989
[7] C Altomare A J C Crespo J M Domınquez M Gomez-Gesteira T Suzuki and T Verwaest Coastal Engineeringvol 96 pp 1ndash12 2015
400380360340320300280260240220200180160140120100
80
(m)
(m)50 100 150 200 250 300 350
Hm0Hm0_incoming(0)
Above 0807ndash0806ndash0705ndash0604ndash05
03ndash0402ndash0301ndash0200ndash01Below 00
(a)
400420
380360340320300280260240220200180160140120100
80
(m)
(m)500 100 150 200 250 300 350
Hm0Hm0_incoming(0)
Above 0807ndash0806ndash0705ndash0604ndash05
03ndash0402ndash0301ndash0200ndash01Below 00
(b)
Figure 10 Wave disturbance coefficient for MWD 0degN T0 4 and Hst 385m in the current configuration (a) and designedconfiguration with dentated structures (b)
Advances in Civil Engineering 9
[8] P A Madsen ldquoWave reflection from a vertical permeablewave absorberrdquo Coastal Engineering vol 7 no 4 pp 381ndash3961983
[9] W N Seelig and J P Ahrens ldquoWave reflection and energydissipation by coastal structuresrdquo in Wave Forces on Inclinedand Vertical Wall Structures pp 28ndash51 Task Committee onForces on Inclined and Vertical Wall Structures ASCEReston VA USA 1995
[10] J-I Lee Y-T Kim and S Shin ldquoExperimental studies onwave interactions of partially perforated wall under obliquelyincident wavesrdquo e Scientific World Journal vol 2014 Ar-ticle ID 954174 14 pages 2014
[11] R L Wiegel Oceanographical Engineering Vol 72ndash75Prentice-all Inc Upper Saddle RiverNJ USA 1964
[12] P Boccotti Wave Mechanics for Ocean Engineering ElsevierScience New York NY USA 2000
[13] J W Kamphuis Introduction to Coastal Engineering and-Management Advanced Series on Ocean Engineering Vol 16World Scientific Publishing Singapore 2000
[14] M Mathiesen Y Goda P J Hawkes et al ldquoRecommendedpractice for extreme wave analysisrdquo Journal of HydraulicResearch vol 32 no 6 pp 803ndash814 1994
[15] P Jonathan and K Ewans ldquoStatistical modelling of extremeocean environments for marine design a reviewrdquo OceanEngineering vol 62 pp 91ndash109 2013
[16] T Takayama and Y Kamiyama ldquoDiffraction of sea waves byrigid or cushion type breakwatersrdquo Report of Port and Har-bour Research Institute vol 16 no 3 pp 3ndash37 1977
[17] L H Holthuijsen A Herman and N Booij ldquoPhase-decoupled refractionndashdiffraction for spectral wave modelsrdquoCoastal Engineering vol 49 no 4 pp 291ndash305 2003
[18] A Sulis and A Annis Extreme Wave Analysis at SARLUXJetty DICAAR Technical Report Sarroch Italy 2014 inItalian
[19] P A Madsen and O R Soslashrensen ldquoA new form of theBoussinesq equations with improved linear dispersioncharacteristics Part 2 a slowly-varying bathymetryrdquo CoastalEngineering vol 18 no 3-4 pp 183ndash204 1992
[20] M B Abott P A Madsen and O R Sorensen ScientificDocumentation of Mike21 BW-Boussinesq Wave ModuleMIKE by DHI 2001
[21] G Diaz-Hernandez J L Lara and I J Losada ldquoExtendedlong wave hindcast inside port solutions to minimize reso-nancerdquo Journal of Marine Science and Engineering vol 4no 1 p 9 2016
10 Advances in Civil Engineering
International Journal of
AerospaceEngineeringHindawiwwwhindawicom Volume 2018
RoboticsJournal of
Hindawiwwwhindawicom Volume 2018
Hindawiwwwhindawicom Volume 2018
Active and Passive Electronic Components
VLSI Design
Hindawiwwwhindawicom Volume 2018
Hindawiwwwhindawicom Volume 2018
Shock and Vibration
Hindawiwwwhindawicom Volume 2018
Civil EngineeringAdvances in
Acoustics and VibrationAdvances in
Hindawiwwwhindawicom Volume 2018
Hindawiwwwhindawicom Volume 2018
Electrical and Computer Engineering
Journal of
Advances inOptoElectronics
Hindawiwwwhindawicom
Volume 2018
Hindawi Publishing Corporation httpwwwhindawicom Volume 2013Hindawiwwwhindawicom
The Scientific World Journal
Volume 2018
Control Scienceand Engineering
Journal of
Hindawiwwwhindawicom Volume 2018
Hindawiwwwhindawicom
Journal ofEngineeringVolume 2018
SensorsJournal of
Hindawiwwwhindawicom Volume 2018
International Journal of
RotatingMachinery
Hindawiwwwhindawicom Volume 2018
Modelling ampSimulationin EngineeringHindawiwwwhindawicom Volume 2018
Hindawiwwwhindawicom Volume 2018
Chemical EngineeringInternational Journal of Antennas and
Propagation
International Journal of
Hindawiwwwhindawicom Volume 2018
Hindawiwwwhindawicom Volume 2018
Navigation and Observation
International Journal of
Hindawi
wwwhindawicom Volume 2018
Advances in
Multimedia
Submit your manuscripts atwwwhindawicom
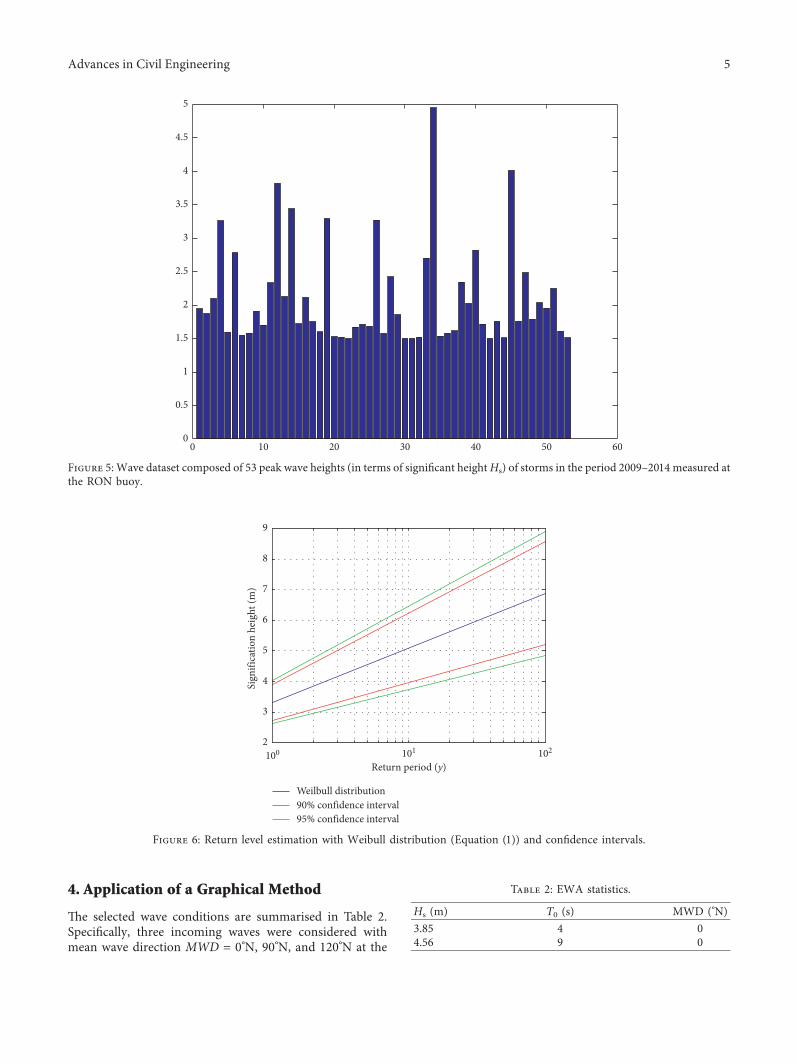
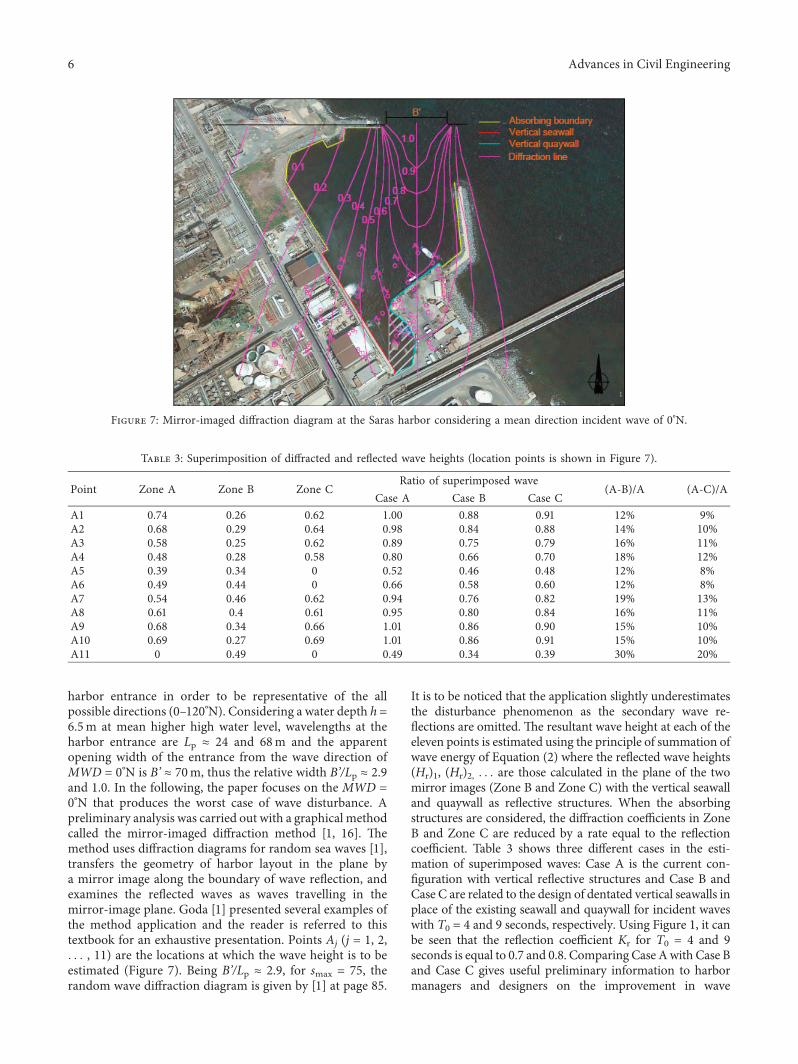

International Journal of
AerospaceEngineeringHindawiwwwhindawicom Volume 2018
RoboticsJournal of
Hindawiwwwhindawicom Volume 2018
Hindawiwwwhindawicom Volume 2018
Active and Passive Electronic Components
VLSI Design
Hindawiwwwhindawicom Volume 2018
Hindawiwwwhindawicom Volume 2018
Shock and Vibration
Hindawiwwwhindawicom Volume 2018
Civil EngineeringAdvances in
Acoustics and VibrationAdvances in
Hindawiwwwhindawicom Volume 2018
Hindawiwwwhindawicom Volume 2018
Electrical and Computer Engineering
Journal of
Advances inOptoElectronics
Hindawiwwwhindawicom
Volume 2018
Hindawi Publishing Corporation httpwwwhindawicom Volume 2013Hindawiwwwhindawicom
The Scientific World Journal
Volume 2018
Control Scienceand Engineering
Journal of
Hindawiwwwhindawicom Volume 2018
Hindawiwwwhindawicom
Journal ofEngineeringVolume 2018
SensorsJournal of
Hindawiwwwhindawicom Volume 2018
International Journal of
RotatingMachinery
Hindawiwwwhindawicom Volume 2018
Modelling ampSimulationin EngineeringHindawiwwwhindawicom Volume 2018
Hindawiwwwhindawicom Volume 2018
Chemical EngineeringInternational Journal of Antennas and
Propagation
International Journal of
Hindawiwwwhindawicom Volume 2018
Hindawiwwwhindawicom Volume 2018
Navigation and Observation
International Journal of
Hindawi
wwwhindawicom Volume 2018
Advances in
Multimedia
Submit your manuscripts atwwwhindawicom