
Minnesota Sentencing Guidelines Commission -
30
Updated Report on Drug Offender Sentencing Issues January 31, 2007 Minnesota Sentencing Guidelines Commission Minnesota Sentencing Guidelines Commission Capitol Office Building 525 Park Street, Suite 220 Saint Paul, MN 55103 Phone: 651-296-0144 Fax: 651-297-5757 Email: [email protected] Website: www.msgc.state.mn.us MN Relay Service TTY: 1-800-627-3529 (ask for 651-296-0144)
Transcript of Minnesota Sentencing Guidelines Commission -
Updated Report on Drug Offender Sentencing Issues January 31, 2007
Minnesota Sentencing Guidelines Commission
Minnesota Sentencing Guidelines Commission
Capitol Office Building
525 Park Street, Suite 220
Saint Paul, MN 55103
Phone: 651-296-0144
Fax: 651-297-5757
Email: [email protected]
Website: www.msgc.state.mn.us
MN Relay Service TTY: 1-800-627-3529 (ask for 651-296-0144)
Minnesota Sentencing Guidelines Commission
Members Steven Borchardt, Chair, Olmsted County Sheriff Jeffrey Edblad, Vice-Chair, Isanti County Attorney Robert Battle, St. Paul Darci Bentz, Public Defender, Fairmont Edward Cleary, District Court Judge, Ramsey County Joan Fabian, Commissioner of Corrections Tracy D. Jenson, Probation Officer, Washington County Connie Larson, Waseca Alan Page, Justice, Minnesota Supreme Court Gordon Shumaker, Judge, Court of Appeals Staff Isabel Gomez, Executive Director Jacqueline Kraus, Research Analyst Lee Meadows, Research Analyst Linda McBrayer, Management Analyst Jill Payne, Senior Research Analyst Anne Wall, Senior Research Analyst
Updated Report on Drug Offender Sentencing Issues January 31, 2007
Phone: 651-296-0144
Fax: 651-297-5757
Email: [email protected]
Website: www.msgc.state.mn.us
MN Relay Service TTY: 1-800-627-3529 (ask for 651-296-0144)
Capitol Office Building
525 Park Street, Suite 220
Saint Paul, MN 55103
Minnesota Sentencing Guidelines Commission
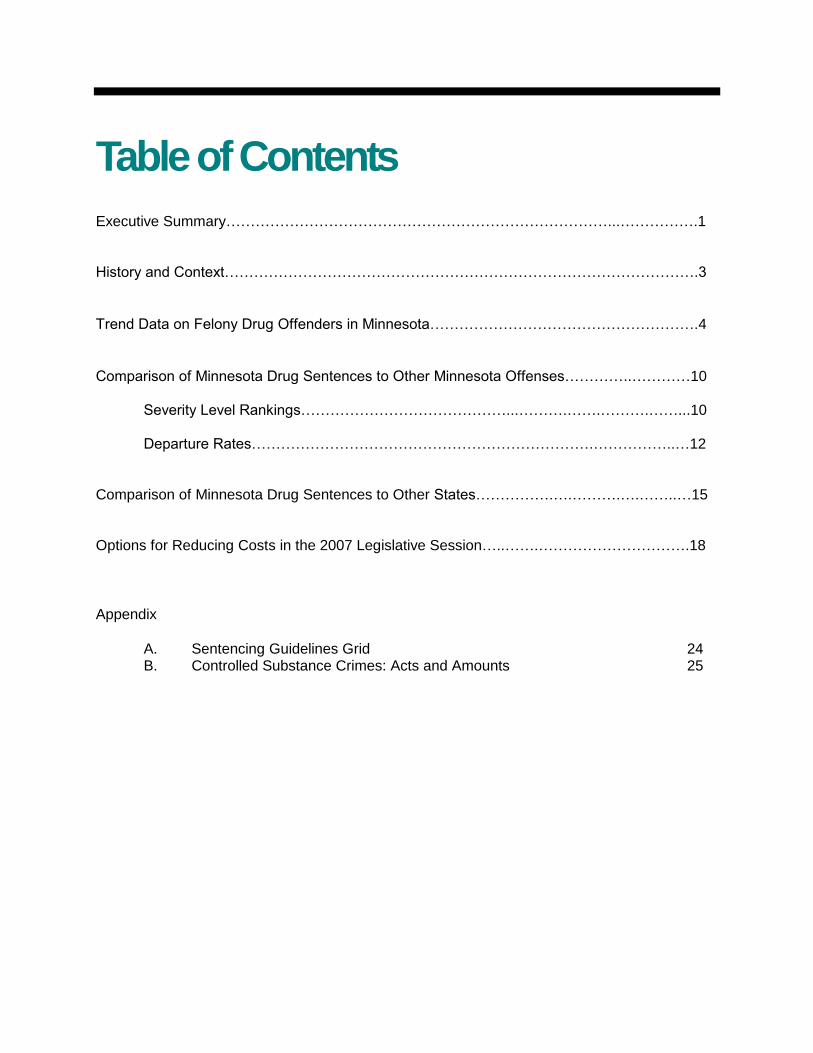
Table of Contents
Executive Summary……………………………………………………………………...…………….1 History and Context…………………………………………………………………………………….3
Trend Data on Felony Drug Offenders in Minnesota……………………………………………….4
Comparison of Minnesota Drug Sentences to Other Minnesota Offenses…………..…………10 Severity Level Rankings……………………………………...……….…….……….……...10 Departure Rates…………………………………………………………….……………..…12 Comparison of Minnesota Drug Sentences to Other States…………….….……….….……..…15 Options for Reducing Costs in the 2007 Legislative Session…..…….………………………….18
Appendix
A. Sentencing Guidelines Grid 24 B. Controlled Substance Crimes: Acts and Amounts 25
1
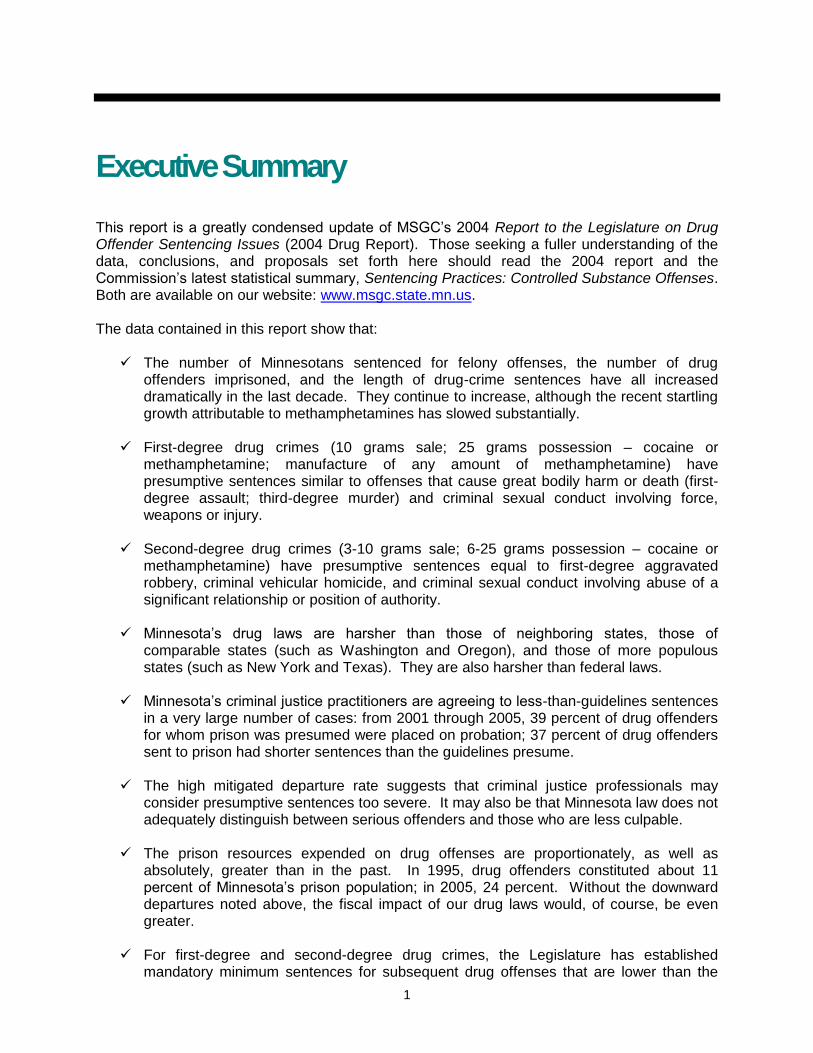
Executive Summary
This report is a greatly condensed update of MSGC’s 2004 Report to the Legislature on Drug Offender Sentencing Issues (2004 Drug Report). Those seeking a fuller understanding of the data, conclusions, and proposals set forth here should read the 2004 report and the Commission’s latest statistical summary, Sentencing Practices: Controlled Substance Offenses. Both are available on our website: www.msgc.state.mn.us. The data contained in this report show that:
The number of Minnesotans sentenced for felony offenses, the number of drug offenders imprisoned, and the length of drug-crime sentences have all increased dramatically in the last decade. They continue to increase, although the recent startling growth attributable to methamphetamines has slowed substantially.
First-degree drug crimes (10 grams sale; 25 grams possession – cocaine or methamphetamine; manufacture of any amount of methamphetamine) have presumptive sentences similar to offenses that cause great bodily harm or death (first-degree assault; third-degree murder) and criminal sexual conduct involving force, weapons or injury.
Second-degree drug crimes (3-10 grams sale; 6-25 grams possession – cocaine or methamphetamine) have presumptive sentences equal to first-degree aggravated robbery, criminal vehicular homicide, and criminal sexual conduct involving abuse of a significant relationship or position of authority.
Minnesota’s drug laws are harsher than those of neighboring states, those of comparable states (such as Washington and Oregon), and those of more populous states (such as New York and Texas). They are also harsher than federal laws.
Minnesota’s criminal justice practitioners are agreeing to less-than-guidelines sentences in a very large number of cases: from 2001 through 2005, 39 percent of drug offenders for whom prison was presumed were placed on probation; 37 percent of drug offenders sent to prison had shorter sentences than the guidelines presume.
The high mitigated departure rate suggests that criminal justice professionals may consider presumptive sentences too severe. It may also be that Minnesota law does not adequately distinguish between serious offenders and those who are less culpable.
The prison resources expended on drug offenses are proportionately, as well as absolutely, greater than in the past. In 1995, drug offenders constituted about 11 percent of Minnesota’s prison population; in 2005, 24 percent. Without the downward departures noted above, the fiscal impact of our drug laws would, of course, be even greater.
For first-degree and second-degree drug crimes, the Legislature has established mandatory minimum sentences for subsequent drug offenses that are lower than the
2
guidelines sentences for first offenses.
This report proposes the following suggestions:
It is for our elected representatives in the Legislature to decide whether the time has come to overhaul Minnesota’s drug laws. Any major changes should be based on a thorough consideration of the entire legal structure, in light of current data and research.
Two meaningful reformative actions can be accomplished in the 2007 legislative session without major revision of our drug laws.
1. If the Legislature determines it is desirable, the Guidelines Commission can
readily re-rank the first-degree and second-degree offenses by moving each down one severity level.
2. The Legislature may choose to fund the State Court’s initiative for the expansion of drug courts in Minnesota.
3
History and Context
More drug offenders are being admitted to state correctional facilities than ever before in the history of Minnesota. The increase in the number of drug offenders admitted to prison results in significant part from changes in the state’s drug laws since the enactment of the sentencing guidelines in 1980. Statutory changes in 1986 and 1987 resulted in presumptive prison sentences for offenders with no criminal history for sale of relatively small amounts of drugs. The law set special threshold levels for crack cocaine, with smaller amounts of crack required to trigger the most severe penalties. In 1989, the controlled substance statutory scheme was drastically altered by the creation of five degrees of drug offenses. High statutory maximums and the need to maintain a spread between lesser and more serious degrees led the Sentencing Guidelines Commission to rank first-degree offenses at severity level VIII, the same as grave crimes against persons.
1
In 1991, the Minnesota Supreme Court found the lower threshold for crack cocaine to be unconstitutional, because it had no rational basis sufficient to justify its disproportionately heavy impact on African-Americans (State v. Russell, 477 NW.2d 886). The Legislature responded by lowering the threshold for other drugs to equal the crack threshold. It also created a presumption that possession of threshold amounts of controlled substances evidenced intent to sell and could be punished as actual sale. These legislative actions compounded the long sentences resulting from the sentencing commission’s ranking of the five degrees by classifying more drug crimes as first-degree. First-degree sentences carry a presumptive sentence of 86 months for an offender with no criminal history. The average pronounced prison sentence for drug offenses has increased from 22.9 months in 1988 to 44.2 months in 2005, despite the striking prevalence of mitigated departures. The likely inappropriate harshness of some drug sentences is well illustrated by the presumptive sentence for first-degree crimes. When, in 1989, the Legislature created a mandatory minimum for subsequent first-degree drug offenses, the mandatory sentence was lower than the presumptive sentence for the initial offense. The first offense has a presumptive sentence of 86 months; the second offense has a legislatively mandated sentence of 48 months. The same apparent irrationality exists, to a lesser degree, for second-degree crimes.
1 Because of alteration in the sentencing grid that resulted from the creation of a Felony DWI offense, former level
VIII offenses are now ranked at level IX.
4
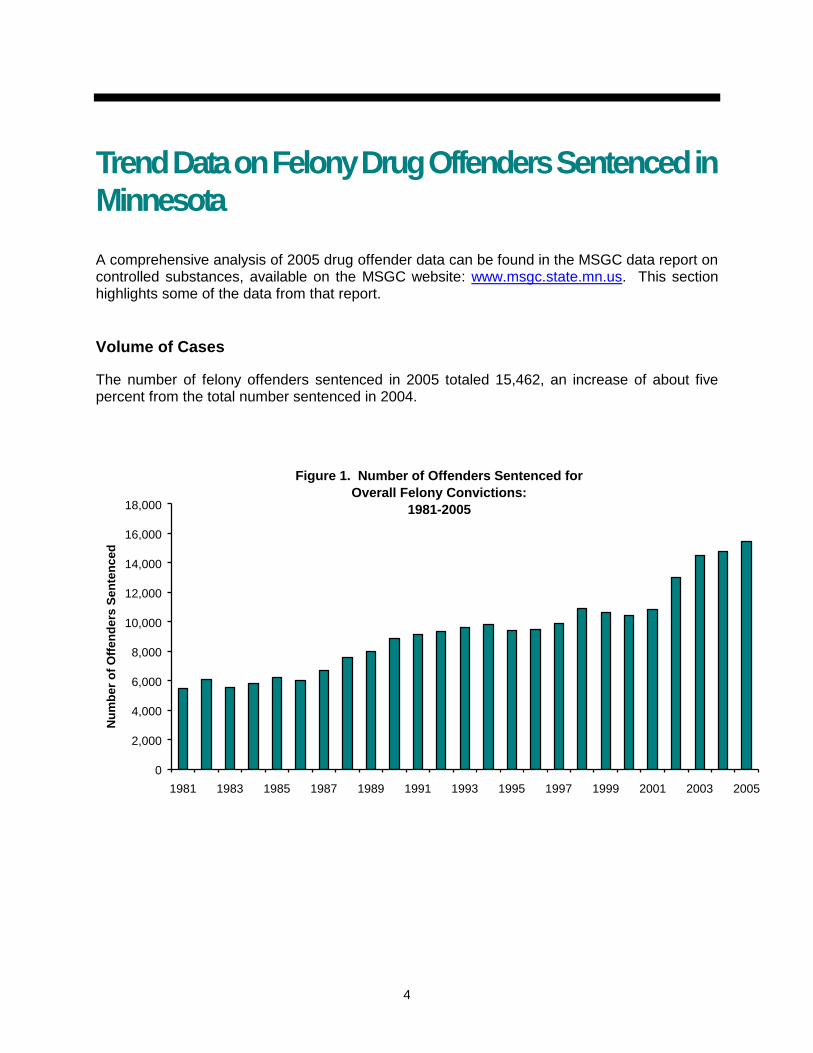
Trend Data on Felony Drug Offenders Sentenced in
Minnesota
A comprehensive analysis of 2005 drug offender data can be found in the MSGC data report on controlled substances, available on the MSGC website: www.msgc.state.mn.us. This section highlights some of the data from that report.
Volume of Cases
The number of felony offenders sentenced in 2005 totaled 15,462, an increase of about five percent from the total number sentenced in 2004.
Figure 1. Number of Offenders Sentenced for
Overall Felony Convictions:
1981-2005
0
2,000
4,000
6,000
8,000
10,000
12,000
14,000
16,000
18,000
1981 1983 1985 1987 1989 1991 1993 1995 1997 1999 2001 2003 2005
Nu
mb
er
of
Off
en
ders
Sen
ten
ced
5
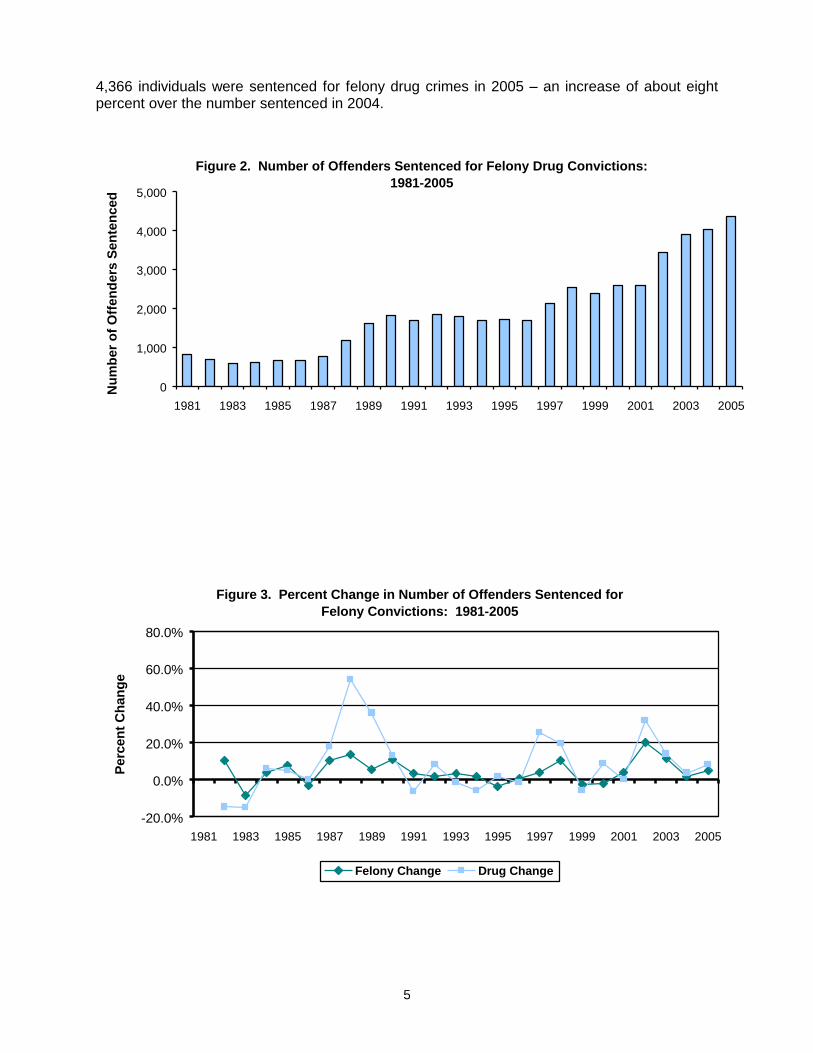
4,366 individuals were sentenced for felony drug crimes in 2005 – an increase of about eight percent over the number sentenced in 2004.
Figure 2. Number of Offenders Sentenced for Felony Drug Convictions:
1981-2005
0
1,000
2,000
3,000
4,000
5,000
1981 1983 1985 1987 1989 1991 1993 1995 1997 1999 2001 2003 2005
Nu
mb
er
of
Off
en
ders
Sen
ten
ced
Figure 3. Percent Change in Number of Offenders Sentenced for
Felony Convictions: 1981-2005
-20.0%
0.0%
20.0%
40.0%
60.0%
80.0%
1981 1983 1985 1987 1989 1991 1993 1995 1997 1999 2001 2003 2005
Perc
en
t C
han
ge
Felony Change Drug Change
6
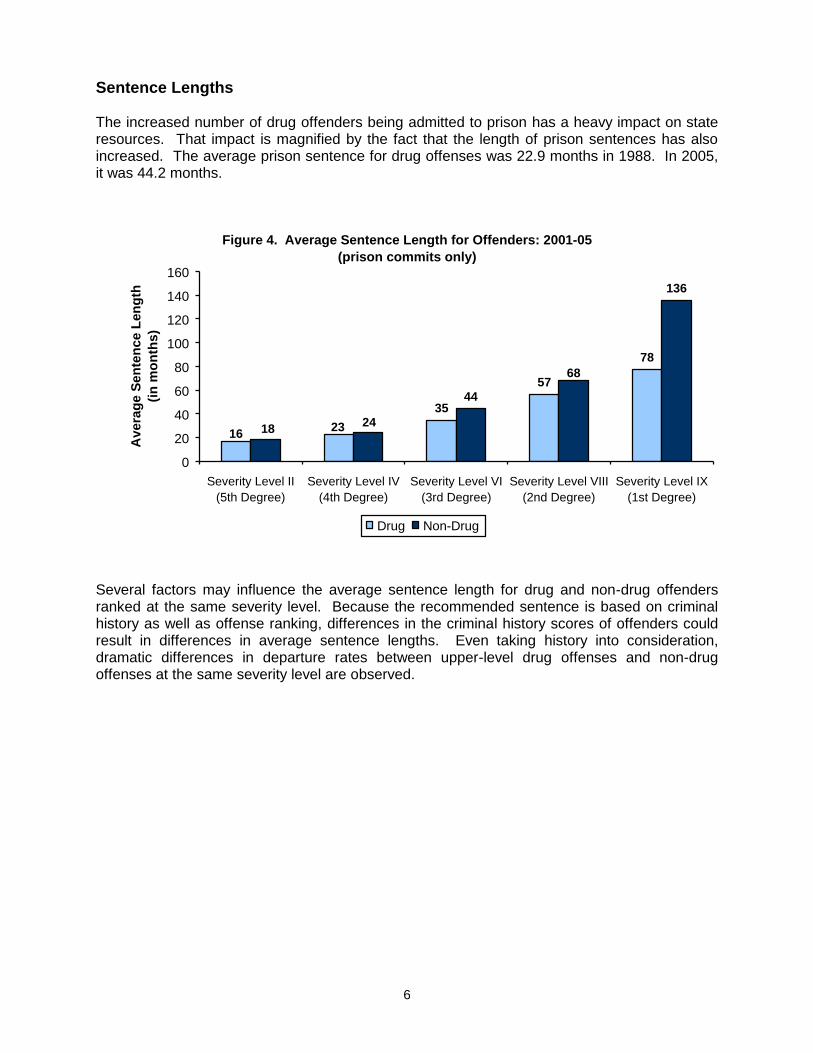
Sentence Lengths The increased number of drug offenders being admitted to prison has a heavy impact on state resources. That impact is magnified by the fact that the length of prison sentences has also increased. The average prison sentence for drug offenses was 22.9 months in 1988. In 2005, it was 44.2 months.
Figure 4. Average Sentence Length for Offenders: 2001-05
(prison commits only)
35
57
78
44
136
2316
68
2418
0
20
40
60
80
100
120
140
160
Severity Level II
(5th Degree)
Severity Level IV
(4th Degree)
Severity Level VI
(3rd Degree)
Severity Level VIII
(2nd Degree)
Severity Level IX
(1st Degree)
Avera
ge S
en
ten
ce L
en
gth
(in
mo
nth
s)
Drug Non-Drug
Several factors may influence the average sentence length for drug and non-drug offenders ranked at the same severity level. Because the recommended sentence is based on criminal history as well as offense ranking, differences in the criminal history scores of offenders could result in differences in average sentence lengths. Even taking history into consideration, dramatic differences in departure rates between upper-level drug offenses and non-drug offenses at the same severity level are observed.
7
Impact on Prison Beds
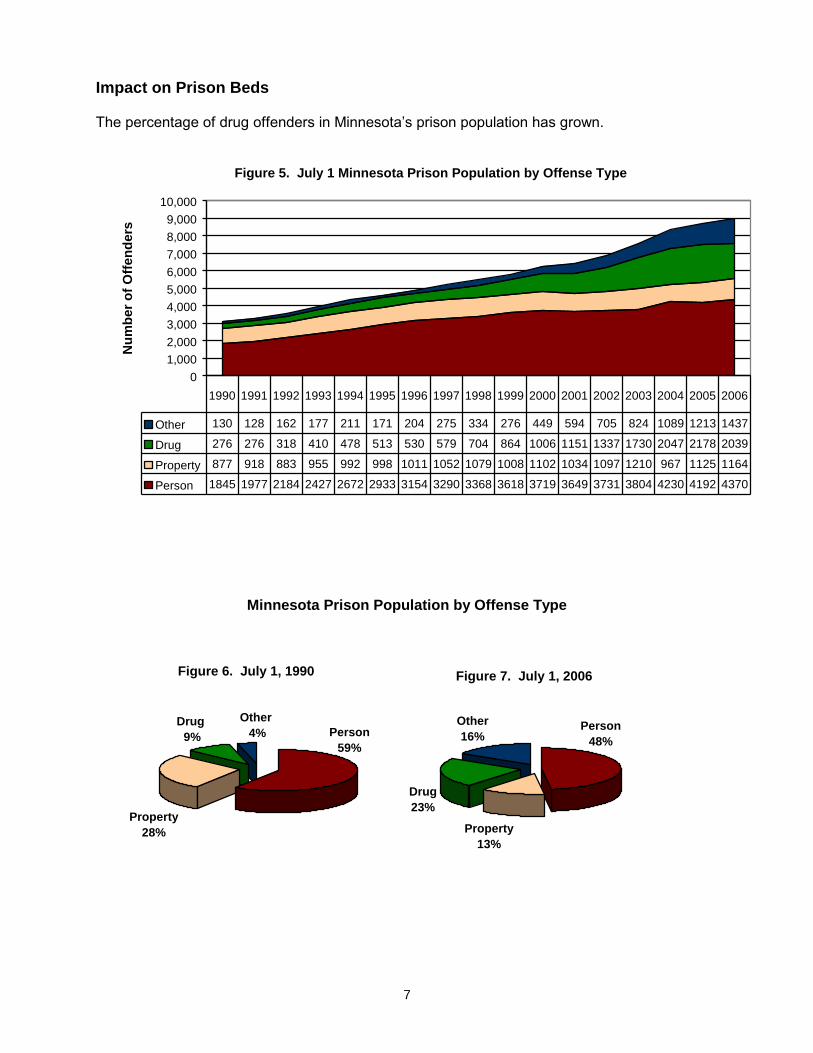
The percentage of drug offenders in Minnesota’s prison population has grown.
Figure 5. July 1 Minnesota Prison Population by Offense Type
0
1,000
2,000
3,000
4,000
5,000
6,000
7,000
8,000
9,000
10,000
Nu
mb
er
of
Off
en
ders
Other 130 128 162 177 211 171 204 275 334 276 449 594 705 824 1089 1213 1437
Drug 276 276 318 410 478 513 530 579 704 864 1006 1151 1337 1730 2047 2178 2039
Property 877 918 883 955 992 998 1011 1052 1079 1008 1102 1034 1097 1210 967 1125 1164
Person 1845 1977 2184 2427 2672 2933 3154 3290 3368 3618 3719 3649 3731 3804 4230 4192 4370
1990 1991 1992 1993 1994 1995 1996 1997 1998 1999 2000 2001 2002 2003 2004 2005 2006
Minnesota Prison Population by Offense Type
Figure 6. July 1, 1990
Person
59%
Property
28%
Drug
9%
Other
4%
Figure 7. July 1, 2006
Other
16%
Drug
23%
Property
13%
Person
48%
8
Drug Type, Region, and Race
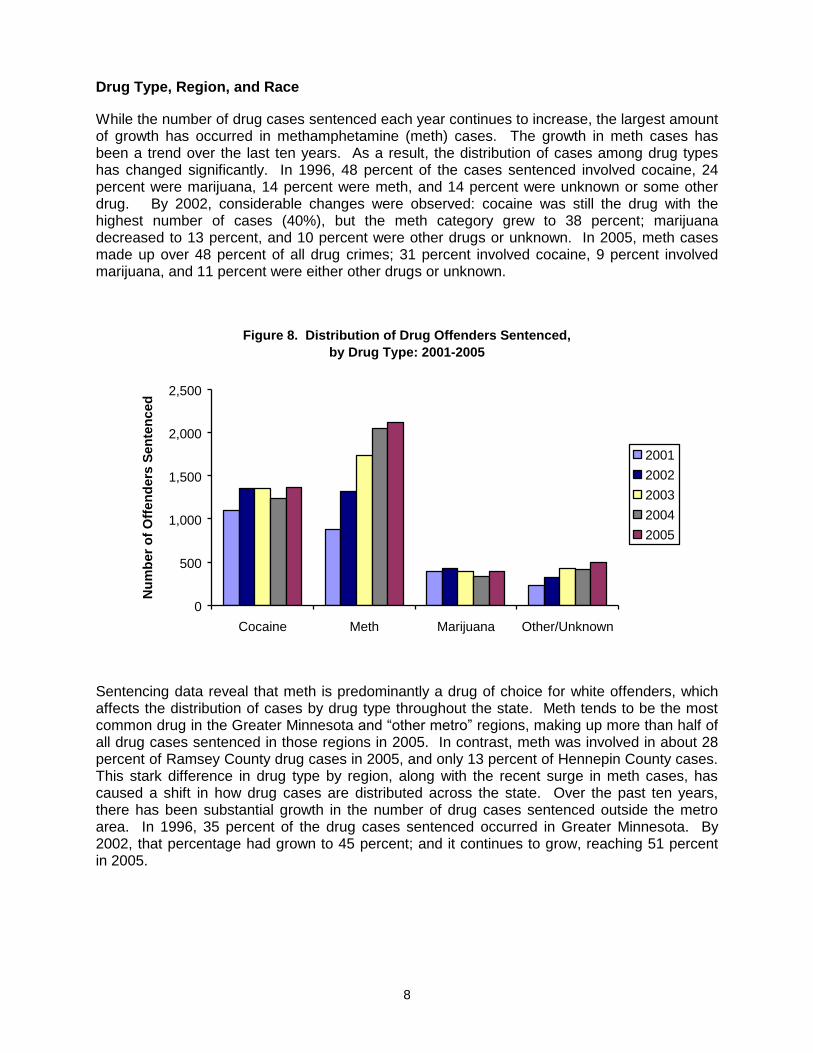
While the number of drug cases sentenced each year continues to increase, the largest amount of growth has occurred in methamphetamine (meth) cases. The growth in meth cases has been a trend over the last ten years. As a result, the distribution of cases among drug types has changed significantly. In 1996, 48 percent of the cases sentenced involved cocaine, 24 percent were marijuana, 14 percent were meth, and 14 percent were unknown or some other drug. By 2002, considerable changes were observed: cocaine was still the drug with the highest number of cases (40%), but the meth category grew to 38 percent; marijuana decreased to 13 percent, and 10 percent were other drugs or unknown. In 2005, meth cases made up over 48 percent of all drug crimes; 31 percent involved cocaine, 9 percent involved marijuana, and 11 percent were either other drugs or unknown.
Figure 8. Distribution of Drug Offenders Sentenced,
by Drug Type: 2001-2005
0
500
1,000
1,500
2,000
2,500
Cocaine Meth Marijuana Other/Unknown
Nu
mb
er
of
Off
en
de
rs S
en
ten
ce
d
2001
2002
2003
2004
2005
Sentencing data reveal that meth is predominantly a drug of choice for white offenders, which affects the distribution of cases by drug type throughout the state. Meth tends to be the most common drug in the Greater Minnesota and “other metro” regions, making up more than half of all drug cases sentenced in those regions in 2005. In contrast, meth was involved in about 28 percent of Ramsey County drug cases in 2005, and only 13 percent of Hennepin County cases. This stark difference in drug type by region, along with the recent surge in meth cases, has caused a shift in how drug cases are distributed across the state. Over the past ten years, there has been substantial growth in the number of drug cases sentenced outside the metro area. In 1996, 35 percent of the drug cases sentenced occurred in Greater Minnesota. By 2002, that percentage had grown to 45 percent; and it continues to grow, reaching 51 percent in 2005.
9
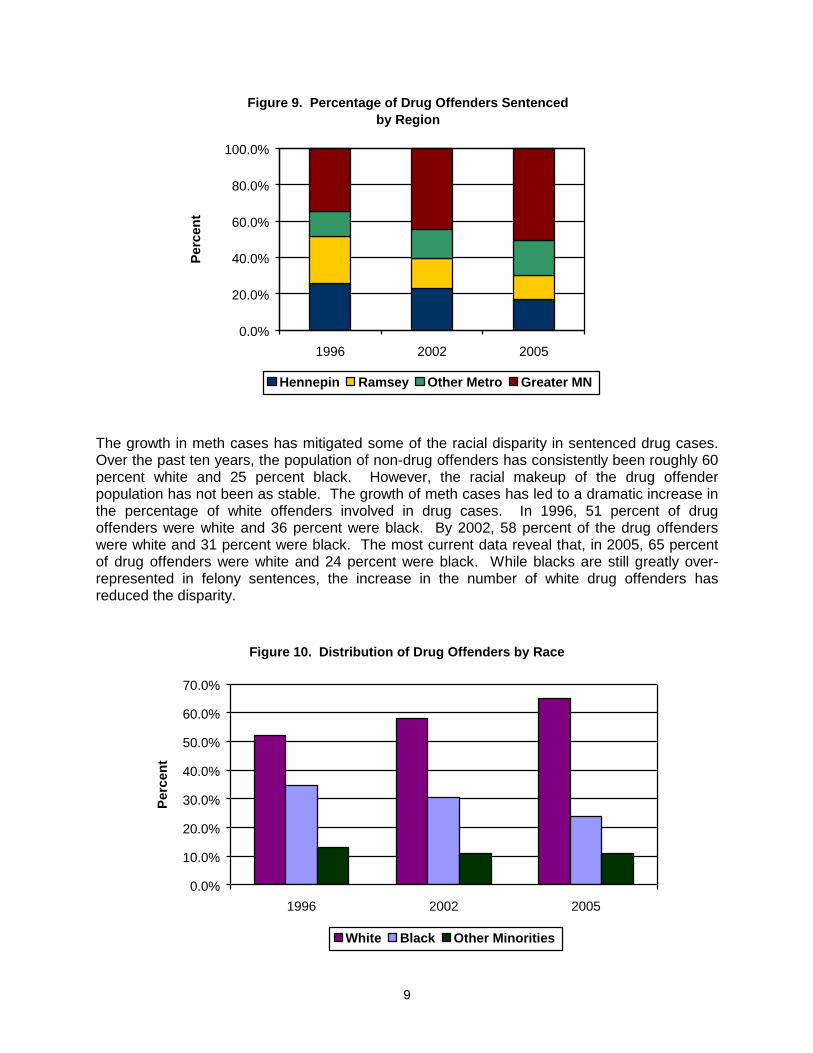
Figure 9. Percentage of Drug Offenders Sentenced
by Region
0.0%
20.0%
40.0%
60.0%
80.0%
100.0%
1996 2002 2005
Perc
en
t
Hennepin Ramsey Other Metro Greater MN
The growth in meth cases has mitigated some of the racial disparity in sentenced drug cases. Over the past ten years, the population of non-drug offenders has consistently been roughly 60 percent white and 25 percent black. However, the racial makeup of the drug offender population has not been as stable. The growth of meth cases has led to a dramatic increase in the percentage of white offenders involved in drug cases. In 1996, 51 percent of drug offenders were white and 36 percent were black. By 2002, 58 percent of the drug offenders were white and 31 percent were black. The most current data reveal that, in 2005, 65 percent of drug offenders were white and 24 percent were black. While blacks are still greatly over-represented in felony sentences, the increase in the number of white drug offenders has reduced the disparity.
Figure 10. Distribution of Drug Offenders by Race
0.0%
10.0%
20.0%
30.0%
40.0%
50.0%
60.0%
70.0%
1996 2002 2005
Perc
en
t
White Black Other Minorities
10
Comparison of Minnesota Drug Offenses to Other
Minnesota Offenses
The Minnesota Sentencing Guidelines were created to provide rational and consistent sentencing policies. Sound policy requires that more severe punishments should be meted out for more serious crimes and to offenders with more severe criminal histories. The sentencing guidelines aim to quantify this principle by recommending appropriate sentences based on a typical offense. Each felony offense in Minnesota is assigned a severity level ranking on either the basic Guidelines grid or the sex offender grid. The severity level rankings run along a vertical scale. Criminal history scores run along a horizontal scale along the top of the grid. The box at the intersection of criminal history and felony rank contains a presumptive sentence for a specified number of months, with presumptive commitments to prison also having a range within which a sentencing judge may choose a specified number of months. Shaded boxes on the grid are presumptive stayed (probationary) sentences. Unshaded boxes are presumptive commitments to prison. There are several offenses that carry a presumptive prison sentence, regardless of where the offender is located on the grid (e.g.: certain crimes involving dangerous weapons, subsequent drug offenses, and subsequent felony DWI offenses). See sentencing grid, Appendix A. Judges must impose the presumptive sentence, unless there are substantial or compelling reasons to give a more or less severe punishment. They are able to consider characteristics of an offender, or of a particular crime, that they believe make a case different from the typical offense of its kind when they determine sentences. If judges choose to depart from the guidelines, they are required to explain their reasons for departure, which are governed by legal principles and may be appealed by either the defendant or the prosecutor.
Severity Level Rankings
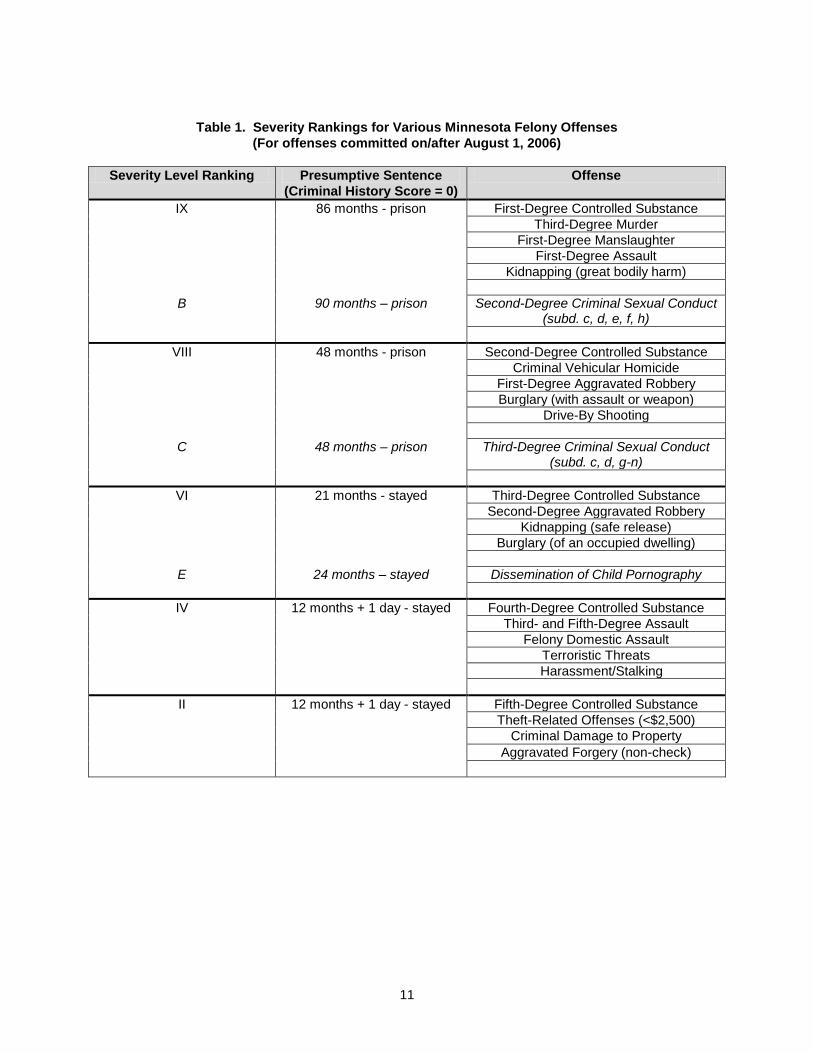
Minnesota currently has five degrees of controlled substance crimes, with first degree being the most severe (severity level IX) and fifth degree being the least (severity level II). For the acts and amount of drugs constituting each offense, see Appendix B. Table 1 lists the severity level ranking for each degree of controlled substance crime and various other offenses at the same severity level. This table also includes the presumptive sentence at each severity level, for an offender with a criminal history score of zero. The philosophy of rational and consistent sentencing policy assumes that offenses ranked at the same severity level are equally serious, and that an offense is more severe than offenses ranked below it. For the reasons explained under History and Context above, first-degree drug offenses (the sale of 10 grams or possession of 25 grams of cocaine or methamphetamine) are presently equated with offenses such as third-degree murder that cause great bodily harm or death to the victim. Second-degree drug offenses (the sale of 3–10 grams or possession of 6-25 grams of cocaine or methamphetamine) are also ranked with several offenses that involve severe personal harm or death.
11
Table 1. Severity Rankings for Various Minnesota Felony Offenses
(For offenses committed on/after August 1, 2006)
Severity Level Ranking Presumptive Sentence
(Criminal History Score = 0)
Offense
IX 86 months - prison First-Degree Controlled Substance
Third-Degree Murder
First-Degree Manslaughter
First-Degree Assault
Kidnapping (great bodily harm)
B 90 months – prison Second-Degree Criminal Sexual Conduct (subd. c, d, e, f, h)
VIII 48 months - prison Second-Degree Controlled Substance
Criminal Vehicular Homicide
First-Degree Aggravated Robbery
Burglary (with assault or weapon)
Drive-By Shooting
C 48 months – prison Third-Degree Criminal Sexual Conduct (subd. c, d, g-n)
VI 21 months - stayed Third-Degree Controlled Substance
Second-Degree Aggravated Robbery
Kidnapping (safe release)
Burglary (of an occupied dwelling)
E 24 months – stayed Dissemination of Child Pornography
IV 12 months + 1 day - stayed Fourth-Degree Controlled Substance
Third- and Fifth-Degree Assault
Felony Domestic Assault
Terroristic Threats
Harassment/Stalking
II 12 months + 1 day - stayed Fifth-Degree Controlled Substance
Theft-Related Offenses (<$2,500)
Criminal Damage to Property
Aggravated Forgery (non-check)
12
Departure Rates
Role and Definition of Departures in the Sentencing Guidelines System
Minnesota’s guidelines system recognizes the reality that not all crimes and offenders at a given severity level are “typical,” by allowing judges to impose punishments more or less severe than the presumed sentence, when there are substantial and compelling reasons to do so. These departures may be dispositional (concerning whether offenders are sent to prison or are placed on probation) or durational (concerning the length of a prison sentence). Sentences more severe than the guidelines presume are “aggravated departures.” Sentences less severe than the guidelines presume are “mitigated departures.” Given the range of human behavior and personal circumstances, departures are expected. In the great majority of cases, the responsible professionals – judge, prosecutor, defense counsel, and probation officer – agree on departures. While a sound determinate sentencing structure allows for atypical cases, it must also provide presumed sentences that most judges will impose when a given crime is committed by offenders with the same criminal history. Consistency is necessary in order to make sure that similar offenders are punished similarly and that the most serious offenses carry the harshest penalties.
Aggravated Departures
Aggravated dispositional departures occur when the guidelines provide a stayed (probationary) sentence and the judge sends the offender to prison. These departures are infrequent: six percent of all felons with presumed stayed sentences went to prison from 2001 through 2005. Drug offenders with presumed stayed sentences went to prison in eight percent of cases. Most aggravated dispositional departures occur when offenders ask to serve the sentence concurrently with another executed prison sentence. Aggravated durational departures occur when offenders receive sentences longer than those presumed by the guidelines. From 2001 through 2005, 10 percent of non-drug offenders sentenced to prison were given more time than the guidelines recommended. Only four percent of drug offenders sentenced to prison received longer-than-guidelines sentences.
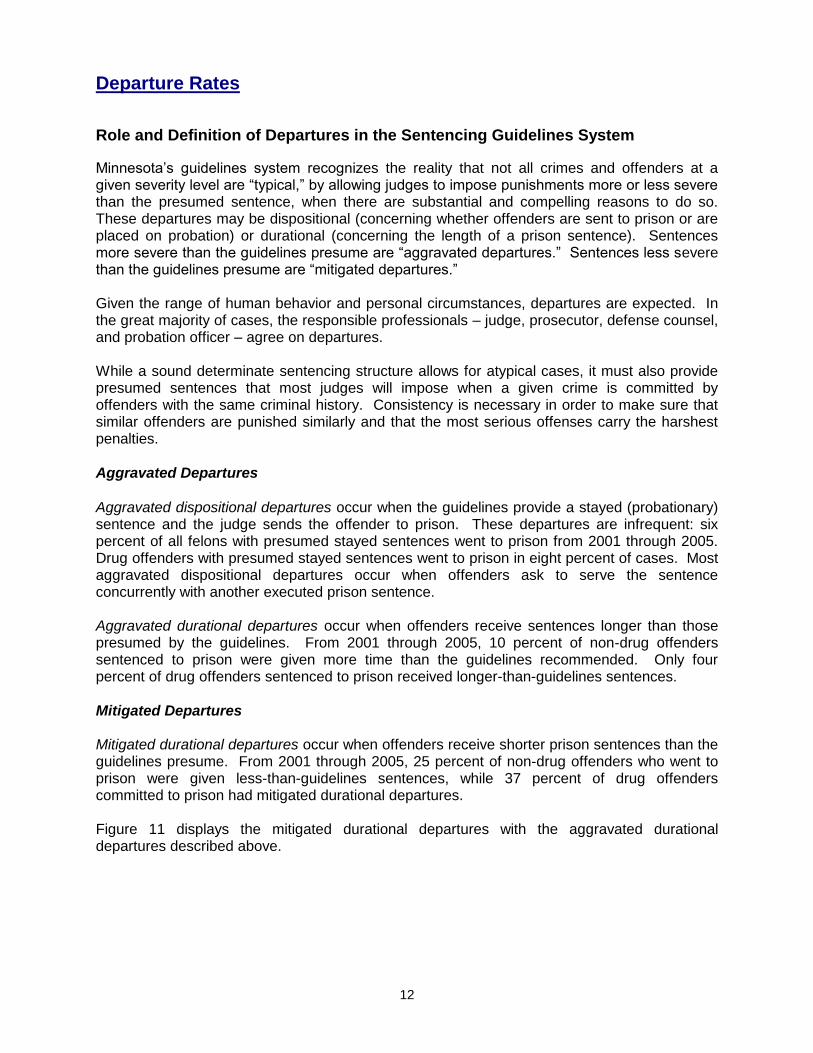
Mitigated Departures Mitigated durational departures occur when offenders receive shorter prison sentences than the guidelines presume. From 2001 through 2005, 25 percent of non-drug offenders who went to prison were given less-than-guidelines sentences, while 37 percent of drug offenders committed to prison had mitigated durational departures. Figure 11 displays the mitigated durational departures with the aggravated durational departures described above.
13
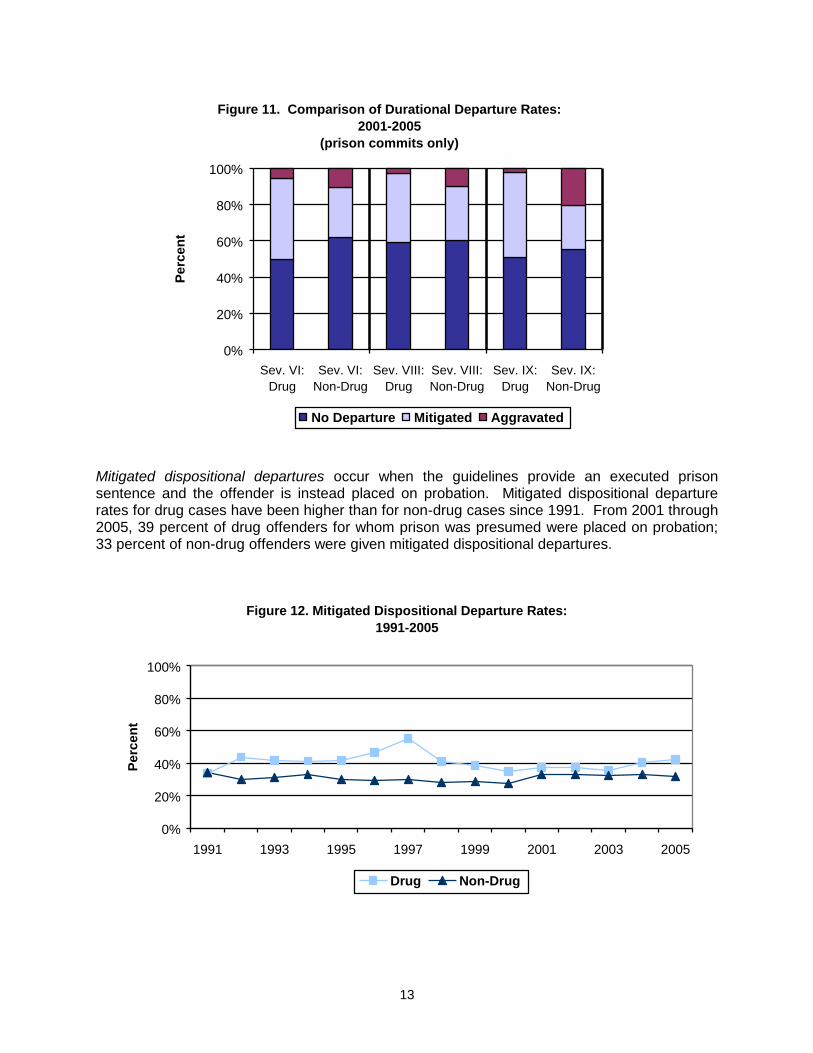
Mitigated dispositional departures occur when the guidelines provide an executed prison sentence and the offender is instead placed on probation. Mitigated dispositional departure rates for drug cases have been higher than for non-drug cases since 1991. From 2001 through 2005, 39 percent of drug offenders for whom prison was presumed were placed on probation; 33 percent of non-drug offenders were given mitigated dispositional departures.
Figure 12. Mitigated Dispositional Departure Rates:
1991-2005
0%
20%
40%
60%
80%
100%
1991 1993 1995 1997 1999 2001 2003 2005
Pe
rcen
t
Drug Non-Drug
Figure 11. Comparison of Durational Departure Rates:
2001-2005
(prison commits only)
0%
20%
40%
60%
80%
100%
Sev. VI:
Drug
Sev. VI:
Non-Drug
Sev. VIII:
Drug
Sev. VIII:
Non-Drug
Sev. IX:
Drug
Sev. IX:
Non-Drug
Perc
en
t
No Departure Mitigated Aggravated
14
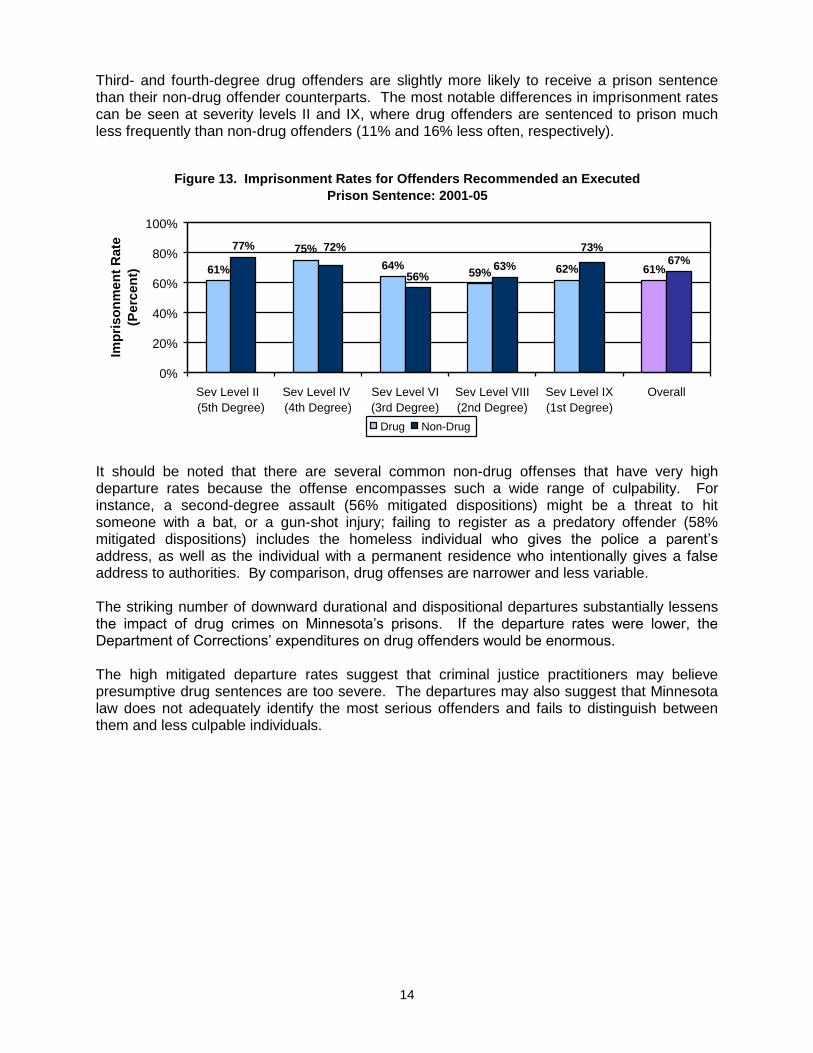
Third- and fourth-degree drug offenders are slightly more likely to receive a prison sentence than their non-drug offender counterparts. The most notable differences in imprisonment rates can be seen at severity levels II and IX, where drug offenders are sentenced to prison much less frequently than non-drug offenders (11% and 16% less often, respectively).
Figure 13. Imprisonment Rates for Offenders Recommended an Executed
Prison Sentence: 2001-05
61%
75%
64%59% 62% 61%
77%
56%63%
67%
72% 73%
0%
20%
40%
60%
80%
100%
Sev Level II
(5th Degree)
Sev Level IV
(4th Degree)
Sev Level VI
(3rd Degree)
Sev Level VIII
(2nd Degree)
Sev Level IX
(1st Degree)
Overall
Imp
ris
on
me
nt
Ra
te
(Pe
rce
nt)
Drug Non-Drug
It should be noted that there are several common non-drug offenses that have very high departure rates because the offense encompasses such a wide range of culpability. For instance, a second-degree assault (56% mitigated dispositions) might be a threat to hit someone with a bat, or a gun-shot injury; failing to register as a predatory offender (58% mitigated dispositions) includes the homeless individual who gives the police a parent’s address, as well as the individual with a permanent residence who intentionally gives a false address to authorities. By comparison, drug offenses are narrower and less variable. The striking number of downward durational and dispositional departures substantially lessens the impact of drug crimes on Minnesota’s prisons. If the departure rates were lower, the Department of Corrections’ expenditures on drug offenders would be enormous. The high mitigated departure rates suggest that criminal justice practitioners may believe presumptive drug sentences are too severe. The departures may also suggest that Minnesota law does not adequately identify the most serious offenders and fails to distinguish between them and less culpable individuals.
15
Comparison of Minnesota Drug Sentences to
Other States
Comparing drug offense sentencing provisions among states presents many challenges. Minnesota is currently the only state in the upper Midwest to have a comprehensive sentencing guidelines system in place, making it impossible to compare recommended sentences and departure rates with our neighboring states. Wisconsin recently re-established its sentencing guidelines commission, but their guidelines currently apply to only a select number of felony offenses, including the most serious drug offenses. Additionally, every state defines offenses differently. States differ dramatically in their definition of drug offenses relating to criminal act (sale, manufacture, possession), type of drug involved (powder cocaine, crack cocaine, methamphetamine, etc.) and the amount of drug involved.
Table 2. Minnesota Drug Offense Provisions for
Powder Cocaine, Crack Cocaine, and Methamphetamine
Statutory
Maximum Sale Threshold Possession Threshold
First Degree 30 years 10 grams or more 25 grams or more Second Degree 25 years 3 grams – 10 grams 6 grams – 25 grams Third Degree 20 years Less than 3 grams 3 grams – 6 grams Fourth Degree 15 years - - - - - - Fifth Degree 5 years - - - Less than 3 grams
Minnesota In Relation to the Upper Midwest
The Commission studied drug offense provisions from Illinois, Iowa, Michigan, North Dakota, and Wisconsin. South Dakota was excluded from the comparison because it does not distinguish between different levels of drug offense; all drug possession/sale/manufacture offenses in that state carry a statutory maximum of 10 years, regardless of drug amount. Because these states do not have comprehensive sentencing guidelines to govern sentencing, it is impossible to compare presumptive sentences. Instead, the Commission compared the most serious drug offenses in each jurisdiction. Since most felony-level drug offenses in Minnesota involve powder cocaine, crack cocaine, or methamphetamine, the following information focuses on offenses involving these drugs. It should be noted that Minnesota is the only Midwestern state to have a lower threshold for manufacture offenses. In all other Midwestern states, the threshold for manufacturing controlled substances is the same as the threshold for sale of the drug. In Minnesota, the manufacture of any amount of methamphetamine falls under the provisions of first-degree controlled substance (30-year statutory maximum).
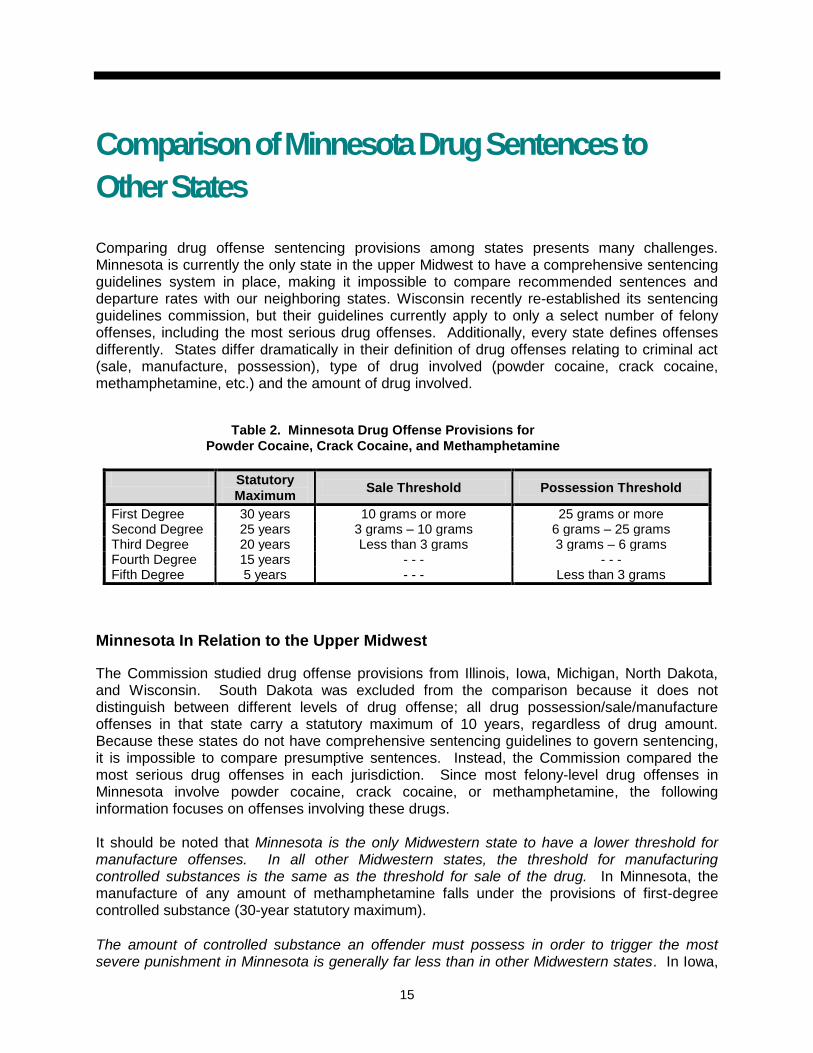
The amount of controlled substance an offender must possess in order to trigger the most severe punishment in Minnesota is generally far less than in other Midwestern states. In Iowa,
16
a meth seller would have to possess 500 times more than in Minnesota; a powder cocaine seller, 50 times more; a crack seller, 5 times more. The severity of our drug punishments is compounded by the fact that Minnesota presumes offenders are sellers if they possess the threshold amount. In most jurisdictions, acts constituting sale must be proven.
Figure 14. Comparison of Midwestern States:
Drug Thresholds for Most Serious Sale Offenses
0
200
400
600
800
1,000
Am
ou
nt
of
Dru
g
(in
gra
ms)
Meth Powder Cocaine Crack Cocaine
Meth 10 900 5,000 N/A 50 50
Powder Cocaine 10 900 500 1,000 50 40
Crack Cocaine 10 900 50 1,000 5 40
Minnesota Illinois Iowa Michigan**North
DakotaWisconsin
**In Michigan, the sale of any amount of meth is a felony, carrying a statutory maximum of 20 years.
Minnesota in Relation to Some Jurisdictions with Presumptive Sentences
When jurisdictions have established presumptive sentences, they can readily be compared with Minnesota’s sentences. The figures below illustrate presumptive sentences for two hypothetical offenders in several jurisdictions.
17
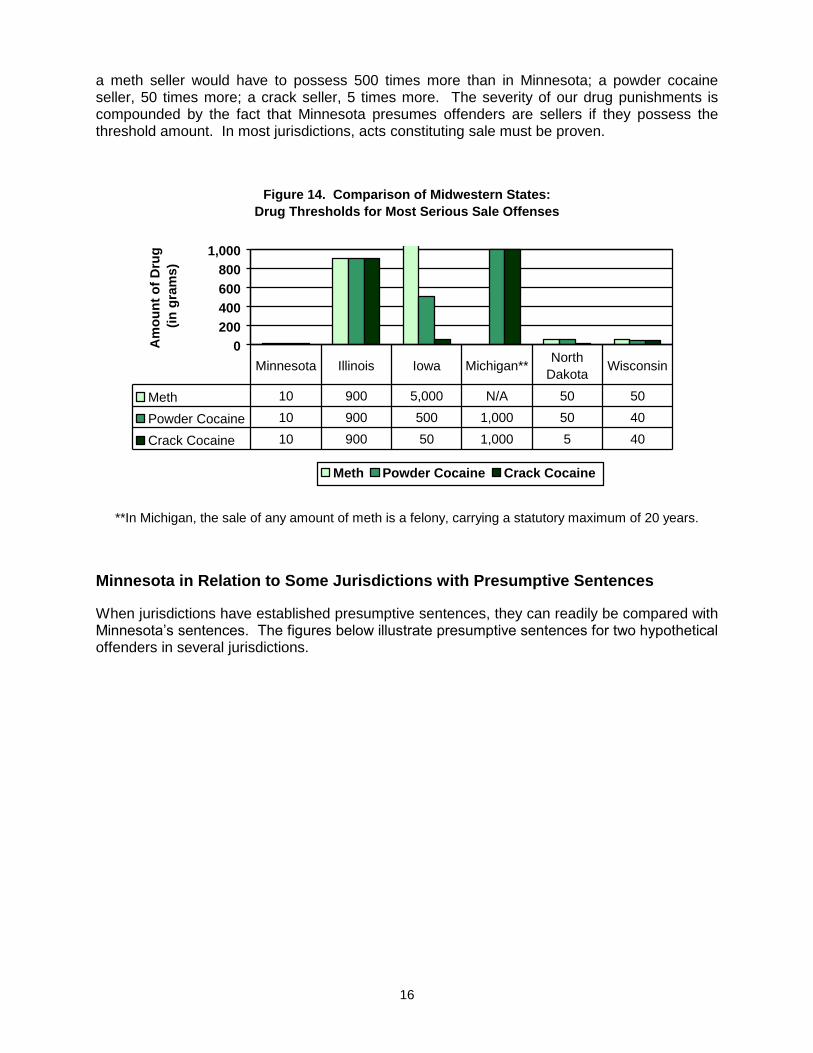
Offender A was convicted of selling 10 grams of cocaine and has no prior record.
Figure 15. Presumptive (Minimum) Sentence Lengths for
Offender A: Sale of 10 grams
0
20
40
60
80
100
MN IL NY OR TX WA Federal
Len
gth
of
Sen
ten
ce
(in
mo
nth
s)
Meth Powder Cocaine Crack Cocaine
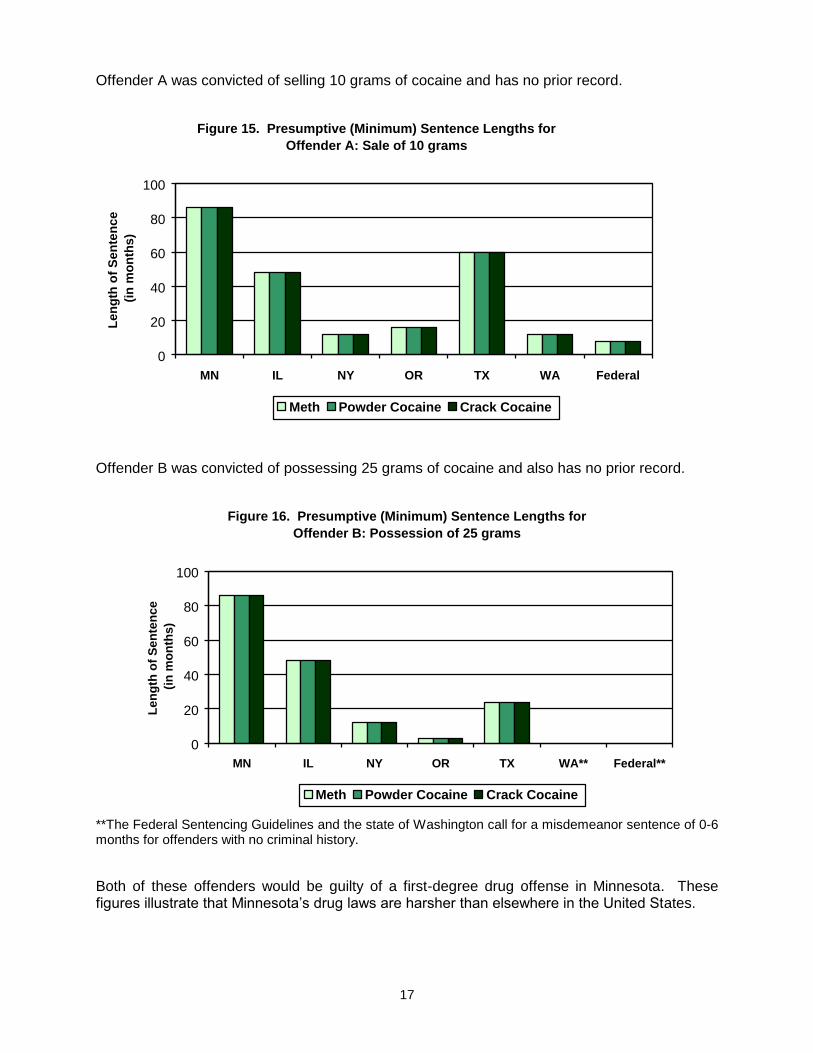
Offender B was convicted of possessing 25 grams of cocaine and also has no prior record.
Figure 16. Presumptive (Minimum) Sentence Lengths for
Offender B: Possession of 25 grams
0
20
40
60
80
100
MN IL NY OR TX WA** Federal**
Le
ng
th o
f S
en
ten
ce
(in
mo
nth
s)
Meth Powder Cocaine Crack Cocaine
**The Federal Sentencing Guidelines and the state of Washington call for a misdemeanor sentence of 0-6 months for offenders with no criminal history.
Both of these offenders would be guilty of a first-degree drug offense in Minnesota. These figures illustrate that Minnesota’s drug laws are harsher than elsewhere in the United States.
18
Options for Reducing Cost in the
2007 Legislative Session
Although there has been no direct request from the Legislature that the Commission propose changes to Minnesota’s drug-crime sentencing structure, legislators have informally expressed an interest in ideas regarding what might be done to reduce our state’s costly reliance on prison in drug cases. The Legislature’s 2006 convening of a group to examine collateral consequences of felony convictions, as well as the expressed interest in re-entry from prison, is evidence of a shared understanding that these costs are personal, as well as financial. The Commissioners make MSGC’s suggestions for short-term alterations in current law in the light of comity, recognizing that it is for our elected officials to determine whether there is a need for change in our drug laws and to define the proper scope of any change. In this brief report, the Commission has focused on decisions that could be made in the current session without an overhaul of the entire system for drug-crime sanctioning. It may be appropriate for lawmakers seriously to explore the desirability of bringing our drug laws more into line with those of surrounding states whose population and crime policy are similar to ours, or to enact reforms that would make Minnesota a leader in this area. Such long-term change might well involve such steps as raising our drug thresholds, reducing the number of possible drug felonies by collapsing present offenses into three felony levels, and designing a sentencing grid more suitable for drug offenders. It is important that any major change be made with full consideration of the entire drug-sentence structure, in light of current data and research, since past piecemeal alterations have frequently had unintended consequences. (See MSGC Report to the Legislature on Drug Offender Sentencing Issues, 2004, pp 6-12.)
1. Re-ranking of First-Degree and Second-Degree Drug Offenses Currently, both first-degree and second-degree drug crimes are ranked at levels that provide for all offenders to be committed to prison, even with no prior criminal history. It should be recalled that these crimes arise from relatively small amounts of drugs that would trigger much lower sentences in almost every other American jurisdiction. First-degree offenses are ranked at severity level IX and carry a presumptive sentence of 86 months’ imprisonment with no criminal-history points and 98 months with one criminal-history point. Based on data from 2001 through 2005, only 62 percent of these offenders were actually sentenced to prison. Those who went to prison got less time than the Guidelines now provide in 47 percent of the cases. For offenders with zero criminal history, the average sentence was 65.6 months; for those with one point, 72.2 months.
Second-degree offenses are ranked at level VIII and carry a presumptive sentence of 48 months’ imprisonment for those with no criminal-history points and 58 months for those with one point. From 2001 through 2005, only 59 percent of second-degree offenders were
19
sentenced to prison. Those who went to prison got shorter sentences than the Guidelines now provide in 38 percent of the cases. For offenders with zero criminal history, the average sentence was 43.0 months; for those with one point, 50.5 months. It is clear that criminal-justice professionals frequently agree upon less-than-guidelines sanctions for these drug offenses, suggesting that they find the current presumed sentences too harsh in many cases. There is evidence that the presumed sentences are more severe than legislators would agree upon, as well. In 1989, legislators created some mandatory minimum penalties for repeat drug offenders. Those who have a prior drug offense and are being sentenced on a first-degree drug crime are required to serve at least 48 months. The guidelines presume 86 months for the crime, with no priors. Those who have a prior drug offense and are being sentenced on a second-degree drug crime are required to serve at least 36 months. The guidelines presume 48 months for the crime, with no priors. It is assumed that the Legislature intended for repeat drug offenders to be punished more harshly than first-timers. It does not, then, make sense to presume that first-timers will receive longer sentences than the law mandates for repeat offenders. In addition, it should be noted that the mandatory minimums for repeat offenders are much less than presumed for them under the guidelines. A repeat first-degree offense carries a 98-month presumed sentence with one point of criminal history; the mandatory minimum is 48 months. A repeat second-degree offense carries a 58-month presumptive sentence with one point; the mandatory minimum is 36 months. With the addition of a severity level to the sentencing grid in 2002, it is feasible to consider re-assigning these higher-level drug offenses. Re-assignment would lead to presumptive sentences that are more in line with the actual sentences being pronounced in courts across the state. The following analysis will consider the impact of ranking each of these offenses one level lower than their current ranking, moving first-degree controlled substance crimes to severity level VIII (currently the ranking for second-degree drug crimes), and second-degree controlled substance crimes to severity level VII (where felony DWI is currently ranked).
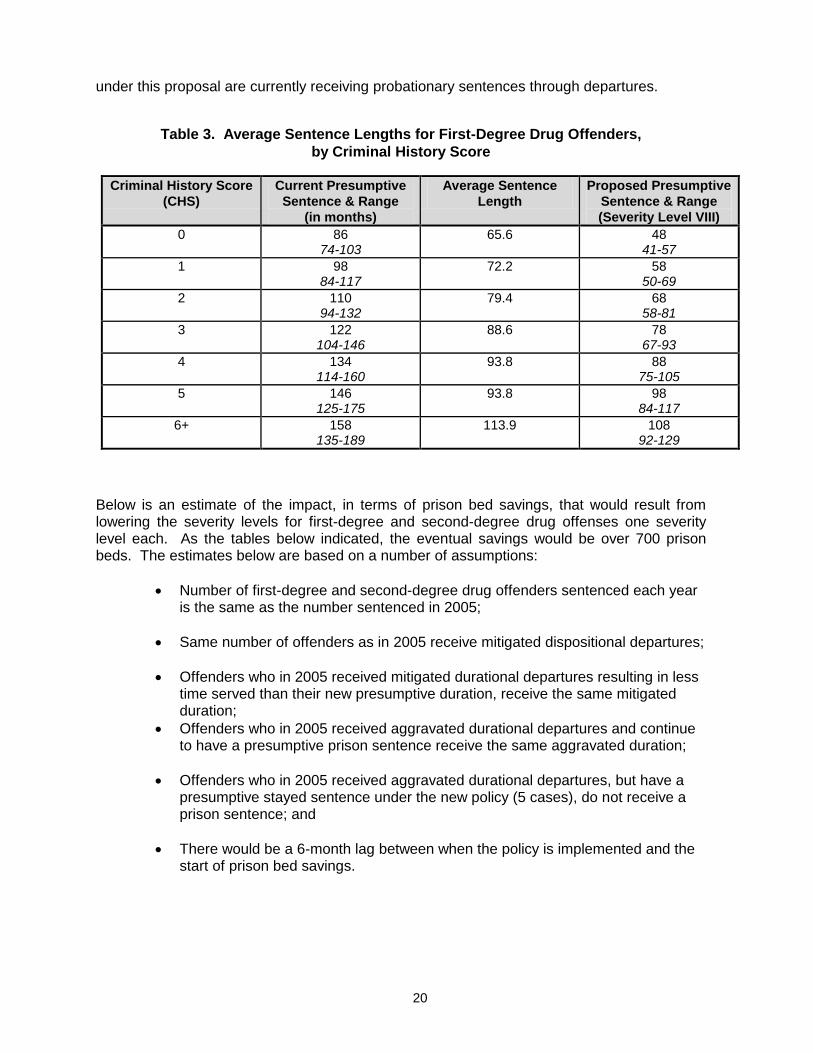
Reducing the severity level for first-degree drug offenders would mean that offenders would be recommended sentences that are 35 to 45 percent shorter than current guidelines recommendations. As shown in Figure 4 (p. 6), average sentence lengths for first-degree drug offenders are already lower than what is recommended by the guidelines. Table 3 illustrates average sentence lengths by criminal history score (CHS), for cases sentenced between 2001 and 2005. Under the current guidelines, the average sentence at every single CHS is lower than the low end of the presumptive range. The proposed reduction in severity level would result in greater alignment between presumptive sentences and actual sentencing practices. With the exception of average sentences at a CHS of 0 or 1, the current average sentence length falls within the recommended ranges in place for severity level VIII offenses. Moving second-degree drug crimes down one severity level would mean that offenders with CHS of 0, 1, or 2 would be recommended probationary sentences under the guidelines. Between 2001 and 2005, 1,365 of the 1,803 offenders (76%) sentenced for second-degree controlled substance crimes fell into this category. As was mentioned previously in this report, there is a dispositional departure rate of about 41 percent for these offenses. The departure rate is actually slightly higher for offenders with a lower CHS: 47 percent for offenders with a CHS of 0, 1, or 2; this means that 642 offenders who were recommended probation under the guidelines between 2001 and 2005 instead received probationary sentences. In short, almost half of the offenders who would be recommended probation
20
under this proposal are currently receiving probationary sentences through departures.
Table 3. Average Sentence Lengths for First-Degree Drug Offenders,
by Criminal History Score
Criminal History Score
(CHS)
Current Presumptive
Sentence & Range
(in months)
Average Sentence
Length
Proposed Presumptive
Sentence & Range
(Severity Level VIII)
0 86 74-103
65.6 48 41-57
1 98 84-117
72.2 58 50-69
2 110 94-132
79.4 68 58-81
3 122 104-146
88.6 78 67-93
4 134 114-160
93.8 88 75-105
5 146 125-175
93.8 98 84-117
6+ 158 135-189
113.9 108 92-129
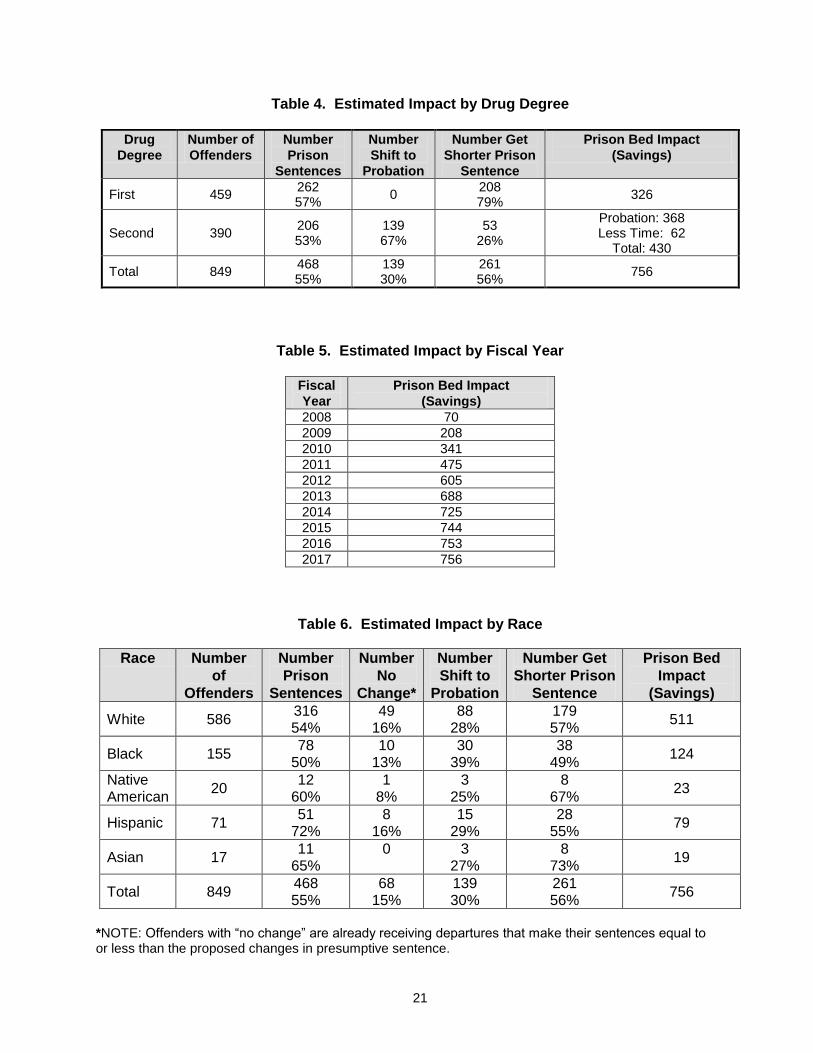
Below is an estimate of the impact, in terms of prison bed savings, that would result from lowering the severity levels for first-degree and second-degree drug offenses one severity level each. As the tables below indicated, the eventual savings would be over 700 prison beds. The estimates below are based on a number of assumptions:
Number of first-degree and second-degree drug offenders sentenced each year is the same as the number sentenced in 2005;
Same number of offenders as in 2005 receive mitigated dispositional departures;
Offenders who in 2005 received mitigated durational departures resulting in less time served than their new presumptive duration, receive the same mitigated duration;
Offenders who in 2005 received aggravated durational departures and continue to have a presumptive prison sentence receive the same aggravated duration;
Offenders who in 2005 received aggravated durational departures, but have a presumptive stayed sentence under the new policy (5 cases), do not receive a prison sentence; and
There would be a 6-month lag between when the policy is implemented and the start of prison bed savings.
21
Table 4. Estimated Impact by Drug Degree
Drug
Degree
Number of
Offenders
Number
Prison
Sentences
Number
Shift to
Probation
Number Get
Shorter Prison
Sentence
Prison Bed Impact
(Savings)
First 459 262 57%
0 208 79%
326
Second 390 206 53%
139 67%
53 26%
Probation: 368 Less Time: 62
Total: 430
Total 849 468 55%
139 30%
261 56%
756
Table 5. Estimated Impact by Fiscal Year
Fiscal
Year
Prison Bed Impact
(Savings)
2008 70
2009 208
2010 341
2011 475
2012 605
2013 688
2014 725
2015 744
2016 753
2017 756
Table 6. Estimated Impact by Race
Race Number
of
Offenders
Number
Prison
Sentences
Number
No
Change*
Number
Shift to
Probation
Number Get
Shorter Prison
Sentence
Prison Bed
Impact
(Savings)
White 586 316 54%
49 16%
88 28%
179 57%
511
Black 155 78
50% 10
13% 30
39% 38
49% 124
Native American
20 12
60% 1
8% 3
25% 8
67% 23
Hispanic 71 51
72% 8
16% 15
29% 28
55% 79
Asian 17 11
65% 0 3
27% 8
73% 19
Total 849 468 55%
68 15%
139 30%
261 56%
756
*NOTE: Offenders with “no change” are already receiving departures that make their sentences equal to or less than the proposed changes in presumptive sentence.
22
2. Expansion of Drug Courts
Minnesota’s State Court is seeking funding for an expansion of drug courts. The Commission recognizes that drug courts are outside its purview, but supports their development, as long as they are not funded at the expense of the State’s probation-supervisory agencies and as long as they include a research component. The first caveat recognizes the strong commitment probation agencies are making to 21
st
century “evidence-based practices” and their need to have the resources required for adequate assessment, the articulation of clear and rational goals, appropriate programming, and measurement of outcomes. It is possible now to employ methods that current research shows are likely to reduce recidivism and, through on-going evaluation of new methods, to expand the repertoire of effective tactics for crime reduction. The second caveat arises out of a similar set of concerns. Although there is a national consensus that drug courts seem to reduce recidivism, it is not known which features are most effective for whom and how successful courts can be replicated, because almost no courts have done research adequate precisely to define their strengths and failures. See, National Institute of Justice Report, Drug Courts: The Second Decade (2006). It is important that Minnesota’s drug courts have adequately-designed and funded research components.
For a full discussion of drug courts, see the Supreme Court Chemical Dependency Task Force’s Report on the Overall Impact of Alcohol and Other Drugs Across All Case Types. For an overview of possible impact of drug courts, see the MSGC Drug Report, 2004.
23
Appendix
24
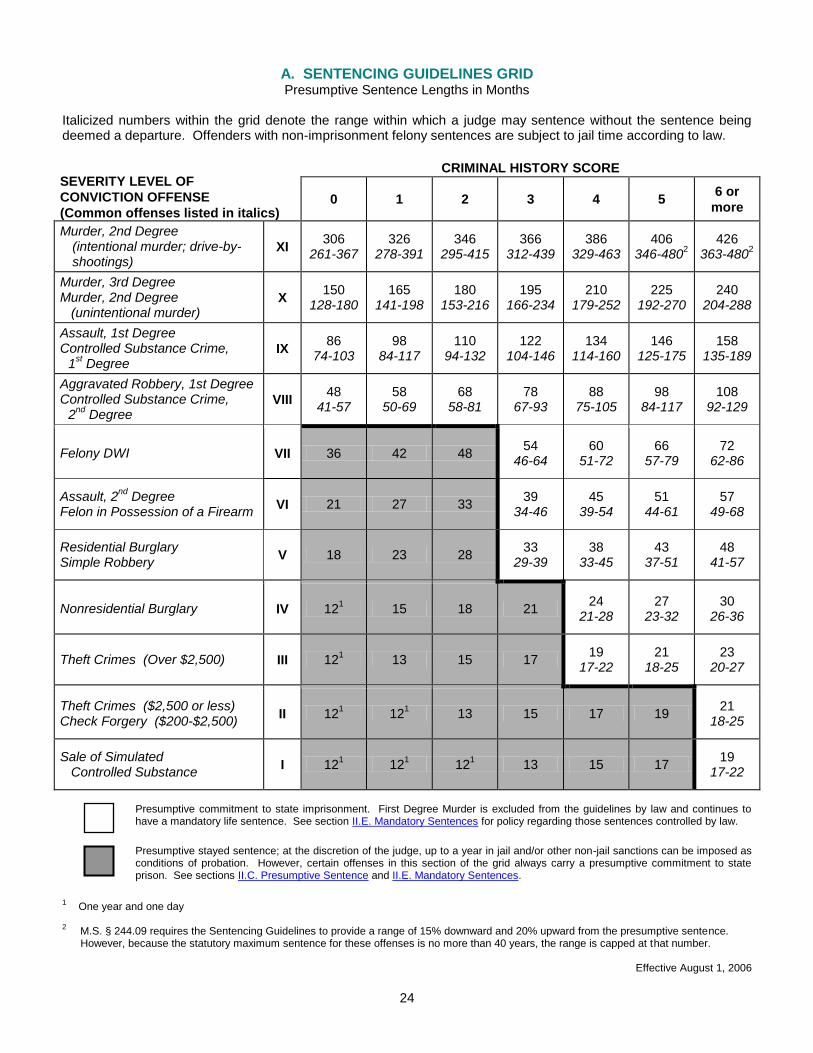
A. SENTENCING GUIDELINES GRID Presumptive Sentence Lengths in Months
Italicized numbers within the grid denote the range within which a judge may sentence without the sentence being deemed a departure. Offenders with non-imprisonment felony sentences are subject to jail time according to law.
SEVERITY LEVEL OF
CONVICTION OFFENSE
(Common offenses listed in italics)
CRIMINAL HISTORY SCORE
0 1 2 3 4 5
6 or
more
Murder, 2nd Degree (intentional murder; drive-by- shootings)
XI 306
261-367 326
278-391 346
295-415 366
312-439 386
329-463 406
346-4802 M.S. § 244.09 requires the Sentencing Guidelines to provide a range of 15% downward and 20% upward from the presumptive sentence. However, because the statutory maximum sentence for these offenses is no more than 40 years, the range is capped at that number.
426 363-480
2 M.S. § 244.09 requires the Sentencing Guidelines to provide a range of 15% downward and 20% upward from the presumptive sentence. However, because the statutory maximum sentence for these offenses is no more than 40 years, the range is capped at that number.
Murder, 3rd Degree Murder, 2nd Degree (unintentional murder)
X 150
128-180 165
141-198 180
153-216 195
166-234 210
179-252 225
192-270 240
204-288
Assault, 1st Degree Controlled Substance Crime,
1st Degree
IX 86
74-103 98
84-117 110
94-132 122
104-146 134
114-160 146
125-175 158
135-189
Aggravated Robbery, 1st Degree Controlled Substance Crime,
2nd
Degree VIII
48 41-57
58 50-69
68 58-81
78 67-93
88 75-105
98 84-117
108 92-129
Felony DWI VII 36 42 48 54
46-64 60
51-72 66
57-79 72
62-86
Assault, 2nd
Degree Felon in Possession of a Firearm
VI 21 27 33 39
34-46 45
39-54 51
44-61 57
49-68
Residential Burglary Simple Robbery
V 18 23 28 33
29-39 38
33-45 43
37-51 48
41-57
Nonresidential Burglary
IV
121 15 18 21
24 21-28
27 23-32
30 26-36
Theft Crimes (Over $2,500) III 121 13 15 17
19 17-22
21 18-25
23 20-27
Theft Crimes ($2,500 or less) Check Forgery ($200-$2,500)
II 121 12
1 13 15 17 19
21 18-25
Sale of Simulated Controlled Substance
I 121 12
1 12
1 13 15 17
19 17-22
Presumptive commitment to state imprisonment. First Degree Murder is excluded from the guidelines by law and continues to have a mandatory life sentence. See section II.E. Mandatory Sentences for policy regarding those sentences controlled by law.
Presumptive stayed sentence; at the discretion of the judge, up to a year in jail and/or other non-jail sanctions can be imposed as conditions of probation. However, certain offenses in this section of the grid always carry a presumptive commitment to state prison. See sections II.C. Presumptive Sentence and II.E. Mandatory Sentences.
1 One year and one day
2 M.S. § 244.09 requires the Sentencing Guidelines to provide a range of 15% downward and 20% upward from the presumptive sentence.
However, because the statutory maximum sentence for these offenses is no more than 40 years, the range is capped at that number.
Effective August 1, 2006
25
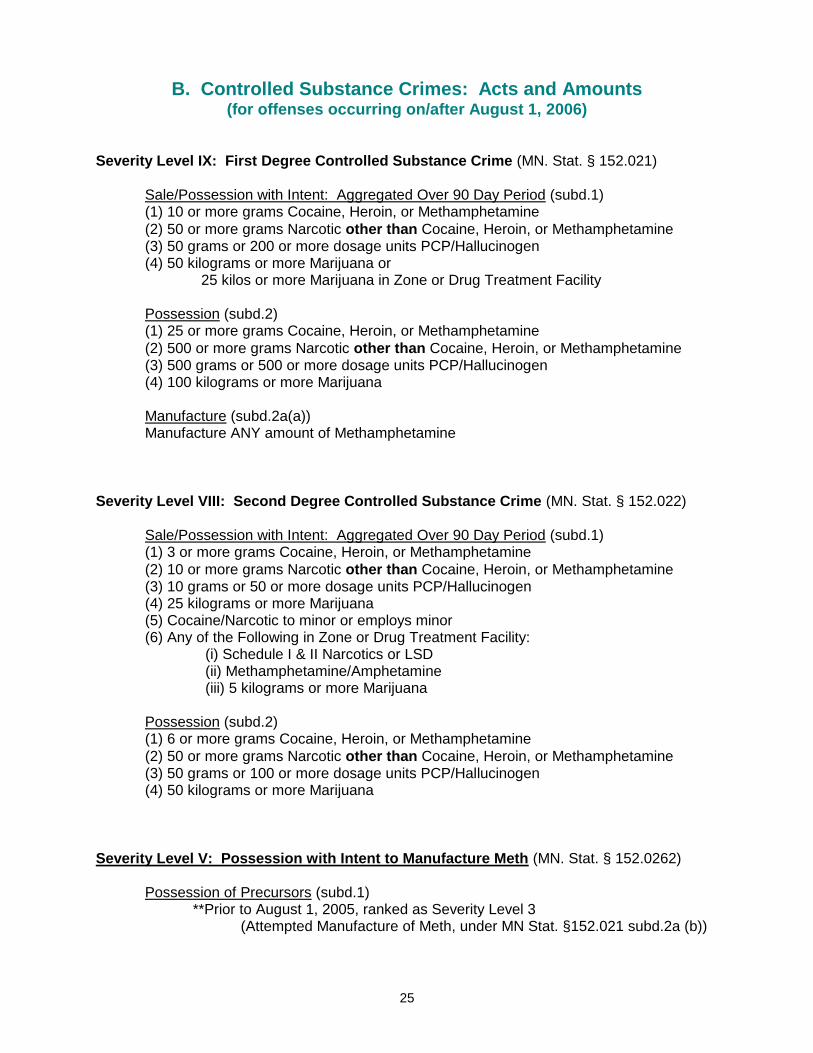
B. Controlled Substance Crimes: Acts and Amounts (for offenses occurring on/after August 1, 2006)
Severity Level IX: First Degree Controlled Substance Crime (MN. Stat. § 152.021) Sale/Possession with Intent: Aggregated Over 90 Day Period (subd.1) (1) 10 or more grams Cocaine, Heroin, or Methamphetamine
(2) 50 or more grams Narcotic other than Cocaine, Heroin, or Methamphetamine (3) 50 grams or 200 or more dosage units PCP/Hallucinogen (4) 50 kilograms or more Marijuana or 25 kilos or more Marijuana in Zone or Drug Treatment Facility Possession (subd.2) (1) 25 or more grams Cocaine, Heroin, or Methamphetamine
(2) 500 or more grams Narcotic other than Cocaine, Heroin, or Methamphetamine (3) 500 grams or 500 or more dosage units PCP/Hallucinogen (4) 100 kilograms or more Marijuana Manufacture (subd.2a(a)) Manufacture ANY amount of Methamphetamine
Severity Level VIII: Second Degree Controlled Substance Crime (MN. Stat. § 152.022) Sale/Possession with Intent: Aggregated Over 90 Day Period (subd.1) (1) 3 or more grams Cocaine, Heroin, or Methamphetamine
(2) 10 or more grams Narcotic other than Cocaine, Heroin, or Methamphetamine (3) 10 grams or 50 or more dosage units PCP/Hallucinogen (4) 25 kilograms or more Marijuana (5) Cocaine/Narcotic to minor or employs minor (6) Any of the Following in Zone or Drug Treatment Facility: (i) Schedule I & II Narcotics or LSD (ii) Methamphetamine/Amphetamine (iii) 5 kilograms or more Marijuana Possession (subd.2) (1) 6 or more grams Cocaine, Heroin, or Methamphetamine
(2) 50 or more grams Narcotic other than Cocaine, Heroin, or Methamphetamine (3) 50 grams or 100 or more dosage units PCP/Hallucinogen (4) 50 kilograms or more Marijuana
Severity Level V: Possession with Intent to Manufacture Meth (MN. Stat. § 152.0262) Possession of Precursors (subd.1) **Prior to August 1, 2005, ranked as Severity Level 3 (Attempted Manufacture of Meth, under MN Stat. §152.021 subd.2a (b))
26
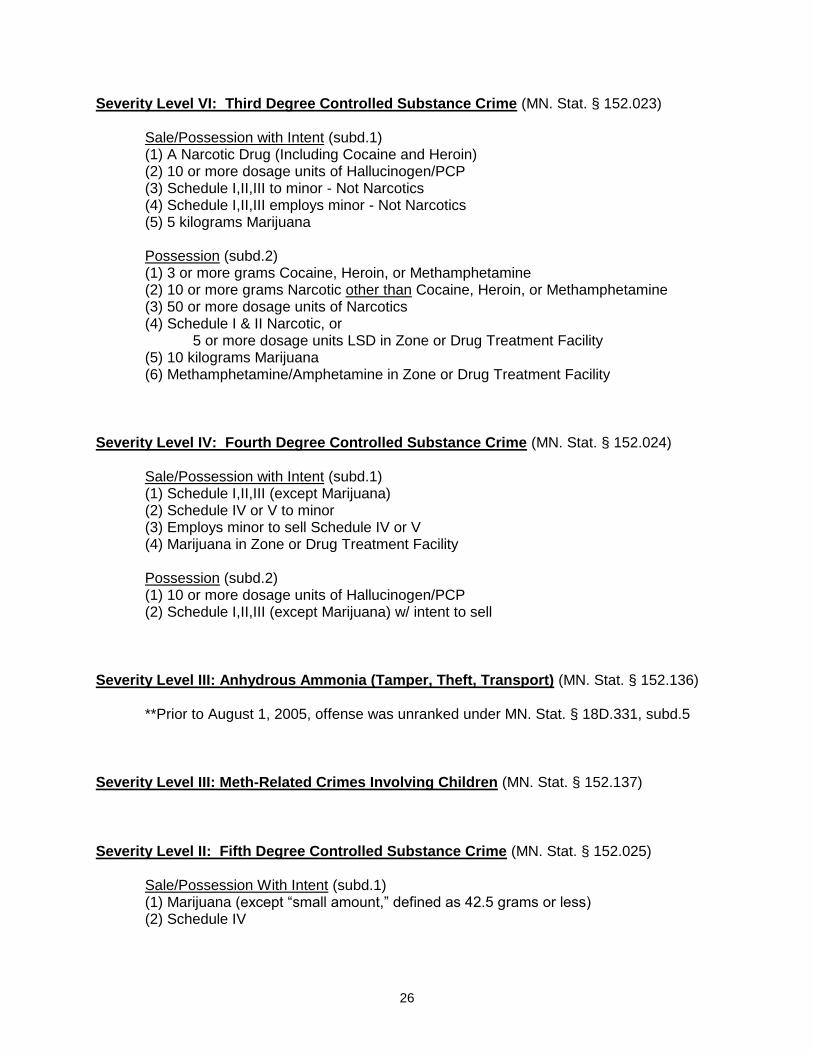
Severity Level VI: Third Degree Controlled Substance Crime (MN. Stat. § 152.023) Sale/Possession with Intent (subd.1) (1) A Narcotic Drug (Including Cocaine and Heroin) (2) 10 or more dosage units of Hallucinogen/PCP (3) Schedule I,II,III to minor - Not Narcotics (4) Schedule I,II,III employs minor - Not Narcotics (5) 5 kilograms Marijuana Possession (subd.2) (1) 3 or more grams Cocaine, Heroin, or Methamphetamine (2) 10 or more grams Narcotic other than Cocaine, Heroin, or Methamphetamine (3) 50 or more dosage units of Narcotics (4) Schedule I & II Narcotic, or 5 or more dosage units LSD in Zone or Drug Treatment Facility (5) 10 kilograms Marijuana (6) Methamphetamine/Amphetamine in Zone or Drug Treatment Facility
Severity Level IV: Fourth Degree Controlled Substance Crime (MN. Stat. § 152.024) Sale/Possession with Intent (subd.1) (1) Schedule I,II,III (except Marijuana) (2) Schedule IV or V to minor (3) Employs minor to sell Schedule IV or V (4) Marijuana in Zone or Drug Treatment Facility Possession (subd.2) (1) 10 or more dosage units of Hallucinogen/PCP (2) Schedule I,II,III (except Marijuana) w/ intent to sell
Severity Level III: Anhydrous Ammonia (Tamper, Theft, Transport) (MN. Stat. § 152.136) **Prior to August 1, 2005, offense was unranked under MN. Stat. § 18D.331, subd.5
Severity Level III: Meth-Related Crimes Involving Children (MN. Stat. § 152.137)
Severity Level II: Fifth Degree Controlled Substance Crime (MN. Stat. § 152.025) Sale/Possession With Intent (subd.1) (1) Marijuana (except “small amount,” defined as 42.5 grams or less) (2) Schedule IV
27
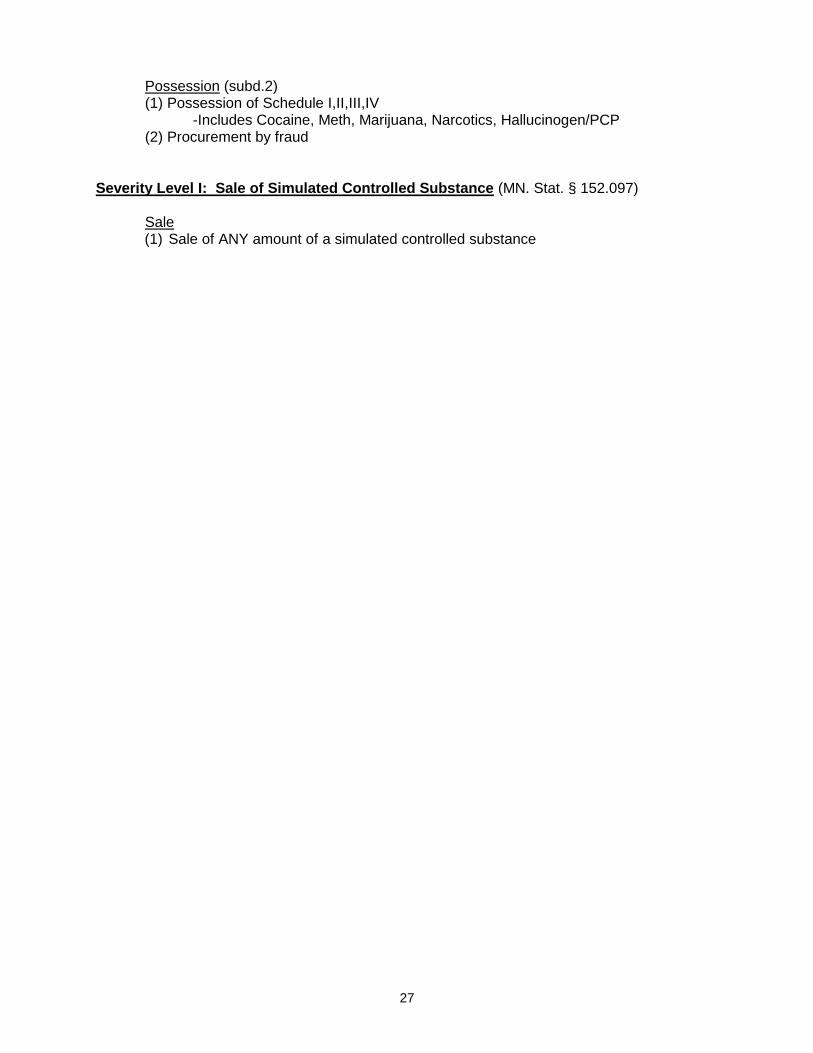
Possession (subd.2) (1) Possession of Schedule I,II,III,IV -Includes Cocaine, Meth, Marijuana, Narcotics, Hallucinogen/PCP (2) Procurement by fraud
Severity Level I: Sale of Simulated Controlled Substance (MN. Stat. § 152.097) Sale
(1) Sale of ANY amount of a simulated controlled substance


