An Overview of Cu-Ni Deposits in Minnesota: A Geological Perspective
National Accountable Care Organization CongressOctober 25, 2010
Minnesota Perspective: Fairview Health Services

Fairview Overview•
Not-for-profit organization established in 1906
•
Partner with the University of Minnesota since 1997
•
22,000+ employees•
2,500 aligned physicians–
Employed–
Faculty –
Independent
•
8 hospitals/medical centers (1,515 staffed beds)
•
44 primary care clinics•
55-plus specialty clinics•
26 senior housing locations •
28 retail pharmacies
2008/2009 data•
4.8 million outpatient encounters •
80,314 inpatient admissions•
$425.1 million community contributions
•
Total assets of $2.4 billion•
$2.8 billion total revenue
1

The Environment is Changing
2

3
•
Shift from physician-centric to team-based care
•
Improving access, quality, experience
•
Advanced health homes create market value and differentiation
•
Measurement is moving from encounters to overall health outcomes
•
Patient/family experience will drive long-term market differentiation
•
Care will be based on managing the health of populations
Care Model is Changing

4
•
We are being asked to deliver greater value:
–
Improved clinical outcomes–
Improved patient experience
–
Lower cost•
We are being asked to care for the health of a population.
•
Payment systems and methodologies are changing…rewarding those who deliver value.
Market is Changing

5
•
20% absolute reduction in total cost of care
•
Shifting from discount fee-for-service to global payment methods
•
New commercial payment models are leading government payment models
•
Performance is being measured and rewarded•
Membership growth is critical to achieving economic balance
•
Direct contracting with employers
Business Model is Changing
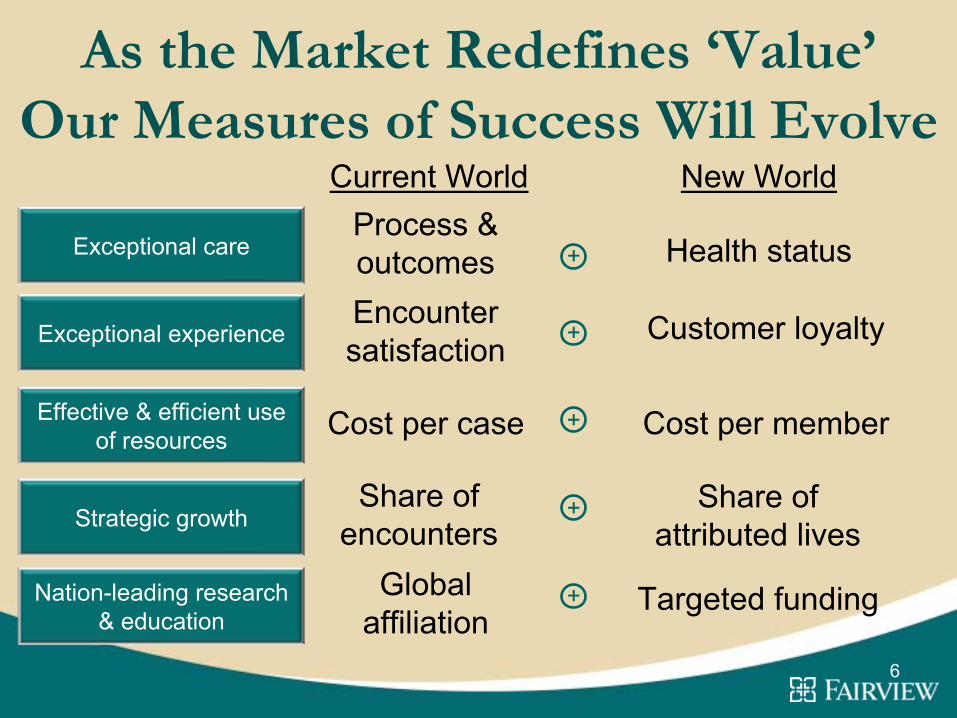
As the Market Redefines ‘Value’ Our Measures of Success Will Evolve
6
Exceptional care
Exceptional experience
Effective & efficient use of resources
Strategic growth
Nation-leading research & education
Current WorldProcess &outcomes Health status+
Encountersatisfaction
Customer loyalty+
Cost per case Cost per member+
Share of encounters
Share ofattributed lives
+
Globalaffiliation
Targeted funding+
New World
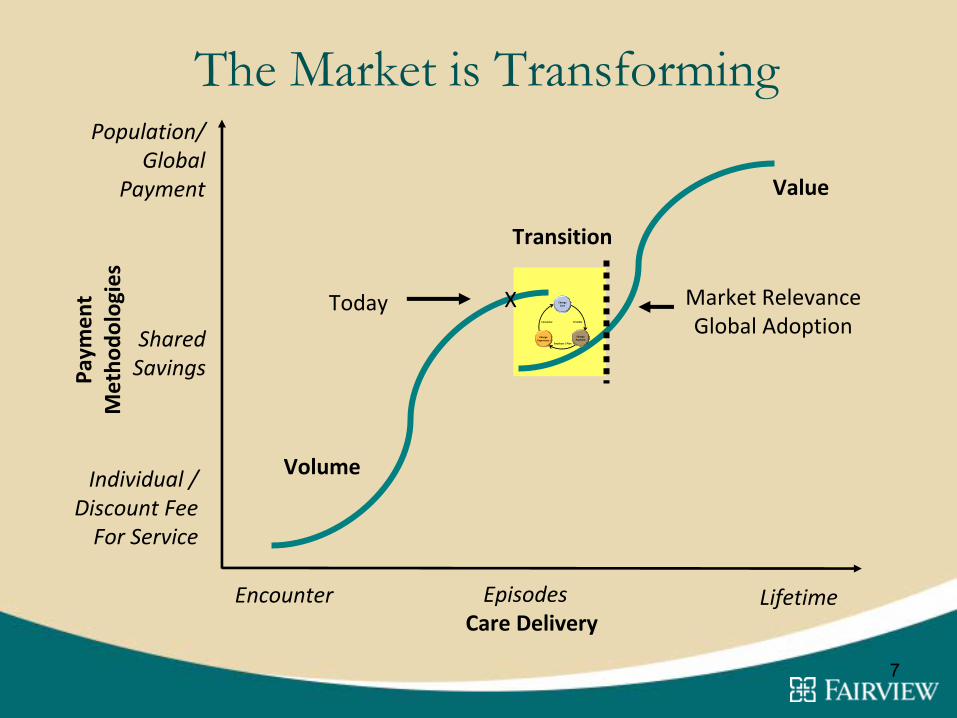
The Market is TransformingPa
ymen
tMetho
dologies
Care Delivery
Population/Global
Payment
Individual /
Discount Fee
For Service
Encounter Lifetime
XToday
Transition
Market RelevanceGlobal Adoption
Volume
Value
7
Change ExperienceChange
Experience
Change Care
Change Care
Change PaymentChange Payment
Consumer
Employer / Plan
Provider
Episodes
SharedSavings

Establishing a New Value Chain
Building a Community Capability to Generate New Care, Experience
and Payment Models
Creating Value and Outcomes
Realizing Economic Return for New Value
Patient Activation and Consumer Engagement
8
Change Care
Change Payment
Consumer
Employer / Plan
Provider
Value
Change Experience

Improving the Health of a Population, Requires a Commitment to the Entire
Continuum of Care…Continuum of Care
PreventiveCare Needs
Short Term/Acute Care
Needs
Complex/Catastrophic Care Needs
9
Current Focus—Caring for the Sick
Future Focus—Improving Health, Well-Being for a Lifetime
“Helping People Enjoy Life by Improving Their Health”
10
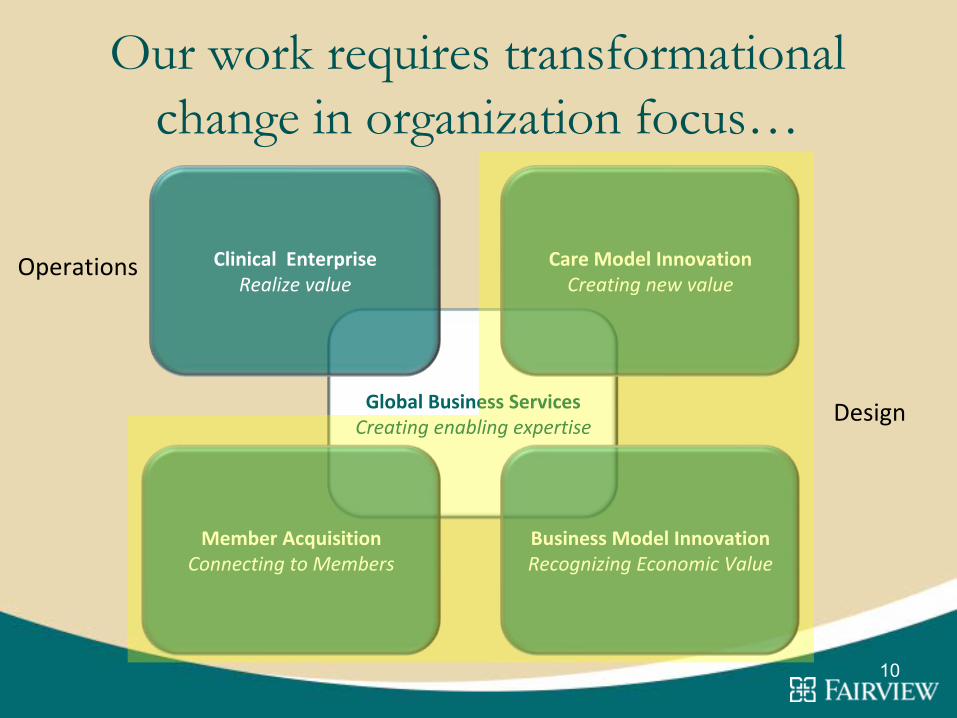
Our work requires transformational change in organization focus…
Global Business ServicesCreating enabling expertise
Clinical EnterpriseRealize value
Care Model InnovationCreating new value
Member AcquisitionConnecting to Members
Business Model InnovationRecognizing Economic Value
Design
Operations

11
Building Capabilities to Care for the Health of Populations
Fee-for-service Shared savings Partial capitation Global payment
Care delivery innovation
Fairview Medical Group
reorganization
Medical home
Care packages
Payer contracting methodologies
Epic install
Physician compensation
Fairview population
Volume Value
Episode payment
Networkdevelopment
Population health
Operating model/infrastructure
Virtual care
Sensortechnology
AccountableCare
Organization
Integrated business intelligence

Changing Care and Experience
12
Care ModelInnovation
Creating Value
Care PackagesManaging the
continuum
Virtual CareImproving Experience
Design → Prototypes → Diffusion → Operational
•
Team-based care•
Care packages•
Care management
•
Adjustment•
Disease management
•
12 currently available (Primary Care)•
Developing additional for Specialty Care•
Engaging long-term and Transitional Care
•
Virtual Clinics•
Coaching•
Virtual Urgent Care•
Medication Therapy Management
•
Active Learning (Condition Specific)•
Sensor Technology (Predicting need)•
e Medical Homes

Improved quality in CMI clinics
13
Patient Satisfaction

14
Total Cost of Care Comparison (Preliminary)
Value Create Diffuse to Network$366
$395
$408 $412 $420
$341 $349 $350
$356 $354
$300
$320
$340
$360
$380
$400
$420
$440
DEC‐08 JUN‐09 SEP‐09 DEC‐09 MAR‐10
Non‐CMI CMI All Clinics
Allowed PMPMWeighted Average by Member Months
CMI Clinics: Eagan, Hiawatha, Northeast, Rosemont
Data basedon Medica Choice for FHS Attributed MembersClinic data excludes selected specialty and non‐primary care clinics (less than 2% of the Member Months in the data)
$0
Percent change from 12/08: 14.7%
Percent change from 12/08: 3.7%

Interdependent Network of Providers Creating More Value, Serving 1.5 Million Members
Interdependent
Network
Fairview
Medical
Group
Inter‐
dependen
t
Physicians
University
of
Minnesota
Physicians
Continuu
m Services
Change Experience
Change Care
Change Payment
15
Fairview
Physician
Associates

Provider Alignment Options
16
Active Medical
Staff
Practice Support
AlignedPartner
AffiliatedPartner
Employed by Fairview
Independent
Interdependent Integrated
Practice & participate in Fairview Network
Participate in shared savings
Care management infrastructure
16
17
We are engaging population “aggregators”
to increase members…
Individuals Macro Buyers Payers

18
Individuals will be attributed, enrolled or assigned to provider networks
CHOICE DIRECTED
Attributed MembersIndividuals attributed tothe primary care providerthey predominately chose
for their health care.(e.g. Medica members)
Assigned MembersIndividuals are directedto specific provider
networks by their payer.(e.g. GAMC members)
Enrolled MembersIndividuals has thechoice to select adefined/limitednetwork for care.(e.g. Medicare
Advantage members)

19
What does managing population health look like?The “Network”The “Population” The “Value”

Change Payment: The Value of Fairview Primary Care Physicians
20
123%
100%
92%
79%
Rat
io o
f Acu
ity A
djus
ted
Cos
t per
A
ttrib
uted
Mem
ber p
er M
onth
to
Ave
rage
of L
arge
Sys
tem
s
2008 2011
Mean
Fairview
OtherLarge System
Value to the Market
Impact of NewCare Models
EconomicOpportunity

21
How Fairview’s new contracts work…
Historical Contract New Contract
Guaranteed
Fee‐for‐
Service
Guaranteed
Fee‐for‐
Service
Year 1 Year 2
Pay‐for‐Performance
Guaranteed
Fee‐for‐
Service
Guaranteed
Fee‐for‐
Service
Year 1 Year 2
Cost of Care
Incentive*
Guaranteed
Fee‐for‐
Service
Year 3
Quality
Incentive*
Cost of Care
Incentive*
Quality
Incentive*
Cost of Care
Incentive*
Quality
Incentive*
* Based on measurable improvements in quality and cost
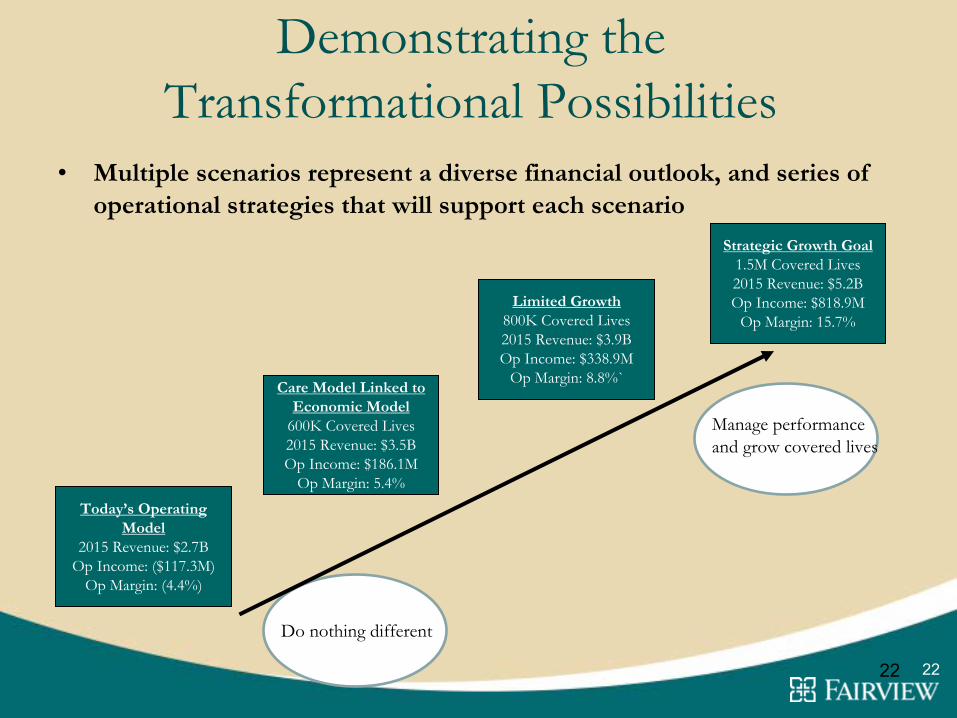
Demonstrating the Transformational Possibilities
22
•
Multiple scenarios represent a diverse financial outlook, and series of operational strategies that will support each scenario
Strategic Growth Goal1.5M Covered Lives2015 Revenue: $5.2BOp Income: $818.9M
Op Margin: 15.7%Limited Growth
800K Covered Lives2015 Revenue: $3.9BOp Income: $338.9M
Op Margin: 8.8%`Care Model Linked to
Economic Model600K Covered Lives2015 Revenue: $3.5BOp Income: $186.1M
Op Margin: 5.4%Today’s Operating
Model2015 Revenue: $2.7B
Op Income: ($117.3M)Op Margin: (4.4%)
Do nothing different
Manage performance and grow covered lives
22

Business model shift
23
Individuals Employers Payers Providers
DiseaseRisk
SelectionRisk
Perform‐ance Risk
RiskMitigation
CashManagement
Sales
Credentialing
NetworkManagemen
tMedical
Managemen
t
Cash Mgmt.
Risk Reserves
Und
erwritin
g
Cash Mgmt.
Credentialing
NetworkManagemen
tMedical
Managemen
t
Select functions of payers shifting to providers, as providers takeaccountability for accepting performance risk and managing the health of populations.
ProductDevelopmen
t
MemberServices

24
Executive Summary: Challenges•
Thriving in fee-for-service model while transforming to value-based model
•
Creating “new value”
and “realizing economic value”
of new care models
•
Cultural transformation to enable new business model
•
Physician alignment and integration (primary care/specialists, community/academic, independent/employed)
•
Creating financial capacity to invest in care model innovation—
internally generated and investments from external partners
•
Ownership and commitment to vision
•
Creating a sense of urgency—“the burning platform”
•
Creating the framework to manage health and performance risk
•
Access to information and privacy issues

Executive Summary: Success Factors
•
Senior leadership “will”
and engagement
•
Physician leadership “owns”
care model redesign
•
Enlightened partnerships with payers and employers
•
Physician/clinician alignment and integration
•
Partners who bring needed expertise
•
Access to data—integrated business intelligence
•
Commitment to transformative work to create new value
25

Appendix
26

27
Fairview Needs to Change Adjusting Our Strategy
To improve
the healthof the
communities
we serve
Exceptional Clinical care
Exceptional experience
Effective & efficient
use of resources
Strategicgrowth
Nation‐leading
research & education
Create an integrated, multispecialty
provider network.
Eliminate unintentional variation and
transform overall performance –
quality,
experience, cost – across the continuum.
Create new models for innovative care delivery and payment.
Establish the capabilities to accept risk and
manage the health of populations.
Attract new customers and optimize
relationships with current customers.
Invest in research and education to create
a reliable pipeline of innovation and
quality talent.
Create an environment for transformation
that actively engages employees and
physicians.
Create financial capacity to fund quality,
innovation and growth.
Mission
Vision
Goals
Strategies
The best health
care delivery
system for
America, in
partnership with
the University of
Minnesota.

Today…care for the sick
is physician centric
28

Change Care: Team-Based Care in Clinics
PCP
Medical Assistant
PCP
Medical Assistant
Schedulers
Team Care SupportMedication Management,
Clinical Educators, Health Coaches, etc.
PCP
Medical Assistant
Nurses
New Clinical InterventionsNew Clinical Interventions
Proactive, Planned CareProactive, Planned Care
Panel Management, Risk StratificationPanel Management, Risk Stratification
OutcomesOutcomes
Data DrivenData Driven
29

Tomorrow…keeping patients
healthy with team-based care
30

Change Experience: Virtual Care through Fairview NetClinic
Virtual Clinics• Coaching•
Medication Therapy Management
• Urgent Care•
eMedical Home
•
Condition Specific
31

Online Care Anywhere Dashboard Cumulative from 11/30/09 to 09/13/10
Gender:71.6% Female28.4% Male
Consumer Visits215
Visits (0
paid extensions)176
Blue Cross24
Medtronic6
Schwan’s9
ATK
1.
Sinusitis2.
Minor Injury3.
Chronic Illness4.
Skin Conditions5.
Behavioral Health
Diagnoses Entered by ProviderTop 5:
Consumer Enrollment2512
Enrolled (7.5% with visits)1764
Blue Cross (17% of potential)330
Medtronic (1% of potential)247
Schwan’s (3% of potential)171
ATK (2% of potential)
0
20
40
60
80
100
Time
Time of Day
8 am to noonNoon to 4 pm4 pm to 8 pm
Day of the Week
0
10
20
30
40
50
Sun Mon Tues Weds Thurs Fri Sat
Visit DetailsAverage length: 10 mins 5 sec83
Conversations resulting in a Rx (39%)112Total Prescriptions written
45-5427%
35-4435%
21-3427%
55-646%
65+2%
Age:
1.
Cold & Sinus2.
Medication Advice/Refill3.
Pain / Injury 4.
Skin Conditions5.
Behavioral Health
Conversation Topics by ConsumerTop 5:
Providers38
registered (100% with visits)
Provider Type with Visits:83% MD12% Physician Asst5% Nurse Practitioner
Satisfaction with System:4.4
/ 5 stars
Satisfaction with Provider:4.7
/ 5 stars
Satisfaction with System:4.4
/ 5 stars
Consumer Modes of Communication
2 2 %Cha t
3 5 %Cha t
P hone16 %Cha t
Vi de o
2 7 %Cha t
P hone Vi de o
32

12 Care Packages Developed
•
Low back pain•
Diabetes
•
Hyperlipidemia•
Hypertension
•
Migraine•
Kidney disease
•
Kidney transplant•
Adult asthma
•
Coronary artery disease•
Adult preventive
•
Prenatal care•
Total knee replacement
33