![CROSS-BORDER ROAD TRANSPORT ACT 4 OF 1998 · CROSS-BORDER ROAD TRANSPORT ACT 4 OF 1998 [ASSENTED TO 26 MARCH 1998][DATE OF COMMENCEMENT: 1 APRIL 1998] (English text signed by the](https://static.fdocuments.net/doc/165x107/5b772b8a7f8b9a47518c7464/cross-border-road-transport-act-4-of-cross-border-road-transport-act-4-of-1998.jpg)
Minnesota Low Volume Road Design 1998
85
=1ber 999-34 3 0314 00027 0040 r r I r r r L L L L Minnesota Low Volume Road Design 1998 cm ¶1 Minnesota Local Road Research Board MnEQROAD Office of Mistc seta Road Research
Transcript of Minnesota Low Volume Road Design 1998

=1ber 999-343 0314 00027 0040
r r I r r r
LL
LL
Minnesota Low VolumeRoad Design 1998
cm¶1
Minnesota Local RoadResearch Board
MnEQROADOffice of Mistc seta Road Research

FUNDING ACKNOWLEDGEMENT
This project was conducted with funding provided by the Minnesota Local Road Research Board (LRRB). The LRRB's purpose isto develop and manage a program of research for county and municipal state aid road improvements. Funding for LRRB researchprojects comes from a designated fund equivalent to 1/2 of one percent of the annual state aid for county and city roads.

Technical Report Documentation Page1. Report No. 2. 3. Recipients Accession No.
MN/RC - 1999-34
4. Title and Subtitle 5. Report Date
MINNESOTA LOW VOLUME ROAD DESIGN 1998 September 19996.
7. Author(s) 8. Performing Organization Report No.
Eugene L. Skok
David E. Newcomb
David H. Timm9. Performing Organization Name and Address 10. Project/Task/Work Unit No.
University of Minnesota
Department of Civil Engineering 11. Contract (C) or Grant (G) No.
122 CivE Bldg., 500 Pillsbury Dr., S.E. 74708 TOC #55Minneapolis, Minnesota 55455-022012. Sponsoring Organization Name and Address 13. Type of Report and Period Covered
Minnesota Department of Transportation Final Report 1997 - 1999395 John Ireland Boulevard, Mail Stop 330 14. Sponsoring Agency CodeSt. Paul, Minnesota 55155
15. Supplementary Notes
16. Abstract (Limit: 200 words)
In this project, researchers examined the current practices that local agencies use and evaluated the thickness designprocedures by comparing predicted lives for the current designs with those obtained from the mechanistic-empiricaldesign procedure ROADENT.
Researchers determined current practices by sending a questionnaire to all cities and counties and visiting twocounties and one city. In general, the questionnaire responses show that cities and counties use a variety of practicesfor the design, construction, and management of low volume pavements in Minnesota.
Relative to the current designs, ROADENT predictions of fatigue behavior require a thicker design for medium andhigh-traffic roads than the Soil Factor design, and a thicker design for high-traffic roads than the R-Value procedure.The required thicknesses based on development of rut depth are not consistent with the current designs.
To develop consistent procedures for the design, construction, and management of low volume roads in Minnesota,the report recommends converting the differences in performance predictions to thicknesses through the use ofexisting procedures and the mechanistic-empirical procedure; developing a best practices manual; and implementingthe design procedure and manual.17. Document Analysis/Descriptors 18. Availability Statement
Pavement design Low volume road pavement No restrictions. Document available from:
Flexible pavement design design National Technical Information Services,ROADENT Springfield, Virginia 22161
19. Security Class (this report) 20. Security Class (this page) 21. No. of Pages 22. Price
Unclassified Unclassified 78


MINNESOTALOW VOLUMEROAD DESIGN
1998
Final Report
Prepared by
Eugene L. SkokDavid E. Newcomb
David H. Timm
University of MinnesotaDepartment of Civil Engineering
122 CivE Building500 Pillsbury Dr. SE
Minneapolis, MN 55455-0220
September 1999
Published by
Minnesota Department of TransportationOffice of Research Administration200 Ford Building Mail Stop 330
117 University AvenueSt. Paul, Minnesota 55155


TABLE OF CONTENTS
Chapter 1 IN TRODU CTION ............................................................................................ 1
Chapter 2 CURRENT MINNESOTA PAVEMENTTHICKNESS DESIGN PROCEDURES .......................................... ............. 3Introduction ..................................... .......... ................................................ . 3Soil Factor D esign..................................... ......................................................... 3R-V alue D esign.............................. .............. ................................................. 5
Chapter 3 SURVEY OF LOW-VOLUME PAVEMENTDESIGN PRACTICE IN MINNESOTA........................................................D esign ............................. ..... ....... .... .... .................................. .......................... 9Specifications.................................................. .................. ..................... ......... 13C onstruction .. ..... ..... ...................................................................................... ............... 16
S oils ............................................................................................................. 16Granular Base/Subbases........................................................................... 16A sphalt Layers .......................................... ............................................... 18
Perform ance ........................................ ................................................................ 20Load Restrictions ................. ....................................... 25
Chapter 4 CORRELATION BETWEEN SOIL FACTOR ANDR-VALUE PROCEDURES WITH THE MECHANISTIC-EMPIRICAL DESIGN PROCEDURE.............................................................31Introduction ....................... ..... ................. ...... .......................................................... 31Soil C haracteristics .......................................................................................... 32The Traffic Factor........................................................................................... 36Pavem ent Life Predictions.................................................................................. 41
L oading ................................................................................................... . . .4 1Soil Strength .................................................................................................... 4 1
Stiffness of Pavement Layers........................................................................42Thickness of Pavement Layers ........................................................................... 42
Chapter 5 SUMMARY, CONCLUSIONS AND RECOMMENDATIONS..........................57
Appendix A Tabulation of 64 County and 50 City Questionnaire Responses

LIST OF TABLES
Table No. Page No.
1 AASHTO Classifications Representing Various Soil Factors 32
2 Relationship between AASHTO Soil Classification and 33Stabilometer R-Value
3 Resilient Modulus Predicted from R-Value Ranges Determined for 35AASHTO Soil Classifications and Stress Conditions for GranularSoils
4 Resilient Moduli Ranges Based on Soil Factor 36
5 Estimated ESAL for Traffic Levels Defined in the Soil Factor 39Design Table
6 Soil Moduli used for ROADENT Life Predictions 42
7 Seasonal Pavement Layer Moduli 43
8 Summary of Embankment Stiffness Used for Mechanistic Design 45Simulations
9 Soil Factor Method vs. Roadent - Run 1: SF = 50, Resilient 46Modulus = 128 MPa (18,500 psi)
10 Soil Factor Method vs. Roadent - Run 2: SF = 100, Resilient 46Modulus = 53 MPa (7,660 psi)
11 Soil Factor Method vs. Roadent - Run 3: SF = 130, Resilient 47Modulus = 45 MPa (6,550 psi)
12 R-Value Method vs. Roadent - Run 4: R = 70, Resilient Modulus 47= 138 MPa (19,750 psi)
13 R-Value Method vs. Roadent - Run 5: R = 20, Resilient Modulus 48= 55 MPa (8,000 psi)
14 R-Value Method vs. Roadent - Run 6: R = 10, Resilient Modulus 48
= 45 MPa (6,550 psi)

LIST OF FIGURES
Figure No.
1
2
3
4
5
6
7
8
9
10
11
12
13
14
15
16
17
18
19
Flexible pavement design using soil factors. Granularequivalencies (GE) for various soil factors (SF). Units ofmm for GE.
Bituminous pavement design chart (aggregate base).
Use of current Minnesota design methods.
Predominant soil types.
Use of compaction subcuts.
Depth of compaction subcuts.
Traffic input for design methods.
Asphalt specifications.
Use of recycled asphalt pavement (RAP).
Granular base/subbase specifications.
Types of embankment specifications.
Typical soils testing required during construction.
Aggregate base lift thickness, in.
Granular base testing required.
Use of quality management practices in hot mix construction
Types of performance evaluation.
Time to rehabilitation for new HMA pavement.
Time to rehabilitation for HMA overlays.
Major categories of performance problems.
Page No.
4
6
11
11
12
12
14
14
15
15
17
17
19
19
21
21
22
22
24

Figure No. Page No.
20 HMA related performance problems. 24
21 Structural/environmental related performance problems. 26
22 Construction related performance problems. 26
23 Use of spring thaw load limits. 27
24 Means for establishing load limits. 27
25 Level of enforcement for load limits. 29
26 Timing of load restriction placement. 29
27 Minnesota vehicle types. 38
28 Comparison of Minnesota LVR Designs with Roadent (SF = 50) 51(1 = Thicker, 0 = Same, -1 = Thinner)
28 Comparison of Minnesota LVR Designs with Roadent (SF = 100) 52(1 = Thicker, 0 = Same, -1 = Thinner)
28 Comparison of Minnesota LVR Designs with Roadent (SF = 130) 53(1 = Thicker, 0 = Same, -1 = Thinner)
28 Comparison of Minnesota LVR Designs with Roadent (R = 70) 54(1 = Thicker, 0 = Same, -1 = Thinner)
28 Comparison of Minnesota LVR Designs with Roadent (R = 20) 55(1 = Thicker, 0 = Same, -1 = Thinner)
28 Comparison of Minnesota LVR Designs with Roadent (R = 10) 56(1 = Thicker, 0 = Same, -1 = Thinner)

EXECUTIVE SUMMARY
Local agencies in Minnesota currently have two thickness design procedures available to
them: the Soil Factor design (1) which was developed in 1954 and the R-Value design (2) which
has been used by the Minnesota Department of Transportation (Mn/DOT) since about 1970.
These procedures have evolved over the years; however, changing traffic and technology plus
data from the Minnesota Road Research Project (Mn/ROAD) require that the procedures be
evaluated and updated.
Specifications, construction procedures and pavement management practices are also
quite variable from one agency to another. The purpose of this project is to determine the current
practices used by local agencies and evaluate the thickness design procedures by comparing
predicted lives for the current designs with those obtained from the Mechanistic-Empirical
design procedure developed at the University of Minnesota (ROADENT) (8).
Current practices were determined by: 1) sending a questionnaire to all cities and counties
and 2) visiting two counties and one city. Sixty-four (64) out of 87 counties responded and 50 of
the 120 cities responded. The responses indicate that:
> Most cities use the R-Value procedure, some use typical cross sections;
most counties use the Soil Factor procedure
> Compaction subcuts of various depths are used
> Mn/DOT mixes 2331 and 2340 are mostly used
> Rehabilitation times for new hot mix asphalt pavements vary from five years to 30
years with the median between 20 and 25 years
> Rehabilitation times for overlaid pavements are between five and 25 years with the
median time less than ten years for cities and about 15 years for counties
> Performance problems are mostly structural
> About 1/3 of the counties and 1/2 of the cities have pavement management systems
> Essentially all counties and 2/3 of the cities apply spring load restrictions; however,
the timing and enforcement are variable.
In general, the questionnaire responses show that there is a variety of practice used for the
design, construction and management of low volume pavements in Minnesota.

The mechanistic-empirical design procedure calculates strains in a pavement section
assuming the pavement is an elastic layered system. Moduli of each layer must be determined for
various conditions in-situ. The calculated strains are then correlated with load cracking
(horizontal tensile strain in the asphalt layer) and rut depth development (vertical compressive
strain on the embankment soil). Predictions of performance with this program are based on
conditions observed and strains measured at Mn/ROAD. Variation in the layer properties
throughout the year are also based on backcalculation of falling weight deflectometer (FWD)
data from Mn/ROAD. Soil factor and R-value designs have been compared to the mechanistic-
empirical design by: 1) converting soil factors and R-values to moduli for the soils and 2) con-
verting the annual average daily traffic (AADT) and heavy commercial average daily traffic
(HCADT) values to equivalent single axle loads (ESAL) for the Soil Factor Design.
Relative to the current designs, ROADENT predictions of fatigue behavior:
1. requires a thicker design for medium and high traffic roads than the Soil Factor design
2. requires a thicker design for high traffic roads than the R-Value procedure.
The required thicknesses based on development of rut depth are not consistent with the current
designs. Chapter 4 includes more details on these design comparisons.
RECOMMENDATIONS:
To develop consistent procedures for the design, construction and management of low
volume roads in Minnesota, it is recommended that:
1. Differences in performance predictions be converted to thicknesses by using the
existing procedures and the mechanistic-empirical procedure. The version of
ROADENT used for this report does not include reliability. Thickness comparisons
should be based on the next version of ROADENT which will include the reliability
factor. The resulting designs then need to be field checked using city and county
roads for which design and performance information is available.
2. A best practices manual be developed. Include recommended procedures for the
design, construction and management of the low-volume road system in Minnesota.
3. Implementation of the design procedure and manual needs to be accomplished so that
the recommended procedures are put into practice as soon as possible.

CHAPTER 1
INTRODUCTION
The thickness design procedures used for low volume roads in Minnesota have evolved over
many years. The Soil Factor Design procedure which is in the State Aid Manual (1) was the
procedure developed in the 1950's and used for all flexible pavements in Minnesota until the
1970's when Mn/DOT started to use the R-Value design. The Soil Factor Design results in a
Granular Equivalent (G.E.) thickness based on the type of soil for seven levels of traffic based on
ADT and HCADT. The R-Value Design which is in the current Mn/DOT Road Design Manual
(2) uses the laboratory-based or estimated R-Value to evaluate the soil. There is some correlation
between R-Value and Soil Factor. There have been comparisons made between design
thicknesses for the two procedures (3). Generally the R-Value procedure requires greater
thicknesses, especially at higher traffic levels. The purpose of this report is to review these
design procedures in light of performance observed at Mn/ROAD and summarize current
practices used by local agencies in Minnesota.
This report includes the following:
1. A brief presentation of the Soil Factor and R-Value design procedures as used in
Minnesota.
2. A summary of local design practices for not only thickness design, but also for specifica-
tions, construction practices, and performance expectations. These all need to be tied
together to get a good indication of the design practice used by local agencies.
A questionnaire was distributed to 120 cities and 87 counties in Minnesota. Replies have
been tallied and reviewed in Chapter 3 of this report. There are a number of design
procedures and applications used by the local agencies. Two counties and one city were
also visited. Their replies and discussions have been included with the questionnaire
replies.
3. A comparison between design thicknesses resulting from the Soil Factor and R-Value
1

design procedures. The mechanistic-empirical design procedure based on life predictions
(pavement performance) from Mn/ROAD was used for comparisons.
4. Recommendations are made for continuing the evaluations to review thicknesses
determined from the mechanistic procedure and developing a best practices manual to
establish the most efficient use of existing materials.

CHAPTER 2
CURRENT MINNESOTA PAVEMENTTHICKNESS DESIGN PROCEDURES
INTRODUCTION
There are two flexible pavement thickness design procedures now used in Minnesota. In
addition some pavements, especially at the local level, are designed by experience based on what
has worked in the past. The two formal thickness design procedures are the Soil Factor Design
found in the Mn/DOT State Aid Manual (1) and the Stabilometer R-Value Design found in the
Mn/DOT Design and Geotechnical Manuals (2 and 3). The Soil Factor procedure is a carryover
from the Mn/DOT procedure used before the R-Value was adopted in the early 1970's. In this
section both procedures are presented along with the factors required for thickness determination.
SOIL FACTOR DESIGN
Since 1954 some pavements in Minnesota have been designed using a chart similar to the one
shown as Figure 1. This is the 1998 version which uses metric units. The chart uses seven traffic
categories and types of embankment to determine a thickness in terms of Granular Equivalent
(G.E.). Each design also has a specified maximum spring axle load in tonnes (1.1 tons).
The traffic factors are Average Daily Traffic (ADT) and Heavy Commercial Average Daily
Traffic (HCADT). The ADT and HCADT are two-way values. The ADT includes all vehicles
and the HCADT includes all trucks with six or more tires; thus HCADT does not include cars,
small pickup and panel-type trucks. The ADT and HCADT normally used for design are values
predicted for 20 years in the future. Local conditions must be considered and the projected value
may either be increased or decreased based on predicted future use of the road.
As noted in Figure 1 a soil factor of 100% represents an A-4 or A-6 soil. Stronger soils have
soil factors less than 100% and weaker soils have soil factors greater than 100%. There are
ranges of percents shown for A- , A-2 and A-4 soils. Therefore, it is possible to use some
judgment relative to the capabilities of the soils after evaluating drainage and other design
considerations.

to0
0
.15
r3to
<>
i
0o
rot
tE
§1
E)
0C
E
CI
0
0
0
U-
t,
•
a,
00
cn
0)
0oC)0o-o
W-4
I)

The granular equivalent defines a pavement section by equating the thickness of each layer to
an equivalent thickness of granular base material (see Equation 1). In Minnesota, this is a Class 5
or Class 6 gravel or crushed base material. The granular equivalent factors are also shown on the
right side of Figure 1. Minimum bituminous and total granular equivalent are shown for each
traffic category. The total granular equivalent can be defined using Equation 1.
G.E. = aD, + a2D2 + a3D3 (1)
where: D, = thickness of asphalt mix surface, mm.
D2 = thickness of base course, mm.
D3 = thickness of subbase course, mm.
a,, a2, a3 = G.E. factors listed in Figure 1.
The required design thicknesses are listed in two categories (minimum bituminous G.E. and
total G.E.). The maximum granular base thickness can be calculated by subtracting the
minimum bituminous G.E. from the total G.E. Other design combinations of bituminous and
granular materials can be determined using the G.E. factors.
R-VALUE DESIGN
The R-Value design chart shown in Figure 2 is in the Mn/DOT Design and Geotechnical
Manual. The procedure uses the R-Value measured with a laboratory test or estimated from the
soil type or classification. The R-Value laboratory procedure used in Minnesota is presented in
Reference 3. An exudation pressure of 1655 kPa (240 psi) is used for design. Predictions of R-
Value from soil classification are presented in Chapter 4 of this report.
The traffic is evaluated in terms of 80-kN (18,000-lb) equivalent standard axle loads
(ESAL's). For a particular road to be designed, the ESAL's are estimated for a design lane in one
direction.
The thickness is determined in Granular Equivalent in inches. Granular equivalent factors (a1 ,
a2, a3) for the R-Value design are listed in Figure 1. Equation 1 is used to calculate the total
5

0 10) 01r
(U
CL
a)cc
o oCISC)
14
c-i
IdsJr-i§)
ul o u, o nn o .nur- c1 C4 c C t )sN0U| (30) siuqwlnba julnuv

Granular Equivalent the same as for the Soil Factor design.
Minimum bituminous and base granular equivalents are plotted on the chart. The minimum
bituminous and bituminous surface plus base thicknesses can be calculated using the appropriate
G.E. Factors.
Design thicknesses for various traffic levels and soil types will be determined using these
design charts. Expected design lives using the mechanistic-empirical design procedure
(ROADENT) for thicknesses determined from each of the procedures will then be predicted in
Chapter 4.
7


CHAPTER 3
SURVEY OF LOW-VOLUME ROAD PAVEMENTDESIGN PRACTICE IN MINNESOTA
In July, 1998, a questionnaire was sent to the 87 county highway departments and 120
city and municipality public works departments in Minnesota. The purpose was to gain insights
into actual local pavement design and construction practices along with what parameters are used
along with how they are determined for specific design applications.
The items covered were:1) thickness design, 2) specifications, 3) construction, 4)
performance and 5) load restrictions as part of the management of the road system. Copies of the
four-page questionnaire with the number of replies for each question are attached as Appendix A.
A total of 114 replies were received (64 counties and 50 cities). This helps establish the present
state-of-the-practice (technology) in Minnesota.
The summary presented is based on the total responses only. The number of agencies
replying with respect to a given procedure is presented. The replies have been retained so it will
be possible to regionalize or categorize the responses if desired. In some cases there are more
responses noted than questionnaires returned because most agencies used more than one
procedure depending on traffic level, have more than one soil type in their area, etc. The
summaries discussed in this chapter are numerical only and do not cover every question in detail.
Figures Al and A2 of Appendix A show the replies for each of the items from the
counties and the cities respectively. The following are brief discussions of the response
summaries in each category.
DESIGN
The numbers for each paragraph refer to the item numbers on the questionnaire.
1. Over 1/2 of the cities use the soil R-Value design procedure. A number of agencies

use the R-Value procedure for high traffic roads only. Figure 3 shows that:
> Most cities use R-Value design
> Most counties use Soil Factor design
> Some design only for high traffic
> Two cities and one county use typical cross sections.
2. Figure 4 shows the distribution of soils throughout Minnesota by the cities and
counties, respectively. The most predominant soils are A-6, A-4, A-7-6 and A-7-5
types respectively. The occurrence of A-5 soils is a mystery. The type of soils
reported reflect the anticipated soil types throughout the state with the exception of
A-3 and A-5 soils. There are generally more counties with A-3 and granular soils than
indicated(l). Also there have been no laboratory A-5 soil classifications over the past
40 years.
3. Generally, soils are determined by a combination of sampling, classification and what
materials have been encountered previously. Very few use the USDA maps.
4. Figure 5 shows that about half of the cities use compaction subcuts and that 90% of
the counties do as well. In rural areas compaction subcuts are very important because
they result in more uniform soil conditions and support and thus a smoother ride.
Figure 6 shows the depth of compaction subcuts used by cities and counties. Most
counties use 0.6-m (2-ft) subcuts and most cities use 0.3-m (1-ft) subcuts while some
use 0.6-m (2-ft). The greater need for uniformity makes it necessary for deeper
subcuts on county roads.
5. and 6. Figure 7 is a summary of the responses to what traffic input is used.
Combinations of ADT and HCADT obtained from Mn/DOT are used to calculate
10

I Cities * Counties
45-
40-
35-
30-
25-
20-
15-
5-
0-Soil Factor R-value Other
Figure 3. Use of current Minnesota design methods.
I Cities E Counties
2111
.S 1
A-l-b A-2-4 A-3 A-4 A-5 A-6 A-7-5 A-7-b
Figure 4. Predominant soil types.
11
All
p

I Cities M Counties
Yes No
Figure 5. Use of compaction subcuts
M Cities 0 Counties
1 ft 1-2 ft 2ft
Figure 6. Depth of compaction subcuts.
12
I 1_1m- --

ESAL for traffic input. Classification of traffic with automated devices is used by
three agencies. Mn/DOT through the State Aid and Traffic Offices is developing
procedures to determine vehicle factors for estimating ESAL when the percents of
various vehicles are known. ADT only can be used for a given location if the
distribution of vehicle types and axle weights are consistent.
7. Essentially all counties use ditches of some configuration as a drainage feature. About
1/3 use edge drains, but only five use a drainage layer. Edge drains generally should
not be used unless a good drainage layer is incorporated to transmit water to the
pavement edges.
SPECIFICATIONS
1. Figure 8 illustrates the number of agencies using the various Mn/DOT bituminous
mixture specifications. Most cities use Mn/DOT 2331, fewer use 2340, and fewer yet
use 2350 (the VMA Spec). Most counties use the 2340 with fewer using 2331 and
fewer yet using 2350. Only one county and one city are using the Superpave (2360)
specification. The 2350 and 2360 specifications have been developed by Mn/DOT
during the last two years and the local agencies are just starting to use them. Mn/DOT
is using the 2360 specification only on roads with more than 3 million ESAL. This
criterion would include only a very small percentage of city and county roads.
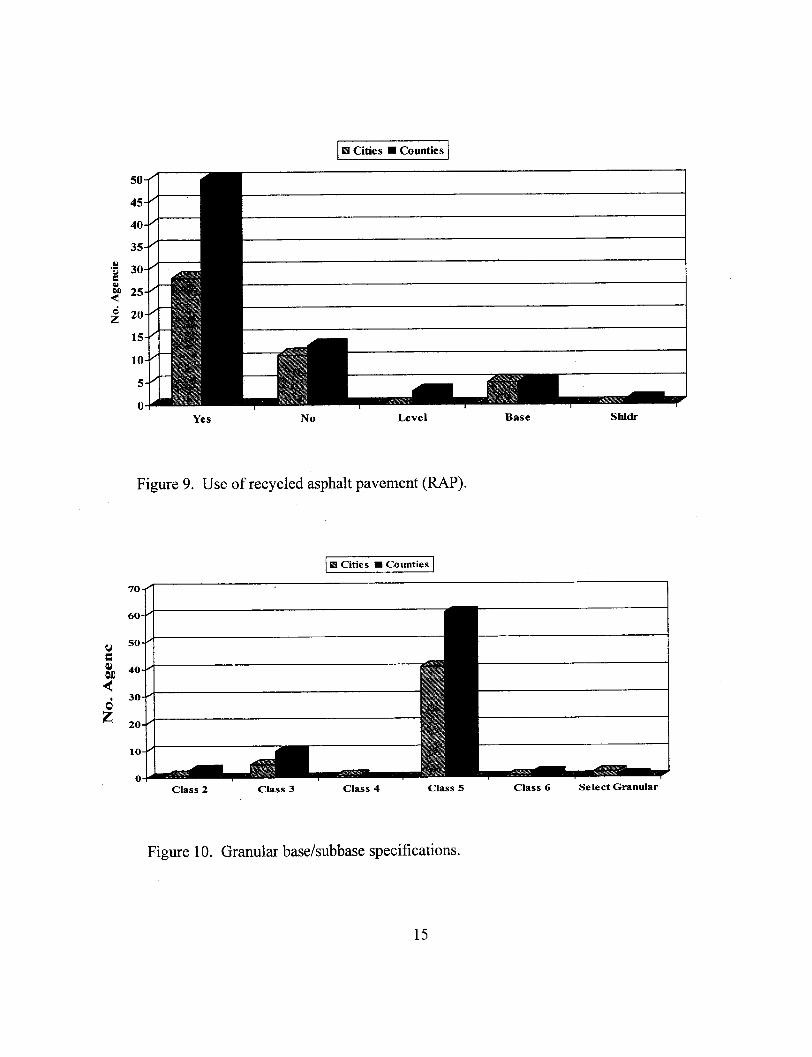
2. Figure 9 shows that 50 of the counties and 27 cities allow RAP (Recycled Asphalt
Pavement) in their mixes. However, three allow it only in leveling, five in base mixes
and one on shoulders only.
3. Figure 10 shows that the predominant granular base specification for both cities and
counties is Mn/DOT 3139, Class 5 with Class 2 and 3 used by a few counties as
subbase. Class 6 is used by only two counties and one city.
13

a Cities. Counties
NMax. iLaa
Figure 7. Traffic input for design methods.
m Cities N C
ADTI Other
:ounties
2331 2340 2350 2360
40
35.
30-
25-
20
15-
5-/
0A
rn
.!
6JDsu
HCADT ESAL
35-
30-
25-
S20-
15-
10-
5-
0
Figure 8. Asphalt specifications.
14
- I
I Cities U Counties
Yes No Level Base
Figure 9. Use of recycled asphalt pavement (RAP).
M Cities U Counties
Class 2 Cl:ass 3 Class 4 Class 5 Class 6 Select Granular
Figure 10. Granular base/subbase specifications.
15
Shldr
70-
60-
50-
40-
30-
20-
10
0
I ·
300
200
j00
00.40.
--
=dM,Level
~,~
I-

4. As shown in Figure 11, 52 of the counties and 22 cities use ordinary compaction to
control embankment construction, and 23 of the cities and only six counties use
specified density. Twenty-three counties use test rolling, and 20 use the standard
Proctor (95%) for specified density control.
Fourteen counties use a 45 tonne (50-ton) roller and Mn/DOT specification 2111.
Two counties use a loaded truck and two use a scraper as the load for test rolling.
Ordinary compaction works well only with a very experienced inspector;
specified density gives a more definitive indication of density ata given location.
CONSTRUCTION
Soils
1. Soil testing during construction is summarized in Figure 12. The cities control
embankment soil construction using in-situ density (35) moisture content (26) and
classification/gradation control (22). However, of the counties, only eight use density,
seven use moisture control and 32 check only gradation for uniformity. Thirteen
counties do not use any testing for soils construction control.
2. The in-situ density is measured using nuclear measurements more than sand cone
(29 - 13) for cities. Consultants do most of the inspection (33), followed by the
agencies (11) and the contractor (3).
About half of the counties use nuclear gauges and half sand cone to measure in-situ
density. Seventy-five (75) percent of the counties do their own inspection testing.
Granular base/subbases
3. The number of agencies using various maximum specified lift thicknesses for gran-
ular materials are plotted in Figure 13. The maximum lifts range from 50 mm (2 in.)
16

U Cities U Counties
Ordinary
50-
40-
30-
20-
10-
0-
Figure 11. Types of embankment specifications.
M Cities U Counties
35-
30-
25-
S20-
I 15-
10- /
-0
aIn-Situ Dens. Moisture Content Gradation None
Figure 12. Typical soils testing required during construction.
17
60-
Spec. Density Test Roll Other
It
I

to 400 mm (16 in.). One agency indicated each lifts of 230, 305, 350, 400-mm (9, 12,
14, and 16 in.). These may have misinterpreted the question. Most of the counties
indicated a 75-mm (3-in.) maximum whereas most of the cities stated 150-mm (6-in.)
with some 200-mm (8-in.) maximum thicknesses used.
4. and 5. Figure 14 illustrates the tests run during construction of granular bases/sub-
bases. A majority of the cities run density and gradation control tests whereas a
majority of the counties (54) control based only on gradation tests. One city uses test
rolling.
Thirty-three of the agencies use nuclear density devices and 17 use the sand cone.
Fifty-four counties and 11 cities do their own testing whereas three counties and 36
cities have consultants do their testing and inspection. The contractor does the testing
for seven counties and two of the cities.
Asphalt Layers
6. Only eight of the 61 counties responding and three of the 46 cities responding use a
prime coat on granular bases before paving.
Most counties (50) specify maximum lift thicknesses between 40 mm (1-1/2 in.) and
75 mm (3 in.) for bituminous base and binder layers. For the surface mixes a
maximum lift of 40 mm (1-1/2 in.) is used.
The maximum lift for 18 cities was between 50 mm (2 in.) and 75 mm (3 in.) and
maximum thicknesses for binder courses were mostly 50 to 100 mm (2 to 4 in.).
Three cities allowed 75-mm (3-in.) lifts and one allowed 100 mm (4 in.).
18

1 Cities * Counties
2 3 4 6 7 8 9 10 11 12or>
Figure 13. Aggregate base lift thickness, in.
I Cities E Counties
In-Situ Dens. Moisture Content Gradation
Figure 14. Granular base testing required
19
60-
50-
40-
30-
20
10
O-
None Otherwmmmiawmlm I
oEa,bD
dZ
q=

7. Figure 15 shows that 18 cities use Quality Management and 27 do not, whereas 44
counties use QM and 20 do not.
PERFORMANCE
1. Figure 16 shows that a majority of the counties (39) at least partially use ride to
evaluate performance. Condition surveys are used by 27 counties and 27 cities; 14
counties and only two cities use deflection testing. A combination of these factors is
used by most agencies.
2. Twenty-two of 50 cities have a pavement management system. Nine have the Braun
ICON system, five the PMS/Stanley and two the Wisconsin Paver system. Only 20 of
the 64 counties responding have a pavement management system. Seven have the
cartegraph system, three developed in-house systems and three use the ICON
software.
3. Figure 17 shows the length of time experienced before rehabilitation is required on a
new pavement. The city experience ranges from five years (1) to 50 years (1). The
time most (9) indicated was 25 years. Twenty years was approximately the median
time for cities. Two-thirds of the expected lives were between 15 and 25 years.
For the county respondents the range of expected life for a new asphalt pavement is
from 5-7 years up to 30-40 years. Only two counties reported lives less than seven
years and two 30 years or more. The majority of lives reported are also between 15
and 20 years.
4. Figure 18 shows the life expected from asphalt overlays. Most of the cities (27/42)
indicated overlay lives of 10-15 years. In Mankato the expected life is related to total
traffic. An overlay on a high traffic road (> 10,000 ADT) is expected to last 5-10
20

I Cities c Counties
45-
40
35-
30
25-
20-
15
10
5-
0Yes No
Figure 15. Use of quality management practices in hot mix construction.
E Cities U Counties
Ride Quality Condition Survey Deflection Testing
Figure 16. Types of performance evaluation.
21
40
30-'
25
20
15-
10-
5-
0-
u
dZ
I ?-
cs=
Z

I Cities l Counties
20
18-ý
16-
14-^
12-/
10-/
Q /
5 to 10 10 to 15 15 to 20 20 to 25 25 to 30
Years
Figure 17. Time to rehabilitation for new HMA pavements.
i Cities m Counties
25-
20-
15-
0 10-
5-
0-5 to 10 10 to 15 15 to 20 20 to 25 25+
Years
Figure 18. Time to rehabilitation for HMA overlays.
22
6-
4-2-
0-30+
a m
mi
or
m
4 ,

years; a medium traffic road (4,000 - 10,000 ADT) is 15-20 years and on low traffic
roads (100-4,000 ADT) 25-35 years. A number of cities indicated the life of an
overlay depends on the strength and condition of the underlying layers.
The county experience shows somewhat more life for overlays. Six counties reported
lives less than seven years, but these were for seal coats. Twenty-five counties
reported lives of 10-15 years and 18 reported 15 to 20 years. The median age of
overlays for the counties is between 15 and 20 years.
There are many factors which affect the lives of new pavements and overlay
pavements. These include to some extent all of the items included in this
questionnaire. In Chapter 4 the materials and conditions to determine the relative
effect of these factors will be modeled using the format of the computer program
ROADENT.
5. The motivation for rehabilitation of pavements was categorized into a) Mixture,
b) Structural/Environmental and c) Construction. Each of these was further sub-
divided. A number of agencies indicated more than one of these overall categories.
Most of the reasons were structural/environmental for both cities and counties. About
the same number indicated mixture and/or construction problems were the reason for
performance problems. Figure 19 is a summary of these responses.
a. Figure 20 shows that raveling and rutting are the primary mixture problems
affecting performance for cities and counties (but in reverse order). Stripping was
noted by only eight agencies, and flushing and tenderness are only minor
problems.
23

I Cities U Counties
Struct/Envir Construction
Figure 19. Major categories of performance problems.
E Cities U Counties
30 -'
25-
20-
15
10
0-
(Acio
&£d
Z
Raveling Stripping Flushing Rutting Tenderness
Figure 20. HMA related performance problems.
24
100-
90-
80-
70-
60-
50-
40-
30-
20-
100-
\ \ \\
Mixture
I

b. The type of Structural/Environmental problems are summarized in Figure 21.
Fatigue cracking and transverse cracking are noted by over half of the respondents
with rutting indicated by less than one-third of the respondents. If rutting as a mix
problem is combined with rutting as a structural problem, over half of the counties
are concerned with rutting overall. Some of the fatigue cracking could be
associated with wet conditions caused by open transverse cracks.
c. Joint deterioration is listed mostly as a construction problem requiring rehabili-
tation by both cities and counties. Poor ride quality and lack of uniformity are
listed by fewer cities and counties as shown in Figure 22.
LOAD RESTRICTIONS
1. Figure 23 shows that all 64 counties and 32 of the 50 cities limit loads during some
portion of the year. None of the counties and 13 cities do not use load restrictions.
2. Figure 24 shows that load limits are usually set based on the design of the roadway.
About one-third of the counties and only two of the cities use deflection testing along
with consideration of the design to establish load restrictions.
3. Load limits should be applied consistently in a given area so that engineers, law
enforcement and the public can plan and coordinate their activities efficiently. It is
counterproductive for load restrictions to be applied non-uniformly. Figure 25 shows
that most local agencies rely on Mn/DOT for guidance when setting load restrictions.
Using neighboring agencies also helps develop consistency in a given area. One
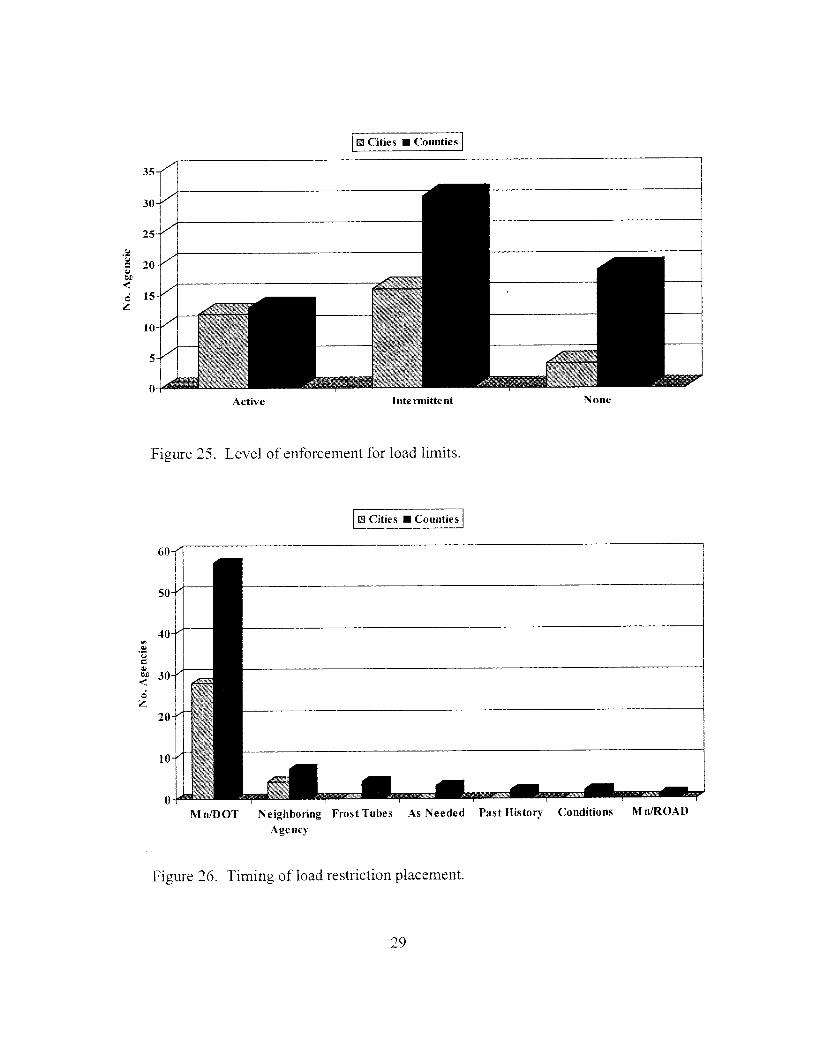
county uses Mn/ROAD information for guidance to help establish the timing of load
limits. As Mn/DOT develops this process, local agencies should follow suit.
25

<
Z
Fatigue Cracking Rutting Transverse Cracking
Figure 21. Structural/environmental related performance problems.
E Cities I Counties
20-
<
S15--
S10-
5-
0-
0-
Lack of Uniformity Poor Ride Quality Joint Deterioration
Figure 22. Construction related performance problems.
26
II
I Cities E Counties
- _ I25-Tl*ý

1 Cities 0 Counties
Yes No
Figure 23. Use of spring thaw load limits.
E Cities U Counties
Defl. Testing Design
Figure 24. Means for establishing load limits.
27
uc
dZ

4. In order for load limits to be effective they must be enforced. Enforcement starts with
the local police or sheriffs department and they must be backed by judges who are
willing to make penalties stick. Figure 26 shows that enforcement is only intermittent
for most cities and counties. Less than 25% of the agencies have active enforcement.
More than 25% of the counties and four cities indicate no enforcement at all.
5. A summary of the responses to the parts of Question 5 is presented in Appendix B.
The data indicate that essentially all of the local roads are bituminous and that 25% to
70% of the roadways are restricted and are posted.
28
E3 Cities Counties
iii
Active Inte nnitte nt None
Figure 25. Level of enforcement for load limits.
I• Cities U Counties
/
/
Mn/DOT Neighboring Frost TubesAgency
"AMOMMI, .."AMMi
As Needed Past History Conditions Mn/ROAD
Figure 26. Timing of load restriction placement.
29
35 /
30-
25-4
20---
10--
5-
0-
1.:
iL
*3
<
dZ
40n--010u-
50-
40-
30-
20-
10-
W)Wcr<u&£<D
0
A
I
~asrs~a~s~ '6B8a~ -M-w-
-I
r1-- I
r

30

CHAPTER 4
CORRELATION BETWEEN SOIL FACTOR ANDR-VALUE THICKNESS DESIGN PROCEDURES
WITH THE MECHANISTIC-EMPIRICAL DESIGN
INTRODUCTION
The Mn/DOT State Aid Manual (1) includes the latest version of the Soil Factor Flexible
Pavement Design Procedure as a guide for the design of city and county roads. This design table
(Figure F5-892.210) is an updated version of the flexible pavement design which was used
before the Minnesota Highway Department adopted the R-value procedure in the early 1970's.
The soil factor design was used by the Minnesota Highway Department until about 1972. A
"standard" design was set up for a typical A-6 soil which was given a soil factor of 1.0 (100%).
The thickness of bituminous mixture and base were set for given traffic levels. The percentage
(called soil factor) was then applied to the thickness of the granular base and subbase. The
thicknesses recommended have been revised somewhat with experience throughout the years.
Newcomb and Timm (8) have developed a mechanistic-empirical design procedure using the
measured characteristics (moduli) of the Mn/ROAD materials along with traffic measured on the
mainline and low volume sections. Calculated and measured tensile strains in the asphalt layer
and compressive strains on the subgrade have been correlated with the development of load
cracking and rut depth for the specific test section thicknesses at Mn/ROAD. Traffic is measured
in terms of ESAL and load spectra. Load spectra are the distribution of axle weights (8).
The factors that are used for flexible pavement thickness design are:
1. Soil characteristics
2. Traffic
3. Pavement layer characteristics
a. Material stiffnesses (moduli)
b. Thicknesses
4. Drainage characteristics
31

5. Reliability
Each of these factors is discussed and procedures are presented showing how the factors, as
presented in the soil factor design, can be translated to values to be used in the mechanistic-
empirical design analysis. The factors are then used along with the soil factor design thicknesses
to determine if the soil factor procedure appears conservative or not. A similar comparison is
made using designs from the R-Value design procedure.
SOIL CHARACTERISTICS
In this section correlations are presented to convert the soil factors to resilient moduli. The
steps used are:
1. Convert soil factor (classes) to AASHTO soil classification
2. Convert AASHTO classification to R-Values measured in Minnesota
3. Convert R-Value to resilient modulus
4. A discussion is then presented on how resilient moduli can be estimated (calculated) from
FWD or RoadRater results.
1. Soil Factor to AASHTO Soil Class
The table in the lower right hand corer of the soil factor design table (Figure 1)
relates soil factor to AASHTO soil class and R-Value. Table 1 shows the correlation in a
different way; the AASHTO classes represented by given soil factors are listed.
Table 1. AASHTO Classifications Representing Various Soil Factors
Soil Factor AASHTO Classification(s)
50 A-l-b, A-2-4, A-3
75 A-l-b, A-2-4
100 A-4, A-6
120 A-7-5
130 A-7-6
130+ A-5
32

An A-5 soil has a soil factor of 130+. This is a relatively soft, hard-to-compact material.
It is defined as a diatamaceous material (mostly originating from sea shells). This
material occurs only very rarely in Minnesota.
2. The Minnesota DOT Design (2) and the State Aid Manuals (1) show various correlations
between AASHTO Soil Class and R-Value. These correlations have been obtained from
work done by Wolfe (6) in 1960 and R-Values measured on soils of the various
classifications in the Mn/DOT laboratory over the years. Mn/DOT has used an exudation
pressure of 1655 kPa (240 psi) to establish a design R-Value. Table 2 shows this general
correlation.
Table 2. Relationship between AASHTO Soil Classification and Stabilometer R-Value*
AASHTO Class Range of R-Values
A-1-a, b 70-75*
A-2-4 30 - 60
A-3 70
A-4 20(10-75)
A-6 12(8-20)
A-7-5 12(6-18)
A-7-6 10(6-18)
* If 15-20% passes the 0.075-mm (No. 200) sieve, the R-Value could be as low as 25
3. Prediction of Resilient Modulus (MR) from Stabilometer R-Value
The AASHTO Guide for Design of Pavement Structures (7) presents a number
equations for predicting resilient modulus (MR) from design R-Value. The following
equations are suggested for fine-grained and granular soils, respectively. An R-Value of
33

20 generally differentiates between a granular and fine-grained soil.
Fine-grained soils, R < 20
MR = 1000 + 555 (R-Value) (2)
Granular Soils, R > 20
e 69 kPa (10 psi)
MR = 1000 + 250 (R-Value) (3)
e 138 kPa (20 psi)
MR = 1000 + 350 (R-Value) (4)
Where: R-Value = stabilometer R-Value @ 1655 kPa (240 psi) exudation pressure.
MR = Resilient modulus, psi
e = Confining stress in granular material = a + 2 a h, kPa (psi)
Equation (4) should be used for base courses closer to the surface and Equation (3) for
materials farther down in the pavement section (subbases and subgrades).
The relationships listed in Tables 1 and 2, along with Equations 2, 3 and 4 are used to
calculate the range of resilient moduli represented for the various AASHTO soil classifications.
The resulting correlations are listed in Table 3.
34

Table 3. Resilient Modulus Predicted from R-Value Ranges Determined for AASHTO Soil
Classifications and Stress Conditions for Granular Soils
AASHTO Soil ConfiningClassification Stress, kPa (psi)
A-1
A-2
A-3
69(10)
138 (20)
69(10)
138 (20)
69(10)
138(20)
A-4
A-5
A-6
A-7-5
A-7-6
R-Value
70
75
70
75
30
60
30
60
70
70
20
10
12 (8-20)
10(6-18)
8(6- 18)
Calculated ResilientModulus, MPa (psi)
53
45
38
128 (18,500)
138 (19,750)
176 (25,500)
189 (27,250)
59 (8,500)
111 (16,000)
80(11,500)
152 (22,000)
128 (18,500)
176 (25,500)
84 (12,100)
45 (6,550)
[38-84] (7,660 [5440-12,100])
[30-76] (6,550 [4330-10,990])
[30-76] (5,440 [4330-10,990])
The listings shown in Table 1 and Table 3 have been used to establish a range
of resilient moduli (MR) implied for the soil factors. The ranges are given for confining
stresses (e) of 69 and 138 kPa (10 and 20 psi) for granular soils.
35

Table 4. Resilient Moduli Ranges Based on Soil Factor
Confining Resilient Modulus Based on asssumedSoil Factor Stress, kPa (psi) Range, Mpa (psi) R-Value
50 138 (20) 80-189 (11,500 - 27,250) 176 (25,500)
69 (10) 59-137 ( 8,500- 19,750) 128 (18,500)
75 138(20) 80-189 (11,500-27,250)
69 (10) 59-137 ( 8,500 - 19,750)
100 - 37-84 ( 5,400 -12,100) 53( 7,660)
120 - 30-76 ( 4,330- 10,990) 53( 7,660)
130 - 30-76 ( 4,330 -10,990) 45 ( 6,550)
Table 4 is a summary of the relationships shown in Tables 1 and 3. The confining stress of
69 kPa (10 psi) for granular materials is for granular materials at the subbase and subgrade level
and 138 kPa (20 psi) confining stress values can be used for granular materials when used as base
courses. The moduli values will be used as input for the mechanistic simulations of the design
thicknesses recommended in the Soil Factor Pavement Design Procedure.
THE TRAFFIC FACTOR
The traffic on a road is composed of applications of axle loads of various weights and
configurations. The weights range from less than 8.9 kN (2000 lb) on a single axle to over
222 kN (50,000 lb) on multiple axles. To determine the load effect on a pavement during a
particular design period, it is necessary to obtain an estimate of the weight distribution of various
axle configurations over the design period.
One method of estimating the traffic effect is to use the Average Daily Traffic (ADT) and/or
the number of daily heavy trucks (HCADT) expected. The two-way ADT and HCADT are the
traffic factors used for the current Soil Factor Flexible Pavement Design procedure.
36

To determine the design lane traffic for a two-lane road, the total ADT is divided by two
unless some other factors are known. For four or greater numbers of lanes, the traffic must be
proportioned by lane.
The calculations of ESAL requires that the total traffic in the design lane be estimated. Most
ADT values are two-way. The second factor required to calculate ESAL is vehicle type distribu-
tion. Vehicles are classified using ten vehicle types. Figure 27 shows the ten types used in Min-
nesota. Types 1-10 represent the ADT in the design lane and Types 4-10 represent the HCADT
in the design lane. The HCADT includes all six - or more - tired vehicles. In the Mn/DOT Road
Design Manual, typical distributions are given for (1) rural, (2) metro and (3) local roads.
The ESAL effect of each vehicle type has also been determined using weight data
accumulated by Mn/DOT over a period of time. The Soil Factor design uses ADT (Average
Daily Traffic) for traffic evaluation for the lowest two categories and HCADT (Heavy
Commercial Average Daily Traffic) for the other five. The ESAL factors representing each type
of roadway are obtained by multiplying the % ADT times the factor. These are then added to
calculate the average ESAL effect per 100 ADT.
The calculations show: 1. 10.5% HCADT for rural roads
5.9% HCADT for metro roads
5.9% HCADT for local roads
2. The ESAL per 100 ADT are:
5.178 for rural roads
2.63 for metro roads
1.98 for local roads
With these factors 20-year design ESAL are calculated for the traffic factors used in the Soil
Factor design. Calculations were made assuming 0% and 4% growth. The results of these
calculations are listed in Table 5.
37

Illustrated Example Vehicle Description
LI~F
Passenger Cars
Panel and Pickups(Under 1 ton)
Single Unit -2 axle, 4-tire
Single Unit -2 axle, 6-tire
Single Unit - 3 axleand 4 axle
Tractor semitrailerCombination - 3 axle
Tractor SemitrailerCombination - 4 axle
Tractor SemitrailerCombination - 5 axle
Tractor SemitrailerCombination - 6 axle
Trucks with Trailersand buses
Figure 27. Minnesota vehicle types.
38
VenicleType
Number
9
10
=LMfI I
I i k~
~OA

Table 5. Estimated ESAL for Traffic Levels Defined in the Soil Factor Design Table
20-Year Design Lane ESALTraffic Category * 0 % Growth 4% Growth
< 400 ADT 22,420 33,400
1000 ADT 78,200 119,400
150 HCADT
Rural 270,000 402,100
Metro 244,100 363,400
Local 183,400 273,100
300 HCADT
Rural 540,000 804,000
Metro 488,100 726,800
Local 366,800 546,100
600 HCADT
Rural 1,080,000 1,610,000
Metro 976,200 1,453,600
Local 733,500 1,090,000
1100 HCADT
Rural 1,980,000 2,950,000
Metro 1,789,700 2,664,800
Local 1,350,000 2,000,000
* The ADT and HCADT are two-way values. To obtain the design lane ESAL
the calculated values are divided by two.
39

The highest category of loading is greater than 1100 HCADT. The predicted ESAL can be in
excess of 3 million for that traffic category.
Calculation of ESAL
The traffic factor in terms of ESAL requires a determination, calculation and/or estimate of:
1. the total traffic in the design lane
2. the distribution of vehicle types
3. the weight distribution of axles for each vehicle type
4. the annual percent increase in traffic for that roadway
i. The total traffic is available for all roads in Minnesota on traffic maps. For two-
lane roads the design lane ADT is the total ADT + 2. For four lane roads the
design lane ADT is usually calculated by multiplying the two-way ADT by 0.45
which assumes 90% of the ESAL are in the driving lane.
The traffic flow maps are partially updated annually. For design purposes it may
be appropriate to do a traffic study for that particular or a similar roadway.
ii. Ten vehicle types are used to define the vehicle type distribution in Minnesota.
Figure 27 illustrates the vehicle types. Studies have been made over the past 25
years to estimate the vehicle type distribution on various classes of roadways.
Typical distributions are listed in the Mn/DOT Design and Geotechnical Manuals.
40

PAVEMENT LIFE PREDICTIONS
In this section, life predictions for the thickness designs resulting from the Soil Factor (1) and
R-Value (2) designs which are currently used for pavement design in Minnesota are made using
the mechanistic-empirical procedure developed at the University of Minnesota (8). This software
(ROADENT) predicts pavement life using strain levels for pavement cracking or fatigue and
permanent deformation or rutting. Fatigue is predicted using the tensile strain in the bottom of
the asphalt surface layer and progression of rutting is predicted based on the compressive strain
at the top of the subgrade.
The strains are dependent on:
1. Weight and configuration of axle loads
2. The stiffness (modulus) of the soil
3. The stiffness of the various pavement layers
4. The thickness of the pavement layers.
The algorithms used to predict life are based on relationships developed from the performance of
sections at Mn/ROAD.
For this study, lives are predicted using six sets of runs of ROADENT. The first three are
based on thicknesses from the Soil Factor Design, and the second three the R-Value Design. The
purpose of the comparisons is to establish how the current designs relate to the mechanistic-
empirical predictions.
Loading
Four of the seven traffic categories used for the Soil Factor Design have been converted to
ESAL using typical vehicle type and weight distributions published in the current Mn/DOT
Manuals (1) and (2) in the traffic section. Ranges of ESAL were found using typical rural, metro
and local distributions with 0% and 4% growth over 20 years. The lowest ESAL predictions at a
given ADT or HCADT level are for local roads at 0% growth and the highest is for rural roads at
4% growth. A listing of the ESAL for the traffic categories is shown in Table 5.
Soil Strength
Soil strength is based on the moduli predicted from the Soil Factor and R-Value relationships
41

presented above. Table 6 is a listing of the moduli used to represent three levels of soil stiffness
(modulus) for the mechanistic-empirical design with ROADENT.
Table 6. Soil Moduli used for ROADENT Life Predictions
SummerRange
Soil Resilient Moduli, MPa (psi)Fall Winter
Default
- 59-137 (8,500-19,750)
- 37-84 (5,400-12,100)
- 30-76 (4,330-10,990)
- 70
20
10
128 (18,500) 173 (25,000) 277 (40,000)
53( 7,660) 104 (15,000) 277 (40,000)
45 ( 6,550) 83 (12,000) 277 (40,000)
138 (20,000)
55 ( 8,000)
45 ( 6,550)
173 (25,000) 277 (40,000)
104 (15,000) 277 (40,000)
83 (12,000) 277 (40,000)
173 (25,000)
104 (15,000)
83 (12,000)
173 (25,000)
104 (15,000)
83 (12,000)
The resilient moduli estimated from the Soil Factors were considered to be summer values. The
moduli listed for fall, winter and spring are based on ratios of moduli obtained from MnROAD
throughout the year. The summer moduli are assumed for 26 weeks, Fall - 8 weeks, Winter - 12 weeks,
and Spring - 6 weeks. These are typical time periods found from the four years of Mn/ROAD data.
42
Run SoilNo.Factor
R-Value
50
100
130
Spring

Stiffness of the Pavement Layers
The stiffness (resilient modulus) of the pavement layers also varies throughout the year. Table 7.
lists the seasonal moduli for the surface, base and subbase layers for the six simulations.
Table 7. Seasonal Pavement Layer Moduli
Pavement Layer Resilient Moduli, MPa (psi)
Poisson'sSummer Fall Winter Spring Ratio
Weeks 26 8 12 6 52
Layer:
* 1. (Asphalt Concrete) 2,010 (290,472) 6,832 (987,278) 10,480 (1,513,888) 6,832 (987,278) 0.35
* 2. (Granular Base) 173 (25,000) 208 (30,000) 277 (40,000) 104 (15,000) 0.40
**3. (Granular Subbase) 118 (17,000) 173 (25,000) 277(40,000) 90 (13,000) 0.40
* Same for all six sets of runs
** Used only for runs 5 and 6
For the runs with the stiff subgrade (1 and 4), the moduli of the subgrade were actually slightly
higher than the subbase during the spring. This can occur when the melt water in the subbase is trapped
before the subgrade (layer 4) thaws.
Thickness of Pavement Layers
The thickness of the pavement layers has been determined from the two design procedures as listed
in Figure 1 for the Soil Factor Design and Figure 2 for the R-Value design respectively. Design
thicknesses have been determined using first the Soil Factor Table. Four of the seven traffic categories
have been used:
43

Category
< 400 ADT Low
< 150 HCADT Medium
300-600 HCADT Medium - High
> 1100 HCADT High
Depending on the vehicle type weight distributions and growth, the predicted ESAL will vary
as shown in Table 5. The Soil Factor design thickness will be the same for each of calculated ESAL
values within the given traffic category.
Design thicknesses were established for soil factors of 50, 100 and 130. The thicknesses of
asphalt surface and granular base are listed in Tables 9, 10 and 11 for the Soil Factors of 50, 100 and
130, respectively. Two different combinations of thicknesses are shown: 1) using the minimum
bituminous G.E. with a hot mix asphalt G.E. Factor of 2.0 and 2) the remainder of the G.E. is made up
of aggregate with a G.E. Factor of 1.0 (class 5 or 6 material). The alternate designs use a nominal plant
mix surface of 150 mm (6 in.) with the remainder of the required G.E. thickness made up of granular
base.
Similar designs were made using the R-Value design chart. Two designs for each set of conditions
were again made [1. with minimum surface thicknesses and 2. with a nominal 150-mm (6-in.) Hot Mix
Asphalt surface.] Tables 12, 13 and 14 list the resulting pavement section thicknesses.
A set of runs was then made with the mechanistic-empirical design procedure (ROADENT)
to predict if the fatigue and/or rutting life of these pavement sections would be used up. For each
of the strengths of soil and pavement materials and thicknesses, a life factor is calculated based
on the particular conditions. A factor (ratio) less than 1.0 indicates that the pavement would not
fail at the respective ESAL value; whereas, a ratio greater than 1.0 indicates that failure in that
mode is predicted at that level of ESAL.
Six sets of ROADENT runs were made to represent the various levels of traffic and soil
strength with predicted thicknesses as indicated above. Each run has a set of designs with minimum
asphalt surface thicknesses and with 150 mm (6-in.) thickness of surface.
44

Table 8. Summary of Embankment Stiffness
Used for Mechanistic Design Simulations
Runs Procedure
1A
1B
2A
2B
3A
3B
4A
4B
5A
5B
6A
6B
Soil Factor
S.F.Soil Strength
R-Value
50
50
100
100
130
130
R-ValueIt
70
70
20
20
10
10
MR, MPa (psi)
128 (18,500)
128 (18,500)
53 (7.660)
53 (7,660)
45 (6,550)
45 (6,550)
138 (20,000)
138 (20,000)
55 (8,000)
55 (8,000)
45 (6.550)
45 (6,550)
The soil factor, R-Value and mechanistic design procedures are compared using the life factors
calculated from ROADENT. A value less than 1.0 indicates that less thickness would be appropriate for
that traffic. A factor greater than 1.0 indicates that the life would be used up and therefore a greater
thickness is needed for the traffic level. The resulting damage factors are listed in Tables 9 through 14.
Table 9 is for a Soil Factor of 50, TablelO a Soil Factor of 100 and Table 11 a Soil Factor of 130. Table
12 is an R-Value of 70, Table 13 an R-Value of 20 and Table 14 an R-Value of 10.
45

Table 9. Soil Factor Method vs. Roadent - Run 1: SF = 50, Resilient Modulus = 128 MPa (18,500 psi).
Low Traffic(<400 ADT)
Soil Factor Method ROADENT DamageESALs AC, mm GB, mm Fatigue Rutting22,420 38 105 0.22 2.3333,385 38 " 105 0.32 3.4722,420 90 -- 0.09 0.65
S 33,385 I 90 ! -- 0.14 L 0.97 |
Medium Traffic 183,380 88 80 0.61 1.98(<150 HCADT) 402,050 88 80 1.34 4.34
183,380 128 -- 0.26 1.17402,050 128 - 0.57 2.58
Medium Traffic 735,000 88 225 2.12 1.31(300-600 HCADT) 1,610,000 88 225 4.65 2.87
735,000 150 150 0.44 0.481,610,000 150 150 0.97 1.05
High Traffic 1,350,000 100 310 2.73 0.8(>1100 HCADT) 2,950,000 100 310 5.97 1.76
1,350,000 150 210 0.78 0.562,950,000 150 210 1.7 1.22
ROADENT, Optimized ROADENT DamageAC, mm GB, mm Fatigue Rutting
30 160 0.19 0.9930 180 0.29 0.9282 -- 0.12 0.9390 - 0.14 0.97
67 180 0.95 0.9895 165 1 0.98128 20 0.24 1128 76 0.46 1
120 160 0.94 0.96150 160 0.96 0.98150 70 0.49 0.98150 160 0.96 0.98
142 170 0.97 0.93175 160 0.97 0.99150 140 0.92 0.94150 NOT POSSIBLE
Table 10. Soil Factor Method vs. Roadent - Run 2: SF = 100, Resilient Modulus = 53 MPa (7,660 psi).
Soil Factor Method ROADENT DamageESALs AC, mm GB, mm Fatigue Rutting22420 38 215 0.33 2.633385 38 215 0.49 3.8822420 150 - 0.05 0.2633385 150 - 0.07 0.4
ROADENT, OptimizedAC, mm GB, mm
30 28034 305
115--130
ROADENT DamageFatigue Rutting
0.3 0.940.46 0.960.13 0.990.12 0.82
Medium Traffic 183380 80 265 1.02 2.76(<150 HCADT) 402050 80 265 2.23 6.06
183380 150 110 0.23 1.27402050 150 110 0.5 2.79
Medium Traffic 735000 80 450 3.63 1.66(300-600 HCADT) 1610000 80 450 7.95 3.65
735000 150 295 0.64 1.271610000 150 295 1.4 2.77
High Traffic 1350000 91 615 4.73 0.55(>1100 HCADT) 2950000 91 615 10.34 1.21
1350000 150 485 1.03 0.512950000 150 485 2.24 1.11
82 360 0.89 0.98110 370 0.9 0.97150 150 0.2 0.99150 250 0.37 1
130 I 390 0.97 i 0.92S162 I 400 0.96 0.9
150 330 0.62 | 0.95150 NOT POSSIBLE
155 I 390 0.96 0.96190 400 0.95 0.92150 550 1 0.31
I 150 I NOT PORRIRI F
46
Low Traffic(<400 ADT)
- -- --m-
r\-

Table 11. Soil Factor Method vs. Roadent - Run 3: SF = 130, Resilient Modulus = 45 MPa (6,550 psi).
Low Traffic(<400 ADT)
Soil Factor Method ROADENT Damage ROADENT, Optimized ROADENT DamageESALs AC, mm GB, mm Fatiue Rutting AC, mm GB, mm Fatigue Rutting22,420 38 275 0.19 0.82 30 280 0.18 0.9133,385 38 275 0.29 1.22 30 305 0.27 0.9822,420 150 50 0.04 0.33 150 NOT POSSIBLE33,385 150 50 0.05 0.49 150 NOT POSSIBLE
Medium Traffic 183,380 88 375 0.53 0.72 68 385 0.88 1(<150 HCADT) 402,050 88 375 1.16 1.57 95 410 0.95 0.94
183,380 150 250 0.14 0.53 150 180 0.16 0.98402,050 150 250 0.3 1.17 .150 270 0.29 0.98
Medium Traffic 735,000 88 585 1.98 0.38 120(300-600 HCADT) 1,610,000 88 . 585 4.34 0.83 150
735,000 150 460 0.43 0.35 1501.610.000 150 460 0.94 0.76 150
420 0.91 0.91430 0.96 0.98340 0.48 0.97430 0.96 0.98
High Traffic 1,350,000 100 795 2.59 0.11 141 440 0.99 0.91(>1100 HCADT) 2,950,000 100 795 5.66 0.24 180 440 0.9 0.92
1,350,000 150 695 0.72 0.11 150 410 0.82 0.972,950,000 150 695 1.58 0.24 150 NOT POSSIBLE
Table 12. R-Value Method vs. Roadent - Run 4: R = 70, Resilient Modulus = 138 MPa (19, 750 psi).
Low Traffic(<400 ADT)
Medium Traffic(<150 HCADT)
Medium Traffic(300-600 HCADT)
High Traffic(>1100 HCADT)
ESALs22420333852242033385
R-Value MethodAC, mm
8989
127127
GB, mm7676
_..
ROADENT Damage
Fatigue0.070.1
0.030.04
Rutting0.20.3
0.130.19
183380 89 76 0.56 1.66402050 89 140 1.16 1.37183380 152 -- 0.12 0.45402050 152 -- 0.27 0.98
735000 114 254 1.01 0.421l000iUU 140 152 1.2 1.1735000 152 102 0.42 0.51
1610000 152 127 0.89 0.95
1350000 140 152 1.01 0.922950000 165 152 1.19 1.081350000 152 102 0.77 0.952950000 152 152 1.61 1.47
47
-1 r 1 r --
t- . . I I I
I

Table 13. R-Value Method vs. Roadent - Run 5: R = 20, Resilient Modulus = 55 MPa (8,000 psi).
Low Traffic(<400 ADT)
ESALs22,42033,38522,42033,385
Soil Factor Method
AC, mm8989
152152
GB, mm102102--
--
SB, mm--------
Medium Traffic(<150 HCADT)
1 183,380 89 76 191 0.7 1 0.96402,050 89 140 292 1.25 0.8183,380 152 102 -- 0.18 1.1402,050 152 229 - 0.28 0.91
Medium Traffic 735,000(300-600 HCADT) 1,610,000
High Traffic 1,350,000(>1100 HCADT) 1 2950,000
114 I 152140 1 152
140 I 152165 152
S 330 I 1.16 0.53I 406 1 1.32 1 0.39
I 381 I 1.12 I 0.39I 432 1 1.33 1 0.37
Table 14. R-Value Method vs. Roadent - Run 6: R = 10, Resilient Modulus = 45 MPa (6,550 psi).
Low Traffic(<400 ADT)
Medium Traffic(<150 HCADT)
Medium Traffic(300-600 HCADT)
High Traffic(>1100 HCADT)
ESALs AC, mm8989152152
GB, mm279279178178
KUADtN
Fatigue0.070.1
0.020.03
0.240.360.120.17
Soil Factor MethodSB, mm
22420333852242033385
183380 89 152 432 0.54 0.14402050 89 229 406 1.11 0.19183380 152 330 -- 0.11 0.23402050 152 394 -- 0.23 0.32
735000 114 152 546 1.12 0.151610000 140 152 635 1.28 0.12
1350000 140 152 610 1.08 0.12.. ..^^ I j o -
29U0uuuu 165_ 152 686 1.28 0.11
48
ROADENFatigue
0.110.170.040.06
r DamageRutting
1.271.9
0.230.34
W% S.LT
1 -i i i i
1 1 1 ~1
I _ ° r-I
t
SoilFtr act--or Metho
M 0 r A M &11 9% - -i Damage
Ruttinn

Another way of stating the comparison between the mechanistic design and the Soil Factor or
R-value procedure is: For a damage factor less than 1.0 the Soil Factor or R-Value design procedure
would result in a greater thickness than ROADENT whereas a factor greater than 1.0 indicates a lesser
thickness and a less conservative design.
A damage factor between 0.8 and 1.0 is defined as a level at which the design procedures are
equivalent.
Figures 28 through 30 illustrate the comparisons between the Soil Factor Design and the mechanistic
design. Figure 28 is for a soil factor of 50, Figure 29, 100 and Figure 30, 130. For the fatigue predictions
the soil factor designs are thicker, whereas at the high traffic levels the thicknesses are less. For the 150-
mm (6-in.) surface, the Soil Factor Design results in a thicker design at the higher traffic level. The
rutting analysis does not show consistent trends with embankment stiffness.
Figures 31, 32 and 33 show similar comparisons with the R-Value design for similar embankment
strengths as the Soil Factor Design. The fatigue analysis, again, shows consistent trends from thicker
to thinner designs for the R-value procedure as the traffic increases. For the high R-value design the
rut depth analyses are not consistent with the minimum surface thicknesses, but do follow the fatigue
analysis.
Figure 32 shows that the R-Value = 20 design is thicker up to the medium traffic level based on the
fatigue analysis, whereas the rutting analysis generally indicates the reverse.
Figure 33 shows that the R-Value = 10 design is consistent with the others with crossover to a
thinner design at a higher traffic level. All of the R-Value designs are thicker than the ROADENT
design based on the rut depth analysis.
The comparisons shown in Figures 28 through 33 are generally consistent for the fatigue analyses
using ROADENT, but are not using the rutting analyses. More work needs to be done with the
comparison because:
1. The comparisons show that one design is thicker, thinner or the same, but the thickness levels
to achieve life predictions have not been determined.
2. Reliability has not been included in the current version of ROADENT. Reliability is now being
incorporated into an updated version of ROADENT and should be available in 1999.
3. The thicknesses resulting from these design procedures need to be compared with field
49

performance. This can be accomplished using information from cities and counties which have
Pavement Management Systems or have good records on the construction, maintenance and
performance of specific road sections.
50

1.E+06 1.E-
(a)'U,
)I0u
Traffic, ESAL
(a). Run 1A - SF = 50.
1.E+05 1.E+06
I-o '1 B-Fatigue
-m l1B-Rutting
1.E+07
Traffic, ESAL
(b) Run IB - SF = 50.
Figure 28. Comparison of Minnesota LVR Designs with Roadent (SF = 50) (1 = Thicker, 0 = SameThickness, -1 = Thinner).
51
\ /
\--*- -
1.00
0.00
-1.00
1.E+04
i- *1A-Fatigue
S-07 "- 1A-Rutting
+071.E+05
11 UU
C)
S0.0010
a -1.00
1.E+04
1 ^N ̂

U,U)
CI0,
(U
1.E+05 1.E+06 1.E+07
Traffic, ESAL
(a). Run 2A- SF = 100.
1.E+05 1.E+06
I '2B-Fatigue
mm2 2B-Rutting 1
1.E+07
Traffic, ESAL
(b) Run 2B - SF = 100.
Figure 29. Comparison of Minnesota LVR Designs with Roadent (SF = 100) (1 = Thicker, 0 = SameThickness, -1 = Thinner).
52
1.00
0.00
-1.00
m,; * 2A-Fatigue
i A-d2A-Rutting
1.E+04
U)U)0C
I-
0o
1.00
0.00
-1.001.E+04

1.E+05 1.E+06
1.00
0.00
-1.001.E+07
Traffic, ESAL
(a). Run 3A- SF = 130.
1.00
0.00
-1.00
1.E+04 1.E+05 1.E+06
I - '3B-Fatigue
I . 3B-Rutting
1.E+07
Traffic, ESAL
(b) Run 3B- SF = 130.
Figure 30. Comparison of Minnesota LVR Designs with Roadent (SF = 130) (1 = Thicker, 0 = SameThickness, -1 = Thinner).
53
m)
I-
o)
§~
- *3A-Fatigue
=i NE 3A-Rutting
1.E+04
0
CO
I--
m
. orý

1.E+05 1.E+06
1.00
0.00
-1.00
1.E+07
Traffic, ESAL
(a). Run 4A- R = 70.
1.00
0.00
-1.00
1.E+04 1.E+05 1.E+06
i- '4B-Fatigue
S= 4B-Rutting
1.E+07
Traffic, ESAL
(b) Run 4B - R = 70.
Figure 31. Comparison of Minnesota LVR Designs with Roadent (R = 70) (1 = Thicker, 0 = SameThickness, -1 = Thinner).
54
0n0)
-c
I-g0)
0L
I - '4A-Fatigue
4A-Rutting
1.E+04
0)0)0,
C.,mc
)I0)
U.-
Cu0L

1.E+05 1.E+06
S1.00
S- 0.00
) -
' -1.001.E+07
Traffic, ESAL
(a). Run 5A- R = 20.
1.E+04 1.E+05 1.E+06
- * 'SB-Fatigue
0 -4 5B-Rutting
1.E+07
Traffic, ESAL
(b) Run 5B - R = 20.
Figure 32. Comparison of Minnesota LVR Designs with Roadent (R = 20) (1 = Thicker, 0 = SameThickness, -1 = Thinner).
55
am '*5A-Fatigue
S 5A-Rutting
1.E+04
1.00a)
. 0.00
a -1.00
A AA

„ 1.00
i- 0.00im
1.EI.E+04 1.E+05 1.E+06 1.E-
Traffic, ESAL
(a). Run 6A - R = 10.
1.00
0.00 \
-1.00 *
1.E+04 1.E+05 1.E+06
S'6B-FatigueI - G6B-Rutting
1.E+07
Traffic, ESAL
(b) Run 6B- R = 10.
Figure 33. Comparison of Minnesota LVR Designs with Roadent (R = 10) (1 = Thicker, 0 = SameThickness, -1 = Thinner).
56
(I)0$
I-
a)apf
1- *6A-Fatigue
I 6A-Rutting
+07

CHAPTER 5
SUMMARY, CONCLUSIONS and
RECOMMENDATIONS
This report has summarized the two flexible pavement thickness design procedures used
in Minnesota, the Soil Factor and R-Value procedures. The Soil Factor procedure is found in the
Mn/DOT State Aid Manual (1) and the R-Value procedure is in the Mn/DOT Design (2) and
Geotechnical Manuals (3).
The current procedures used by cities and counties for design, specifications, construction
and managing of pavements were determined by sending a questionnaire to all 87 counties and
120 cities. A summary of the replies shown in Chapter 3 indicates that there are a wide variety of
practices used, especially for construction specifications and management procedures. The
results show the need for some uniformity.
The survey results indicate that most counties are using the Soil Factor thickness design
procedure and a majority of the cities use the R-Value procedure. Both of these procedures are
over 25 years old. In Chapter 4 these procedures were evaluated by calculating expected lives
based on the mechanistic-empirical procedure (ROADENT) developed at the University. This
program uses the elastic layered system to calculate strains in a simulated pavement and relates
these to the development of fatigue cracking and rutting. The relationship between strains and
performance are based on observations at Mn/ROAD.
The comparisons are made by:
1. Converting Soil Factors and R-Values to soil moduli
2. Using backcalculated moduli for base and surface materials from Mn/ROAD, falling
weight deflectometer backcalculations (including season variations)
3. Converting ADT and HCADT categories used for the soil factor design to ESAL
using typical Minnesota vehicle type and weight distributions
4. Calculating expected lives based on ROADENT for thicknesses resulting from the
two procedures
57

The comparisons show:
Soil Factor procedure:
1. The fatigue analyses relative to the mechanistic-empirical design, the soil factor
design thicknesses are adequate up to medium traffic with minimum surface and base
thicknesses, and are adequate to about 1,500,000 ESAL using a 150-mm (6-in.)
asphalt mix thickness for the three soil types checked
2. The rut depth analyses show the soil factor design thicknesses are generally not
adequate for high and medium strength soils, but are adequate for the lower strength
soils.
R-Value procedure:
1. For the fatigue analyses the thicknesses are adequate at low traffic levels but not
adequate for high traffic
2. The rut depth analyses do not show a consistent pattern except for the low strength
soils the thicknesses are adequate at all levels of traffic.
These analyses are based on the determination of life predictions. The time and scope of
this project did not make it possible to establish thicknesses required to achieve adequate life
predictions.
Recommendations:
Based on the results of the survey and analyses using the mechanistic-empirical
the following recommendations are made:
1. Continue the life predictions using the mechanistic-empirical design procedure
ROADENT
a. An updated version will now include reliability
b. Thicknesses should be established for various levels of reliability; the reliability is
based on variations in material properties and thicknesses measured at Mn/ROAD
c. Reliability of "typical" local road construction should be evaluated so that
appropriate levels can be used for city and county road performance evaluation
d. The model should be calibrated for city and county roads; this can be
58

accomplished using reasonable data which are available for construction, traffic
and performance. These evaluations should be for relatively urban and rural
conditions.
e. Compare reliability levels for city and county construction with Mn/DOT.
2. Develop a best practices manual for local agencies in Minnesota. The results of the
survey show a wide variety of designs and specifications are currently used. An
evaluation of the current practices needs to be made in light of thickness reductions
indicated for higher levels of reliability. The manual should include:
a. Thickness design
b. Soils evaluation
c. Traffic
d. Construction specifications and standard procedures
e. Management practices for pavement:
> Evaluation
> Maintenance
> Rehabilitation
Good documentation of design, construction and management of pavements will also
make it possible to calibrate the performance models used to predict performance with the
mechanistic-empirical design analyses.
59

60

REFERENCES
(1) Mn/DOT State Aid Manual
(2) Mn/DOT Design Manual
(3) Mn/DOT Geotechnical Manual
(4) Mn/DOT Standard Specifications for Construction, 1995 Edition
(5) Duane Young, Mn/DOT Memo to Julie Skallman, "Low Volume Road
Flexible Pavement Design, April 18, 1988
(6) R.E. Wolfe, "Resistance R-Value of Embankment Soils and Aggregate
for Use as Bases and Subbase, Inv. 176, State of Minnesota Department
of Highways, 1960
(7) Guide for Design of Pavement Structures, AASHTO, 1993
(8) Newcomb and Timm, Development of ROADENT
61


APPENDIX A
TABULATION OF
64 COUNTY AND 50 CITY
QUESTIONNAIRE RESPONSES


APPENDIX A
TABULATION OF 64 COUNTY AND 50 CITY QUESTIONNAIRE RESPONSES
Date: NtS + 1c Agency: -- ^ 1+4i-=-± ;R
Respondent: 4c- C,+LXV-'iLs
Address:
Survey of Local Pavement Design Practice
The Local Road Research Board is sponsoring a study to review and refine the practice of designing andconstructing pavements at the local government level. The investigators for this project devised thisquestionnaire to gain insight into local practice. The topics covered here include design, specifications,construction and performance. Please respond according to your normal practice. If you have additionalinformation to provide, please provide written comments. Thank you.
Design
1. What is your current design procedure?14t- 3:,
a. Soil Factor b. R-value c. Other L*+± (2.(0-ý, +Vf-101F t -)^ -Fov Ic -K+o^ 4.1J. f
2. What are the primary types of soils in your jurisdiction?I 1 S 1 1 10 4
a. A-3 b. A-4 c. A-5 d. A-6 e. A-7-5 f. A-7-6 &t l
3. How do you determine the soil input values for design?
a. Testing b. Soil Classification c. USDA Mapd. Past History e. Other R- VAlL..-k
.:ý Fvob - I N4. Do you normally design for a compaction subcut?
a. Yes b. No
If yes, how deep is a normal subcut? 1 ft. 1-2.4-Z p-+ +.Sf" --F-
I ML 3 4+5. What type of traffic input do you use for design?
a. HCADT b. ESAL c. Maximum Load (5-ton, 7-ton, etc.)d. ADT e. Other gEsA t'L 4 r4 o4 -I i
40 44 CA T ,, " ,' I6. How do you determine the traffic input for design?
a. ADT Count by Your Agency b. Classification Count by Your Agencyc. Provided by Mn/DOT d. Roadway Classification
7. What types of drainage features do you commonly incorporate?
GI 3 s Ia. Ditches b. Edge Drains c. Drainage Layer d. Other + 1 ^ __
Cxlv r-4 Is^4oi-»^ 5^><^s~- J
A-1

Specifications
1. What material specifications do you use for asphalt concrete?-x4 3-s 1I . I
a. 2331 b. 2340 c. 2350 d. Other .3 t Q
2. Do you allow the use of RAP in your asphalt mixtures?5o 13 lCv"^Ji v3
a. Yes b. Nor n .5"
3. What material specifications do you use for granular base and subbase?
a. Class 3 b. Class 4 c. Class 5 d. Class 6 e. Other cl.ss 2. A -,. r` c
4. What type of embankment specifications do you use?S'z' L ;3 a
a. Ordinary Compaction b. Specified Density c. Test Rolling .41+.
If you use Specified Density, do you use (choose one) 95% or 100% of:-7
a. Standard Proctor b. Modified Proctor
If you use iest Rolling, what specification or device is used? M ~ T- 2 I ( - I1
Construction
In this section, quality control will refer to the activities of the contractor to ensure that the product isconsistent and meets the minimum requirements of the agency. Quality Assurance refers to the activitiesof the agency to ensure that minimum quality standards are being met by the contractor.
1. What types of tests are performed on soils during construction?S 7 3 .0
a. In-Situ Density b. Moisture Content c. Classification/Gradation h one..
If in-situ density is measured, what method is used?
a. Sand Cone b. Nuclear
2. Who performs testing on soils during construction?4- 3^ G
a. Contractor b. Agency c. Consultant
3. What is the maximum lift thickness for aggregate base? in.
S a % r o 3 I1 - i L 1
A-2

4. What types of tests are performed on granular bases during construction?9 1o s 4- 33 1
a. In-Situ Density b. Moisture Content c. Classification/Gradation O V-A- (0 riO ,-
If in-situ density is measured, what method is used?-- 7 1 I
a. Sand Cone b. Nuclear rl ;i• ho .
5. Who performs testing on granular bases during construction?
a. Contractor b. Agency c. Consultant
6. Concerning the construction of asphalt layers:
Do you use a prime coat on aggregate base?S
a. Yes b. No
What is the maximum lift thickness for the bituminous base course? in. 3What is the maximum lift thickness for the bituminous biase course? i, 9 in. 3 3 3What is the maximum lift thickness for the bituminous binder course? /^ p in. 2 3 1What is the maximum lift thickness for the bituminous wear course? I '2, in. . I-
7. Do you use Quality Management specifications for asphalt mixtures? ' 3 3-4- 2.o 3
a. Yes b. No ® L ©
Performance
1. How do you evaluate performance?
a. Ride b. Condition Survey c. Deflection Testing
2. Do you have a pavement management system?
a. Yes b. No a3 - I I 3 1sse i .- k. ' .~ ,d MicJ-o M u4 5 IcM r^i
If yes, what is the name of the system? kowe.. Po ,yk P . *,, , s oW.
3. What is the approximate length of time before rehabilitation for a new asphalt pavement in yourexperience? --- years -- ?7" -- ) to -.1s0 i'- 1 o+ , o - , t - 3 3-
I 1 4 - .4j / I I 3 74. How long does an asphalt overlay last in your experience? - years
3 j Z) C C - 1("12. _ "8 4 -
to -. lo 1-3o -z 35oI I I I
A-3

5. What is the main motivation for rehabilitation in your experience?
a. Mixture Problems
i. Raveling ii. Stripping iii. Flushing iv. Rutting v. T -c
b. Structural or Environmental Problems
i. Fatigue Cracking ii. Rutting iii. Transverse Cracking
c. Construction ProblemsL lo I ,
i. Lack of Uniformity ii. Poor Ride Quality iii. Joint Deterioration
Load Restrictions
1. Do you use.load limits on your roadways?-3 -
a. Yes b. No
2. How are load limits established?
a. Deflection Testing b. Design
3. How is the timing of load restrictions established?s.7 1 _ D 3 i I
a. Mn/DOT b. OtherM k^ .r+HM4 94\ '1_q- ,A-s Cld;4-;,r ai nbb'v $H-f- £.c -+.4-s* AhA*A4
4. How well are load limits enforced?I 3 311 1 9a. Actively b. Intermittently c. Not at All
5. How many total miles of road in your county? miles
Miles of State Aid Roads paved:asphalt? concrete?
Miles of Non-State Aid Roads paved:asphalt? concrete?
Percentage of system that is 7-ton?Percentage of 7-ton that is posted during spring?
Thank you for your help in answering this questionnaire. Please return by August 1, 1998 to:
Dr. Eugene SkokDepartment of Civil EngineeringUniversity of Minnesota500 Pillsbury Dr. SEMinneapolis, MN 55455
A-4

Date:I A-qs%- L 19A Agency: M- - c-;-FRespondent: S'o C-il t-
Address:
Survey of Local Pavement Design Practice
The Local Road Research Board is sponsoring a study to review and refine the practice of designing andconstructing pavements at the local government level. The investigators for this project devised thisquestionnaire to gain insight into local practice. The topics covered here include design, specifications,construction and performance. Please respond according to your normal practice. If you have additionalinformation to provide, please provide written comments. Thank you.
Design
. What is your current design procedure?IL. 3-2,
a. Soil Factor b. R-value c. Other Co r- I c -
2. What are the primary types of soils in your jurisdiction?1o -7 A7 A9 A e 3 A
a. A-3 b. A-4 c. A-5 d. A-6 e. A-7-5 f. A-7-6 All A-2.-- -i-[-..
3. How do you determine the soil input values for design?,q II
a. Testing b. Soil Classification c. USDA Mapd. Past History e. Other
4. Do you normally design for a compaction subcut?
a. Yes b. No
If yes, how deep is a normal subcut? ft. I-_F- 1-2.' .o _ -3' 3I 1 -7 , I
5. What type of traffic input do you use for design?9 1-7 1 1
a. HCADT b. ESAL c. Maximum Load (5-ton, 7-d. ADT e. Other
I"1 •F. Mi 0oT 0 --'. I6. How do you determine the traffic input for design?
a. ADT Count by Your Agency b. Classification Coic. Provided by Mn/DOT d.. Roadway Classifi
\^SL II7. What types of drainage features do you commonly incorporate?7. What types of drainage features do you commonly incorporate?
a. Ditches b. Edge Drains
-7 (1.1-
-o I. 0U..1S0 I!)- 9 ^
c. Drainage Layer
9
-ton, etc.)
unt by Your Agencycation
d. Other
06 Y-Wý n ̂|^^^3t9CCCL,; i +
A-5

Specifications
1. What material specifications do you use for asphalt concrete?
a. 2331 b. 2340 c. 2350 d. Other -_ _
P4 4"- Ac2. Do you allow the use of RAP in your asphalt mixtures?
a. Yes b. No • •L .. oij
3. What material specifications do you use for granular base and subbase? 2.e S I 4/ ' SIVt )7 61
c c,~ss 2 a. Class 3 b. Class 4 c. Class 5 d. Class 6 e. Other
4. What type of embankment specifications do you use?
a. Ordinary Compaction b. Specified Density c. Test Rolling
If you use Specified Density, do you use (choose one) 95% or 100% of:/o I9 3
a. Standard Proctor b. Modified Proctor9S7' loo7
If you use Test Rolling, what specification or device is used? On o0T v11;
-FuL.11 l o ,. +--. f+s . - roConstruction
In this section, quality control will refer to the activities of the contractor to ensure that the product isconsistent and meets the minimum requirements of the agency. Quality Assurance refers to the activitiesof the agency to ensure that minimum quality standards are being met by the contractor.
1. What types of tests are performed on soils during construction?
a. In-Situ Density b. Moisture Content c. Classification/Gradation
If in-situ density is measured, what method is used?(3 R1
a. Sand Cone b. Nuclear
2. Who performs testing on soils during construction?3 1 13
a. Contractor b. Agency c. Consultant
3. What is the maximum lift thickness for aggregate base? in.
32 I,,.. S+,', e ,.U. ·. .. {^ I,7 Y- 'A % I S.
A-6

4. What types of tests are performed on granular bases during construction?33 39 1
a. In-Situ Density b. Moisture Content c. Classification/Gradation d. '7 -+ Ro //
If in-situ density is measured, what method is used?
a. Sand Cone b. Nuclear
5. Who performs testing on granular bases during construction?
a. Contractor b. Agency c. Consultant
6. Concerning the construction of asphalt layers:
Do you use a prime coat on aggregate base?3 -3
a. Yes b. No
D0 -( o 0What is the maximum lift thickness for the bituminous base course? Z 5! in. 3 3 3 3 q- YWhat is the maximum lift thickness for the bituminous binder course? a " in. 1 z 3 3 - LfWhat is the maximum lift thickness for the bituminous wear course? I t-. in. 1 2. z 3 2 L(
7. Do you use Quality Management specifications for asphalt mixtures?
a. Yes b. No
Performance
1. How do you evaluate performance?=..3 Z,-7 =
a. Ride b. Condition Survey c. Deflection Testing
2. Do you have a pavement management system?
a. Yes b. No + A
If yes, what is the name of the system?
3. What is the approximate length of time before rehabilitation for a new asphalt pavement in yourexperience? years -7. I ·, o ,o- : " s-3o 3 -
uo--- | 3 3 , -7 s + 4- 1 3 14. How long does an asphalt overlay last in your experience? years
5 -1o 7 -1 o I ao-t ir ,10 - 2. o 0_, 2 o--+
SGo. / 3 7 1 9-- "-7 , 3 I
z- d' ^l, o0 -4v.F•,
>-J o oo A0T '---ooo - lo ooR Y I- -i -z.r
I(o - -C A D&7 , aS-.<.."
A-7

5. What is the main motivation for rehabilitation in your experience?
a. Mixture Problems
^ /8 s - Ro i. Raveling ii. Stripping iii. Flushing iv. Rutting
b. Structural or Environmental Problems( :3 1 :zToi. Fatigue Cracking ii. Rutting iii. Transverse Cracking
c. Construction Problems
(9 / i. Lack of Uniformity ii. Poor Ride Quality iii. Joint Deterioration
Load Restrictions
. Do you use load limits on your roadways?31 13
a. Yes b. No
2. How are load limits established?
a. Deflection Testing b. Design
3. How is the timing of load restrictions established?
a. Mn/DOT b. Other Co ý,i -4 .1 -.s co ~ .cj I I
4. How well are load limits enforced?
a. Actively b. Intermittently c. Not at All
5. How many total miles of road in your county? miles
Miles of State Aid Roads paved:asphalt? concrete?
Miles of Non-State Aid Roads paved:asphalt? concrete?
Percentage of system that is 7-ton?Percentage of 7-ton that is posted during spring?
Thank you for your help in answering this questionnaire. Please return by August 1, 1998 to:Dr. Eugene SkokDepartment of Civil EngineeringUniversity of Minnesota500 Pillsbury Dr. SEMinneapolis, MN 55455
A-8