Minnesota Latino Nonprofit Economy Report - -HACER- · Nonprofit Economy Report ... Overall, this...
24
Minnesota Latino Nonprofit Economy Report October , 2001 Hispanic Advocacy and Community Empowerment through Research (HACER) Minnesota Council of Nonprofits (MCN)
Transcript of Minnesota Latino Nonprofit Economy Report - -HACER- · Nonprofit Economy Report ... Overall, this...

Minnesota Latino Nonprofit Economy Report
October , 2001
Hispanic Advocacy and Community Empowerment through Research (HACER)
Minnesota Council of Nonprofits (MCN)

ACKNOWLEDGEMENTS
Hispanic Advocacy and Community Empowerment through Research (HACER) and the Minnesota Council of Nonprofits (MCN) wishes to thank the individuals and organizations who participated in the survey (see attached list in the appendix) as well as to those who provided information for MCN's database. Thanks also to the Center for Urban and Regional Affairs (CURA) for support of HACER, and to the funders of HACER, the Otto Bremer Foundation and the Minneapolis Foundation. The authors of this report were Paul Carrizales, Juan Carlos Ortega, Sonia Ahmad and Jon Pratt. Deb Bushway, Research Coordinator for HACER, Claudia Fuentes and Joan Velasquez, offered additional input. This report will be available free for download at the Minnesota Council of Nonprofit’s Web site at www.mncn.org in November 2001.
HACER HHH Inst. Of Public Affairs
301 19th Ave S Ste 330 Minneapolis, MN 55455
612- 625-0573 Fax: 612- 626-0273 www.hacer-mn.org
Minnesota Council of Nonprofits 2314 University Ave W, Ste 20
St. Paul, MN 55114 651-642-1904
Fax: 651-642-1517 www.mncn.org
Photo credits Cover photo (right) by Nancy Conroy Cover photo (left) by Mark Hardy All other photos by Mark Hardy

1
TABLE OF CONTENTS
Executive Summary……………………………………………….……………………………………2 Introduction………………………………………………………………………………………………3 Four types of Latino nonprofit organizations…………………………………………………….4 Year of formation of Latino organizations………………….………………………………….…..6 Location of Latino organizations……………………………………………….…………………….7 Services provided by Latino organizations……………………………………………………….8 Staffing of Latino organizations…………………………………………………………………..10 Major sources of funding for Latino Organizations…………………………………………..11 Major areas of expenditures of Latino organizations…………………………………..…..13 APPENDIX A: Methodology…………………………………………………………………………15 APPENDIX B: Tables………………………………………………………………………………….17 APPENDIX C: A listing of organizations by category…………………………………………19

2
EXECUTIVE SUMMARY This report provides an overview of the breadth of nonprofit organizations serving the Latino community in Minnesota -- the number, size, location, and types of services and funding sources. The main findings for 19981 are: • 57 organizations have been formed specifically to serve the Latino community. • Most Latino organizations are located in those areas of Minnesota where the greatest
concentration of the Latino population resides in Minnesota. • The median Latino organization had three full time staff, four part time staff, ten
volunteers, and twenty board members. • Latino organizations provide a wide variety of services in eight areas: arts/cultural
activities, community building, education, environment, human services, legal, medical/mental health and recreation.
• Forty-four percent of the revenues came from government grants, and like most nonprofits, the largest single expenditure item was personnel, at 68%.
• As the Latino community continues to grow, there will be need for growth in organizations providing needed services to Latinos.
Overall, this report suggests that Latino nonprofits deserve and need increased attention from their respective communities. Therefore, HACER and MCN make the following recommendations:
• Leaders of Latino Nonprofits should increase the percentage of earned income as a share of organization revenues, encourage the formation of new organizations where appropriate, find ways to support current leadership and develop new leadership, and explore the possibility of an annual Latino leadership conference.
• Organizations with special Latino programs should be open to partnerships with
Latino organizations or consider spinning off special Latino programs to encourage development of leadership in the Latino community.
• The State of Minnesota and county governments should increase their use of
Latino organizations and businesses as vendors providing services at the community level.
1 The year of availability for the most recent data

3
• Foundations and the United Way should take into account changes in the state population when determining budgets for affordable housing, childcare, job training, education, health care and human services.
• The State of Minnesota,
the Secretary of State, the Attorney General’s office, and the Minnesota Council of Nonprofits should translate materials about how to form and operate nonprofit organizations into Spanish.
• Minnesota foundations
should partner with Latino nonprofits to ensure the long-term viability of these organizations and services.
• Latino nonprofit services must remain flexible enough to provide services where
the population requiring such services is located.
• Development of services for Latino communities in Greater Minnesota is encouraged – either through the creation of new organizations or through the expansion of existing nonprofits.

4
INTRODUCTION The Minnesota Latino population more than doubled in the 1990s. Data from the Minnesota Planning Agency shows that the Latino population grew by 143% from 1990 to 2000 (from 54,290 to 132,300). MN planning also predicts that this population will further increase by as much as 248% between 1995 and 20252. Data from the 2000 Census reveal that the Latino population increased by 166% to 143,382, accounting for 16.4% of Minnesota’s population growth. These numbers most likely underestimate the actual numbers of the Latino population since they do not include seasonal and non-resident migrant workers in Minnesota. The rapid growth of the Latino population3, many of whom have limited English Language proficiency and come from different cultural backgrounds, raises the question of whether there will be an increase in the number and breadth of nonprofit organizations providing language and culturally specific services. Until now, little information was available about Latino organizations in Minnesota. The Minnesota Council of Nonprofits (MCN) and Hispanic Advocacy and Community Empowerment through Research (HACER) have undertaken this study to address this information gap. Information in this report comes from a survey conducted by HACER and MCN, MCN's database on nonprofit organizations, and financial data from the State Attorney General's office. A detailed methodology is provided in the appendix. This is the first report of its kind to provide a picture on the state of Minnesota's Latino organizations - their size, location, types of services and funding sources. The report is also designed to examine the impact that the nonprofit sector has on the Latino community and to identify effective strategies and policy solutions to support the successful development of the Latino nonprofit community.
2 Minnesota Planning, Faces of the Future: Minnesota Population Projections 1995-2025, 1998 3 The term Latino denotes persons who have roots in Latin America, either by birth or ancestry. They have diverse racial and national backgrounds, but share important cultural values and often (but not always) have Spanish as their first language.

5
I. FOUR MAJOR TYPES OF LATINO NONPROFITS This report was undertaken to describe the scale and scope of organizations that serve the Latino community. Eighty-two functioning Latino organizations were identified using two directories – the Chicano Latino Affairs Council's "Bilingual Directory" and the Center for Urban and Regional Affair's "Directory of Nonprofit Organizations of Color in Minnesota.” This report contains information on 57 of the 82 organizations. Early in the research process, it became clear that there were important distinctions among the structure and sponsorship of these organizations. For this reason, the report divides the organizations serving the Latino community into four categories: Formal Latino Organizations (includes nonprofits and government agencies), Informal Latino Nonprofits, Latino programs housed in nonprofit organizations, and Nonprofits with programs directed to Latin American countries. The following describes each of these categories in more detail:4 • Formal Latino Organizations are organizations whose primary mission is to
provide services to the Latino community in Minnesota. They are formal in their structure, contain boards and committees, are established under the Minnesota Nonprofit Incorporation Act, are often registered as charitable organizations with the Attorney General's office, and generally are recognized institutions in the Latino community. Examples include nonprofit organizations such as Centro and Centro Legal and state government organizations such as Chicano Latino Affairs Council. A major focus of this report is documentation of Formal Latino nonprofits since they are the organizations that serve the major portion of the Latino community. There are 31 Formal Latino Organizations, representing 54% of the organizations in this report. Given the growth of nonprofits, it is likely that new Formal Latino Organizations have been formed since the date of the survey.
4 See Appendix C for the organizations that fall in each category.

6
• Informal Latino Nonprofits are similar to the Formal organizations in that their primary mission is to serve the Latino community in Minnesota. However, they are primarily grassroots organizations with less structure, very small budgets and only a few office or paid staff. An example of an Informal Latino Nonprofit is the Guatemalan Socio-Cultural Committee. Informal Latino Nonprofits (4) represent 7% of the nonprofits in this report. The small percentage of Informal nonprofits in our report is partially due to the difficulty in communicating with them, given their elusive nature, and the fact that organizations with budgets under $25,000 per year are not required to registered with the Attorney General's Office or report annually to the IRS. Many more organizations in this category undoubtedly exist in the Latino community and should be included in the future.
• Special Latino Programs are special programs or services for Latino populations
housed in organizations that primarily serve the public, or programs in these organizations that have a majority of Latino clients. The primary mission of these nonprofits is to serve the general public. Special Latino programs form 30% (17) of the organizations in our report.
• Latin American focused organizations are nonprofits whose main mission is to
provide relief, cultural exchange or public information about Latinos in Latin American countries. They include organizations such as the Resource Center of the Americas. Five of the organizations in this report (9%) fall into this category.

7
II. YEAR OF FORMATION OF LATINO ORGANIZATIONS
Latino organizations have existed in Minnesota since the late 1800's, but the majority were established within the last twenty years. Information from the MCN/HACER survey and MCN's database show there were only two Latino nonprofits in Minnesota in the 1800s, but the number increased to 57 organizations in the year 2000.5 Twenty new Latino organizations were formed between 1980 and 2000. The newer Latino nonprofits in our survey include organizations such as La Familia Guidance Center, formed in 1995, and HACER, formed in 1998. One of the oldest nonprofits in our study is Neighborhood House, which was founded in 1897 and started serving an increasing Latino community on the West Side of Saint Paul in 1938. The growth in Latino organizations corresponds to the increased Latino population in Minnesota, as well as the overall growth in of the number of nonprofit organizations in Minnesota.6
Chart 1: Formation of Latino organizations in Minnesota by decades
0
2
4
6
8
10
12
1800-1900 1960-1969 1970-1979 1980-1989 1990-2000
Year
Num
ber
of o
rgan
izat
ions
for
med
per
deca
de
5 We have information on the year of formation for 30 of the 57 organizations in this report. 6 Minnesota Council of Nonprofits, Nonprofit Economy Report, 2000

8
III. LOCATION OF LATINO ORGANIZATIONS Data collected through the surveys and through MCN's database indicates that the location of Latino organizations reflects the current distribution of the Latino population in Minnesota. Eighty percent of the Formal Latino organizations, 77% of Special Latino programs, and 50% of Informal Organizations are located in the seven-county metro area, where 68% of Minnesota's Latino population resided in 1995.7
Within the Twin Cities area, 26% of Formal Latino organizations are located in Minneapolis, while 54% are in St. Paul. This is in spite of that fact that only 16% of the Minnesota's Latino population now lives in St. Paul and 20% reside in Minneapolis.8 The high concentration of Latino nonprofit organizations in St. Paul may be attributed to the fact that St. Paul's West Side has had an established Latino community since the 1930s.9 Other clusters of Latino nonprofit activity can be found in regional centers in Greater Minnesota, including Willmar, Crookston and Moorhead. These communities contain substantial populations of migrant workers or food processing industry employees. Areas of Greater Minnesota without substantial migrant worker populations have not developed nonprofit organizations for the Latino community.10 While the majority of the Latino organizations are based in the Twin Cities, the scope of their activities extends beyond the metro area. Forty percent of all Latino nonprofits responding to our survey reported that they provide services to the entire state, 20% work at a county level, 5% offer their services to the Twin Cities metro area, 25% provide services at the neighborhood level, and 6.67% offer their services internationally.
7 Ellie M. Ulrich, Public Health and Health Care Access: Minnesota's Latino Community, Report of the Minnesota Chicano / Latino / Hispanic Health Care Access Project, Report of the Minnesota Chicano / Latino / Hispanic Health Care Access Project, 1999 8 Minnesota State Demographer Center 9 Chicano Latino Affairs Council (www.clac.state.mn.us), MN Chicano/Latino History, 2000 10 Doris Rubenstein, Cultural, Historic, and Structural Elements of Leadership in Hispanic Nonprofit Organizations in Minnesota, 1993.

9
IV. SERVICES PROVIDED BY LATINO NONPROFITS In 1995, the Wilder Research Center conducted a survey of Latino families in Minnesota to identify the needs of Latinos. In "Minnesota Latino Needs and Resources Assessment," Latinos identified their needs as housing, job training, ESL classes and education services. The study also reported that Latino families often lacked sufficient income to meet other basic needs, such as food and childcare. Furthermore, the Wilder report underscored the fact that Latinos were experiencing employment and language discrimination and felt that their economic and cultural contribution were undervalued by the general community. MCN and HACER found that Minnesota Latino organizations are addressing the concerns of the Latino community through seven main activities: ♦ Arts/Cultural activities. This includes performance art done by Latino nonprofits, as
well as financial and other support provided to the Latino Arts community.11 ♦ Community building. This category encompasses services such as social action
committees, support groups and forums conducted for Latinos and business promotion.
♦ Education services. This includes English as a Second Language programs,
academic assistance to Latino students and awareness/education on legal and health issues.
♦ Environmental activities. Generally, these are activities relating to the environment. ♦ Human services. This includes bilingual childcare programs, job training and food
and housing services. ♦ Medical/mental health services. General health services and counseling, crisis
prevention, chemical dependency treatments, and such related services are included in this category.
♦ Legal Services/advocacy services. This includes legal assistance and advice and
advocacy activities. ♦ Recreational activities. These activities include sports events, social gatherings, etc. Most Latino nonprofits provide more than one type of service. For instance, Chicanos Latinos Unidos En Servicios (CLUES) provides four distinct services, including mental health, education, human services, and community building activities. The survey found the following statistics out of 57 organizations:
11 Table 2 in Appendix B has detailed information on these services.
10
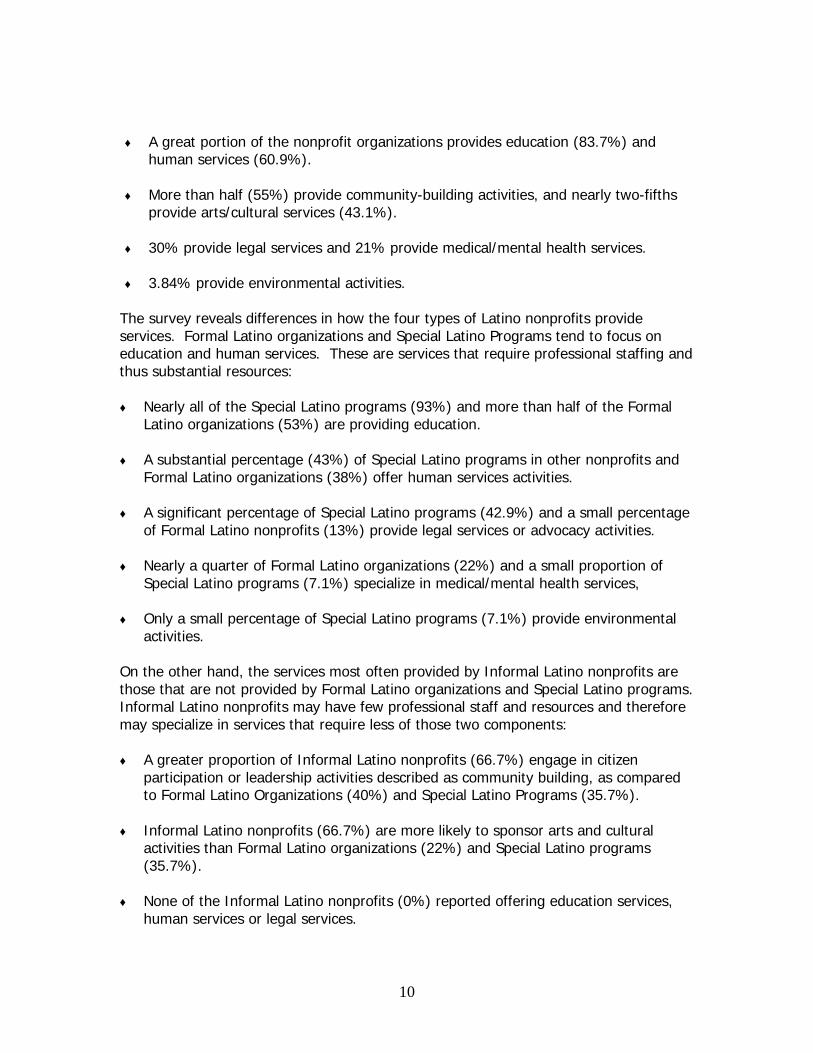
♦ A great portion of the nonprofit organizations provides education (83.7%) and
human services (60.9%). ♦ More than half (55%) provide community-building activities, and nearly two-fifths
provide arts/cultural services (43.1%). ♦ 30% provide legal services and 21% provide medical/mental health services.
♦ 3.84% provide environmental activities.
The survey reveals differences in how the four types of Latino nonprofits provide services. Formal Latino organizations and Special Latino Programs tend to focus on education and human services. These are services that require professional staffing and thus substantial resources: ♦ Nearly all of the Special Latino programs (93%) and more than half of the Formal
Latino organizations (53%) are providing education. ♦ A substantial percentage (43%) of Special Latino programs in other nonprofits and
Formal Latino organizations (38%) offer human services activities. ♦ A significant percentage of Special Latino programs (42.9%) and a small percentage
of Formal Latino nonprofits (13%) provide legal services or advocacy activities. ♦ Nearly a quarter of Formal Latino organizations (22%) and a small proportion of
Special Latino programs (7.1%) specialize in medical/mental health services, ♦ Only a small percentage of Special Latino programs (7.1%) provide environmental
activities. On the other hand, the services most often provided by Informal Latino nonprofits are those that are not provided by Formal Latino organizations and Special Latino programs. Informal Latino nonprofits may have few professional staff and resources and therefore may specialize in services that require less of those two components: ♦ A greater proportion of Informal Latino nonprofits (66.7%) engage in citizen
participation or leadership activities described as community building, as compared to Formal Latino Organizations (40%) and Special Latino Programs (35.7%).
♦ Informal Latino nonprofits (66.7%) are more likely to sponsor arts and cultural
activities than Formal Latino organizations (22%) and Special Latino programs (35.7%).
♦ None of the Informal Latino nonprofits (0%) reported offering education services,
human services or legal services.

11
V. STAFFING OF LATINO ORGANIZATIONS The Latino organizations in this study employ 460 full time staff, 234 part time staff and 2,582 volunteers. The table below indicates that all categories of Latino nonprofits rely heavily on volunteers. For instance, the median Latino organization had three full time staff, four part time staff, ten volunteers, and twenty board members. Nonprofits with programs directed towards Latin American countries use greater number of volunteers per full time staff (90 for 0 full time staff).
Table 1: Total and Median Number of Employees, Volunteers and Board members of
Latino Nonprofits Total
FT Staff PT Staff Volunteer Board Formal organizations (n=26)
356 95 1977 179
Informal NP (n=4) 19 3 48 25 Latin America focused organizations (n=3)
8 11 408 40
Special Latino Programs (n=16)
77 125 149 130
ALL 460 234 2582 257
Median FT Staff PT Staff Volunteer Board
Formal organizations (n=26)
3 2 15 7
Informal NP (n=4)
1 1 5 20
Latin America focused organizations (n=3)
0 12 90 12
Special Latino Programs (n=16)
3 2 20 11
ALL 3 4 10 20

12
VI. MAJOR SOURCES OF FUNDING OF LATINO ORGANIZATIONS An analysis of the 1998 Form 990 returns of Minnesota nonprofits12 filed with the office of the Attorney General revealed that Latino organizations receive revenue from a variety of sources. The IRS Form 990 classifies the revenues of the organizations into one of seven major categories:13 •••• Charitable Contributions: contributions and gifts from individuals, grants from
foundations, corporations and religious organizations. •••• Federated Charitable Campaigns: distributions from federated funds such as the
United Way, United Arts Fund, Cooperating Fund Drive, etc •••• Fees and Charges: fees and charges for services related to the organization's
mission. •••• Government Grants: direct grants or contracts for service from federal, state or local
units of government. •••• Membership dues: dues provided by the member of the organizations. •••• Interests and Dividends: interest on savings and dividends from securities. •••• Other Revenue: net income from rent, sale of assets or products, and charitable
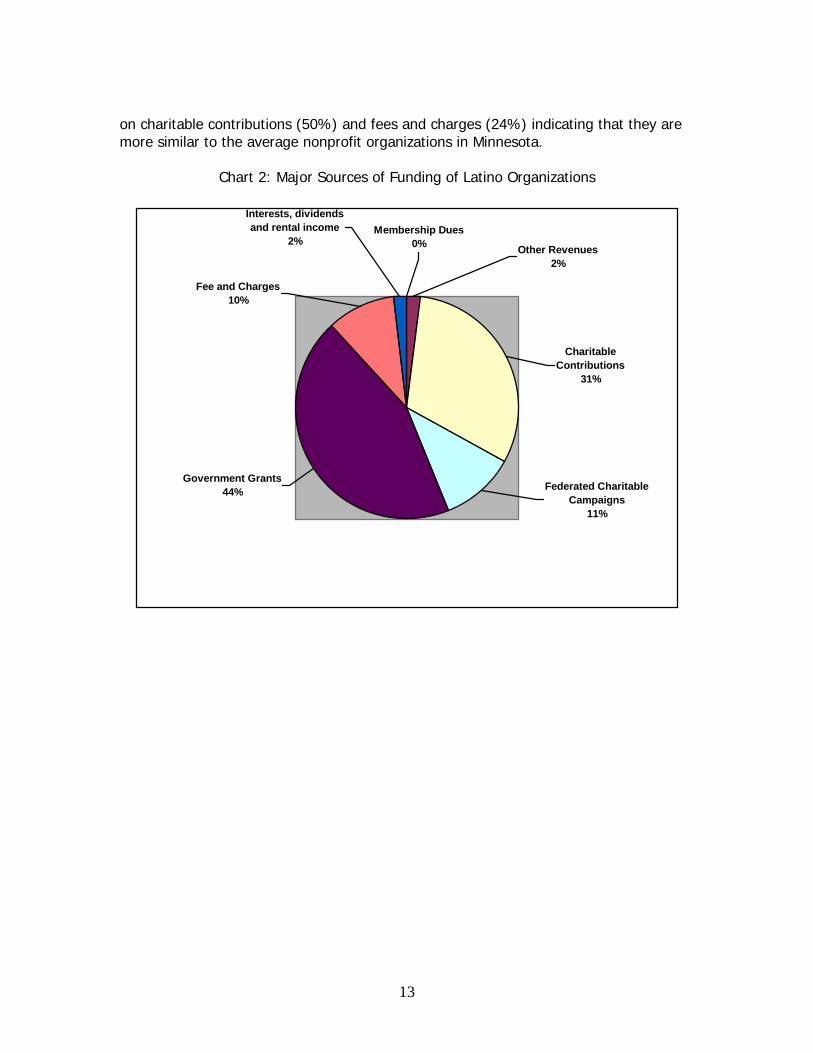
gambling. In 1998, the Latino organizations responding to our survey received $13,423,237 in revenues. The largest sources of revenues were government grants (44%) and charitable contributions (31%). In addition, these nonprofits received 11% of their revenues from fees and charges, another 11% from federated charitable campaigns, 2% from interest, dividends and rental income and a final 2% from other revenue. This is in contrast to overall nonprofit organizations in Minnesota, which rely on government grants for a small percentage (9.6%) of their revenues and instead rely heavily on fees and charges (52.6%) and charitable contributions (21.9%). A greater reliance on fees and charges denotes that the organizations are more likely to grow and be financially sustainable since they obtain that revenue from services related to the organization's mission.14 Formal Latino organizations (52%), Nonprofits with programs directed toward Latin American countries (51%) and Informal Latino nonprofits (40%) depend heavily on government grants. On the other hand, Special Latino programs have a greater reliance 12 IRS 990 forms are tax forms that nonprofits file with the Internal Revenue Services, the information on these forms are available from the Attorney General's Office. 13 Table 3 in Appendix B has detailed information of funding sources of Latino nonprofits. 14 Minnesota Council of Nonprofits, Nonprofit Economy Report, 2000
13
on charitable contributions (50%) and fees and charges (24%) indicating that they are more similar to the average nonprofit organizations in Minnesota.
Chart 2: Major Sources of Funding of Latino Organizations
Federated Charitable Campaigns
11%
Government Grants44%
Fee and Charges10%
Charitable Contributions
31%
Interests, dividends and rental income
2%Membership Dues
0% Other Revenues2%

14
VII. THE MAJOR AREAS OF EXPENDITURES OF LATINO NONPROFITS The Internal Revenue Service classifies expenditures by nonprofit organizations in the following categories:15 •••• Grants and allocations: Awards and grants given to individuals and organizations. •••• Payroll Costs: Compensation of officers, directors, other salaries and wages, pension
plan contributions, payroll taxes, and other employee benefits. •••• Professional fees: Professional fundraising fees, accounting fees, and legal fees. •••• Occupancy: Total amount paid or incurred for the use of office space or other
facilities. Also includes heat, light power and other utilities. •••• Other operating expenses: Supplies, telephone,
postage and shipping, equipment rental and maintenance, travel, printing and publications, conferences, conventions and meetings.
•••• Other expenses: Interests, depreciation and
other expenses that might be reported here penalties, fine and judgements, unrelated business income taxes, etc.
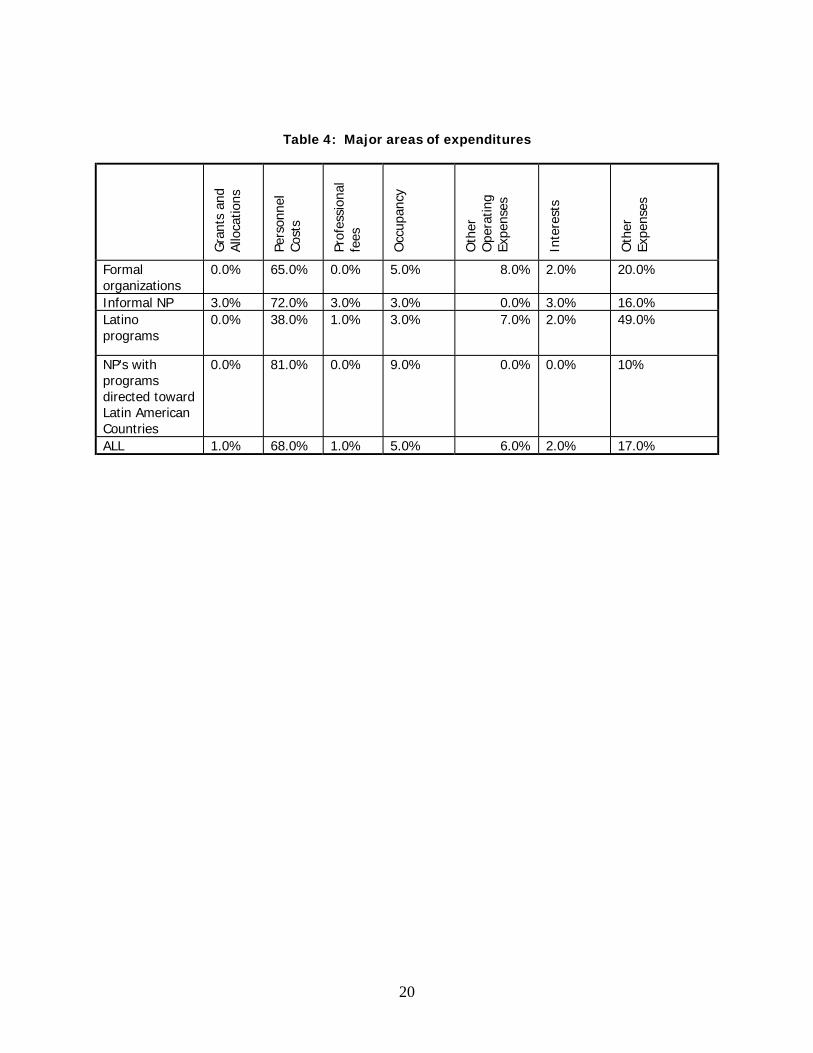
In 1998,all Latino organizations responding to our survey reported spending a total of $11,926,802 in a variety of expense categories. The most significant expenditure was personnel costs (accounting for 68.0% of budget), in spite of these organizations’ heavy reliance on volunteers. The second largest expense reported was “other operating expenses” (17% of budgets). Other areas of expenditures included occupancy (5.0%), other expenses (2.0%), grants and allocations (1.0%), and professional fees (1.0%). Expenditures of Latino organizations differ substantially from those of all nonprofits in Minnesota in two categories. While Latino nonprofits direct 68% of the expenditures toward staff, all nonprofits spend 47.7% in this category. All nonprofits spend a greater proportion on grants and allocations (12.9%) and other expenses (25.4%) than Latino organizations do.
15 Table 4 in Appendix B has detailed information about expenditures of Latino nonprofits.

15
Smaller differences were noted among the types of Latino nonprofits in expense categories. Personnel costs were the most significant expenditure for Formal Latino nonprofit organizations (65.0%), Informal Latino nonprofits (72.0%) and Latin American focused organizations (81.0%).
Chart 3: Major sources of Expenditures by Latino organizations
Grants and Allocations
1%
Other expenses17%
Interest, depreciation
2%
Payroll Costs68%
Other Operating Expenses
6%
Occupancy5%
Professional Fees1%

16
VIII. CONCLUSIONS AND RECOMMENDATIONS The growing Latino population in Minnesota is served by an increasing number of nonprofit organizations, though there remain many fewer Latino organizations per capita in comparison to organizations serving other ethnicities in Minnesota. The 1997 "Directory of Nonprofit Organizations of Color in Minnesota" published by the Center for Urban and Regional Affairs (CURA) at the University of Minnesota reports the following for nonprofits in Minnesota:
- 203 Asian American organizations serving 136,000 Asian Americans (1:670) - 91 American Indian organizations serving 67,200 American Indian (1:738) - 153 African American/African organizations serving 174,200 African
Americans/Africans (1:1,138) - 65 Latino organizations serving 132,300 Latinos in Minnesota (1:2,035) - The overall state ratio is 4,500 organizations serving 4.5 million (1:1,000)
The explanation for this difference may be partly historical and cultural. Most Asian immigrants came to Minnesota as refugees, and were often sponsored and immediately served by nonprofit social service organizations – quickly introducing them to the structural aspects of forming and financing nonprofit organizations. African American and American Indian organizations have a long history of providing community development and social services to their respective communities, and in these two latter cases, language is not a barrier to service provision.
In the Latino Community, most entrepreneurial residents are more oriented to commerce than social services, and so are far more likely to start a business than an organization. The language barrier may also deter new formal organizations getting started, since materials describing how to begin and operate an organization have not been translated into Spanish.
There may be a need for a greater number of Latino organizations to serve the Latino community in Minnesota, and a need for more resources to serve the cultural, educational and social service needs of the Latino Community.
Existing Latino nonprofit organizations are heavily reliant on government and charitable grants for their survival and utilize fees and charges related to their mission less than other nonprofits in the state. This is particularly important because such dependence on government funding might reduce organizations’ autonomy and thus reduce their capability to respond to the evolving demands of the Latino Community. The tension between reliability and autonomy when nonprofits depend on certain funding sources is captured in the following figure.

17
Reliability Individual
donor Government Corporate Earned Foundation Autonomy Source: J. Pratt, MCN Based on the information developed in this report and the input from community members and leaders of Latino nonprofits, the Boards of Directors of HACER and of MCN make the following recommendations:
1. Leaders of Latino Nonprofits must be supported in the expansion and
stabilization of their respective programs. New leadership from within the Latino community should be cultivated and encouraged.
2. Organizations with special Latino programs should be open to partnerships with
Latino organizations, or consider spinning off special Latino programs, to encourage development of Latino leadership. We acknowledge that the contributions of organizations with special projects focused on the Latino community have been useful and appreciated.
3. The State of Minnesota and county governments should increase their use of
Latino organizations and companies as vendors providing services at the community level.
4. Foundations and the United Way should take into account the new demographic
changes in their allocations of funds for human services, economic development, childcare, affordable housing, job training and education.
5. The State of Minnesota, the Secretary of State, the Attorney General’s office, and
the Minnesota Council of Nonprofits should translate materials about how to form and operate a nonprofit into Spanish. One example of leadership in this area is Grotto Foundation which in 2000 translated the Minnesota Common Grant Application into Spanish and began accepting proposals submitted in Spanish.
6. Minnesota foundations should partner with Latino nonprofits to ensure the long-
term viability of these organizations and services.
7. Latino nonprofit services must remain flexible enough to provide services where the population requiring such services is located.
8. Development of outstate services is encouraged – either through the creation of
new organizations or through the expansion of existing nonprofits.

18
APPENDIX A: Methodology Our goal was to compile comprehensive information on Latino nonprofits in Minnesota. Therefore, three different data sources were utilized to compile the data from this study: a) Internal Revenue Service Form 990 Financial data Financially active nonprofits with revenues more than $25,000 in a year are required to register with the Minnesota Attorney General's Charities Division. Nonprofits register by forwarding a copy of the organization's IRS Form 990 to the Charities Division. These forms are manually entered into a database that contains up to several years of information about a given organization. b) MCN database Results from periodic surveys and categorizations of Minnesota 501(c)(3) organizations conducted by the Minnesota Council of Nonprofits are maintained in a relational database. MCN's database currently contains information on 4410 financially active nonprofits in Minnesota. Information on the year of formation, number of full time staff and program descriptions are contained in the database. Information on ten of the organizations was obtained from MCN's database. c) Survey conducted by HACER and MCN The survey created for this project was mailed to 96 Latino organizations. The data were collected through mail, telephone calls and faxes. Fourteen of the 96 organizations included in the survey were assumed defunct since they did not respond to our mail survey or any of the telephone calls. We received responses from 57 (70 % return rate from the 82 existing organizations) of the organizations. Future recommendations for similar research include telephone calls, person-to-person interviews with executive directors and compiling a more up to date list of Latino organizations.

19
APPENDIX B: Tables Table 2: Services provided by Latino organizations16
Form
al
Info
rmal
La
tino
prog
ram
s
NPs
with
pr
ogra
ms
dire
cted
to
war
d La
tin
Amer
ican
co
untr
ies
Education Services 53.0% 0.0% 92.9% 25.0% Human Services 37.5% 0.0% 42.9% 0.0% Community Building /Economic Development 40.0% 66.7% 28.6% 75.0% Arts, Culture 22.0% 66.7% 35.7% 25% Legal Services/Advocacy 13.0% 0.0% 42.9% 0.0% Medical/Mental Health Services 22.0% 0.0% 7.1% 50% Recreation 22.0% 33.0% 14.3% 0.0% Environment 0.0% 0.0% 7.1% 0.0%
Table 3: Major Sources of Funding of Latino Nonprofits
Char
itabl
e Co
ntrib
utio
ns
Fede
rate
d Ch
arita
ble
Cam
paig
ns
Gov
ernm
ent
Gra
nts
Fees
and
Ch
arge
s
Mem
bers
hip
Due
s
Inte
rest
s,
Div
iden
ds a
nd
Ren
tal I
ncom
e
Oth
er R
even
ue
Formal organization
33.0% 8.0% 52.0% 4.0% 0.3% 0.7% 2%
Informal NP 21.0% 24.0% 40.0% 9.0% 0.0% 5.0% 1.0% Latino programs
50.0% 4.0% 17.0% 24.0% 1.0% 2.0% 2.0%
NP's with programs directed toward Latin American Countries
35.0% 11.0% 51.0% 0.2% 0.2% 0.6% 2.0%
ALL 31.0% 11.0% 44.0% 10.0% 0% 2.0% 2.0%
16 Totals may exceed 100 due to organizations reporting more than one service.
20
Table 4: Major areas of expenditures
Gra
nts
and
Allo
catio
ns
Pers
onne
l Co
sts
Prof
essi
onal
fe
es
Occ
upan
cy
Oth
er
Ope
ratin
g Ex
pens
es
Inte
rest
s
Oth
er
Expe
nses
Formal organizations
0.0% 65.0% 0.0% 5.0% 8.0% 2.0% 20.0%
Informal NP 3.0% 72.0% 3.0% 3.0% 0.0% 3.0% 16.0% Latino programs
0.0% 38.0% 1.0% 3.0% 7.0% 2.0% 49.0%
NP's with programs directed toward Latin American Countries
0.0% 81.0% 0.0% 9.0% 0.0% 0.0% 10%
ALL 1.0% 68.0% 1.0% 5.0% 6.0% 2.0% 17.0%

21
APPENDIX C: Listing of organizations in each category
Formal Latino Organizations
1. "Centro" previously Centro Cultural Chicano
2. Casa de Esperanza 3. Centro Legal, Inc 4. Chicano Latino Affairs Council 5. Chicano Latino Employment
Opportunities 6. Chicano Latino Leadership Association 7. Chicanos Latinos Unidos En Servicios 8. CreArte-Chicano, Latino, Arts, Center
and Museum 9. Discapacitados Abriendose Caminos 10. Esperanza Para Mujeres 11. HACER 12. Hispanic Academic Support System 13. Hispanic Health Network 14. Hispanos En Minnesota 15. Hispanos En Minnesota, Willmar 16. Immigrant Law Center of Minnesota 17. Instituto de Arte y Cultura 18. La Escuelita 19. La Familia Guidance Center, Inc 20. La Oportunidad, Inc 21. Migrant Health Service (Hispanic
Battered Women's Program and Sexual Assault Project)
22. Migrant Health Service, Inc 23. Migrant Legal Services 24. Minnesota Bar Association 25. Minnesota Hispanic Chamber of
Commerce 26. Minnesota Hispanic Education Program,
Inc 27. Mujeres Unidas del Red River Valley 28. Neighborhood House 29. Teatro Del Pueblo 30. Teatro Latino de Minnesota 31. West Side Community Health Center
Informal Latino Nonprofit
1. El Arco Iris Center for the Performing Arts
2. Guatemalan Socio-Cultural Committee
3. League of United Latin American Citizens
4. Migrant Health Network
Latin America focused organizations
1. Amigos de las Americas 2. Headwaters International 3. Mano a Mano Medical Resources 4. Resource Center of the Americas 5. Riverview Economic Development
Association
Special Latino Programs 1. Adelante Project 2. Arc Suburban 3. Archdiocese of St. Paul and
Minneapolis-Hispanic Ministry Leadership Team
4. Augsburg Hispanic/Latino Student Services
5. B.I.H.A Women in Action 6. Chicano Latino American Student
Association 7. Chicano Latino Learning Resource
Center, University of Minnesota, Twin Cities
8. Children's Home Society of Minnesota
9. El Fondo de Nuestro Comunidad 10. Fountain Center 11. Frogtown Family Resource Center

22
Listings of Special Latino programs continued: 12. Hispanic Ministry Leadership Team 13. Hispanic/Latino/Chicana
Organization, University of Minnesota Duluth
14. La Raza Student Cultural Center, University of Minnesota, Twin Cities
15. Minnesota Advocates for Human Rights
16. Minnesota OIC State Council 17. University of St. Thomas- Hispanic
Pre-college Project