Minnesota Intercity Bus Study 2014 · Minnesota Intercity Bus Study ... as well as Land to Air...
150
Minnesota Intercity Bus Study 2014
-
Upload
truonghanh -
Category
Documents
-
view
222 -
download
3
Transcript of Minnesota Intercity Bus Study 2014 · Minnesota Intercity Bus Study ... as well as Land to Air...

MinnesotaIntercity Bus Study
2014

Minnesota Intercity Bus StudyMarch 2014
Prepared by KFH Group and WBA Researchfor the Minnesota Department of Transportation, Office of Transit
For additional information about this study or the Minnesota Intercity Bus Program in general, contact:
Minnesota Intercity Bus Program CoordinatorMinnesota Department of Transportation, Office of Transit395 John Ireland Boulevard, Mail Stop 430Saint Paul, MN 55155
Office of Transit main phone: (651) 366-4191
To request this document in an alternative format, contact the Affirmative Action Office at (651) 366-4723 or 1-800-657-3774 (Greater Minnesota); 711 or 1-800-627-3529 (Minnesota Relay). You may also sendan e-mail to [email protected]. (Please request at least one week in advance.)

Minnesota Intercity Bus Study 2014
TABLE OF CONTENTS
EXECUTIVE SUMMARY
CHAPTER 1 – INTRODUCTION AND POLICY CONTEXTWhat is Intercity Bus? 1-1Policy Context 1-2Intercity Bus Trends 1-7
CHAPTER 2 – INVENTORY OF EXISTING INTERCITY BUS SERVICESIntercity Bus Services 2-1Commuter Bus Service 2-7S. 5311(f) Operational Data 2-8Service Comparison Over Time 2-12Airport Shuttles 2-12Potential Feeder Services 2-14
CHAPTER 3 – POPULATION CHARACTERISTICS AND NEED FOR INTERCITY BUS SERVICEDemographic Analysis 3-1Destinations/Facilities 3-9Unmet Needs Identified in Coordinated Plans 3-11
CHAPTER 4 – PREFERENCES OF INTERCITY TRAVELERSSurvey Findings Among Intercity Travelers 4-1
CHAPTER 5 – PROGRAM OVERVIEW AND NETWORK EVALUATIONMinnesota’s Intercity Bus Program 5-1Network Evaluation 5-7
CHAPTER 6– RECOMMENDATIONSProgram Options and Prioritization 6-1

Minnesota Intercity Bus Study 2014
TABLE OF CONTENTS
APPENDIX A – FEDERAL AND CARRIER POLICIES
APPENDIX B – INTERCITY BUS RESEARCH
APPENDIX C – MSP AIRPORT SHUTTLES
APPENDIX D – LOCAL TRANSIT CONNECTIONS
APPENDIX E – DEMOGRAPHIC AND LAND USE ANALYSIS
APPENDIX F – SURVEY METHODOLOGY AND DETAILS
APPENDIX G – ONBOARD SURVEY QUESTIONS
APPENDIX H – HOUSEHOLD SURVEY QUESTIONS
APPENDIX I – S.5311(F) NETWORK PERFORMANCE AND EVALUATION
APPENDIX J– RURAL INTERCITY DEMAND TOOLKIT
APPENDIX K– TECHNICAL ADVISORY COMMITTEE

Minnesota Intercity Bus Study 2014 i
The Minnesota Intercity Bus Study reviews and evaluates Minnesota’s existing intercity bus network, determines changes and improvements based on needs and service gaps, and provides policy recommendations to meet intercity bus needs. Intercity bus service is defined as regularly scheduled, fixed route, limited stop service for the general public that connects places not in close proximity and makes meaningful connections to the larger intercity network.
This study is meant to guide Minnesota Department of Transportation (MnDOT) staff in their continuing effort to improve the state’s intercity bus program, and to provide thorough service and policy analysis for interested stakeholders, including service providers and the public. The study is divided into six chapters, summarized below.
Introduction and Policy Context
Chapter 1 presents the policy context affecting MnDOT’s ability to maintain and improve its intercity bus services, mainly the Federal Transit Administration (FTA) Rural Area Formula Program (S. 5311). The S. 5311(f) subsection provides assistance to states for intercity bus operations. Fifteen percent of the annual S. 5311 apportionment must be used to support intercity bus service unless the governor of the state certifies that all rural intercity bus needs are adequately met. In Minnesota, Jefferson Lines is the major S. 5311(f) program subrecipient, as well as Land to Air Express and Rainbow Rider Transit. Other intercity bus carriers in Minnesota that operate without public subsidy include Greyhound Lines, Megabus, and Northfield Lines.
The rapid growth of intercity bus travel through curbside buses such as Megabus and BoltBus is a major industry trend in recent years. Curbside buses have influenced traditional terminal companies to lower fares, update vehicles (e.g. free wireless Internet), and expand service to stay competitive. Marketing is another important element of curbside service, and is an area for the MnDOT intercity bus program to pursue.
Minnesota Intercity Bus Study
EXECUTIVE SUMMARY

Minnesota Intercity Bus Study 2014ii
Inventory of Existing Intercity Bus Services
Chapter 2 provides an inventory of existing intercity bus services, documenting S. 5311(f) subsidized versus unsubsidized services, frequency, and communities served. Using S. 5311(f) operating data, it analyzes farebox recovery, passenger boardings, revenues, and costs by route. The busiest stops across the state in SFY 2013 were in major cities where multiple routes converge: the Twin Cities, Duluth, and Rochester.
A comparison of intercity service over time reveals that Minnesota’s coverage twenty years ago was more extensive than that provided by the current network. However, changes have also occurred in recent years that have added to the statewide network. Carriers implemented new subsidized services and increased some frequencies. The northeastern portion of the state, the Mankato – Rochester corridor, and the University of Minnesota, Morris stand out as gaining intercity coverage. Airport shuttles and commuter bus services also play a role in providing connections to and from rural areas. In addition, local public transit has the potential to play a feeder role for intercity bus. An evaluation of possible intercity bus and local transit connectivity shows that almost three quarters of non-urban stops along S. 5311(f) routes could allow for at least weekday transfers.
Population Characteristics and Need for Intercity Bus Service
Chapter 3 includes a statewide demographic analysis of intercity transportation needs. It compares the current Minnesota intercity bus network with locations that are potentially in need of service, based on population characteristics and potential destinations. Much of the current network service appears to be responsive to identified need; residents and trip generators in places like Virginia, Hibbing, Grand Rapids, and Morris are now connected to the intercity network. However, other locations like International Falls, Lake City, New Ulm, Red Wing, Thief River Falls, and Two Harbors stand out as lacking service. These places have potential intercity bus need, but not necessarily the demand to sustain new or reinstated service. The demographic findings therefore are one of several components informing the study’s ultimate recommendations.
Preferences of Intercity Travelers

Minnesota Intercity Bus Study 2014 iii
Chapter 4 presents surveys of current intercity bus passengers and other long-distance travelers in Greater Minnesota. Survey findings revealed that price is the number one reason that passengers choose intercity bus, followed by the unavailability of a personal vehicle. Nearly nine in ten passengers would consider using intercity buses again in the future. On the other hand, there is relatively little awareness of Minnesota’s available intercity bus services by long-distance travelers overall. Long-distance travelers who are not current intercity bus users cited more routes/destinations, greater frequency, and less travel time as desired improvements.
Program Overview and Network Evaluation
Chapter 5 reviews the history of the S. 5311(f) program in Minnesota and the current program status. The FY 2013 estimated net operating deficit for the program was $1,998,600, roughly fifty percent federal funding, forty percent state funding, and 10 percent local funding. The chapter then details performance measures for the intercity bus program under categories of availability, awareness, and efficiency. It evaluates existing routes and proposes benchmarks for the future, based on whether the route has an origin or destination in the Twin Cities. The chapter then considers network expansion and evaluates potential route segments with the same performance measures. This analysis highlighted the extensive coverage of the current intercity bus network. Thus, the chapter also explores the possibility of strengthening or creating local transit connections at existing intercity stops. Done in a targeted manner, this strategy could complement limited expansions to the intercity network.
Recommendations
The last chapter describes a range of policy considerations and recommended changes to achieve an improved statewide intercity bus network. Minnesota has a high level of intercity bus coverage, but many potential passengers are unaware that intercity bus is an available option. Based on input from the study’s technical advisory committee, this study recommends the following (in priority order):
1. Maintain the coverage of the current network,
2. Increase marketing and information efforts to raise awareness and usage,
3. Support intercity bus infrastructure by providing capital funding for vehicles, amenities, and passenger facilities, and

Minnesota Intercity Bus Study 2014iv
4. Allow limited service expansion, focusing on improved connectivity with local transit.
Based on current and anticipated levels of federal funding, maintaining the coverage of the existing network should be feasible in Minnesota, though this may require increased state participation over time.
Minnesota Intercity Bus Study 2014 1-1
The Minnesota Intercity Bus Study reviews and evaluates Minnesota’s existing intercity bus network, determines changes and improvements based on needs and service gaps, and provides policy recommendations to meet intercity bus needs. It explores how the Minnesota Department of Transportation can improve the state’s current intercity bus service and better evaluate S. 5311(f) funding applications.
As an update of the April 2010 study, this study contains six chapters. Chapter 1 presents an introduction to intercity bus service, as well as an overview of the policy context affecting MnDOT’s ability to maintain and improve those services. The second and third chapters provide an inventory of existing intercity bus services and describe changes in intercity transportation needs, respectively. Chapter 4 presents surveys of current intercity bus riders and the general public in Greater Minnesota, and Chapter 5 details performance measures and an evaluation of existing and potential routes. Chapter 6 describes a range of policy considerations and recommended changes to achieve an improved statewide intercity bus network. This study is meant to guide MnDOT staff in their continuing effort to improve the state’s intercity bus program, and to provide thorough service and policy analysis for interested stakeholders, including service providers and the public.
What is Intercity Bus?
Intercity bus service is regularly scheduled bus service for the general public. It operates with limited stops over fixed routes, connects communities not in close proximity, has the capacity to carry passenger baggage, and makes meaningful connections with the national intercity network.
Intercity service providers do not have to run full-size motor coaches over hundreds of miles to be part of the intercity bus network. Smaller public and private operators can supplement the core network by feeding it with shorter hauls. However, MnDOT does not consider most local public transit to be intercity bus, unless the service was designed expressly to connect to other intercity services. It also does not consider commuter
Chapter 1
INTRODUCTION AND POLICY CONTEXT

Minnesota Intercity Bus Study 20141-2
service, charters, or tour services to be intercity bus. Even though these buses often travel between cities, they do not typically make meaningful connections to the national intercity bus network.
As discussed in more depth in Chapter 2, intercity bus services in Minnesota are provided by Greyhound Lines, Jefferson Lines, Land to Air Express, Megabus, Northfield Lines, and Rainbow Rider Transit. Figure 1-1 depicts current intercity bus services by provider, as well as existing intercity rail. Since 2010, Greyhound has reduced its service coverage in Minnesota, while Megabus has maintained its coverage and increased its frequency. Jefferson Lines instituted a mix of service changes, adding frequency and new subsidized routes/stops while discontinuing others. Land to Air Express, Northfield Lines, and Rainbow Rider Transit also instituted new services since 2010.
Policy Context
The 2010 study presented a great deal of background regarding the context and history of federal and carrier policies in effect at that time. Changes have been instituted since then, though the basic outlines of the Minnesota program remain the same. Minnesota has implemented a number of the previous study’s recommendations with regard to the use of Federal Transit Administration (FTA) S. 5311(f) funding for rural intercity bus service. Chapter 2 presents the various changes that have been made to the statewide network.
FEDERAL FUNDING FOR INTERCITY SERVICES—S. 5311(F)
FTA S. 5311(f) funds are the only federal funding source for intercity bus operations. Used by MnDOT since 1997, S. 5311(f) provides assistance to states to develop or maintain rural intercity bus services, including those services connecting rural areas with urban services and the national intercity bus network. S. 5311(f) is a subsection of FTA’s S. 5311 formula grant allocation program for small urban and rural areas under 50,000 in population. The amount provided is based on each state’s non-urbanized population.
Fifteen percent of the annual S. 5311 apportionment must be used to support intercity bus service through the S. 5311(f) component of the program unless the governor of the state certifies that all rural intercity bus needs are adequately met. A partial certification is also possible, if the needs utilize less than the full 15 percent. In the case of certification, the funding reverts to the overall S. 5311 program for use on other rural transit projects. Minnesota’s federal FY 2013 S. 5311 apportionment under MAP-21 was $15,256,471. Fifteen percent of this annual apportionment was $2,288,471.
Fargo
Morris
Waseca
Austin
Winona
Walker
Wadena
PerhamNisswa
Duluth
Crosby
Bagley
Mankato
Willmar
Staples
Scanlon
Luverne Jackson
Hibbing
Glencoe
FosstonErskine
Bemidji
St. Paul
Virginia
McGregor
Marshall
Mahnomen
Hinckley
Fairmont
Brainerd
St. Peter
Menomonie
La Crosse
St. Cloud
RochesterPipestone
Pine City
Faribault
Crookston
Cass Lake
Northfield
Eau Claire
Pine River
Moose Lake
Monticello
Litchfield
Hutchinson
Hackensack
Clara City
Burnsville
Alexandria
Albert Lea
Minneapolis
Sioux Falls
Grand Forks
Worthington
Forest Lake
Dodge Center
Pequot Lakes
North Branch
Little Falls
Grand Rapids
Fergus Falls
Eden PrairieGranite Falls
Detroit Lakes
765
757
760
768
756
759
750
767
757
760
768
M I N N E S O T A
W I S C O N S I N
I O W A
S O U T H D A K O T A
ONTARIO
ONTARIO
0 50 10025 Mi
Intercity Stops
Greyhound
Jefferson Lines
Land To Air ExpressMegabus
Northfield LinesRainbow Rider Transit
Amtrak
Northstar Rail
Figure 1-1: Existing Intercity Bus and Rail Services by Provider

Minnesota Intercity Bus Study 2014 1-3
service, charters, or tour services to be intercity bus. Even though these buses often travel between cities, they do not typically make meaningful connections to the national intercity bus network.
As discussed in more depth in Chapter 2, intercity bus services in Minnesota are provided by Greyhound Lines, Jefferson Lines, Land to Air Express, Megabus, Northfield Lines, and Rainbow Rider Transit. Figure 1-1 depicts current intercity bus services by provider, as well as existing intercity rail. Since 2010, Greyhound has reduced its service coverage in Minnesota, while Megabus has maintained its coverage and increased its frequency. Jefferson Lines instituted a mix of service changes, adding frequency and new subsidized routes/stops while discontinuing others. Land to Air Express, Northfield Lines, and Rainbow Rider Transit also instituted new services since 2010.
Policy Context
The 2010 study presented a great deal of background regarding the context and history of federal and carrier policies in effect at that time. Changes have been instituted since then, though the basic outlines of the Minnesota program remain the same. Minnesota has implemented a number of the previous study’s recommendations with regard to the use of Federal Transit Administration (FTA) S. 5311(f) funding for rural intercity bus service. Chapter 2 presents the various changes that have been made to the statewide network.
FEDERAL FUNDING FOR INTERCITY SERVICES—S. 5311(F)
FTA S. 5311(f) funds are the only federal funding source for intercity bus operations. Used by MnDOT since 1997, S. 5311(f) provides assistance to states to develop or maintain rural intercity bus services, including those services connecting rural areas with urban services and the national intercity bus network. S. 5311(f) is a subsection of FTA’s S. 5311 formula grant allocation program for small urban and rural areas under 50,000 in population. The amount provided is based on each state’s non-urbanized population.
Fifteen percent of the annual S. 5311 apportionment must be used to support intercity bus service through the S. 5311(f) component of the program unless the governor of the state certifies that all rural intercity bus needs are adequately met. A partial certification is also possible, if the needs utilize less than the full 15 percent. In the case of certification, the funding reverts to the overall S. 5311 program for use on other rural transit projects. Minnesota’s federal FY 2013 S. 5311 apportionment under MAP-21 was $15,256,471. Fifteen percent of this annual apportionment was $2,288,471.
Fargo
Morris
Waseca
Austin
Winona
Walker
Wadena
PerhamNisswa
Duluth
Crosby
Bagley
Mankato
Willmar
Staples
Scanlon
Luverne Jackson
Hibbing
Glencoe
FosstonErskine
Bemidji
St. Paul
Virginia
McGregor
Marshall
Mahnomen
Hinckley
Fairmont
Brainerd
St. Peter
Menomonie
La Crosse
St. Cloud
RochesterPipestone
Pine City
Faribault
Crookston
Cass Lake
Northfield
Eau Claire
Pine River
Moose Lake
Monticello
Litchfield
Hutchinson
Hackensack
Clara City
Burnsville
Alexandria
Albert Lea
Minneapolis
Sioux Falls
Grand Forks
Worthington
Forest Lake
Dodge Center
Pequot Lakes
North Branch
Little Falls
Grand Rapids
Fergus Falls
Eden PrairieGranite Falls
Detroit Lakes
765
757
760
768
756
759
750
767
757
760
768
M I N N E S O T A
W I S C O N S I N
I O W A
S O U T H D A K O T A
ONTARIO
ONTARIO
0 50 10025 Mi
Intercity Stops
Greyhound
Jefferson Lines
Land To Air ExpressMegabus
Northfield LinesRainbow Rider Transit
Amtrak
Northstar Rail
Figure 1-1: Existing Intercity Bus and Rail Services by Provider

Minnesota Intercity Bus Study 20141-4
Many federal programs have a maximum allowable percentage of federal funds. For S. 5311(f), the maximum amount of federal funding for an operating assistance project is 50 percent of the net operating deficit (operating cost less fare and other revenue). The maximum allowable share of federal funding for a capital project (such as a new bus) is 80 percent of the project cost. The remaining costs for either type of project must be provided with non-federal funds as a match.
A unique aspect of the S. 5311(f) program is that FTA guidance allows a rural intercity operating assistance project to include both a route segment requiring operating assistance and an unsubsidized connecting segment that does not require assistance. The costs and revenues of both segments are included in the project, but FTA guidance allows 50 percent of the costs of the unsubsidized segment to be counted as match for the federal operating funds used on the segment requiring subsidy. These costs represent the value of the capital provided by the operator of the unsubsidized segment, which is their in-kind contribution to the project. This funding method is known by several different terms—it is referred to here as in-kind match. At the state level, Minnesota has utilized the in-kind match method extensively to fund many rural intercity services. Minnesota also now permits the use of S. 5311(f) funding for capital projects such as vehicle purchases.
CARRIER POLICIES
The following section describes the carrier policies that impact federal funding under the S. 5311(f) program. More information on the services provided by each Minnesota carrier is included in Chapter 2. The federal policy context for S. 5311(f) and other relevant programs is described in more detail in Appendix A.
JEFFERSON LINES
Jefferson Lines, headquartered in Minneapolis, has been the major S. 5311(f) program subrecipient in Minnesota since Greyhound Lines left the program in 2005. A family-owned
firm with a long history in the state, Jefferson Lines has worked to maintain an intrastate network for Minnesota by using the available S. 5311(f) funding
and its own funds (as local match) to operate local intercity bus services, which stop in many of the state’s small towns. This traditional intercity bus service contrasts with an emerging approach that would have shifted the service to interstate highways, bypassing small towns.
Jefferson schedules most of its Minnesota services to operate in the daylight hours, either as morning outbound trips from the Twin Cities (arriving

Minnesota Intercity Bus Study 2014 1-5
at the endpoints in late afternoon and evenings) or morning inbound trips (arriving in the Twin Cities in the afternoon and evening periods). This contrasts with other possible scheduling approaches that might focus on interstate connections but serve Minnesota in the middle of the night. Jefferson’s approach to schedules exemplifies the carrier’s focus on Minnesota needs.
Another important element of Jefferson Lines’ policies is the carrier’s continued willingness to provide the local match required to obtain S. 5311(f) operating assistance. The 2010 study documented Jefferson’s provision of local match in the absence of state operating funding, a policy that was close to unique in the industry. Few private carriers are willing to apply for such funding without a public source (state or local) for the 50 percent non-federal share of the operating deficit, as it implies a loss on every mile operated. Jefferson Lines also recently applied to MnDOT for available capital funding for vehicles. This occurred when the state program had additional funding from the American Recovery and Reinvestment Act of 2009 (though capital funding had been used for maintenance).
It should also be noted that Jefferson Lines has a history of working with local transit providers regarding stops, feeder services, etc., and with local governments to obtain community support for ticket sales and its S. 5311(f) applications. It utilizes a traditional network of bus stations, commission agents, and rural stops, though it has a web presence and offers online ticketing.
LAND TO AIR EXPRESS (BLUE EARTH BLUE SKY LLC)
Originally an airport limousine service, Land to Air Express was purchased by Blue Earth Blue Sky LLC in early 2009 and now also operates scheduled service eligible for S. 5311(f) funding. Though separate legal entities, Blue Earth Blue Sky LLC (dba Land to Air Express) and Jefferson Lines share an owner. Jefferson Lines integrates Land to Air routes and tickets into its website. More information on Land to Air services is included in Chapter 2.
GREYHOUND LINES
Greyhound is the only national network of scheduled intercity bus service, and it performs a critical function in linking smaller regional services around the country. It is a private operator owned by FirstGroup PLC of the United Kingdom. Greyhound provides service on only one route in Minnesota, but it does have a number of explicit policies regarding coordination with other services. Greyhound is a potential applicant to the S. 5311(f) program, and is also a potential provider of in-kind miles.

Minnesota Intercity Bus Study 20141-6
Although Greyhound has discontinued most of its rural services to focus on limited-stop services between larger urban areas, the firm still shows interest in receiving traffic from rural areas. Greyhound’s approach involves increasing its coordination with smaller
regional intercity carriers and with public transit providers, who could operate services connecting rural areas to Greyhound stops. Greyhound will provide in-kind match
to these operators, provided the firms and services meet certain criteria. Greyhound has developed a manual outlining this overall coordination approach, which is available online.
The firm offers several ways to coordinate on ticketing and information. These include a role for the rural connecting carrier as a formal interline partner, as
a commission agent, or simply allowing Greyhound terminal access with no joint ticketing. If a connecting carrier wishes to be included in Greyhound’s national schedules and telephone/Internet schedule information system, it must be an interline partner.
MEGABUS
Megabus is another intercity carrier providing intercity service in Minnesota. Megabus is a brand for scheduled express services operated by firms owned by or affiliated with Coach USA, the U.S. subsidiary of Stagecoach PLC of the United Kingdom. The Megabus brand and service pattern originated in the United Kingdom, and is now used for services provided in the United States, Canada, and Western Europe.
The Megabus service model differs from the more traditional intercity bus service model in that its services operate as express services, with few if any intermediate stops. For the most part its stops are large urban areas and university towns. Most ticketing and information is provided via the Internet, but Megabus also operates a call center and takes ticket reservations over the phone. Megabus does not use bus stations unless required. Passengers are picked up and dropped off at curbside locations. Often the curbside sites are chosen to facilitate local transit connections, but Megabus generally does not operate into public intermodal terminals or stations operated by other carriers. Megabus offers on-board Wi-Fi and power plugs for use by passengers.
Megabus sells a set number of tickets on a given trip at a very low price (typically these are purchased by persons well in advance), with the fares rising as the date of the service nears. With its fare system developed in this way, it generally does not offer interline tickets with other intercity bus carriers—and in some cases does not even interline with itself, requiring passengers continuing on other Megabus schedules to make separate

Minnesota Intercity Bus Study 2014 1-7
reservations and purchase separate tickets.1 It is not a member of the National Bus Traffic Association (NBTA), as described in Appendix A.
A major Megabus expansion took place when Coach USA purchased a number of firms that had been owned by Coach America, which went into liquidation in 2011. Some of those firms had been S. 5311(f) operators, and that was the first involvement of Megabus with the S. 5311(f) program. Megabus has indicated a desire to participate in the program and provide in-kind miles to other operators, specifically rural feeders. However, it is not clear how the lack of interline ticketing, common stations, and schedule connectivity with other carriers would meet the program’s requirements for a meaningful connection with the national intercity network. Megabus also has shown interest in providing service at or to public transit facilities in some locations.
Intercity Bus Trends
The rapid growth of intercity travel through curbside buses such as Megabus is a major development in the industry. The following section discusses curbside bus characteristics and the typical curbside rider, as well as implications for rural intercity services like those provided under Minnesota’s S. 5311(f) program. In particular, most curbside buses have robust marketing campaigns, a potential area of opportunity for MnDOT.
Curbside buses are those that pick up and drop off passengers at the curb of city streets, rather than serving bus terminals. The distinct characteristics of curbside bus service include the absence of ticket counters and waiting rooms, online ticket sales, greatly discounted fares, free wireless Internet, and express service.2 The origin of curbside buses may be traced to Chinatown buses, which began in the late 1990’s as transportation for immigrants between the Chinatowns of major cities. The inexpensive fares and frequent service soon attracted a broader ridership, prompting “corporate curbside buses” to enter the market to compete with Chinatown buses.3
1 The Coach USA subsidiaries that operate Megabus offer interline ticketing for some services. Thus, it may be possible for a Megabus customer to obtain an interline ticket, though this is not advertised online.
2 Schwieterman, J., L. Fischer, C. Ghoshal, P. Largent, N. Netzel, and M. Schulz. “The Intercity Bus Rolls to Record Expansion: 2011 Update on Scheduled Motor Coach Service in the United States.” Intercity Bus Research. Chaddick Institute for Metropolitan Development, DePaul University, 2011.
3 Klein, Nicholas and Andrew Zicter. “Everything But the Chickens: Cultural Authenticity Onboard the Chinatown Bus.” Urban Geography (2012): 46-63.

Minnesota Intercity Bus Study 20141-8
The two major corporate curbside bus providers in the U.S. are Megabus (owned by Stagecoach Group) and BoltBus (jointly owned by Greyhound and Peter Pan). The rise in intercity bus travel due to the popularity of curbside buses, especially since the onset of corporate curbside service, has influenced traditional terminal bus companies to lower their fares, update their vehicles, and expand service to stay competitive.4
WHO USES CURBSIDE BUSES AND WHY
College students and young professionals paved the way on curbside buses, but the service has since become more mainstream, with retirees, business travelers, and women among a new wave of riders. Several studies have identified that curbside bus riders are young, well educated, and digitally connected (subject to seasonal variation). Compared to traditional intercity bus riders, curbside riders have higher household incomes, are more likely to be Caucasian, are more likely to be traveling for pleasure, and often have never taken traditional intercity buses. However, more demographic overlap may exist between traditional and curbside riders in the Midwest than national studies would suggest.
Passengers use curbside intercity bus service because of its affordability, Wi-Fi access and power outlets, ease for medium distance trips, and convenient online ticketing. New riders are also drawn to curbside buses due to social influence.5 Marketing is another important element of curbside service. Curbside carriers’ marketing strategies include brightly colored branding, social media, targeted Internet ads, press coverage, student ambassadors on college campuses, and stop signage. Megabus also has an application for smart phones, which customers can use to purchase tickets or track buses in real time.
Curbside buses can introduce riders to other intercity bus services, potentially expanding the overall market. However, the new riders are likely to expect similar service attributes, which may not all be possible on subsidized S. 5311(f) routes making local stops in many small towns. Appendix B provides additional information on the rise of curbside buses. For reference, it also includes a number of other recent publications addressing the intercity bus industry, including Transportation Research Board documents.
4 Schwieterman, J., L. Fischer, S. Smith, and C. Towles. “The Return of the Intercity Bus: The Decline and Recovery of Scheduled Service to American Cities, 1960-2007.” Intercity Bus Research. Chaddick Institute for Metropolitan Development, DePaul University, 2007.
5 Scott, M., A. Wicks III, and E. Collins. “Curbside Intercity Bus Industry: Research of Transportation Policy Opportunities and Challenges.” Institute for Public Administration, University of Delaware, 2013.

Minnesota Intercity Bus Study 2014 2-1
This chapter presents an overview of Minnesota’s existing intercity bus services. There are three broad categories of service—traditional intercity bus service; long commuter express routes operated by public transit operators; and intrastate services operated between outlying towns and the Minneapolis-St. Paul Airport (MSP). This inventory will be compared to the intercity transportation needs discussed in the next chapter to identify gaps and develop alternatives for improved and expanded service.
Intercity Bus Services
Intercity bus services are provided by Greyhound Lines, Jefferson Lines, Land to Air Express, Megabus, Northfield Lines, and Rainbow Rider Transit. Current intercity routes are summarized in Table 2-1. Figures 2-1 displays routes subsidized by S. 5311(f) and those that operate independently without subsidy. Figure 2-2 displays service frequency.
GREYHOUND LINES
Greyhound Lines currently operates only one route in Minnesota. This route runs between Minneapolis and Chicago, stopping at the Hawthorne Transportation Center where it connects to Jefferson Lines. Seven trips depart Minneapolis daily. This is an increase in service from five round trips per day during the 2010 study. However, the route no longer stops in St. Paul. Greyhound Lines’ one round trip per day between Minneapolis and Duluth was discontinued, and is currently served by Jefferson Lines. The Minneapolis–Dallas service was also truncated, and now has its northern terminus in Kansas City.
JEFFERSON LINES
Jefferson Lines added new subsidized routes and stops since 2010 (Grand Rapids–Duluth, Brainerd–Duluth) while discontinuing others (Minneapolis–La Crosse via Red Wing). It also increased some frequencies to daily round trips (Minneapolis–Sioux Falls via Glencoe).
Chapter 2
INVENTORY OF EXISTING INTERCITY BUS SERVICES

Minnesota Intercity Bus Study 20142-2
Table 2-1: Service Frequency of Minnesota Intercity Buses
Provider Table Schedule Route RTs / week
S. 5311(f) Program Status
Minnesota Places Served
Greyhound 304 4700s, 4900s Minneapolis - Chicago 56 Unsubsidized MinneapolisJefferson Lines 750 801/806; 805/802;
803/804 Minneapolis - Kansas City 21 Unsubsidized Minneapolis, St. Paul, MSP
Airport, Burnsville, Faribault, Owatonna, Albert Lea
756 965/966 Minneapolis - Milwaukee 7 Subsidized Minneapolis, MSP Airport, Rochester, Winona
757 925/926 Minneapolis - Sioux Falls 7 Subsidized Minneapolis, Eden Prairie, Glencoe, Hutchinson, Litchfield, Willmar, Clara City, Granite Falls, Marshall, Pipestone, Luverne
757 701/702 Minneapolis - Sioux Falls - Rapid City - Billings
7 Unsubsidized Minneapolis, Burnsville, Owatonna, Albert Lea, Fairmont, Jackson, Worthington, Luverne
759 915/916 Minneapolis - Milwaukee 7 Unsubsidized Minneapolis, St. Paul760 906/911 Minneapolis - Duluth 7 Subsidized Duluth, Cloquet, Moose Lake,
Sandstone, Hinckley, Pine City, North Branch, Forest Lake, Blaine, Minneapolis, St. Paul, MSP Airport, Bloomington
760 907/912; 910/909 Minneapolis - Duluth 7 Unsubsidized Duluth, St. Paul, Minneapolis, MSP Airport, Bloomington, Burnsville
760 919/920 Virginia - Grand Rapids 7 Subsidized Grand Rapids, Hibbing, Virginia760 300s Minneapolis - Burnsville 14 Unsubsidized Minneapolis, St. Paul, Burnsville762 927/928 Fargo - Minneapolis 7 Unsubsidized Brainerd, St. Cloud, Monticello,
Maple Grove, Minneapolis762 927/928 Fargo - Minneapolis 7 Subsidized Crookston, Erskine, Fosston,
Bagley, Bemidji, Cass Lake, Walker, Hackensack, Pine River, Pequot Lakes, Nisswa, Brainerd
765 933/948; 938/941; 934/935
Minneapolis - Fargo - Billings - Missoula
21 Unsubsidized Minneapolis, St. Cloud, Alexandria, Fergus Falls, Moorhead
767 679/680; 677/678 Detroit Lakes - Mahnomen 6 Unsubsidized Detroit Lakes, Mahnomen768 929/930 Duluth - Brainerd - Fargo 5 Subsidized Duluth, Cloquet, McGregor,
Aikin, Crosby, Brainerd, Staples, Wadena, Perham, Detroit Lakes, Moorhead
Land to Air n/a 234/235 Mankato - Rochester 7 Subsidized Mankato, Albert Lea, Austin, Rochester
n/a 236/237; 238/239 Mankato - Rochester 14 Subsidized Mankato, Waseca, Owatonna, Dodge Center, Rochester
n/a 501-506; 511-516; 701-703; 711-713
Mankato - Minneapolis 36 Unsubsidized Mankato, St. Peter, MSP Airport, St. Paul, Minneapolis
Megabus n/a n/a Minneapolis - Chicago 48 Unsubsidized Minneapolis, St. PaulNorthfield Lines n/a n/a Northfield - Twin Cities 31 Unsubsidized Northfield, Bloomington, MSP
Airport, St. Paul, MinneapolisRainbow Rider n/a n/a Morris - Alexandria 9 Subsidized Morris, Starbuck, Glenwood,
Alexandria

Minnesota Intercity Bus Study 2014 2-3
Fargo
Morris
Waseca
Austin
Winona
Walker
Wadena
PerhamNisswa
Duluth
Crosby
Bagley
Mankato
Willmar
Staples
Scanlon
Luverne Jackson
Hibbing
Glencoe
FosstonErskine
Bemidji
St. PaulSt. Paul
Virginia
St. Paul
Owatonna
Moorhead
McGregor
Marshall
Mahnomen
Hinckley
Fairmont
Brainerd
St. Peter
Menomonie
La Crosse
Sandstone
St. Cloud
RochesterPipestone
Pine City
Faribault
Crookston
Cass Lake
Northfield
Eau Claire
Pine River
Moose Lake
Monticello
Litchfield
Hutchinson
Hackensack
Clara City
Burnsville
Alexandria
Albert LeaSioux Falls
Grand Forks
Worthington
Maple Grove
Forest Lake
Dodge Center
Pequot Lakes
North Branch
Little Falls
Grand Rapids
Fergus Falls
Granite Falls
Detroit Lakes
M I N N E S O T A
W I S C O N S I N
I O W A
S O U T H D A K O T A
ONTARIO
ONTARIO
0 50 10025 Mi
Unsubsidized
5311(f)
Minnesota Routes
Figure 2-1: Subsidized S. 5311(f) vs. Non-Subsidized Intercity Bus Services

Minnesota Intercity Bus Study 20142-4
Fargo
Morris
Waseca
Austin
Winona
Walker
Wadena
PerhamNisswa
Duluth
Crosby
Bagley
Mankato
Willmar
Staples
Scanlon
Luverne Jackson
Hibbing
Glencoe
FosstonErskine
Bemidji
St. PaulSt. Paul
Virginia
St. Paul
Owatonna
Moorhead
McGregor
Marshall
Mahnomen
Hinckley
Fairmont
Brainerd
St. Peter
Menomonie
La Crosse
Sandstone
St. Cloud
RochesterPipestone
Pine City
Faribault
Crookston
Cass Lake
Northfield
Eau Claire
Pine River
Moose Lake
Monticello
Litchfield
Hutchinson
Hackensack
Clara City
Burnsville
Alexandria
Albert LeaSioux Falls
Grand Forks
Worthington
Maple Grove
Forest Lake
Dodge Center
Pequot Lakes
North Branch
Little Falls
Grand Rapids
Fergus Falls
Granite Falls
Detroit Lakes
M I N N E S O T A
W I S C O N S I N
I O W A
S O U T H D A K O T A
ONTARIO
ONTARIO
0 50 10025 Mi
Round Trips Per Week
56 or more (8 trips/day or more)
22 to 55 (more than 3 trips/day)8 to 21 (up to 3 trips/day)7< 7
Figure 2-2: Frequency of Existing Intercity Bus Services
Minnesota Intercity Bus Study 2014 2-5
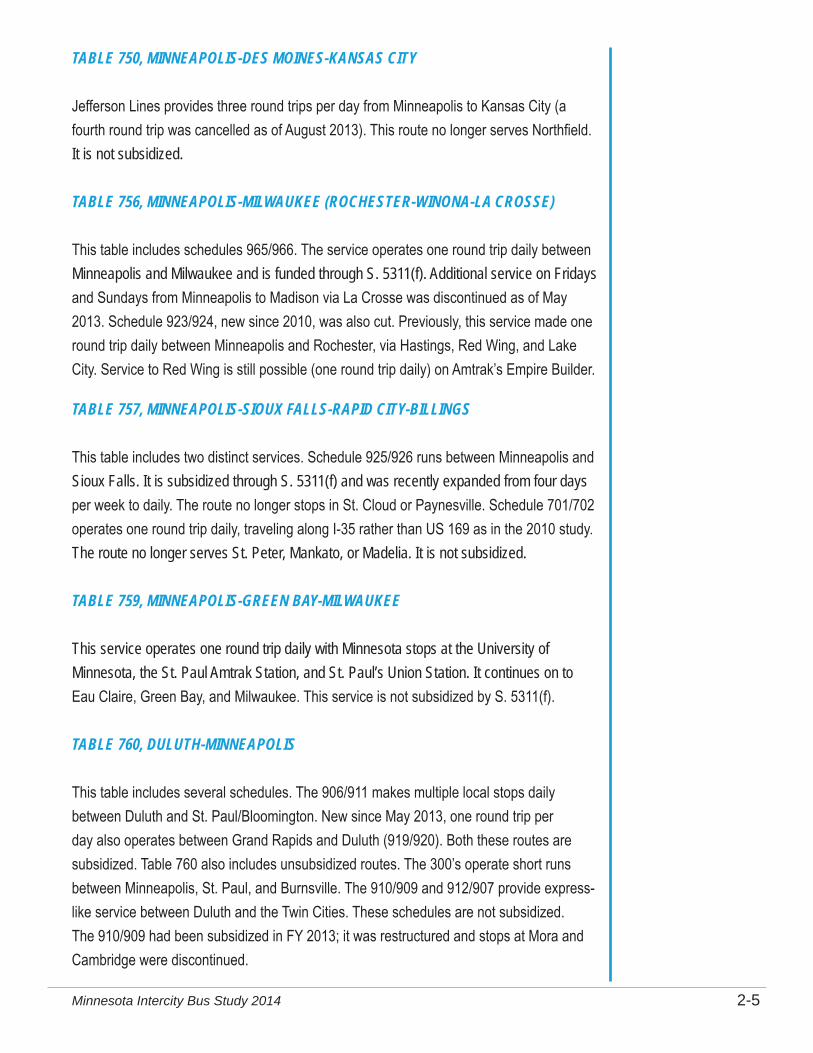
TABLE 750, MINNEAPOLIS-DES MOINES-KANSAS CITY
Jefferson Lines provides three round trips per day from Minneapolis to Kansas City (a fourth round trip was cancelled as of August 2013). This route no longer serves Northfield. It is not subsidized.
TABLE 756, MINNEAPOLIS-MILWAUKEE (ROCHESTER-WINONA-LA CROSSE)
This table includes schedules 965/966. The service operates one round trip daily between Minneapolis and Milwaukee and is funded through S. 5311(f). Additional service on Fridays and Sundays from Minneapolis to Madison via La Crosse was discontinued as of May 2013. Schedule 923/924, new since 2010, was also cut. Previously, this service made one round trip daily between Minneapolis and Rochester, via Hastings, Red Wing, and Lake City. Service to Red Wing is still possible (one round trip daily) on Amtrak’s Empire Builder.
TABLE 757, MINNEAPOLIS-SIOUX FALLS-RAPID CITY-BILLINGS
This table includes two distinct services. Schedule 925/926 runs between Minneapolis and Sioux Falls. It is subsidized through S. 5311(f) and was recently expanded from four days per week to daily. The route no longer stops in St. Cloud or Paynesville. Schedule 701/702 operates one round trip daily, traveling along I-35 rather than US 169 as in the 2010 study. The route no longer serves St. Peter, Mankato, or Madelia. It is not subsidized.
TABLE 759, MINNEAPOLIS-GREEN BAY-MILWAUKEE
This service operates one round trip daily with Minnesota stops at the University of Minnesota, the St. Paul Amtrak Station, and St. Paul’s Union Station. It continues on to Eau Claire, Green Bay, and Milwaukee. This service is not subsidized by S. 5311(f).
TABLE 760, DULUTH-MINNEAPOLIS
This table includes several schedules. The 906/911 makes multiple local stops daily between Duluth and St. Paul/Bloomington. New since May 2013, one round trip per day also operates between Grand Rapids and Duluth (919/920). Both these routes are subsidized. Table 760 also includes unsubsidized routes. The 300’s operate short runs between Minneapolis, St. Paul, and Burnsville. The 910/909 and 912/907 provide express-like service between Duluth and the Twin Cities. These schedules are not subsidized. The 910/909 had been subsidized in FY 2013; it was restructured and stops at Mora and Cambridge were discontinued.

Minnesota Intercity Bus Study 20142-6
TABLE 762, FARGO-GRAND FORKS-MINNEAPOLIS (BEMIDJI- BRAINERD- ST. CLOUD)
Schedules 927/928 connect Fargo, Grand Forks, and Minneapolis via Brainerd and St. Cloud with one round trip per day. Only the Grand Forks to Brainerd portion of this route is subsidized. It is a restructuring of the Fargo–Grand Forks–Wadena bi-directional loop that previously ran three days a week. The service no longer serves Park Rapids.
TABLE 765, MISSOULA-BILLINGS-MINNEAPOLIS (FARGO-BISMARK-ST. CLOUD)
This table includes routes that link Minneapolis and Fargo, North Dakota (via Alexandria on I-94) with additional service continuing to Montana. Three round trips daily occur between Fargo and Minneapolis. Schedules 934/935, 948/933, and 934/935 are all unsubsidized.
TABLE 767, DETROIT LAKES-MAHNOMEN
This service, new since the 2010 study, operates on Highway 59. It makes two round trips per day three times per week (Mon./Thurs./Fri.). It is not subsidized by S. 5311(f).
TABLE 768, FARGO-BRAINERD-DULUTH
New since the 2010 study (schedules 929/930), Jefferson Lines also provides service with stops between Duluth and Fargo. This service makes five round trips per week (not Tues. or Wed.) and is subsidized by S. 5311(f).
LAND TO AIR EXPRESS (BLUE EARTH BLUE SKY)
Land to Air Express operates both subsidized and unsubsidized services in Minnesota. The former run between Mankato and Rochester. Schedule 235/234 operates one round trip per day via Albert Lea. Schedules 237/236 and 239/238 operate two round trips per day via Owatonna. The unsubsidized service, billed as an airport shuttle, covers a route previously served by Jefferson Lines. Schedules 501/506 and 511/516 operate six round trips per weekday between Mankato and MSP Airport. Three round trips operate on weekends and holidays. The schedules can be found online at www.landtoairexpress.com/southern-mn-connection.
MEGABUS
Megabus provides between five and eight round trips daily between Minneapolis and Chicago. This is an increase in service since the 2010 study, when four daily trips departed

Minnesota Intercity Bus Study 2014 2-7
from Minneapolis and three returned from Chicago. Outbound from Minneapolis, buses leave between 7 a.m. and 11:45 p.m. Inbound trips arrive between 6:20 a.m. and 11:35 p.m. The Minneapolis Megabus stop is located downtown, and the St. Paul stop is located at the Midway Shopping Center. The Minneapolis-Chicago route travels via either Madison or Milwaukee. Schedules are online at http://us.megabus.com/.
NORTHFIELD LINES
Northfield Lines, Inc. is a private company that provides motor coach, charter, and shuttle services. Among these services is a daily intercity bus route (Northfield Metro Express) that travels between Northfield and the Twin Cities. Though partially oriented toward commuters, the route does provide some opportunity to make connections to the intercity network. This study considers it intercity bus as, with some changes, it could become eligible for S. 5311(f) funding.1 Most importantly, the route means that Northfield and the surrounding area do have some form of intercity bus service available.
Stops on the Metro Express include several universities and colleges in Northfield and the Twin Cities, as well as the Mall of America and MSP Airport. This unsubsidized route operates five trips daily, Monday through Friday. Two trips are offered each weekend day and on holidays. An extra late night trip is offered on Fridays and Saturdays.
RAINBOW RIDER TRANSIT
Rainbow Rider Transit is a public transit system serving six counties in west central Minnesota. In addition to demand response service and a volunteer driver program, Rainbow Rider launched intercity bus service between Morris and Alexandria in August 2013. The route operates three round trips per day, Friday to Sunday, and is subsidized through S. 5311(f). It offers a connection to Jefferson Lines in Alexandria.
Commuter Bus Service
Several commuter bus routes were discussed in the 2010 study due to their length and coverage outside of the Twin Cities urbanized area. Changes have occurred in the time since, including some additional services. Documenting commuter bus service is important for this study because of the interplay between commuter routes and intercity bus. A
1 As a fixed-route, fixed-schedule provider, Northfield Lines is a viable candidate in comparison to other entities. Most airport shuttles are demand response with advanced reservations required, and do not have schedules with designated stops. Commuter services generally have a schedule and route, but operate peak only and do not allow for a connection to the intercity network or serve the same terminals.

Minnesota Intercity Bus Study 20142-8
location that appears to have unmet intercity bus needs may be well served by commuter routes; suggesting new intercity service or increased frequencies in those locations would likely be duplicative. The following list (not exhaustive) identifies many current commuter bus services:
• Maple Grove Transit: serves Maple Grove to/from Minneapolis.
• Metro Transit: multiple routes serving Forest Lake, Lake Elmo, Maplewood, Oakdale, Oak Park Heights, and Stillwater.
• Minnesota Valley Transit Authority: multiple routes serving Apple Valley, Bloomington, Burnsville, Cedar Grove, Eagan, Lakeville, Rosemount, and Savage.
• Northstar Link: serves St. Cloud and Big Lake.
• Plymouth Metro Link: serves Plymouth to/from Minneapolis.
• Rochester City Lines: multiple routes serving Austin/Dexter; Bloomington/Inver Grove/Hampton; Byron; Cannon Falls; Chatfield; Chester; Hayfield/Dodge Center/Kasson; Kellogg; Lake City/Oak Center/Zumbro Falls/Reinke’s Corners; LeRoy/Grand Meadow; Owatonna/Claremont; Pine Island; Plainview/Elgin/Viola; Preston/Fountain; Spring Valley/Racine/Stewartville; St. Charles/Dover/Eyota; Wabasha; Winona/Stockton/Utica/Lewiston; and Zumbrota.
• Southwest Transit: serves Chanhassen, Chaska, and Eden Prairie to/from Minneapolis.
• Shakopee Transit and Prior Lake Laker Lines: serves Prior Lake and Shakopee to/from Minneapolis.
S. 5311(f) Operational Data
As part of this analysis, Jefferson Lines provided passenger counts by stop for its S. 5311(f) routes, as well as for Land to Air Express. The information provides a snapshot of intercity bus passenger boarding activity throughout the state in SFY 2013. Table 2-2 summarizes the top fifteen highest ridership stops on subsidized routes, and Figure 2-3 displays ridership by stop. Both consider ridership to be the total activity at a given stop, or the sum of boardings and alightings. Note that the data reflect service provided from July 2012 through June 2013. Some routes have been terminated and others have been launched since the end of this time frame.

Minnesota Intercity Bus Study 2014 2-9
Activity by stop ranged from over 29,000 at the Hawthorne Transportation Center to as low as single digits at Concordia College in Moorhead. However, this minimum is likely due to passengers using the MN State University stop (annual activity of 1,039) about a mile away. Average activity was 1,948 per stop, and about half of the stops had 500 or more annual boardings and alightings. Many of the busiest stops were in locations where multiple routes converge: the Twin Cities, Duluth, Rochester, and Fargo.
Table 2-3 presents operating data for those routes funded under S. 5311(f) in FY 2013. As discussed, some of these routes have been terminated, restructured, or expanded for FY 2014. Farebox recovery, or the comparison of revenue per mile and cost per mile, varied widely. It ranged from 77 percent on Jefferson Lines’ Duluth to Minneapolis I-35 route, to only 5 percent on the recently launched Duluth to Grand Rapids route. Average farebox recovery overall was 44 percent. Unsurprisingly, the Rochester–Minneapolis via Red Wing route with a farebox of 7 percent was not extended in FY 2014. Red Wing is served by Amtrak, and had almost 10,000 Amtrak boardings at that station in 2013. The Duluth–Minneapolis via Mora route was also terminated, despite its relatively high farebox recovery. This was due to low ridership at the intervening stops of Mora and Cambridge.
Compared to data collected in the last study, total passenger boardings on S. 5311(f) subsidized routes dropped, from 98,000 in CY 2008 to about 56,000 in FY 2013. However, this reflects the fact that some of the most productive S. 5311(f) routes became self-sustaining and no longer needed subsidy. Minnesota revenues fell slightly over the same period ($1,215,729 to 1,140,636), and costs increased slightly ($2,047,901 to 2,615,607).
Stop Boardings + Alightings
Hawthorne Transportation Center, Minneapolis 29,152
Duluth Jefferson Lines Depot 14,235
Wadena 8,729
UM-Duluth Bookstore 7,151
Rochester City Lines Bus Stop 6,534
St. Paul Union Depot 5,937
Fargo, ND 5,924
Milwaukee, WI 5,717
La Crosse, WI 4,047
UW- Madison Chazen Museum 3,795
UM- Minneapolis Ontario St. 3,189
MSP International Airport 3,037
Sioux Falls, SD 2,244
Mall of America 2,029
Albert Lea 1,964
Table 2-2: Greatest Total Passenger Activity on S. 5311(f) Subsidized Routes

Minnesota Intercity Bus Study 20142-10
Mora
FargoFargo
Morris
Waseca
Austin
Winona
Walker
Wadena
Perham
DuluthDuluth
Bagley Bemidji
Mankato
Willmar
Staples
Scanlon
Luverne Jackson
Glencoe
FosstonErskine
Bemidji
Marshall
Virginia
Red Wing
Mahnomen
Hinckley
Hastings
Fairmont
Brainerd
La Crosse
St. Peter
Rochester
Menomonie
St. Cloud
RochesterPipestone
Lake City
Faribault
Crookston
Cambridge
Saint Paul
Moose Lake
Monticello
Litchfield
HutchinsonClara City
Burnsville
Alexandria
Albert LeaSioux Falls
Grand Forks
Worthington
Park Rapids
Maple Grove
Forest Lake
Bloomington
Dodge Center
North Branch
Little Falls
Grand Rapids
Fergus Falls
Granite Falls
Detroit Lakes
M I N N E S O T A
W I S C O N S I N
I O W A
S O U T H D A K O T A
N O R T H D A K O T A
ONTARIO
ONTARIO
0 25 50 Mi
Annual Activity FY13
250 or less
251 - 500
501 - 1,000
1,001 - 5,000
5,001 - 30,000
Unsubsidized Routes
*Ridership by stop unavailable for unsubsidized routes.
Figure 2-3: FY13 Total Ridership by Stop, S. 5311(f) Only

Minnesota Intercity Bus Study 2014 2-11
Prov
ider
Sche
dule
Numb
erRo
ute
Total
Mile
s (M
N)Pa
ssen
gers
Pass
enge
r Mi
lesTo
tal R
even
ue
(MN)
Total
Cos
ts (M
N)Fa
re B
ox
Ratio
SF
Y14 S
tatus
/ Othe
r Note
s
Jeffe
rson L
ines
906
Dulut
h to M
innea
polis
65,68
2 5,
683
915,7
52
$156
,994
$204
,865
77%
909
Minn
eapo
lis to
Dulu
th 65
,940
3,73
4 48
1,872
$8
4,208
$2
05,74
2 41
%91
0Du
luth t
o Minn
eapo
lis vi
a Mor
a 66
,203
4,96
7 69
2,175
$1
21,11
9 $2
06,51
8 59
%Co
nver
ted to
unsu
bsidi
zed
expr
ess r
oute
911
Minn
eapo
lis to
Dulu
th via
Mor
a 72
,216
6,65
4 94
4,781
$1
64,93
3 $2
25,40
7 73
%Co
nver
ted to
unsu
bsidi
zed
expr
ess r
oute
929
Wad
ena t
o Far
go 37
,068
3,36
4 29
3,031
$5
1,311
$1
15,69
7 44
%Re
struc
tured
* 93
0Fa
rgo t
o Wad
ena
36,31
2 3,
442
293,9
82
$51,7
10
$113
,332
46%
Restr
uctur
ed*
932
Minn
eapo
lis to
Milw
auke
e 63
,000
8,38
6 1,
665,6
09
$124
,597
$196
,700
63%
935
Milw
auke
e to M
innea
polis
63,52
5 7,
470
1,31
7,485
$9
9,539
$1
98,33
3 50
%91
9Du
luth t
o Gra
nd R
apids
4,62
5 55
4,
807
$778
$1
4,432
5%
Laun
ched
May
2013
**92
0Gr
and R
apids
to D
uluth
4,87
5 14
1 8,
533
$1,37
4 $1
5,176
9%
Laun
ched
May
2013
**92
3Ro
ches
ter to
Minn
eapo
lis vi
a Red
Wing
41,48
4 61
4 50
,306
$8,78
2 $1
29,88
7 7%
Term
inated
924
Minn
eapo
lis to
Roc
heste
r via
Red W
ing 40
,716
648
53,31
3 $9
,419
$127
,583
7%Te
rmina
ted
925
Minn
eapo
lis to
Siou
x Fall
s 60
,984
1,99
1 35
8,469
$6
3,106
$1
91,00
3 33
%Ex
pand
ed to
7 RT
/wk
926
Siou
x Fall
s to M
innea
polis
61,66
1 2,
260
446,6
74
$78,7
99
$193
,037
41%
Expa
nded
to 7
RT/w
k92
7Fa
rgo v
ia Be
midji
(sou
th) 45
,717
2,16
6 33
9,052
$4
6,623
$1
42,99
4 33
%Re
struc
tured
, 7 R
T/wk
928
Farg
o via
Bemi
dji (n
orth)
45,89
2 2,
096
291,3
78
$40,0
70
$143
,482
28%
Restr
uctur
ed, 7
RT/
wk
Land
to A
ir23
2Ow
atonn
a to M
anka
to 16
,744
189
8,56
1 $1
,865
$25,7
47
7%Ex
tende
d to R
oche
ster
233
Mank
ato to
Owa
tonna
16,74
4 30
3 13
,677
$3,00
7 $2
5,747
12
%Ex
tende
d to R
oche
ster
234
Roch
ester
to M
anka
to 45
,500
1,09
5 73
,442
$16,0
90
$69,9
63
23%
235
Mank
ato to
Roc
heste
r 45
,500
1,04
9 74
,516
$16,3
13
$69,9
63
23%
TOTA
L 90
0,388
56
,307
8,32
7,415
$1
,140,6
36
$2,61
5,607
44
%
Table
2-3:
S. 53
11(f)
Ope
ratin
g Data
by R
oute,
Minn
esota
SFY
2013
*Wad
ena t
o/fro
m Fa
rgo i
s now
serve
d by a
restr
uctur
ed 92
9/930
betw
een D
uluth
and F
argo
. **D
ata fo
r Jeff
erso
n Line
s’ 91
9/920
only
includ
es 2
month
s rep
orted
.

Minnesota Intercity Bus Study 20142-12
Service Comparison Over Time
Analyzing historical intercity service coverage is one method to help determine possible network improvements. Figure 2-4 depicts Minnesota’s current intercity bus network in comparison to coverage in 1995.
Past intercity bus coverage was more extensive than current coverage, including connections between Willmar and Moorhead along the western edge of the state, between Wadena and Sauk Centre via Highway 71, and between Duluth and Cass Lake via Highway 2. Service also ran between Minneapolis and Winona via Highway 61, and between Minneapolis and Grand Rapids via Highway 169. The southern portion of the state surrounding New Ulm, Madelia, and Windom also had extensive coverage in 1995 that is no longer in place.
As noted above, changes have also occurred between 2010 and 2013. Greyhound reduced its service coverage, concentrating entirely on the I-94 corridor (along with Megabus). Jefferson Lines reorganized its routes, discontinuing service to Hastings, Red Wing, Lake City, Mora, Cambridge, Park Rapids, Madelia, Paynesville, and Northfield. Customers can no longer ride between Walker and Wadena on Highway 71, St. Cloud and Willmar on Highway 23, or Mankato and Fairmont on Highway 15.
That said, Jefferson Lines also implemented new subsidized services and increased frequencies on some of its routes. The northeastern portion of the state in particular benefited from new service between Grand Rapids, Duluth, and Brainerd. Land to Air Express now provides subsidized service between Mankato and Rochester. Rainbow Rider is another new recipient of S. 5311(f) funding, meeting a need identified in the 2010 study.
This comparison over time suggests some possibilities for service in areas that have lost significant coverage or frequency. However, further analysis of potential demand is necessary before reinstating any now-defunct route segments (see Chapter 5).
Airport Shuttles
Multiple providers operate between MSP Airport and smaller cities in Greater Minnesota and western Wisconsin. In general, these operators are intrastate, with no intercity bus interline ticketing. They typically use smaller vehicles such as vans or minibuses, have higher fares than traditional intercity buses, and usually require reservations (particularly for airport trips). Airport shuttles are relevant because they offer service to and from rural

Minnesota Intercity Bus Study 2014 2-13
Fargo
Morris
Waseca
Austin
Winona
Walker
Wadena
PerhamNisswa
Duluth
Crosby
Bagley
Mankato
Willmar
Staples
Scanlon
Luverne Jackson
Hibbing
Glencoe
FosstonErskine
Bemidji
St. PaulSt. Paul
Virginia
St. Paul
Owatonna
Moorhead
McGregor
Marshall
Mahnomen
Hinckley
Fairmont
Brainerd
St. Peter
Menomonie
La Crosse
Sandstone
St. Cloud
RochesterPipestone
Pine City
Faribault
Crookston
Cass Lake
Northfield
Eau Claire
Pine River
Moose Lake
Monticello
Litchfield
Hutchinson
Hackensack
Clara City
Burnsville
Alexandria
Albert LeaSioux Falls
Grand Forks
Worthington
Maple Grove
Forest Lake
Dodge Center
Pequot Lakes
North Branch
Little Falls
Grand Rapids
Fergus Falls
Granite Falls
Detroit Lakes
M I N N E S O T A
W I S C O N S I N
I O W A
S O U T H D A K O T A
ONTARIO
ONTARIO
0 25 50 Mi
Intercity Stops
Greyhound
Jefferson Lines
Land To Air Express
Megabus
Northfield Lines
Rainbow Rider Transit
1995 Service
Figure 2-4: Existing and Historical Intercity Bus Services
Minnesota Intercity Bus Study 20142-14
areas. The operators are potential S. 5311(f) program participants and/or coordinating partners; however, their services would have to be fixed route, fixed schedule with meaningful connections to the intercity network in order to be eligible. An example of an airport shuttle as a S. 5311(f) program participant is Bay Runner Shuttle, which serves the Baltimore Washington International Airport in Maryland.
Appendix C summarizes airport shuttle providers as of December 2013, based on the MSP Airport website: http://www.mspairport.com/GroundTransportation/van-and-shuttle-services.aspx.
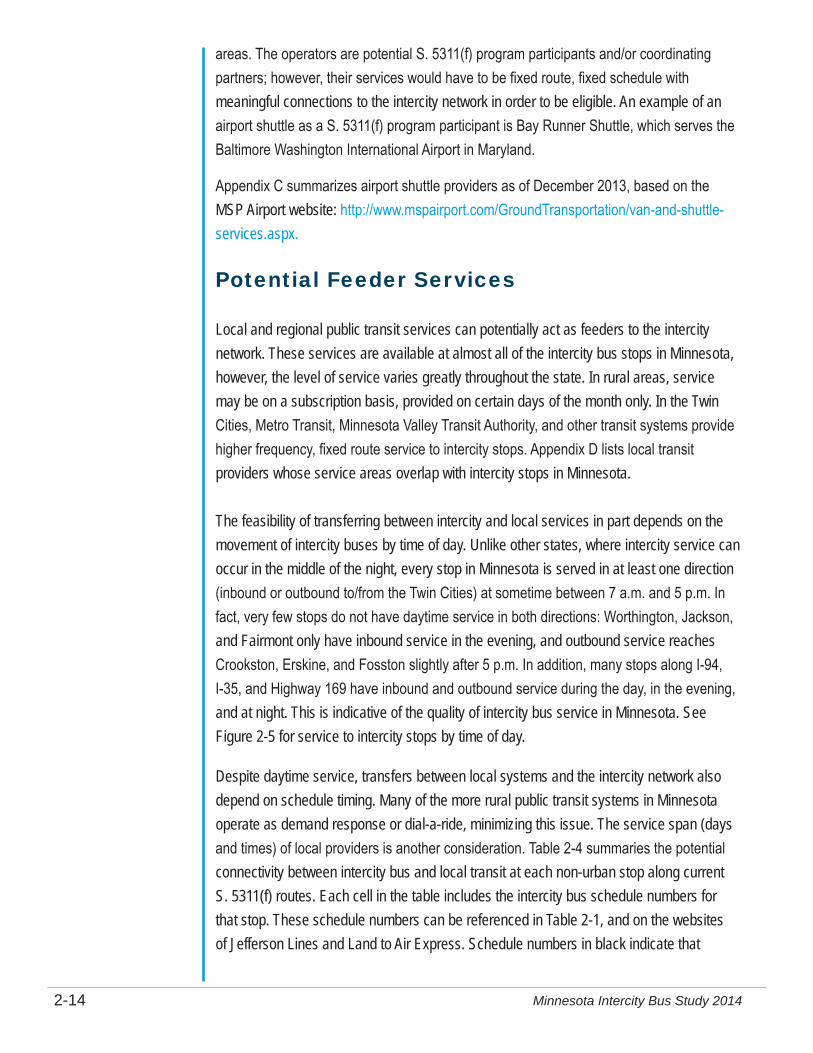
Potential Feeder Services
Local and regional public transit services can potentially act as feeders to the intercity network. These services are available at almost all of the intercity bus stops in Minnesota, however, the level of service varies greatly throughout the state. In rural areas, service may be on a subscription basis, provided on certain days of the month only. In the Twin Cities, Metro Transit, Minnesota Valley Transit Authority, and other transit systems provide higher frequency, fixed route service to intercity stops. Appendix D lists local transit providers whose service areas overlap with intercity stops in Minnesota.
The feasibility of transferring between intercity and local services in part depends on the movement of intercity buses by time of day. Unlike other states, where intercity service can occur in the middle of the night, every stop in Minnesota is served in at least one direction (inbound or outbound to/from the Twin Cities) at sometime between 7 a.m. and 5 p.m. In fact, very few stops do not have daytime service in both directions: Worthington, Jackson, and Fairmont only have inbound service in the evening, and outbound service reaches Crookston, Erskine, and Fosston slightly after 5 p.m. In addition, many stops along I-94, I-35, and Highway 169 have inbound and outbound service during the day, in the evening, and at night. This is indicative of the quality of intercity bus service in Minnesota. See Figure 2-5 for service to intercity stops by time of day.
Despite daytime service, transfers between local systems and the intercity network also depend on schedule timing. Many of the more rural public transit systems in Minnesota operate as demand response or dial-a-ride, minimizing this issue. The service span (days and times) of local providers is another consideration. Table 2-4 summaries the potential connectivity between intercity bus and local transit at each non-urban stop along current S. 5311(f) routes. Each cell in the table includes the intercity bus schedule numbers for that stop. These schedule numbers can be referenced in Table 2-1, and on the websites of Jefferson Lines and Land to Air Express. Schedule numbers in black indicate that

Minnesota Intercity Bus Study 2014 2-15
Fargo
Morris
Waseca
Austin
Winona
Walker
Wadena
PerhamNisswa
Duluth
Crosby
Bagley
Aitkin
Mankato
Willmar
Staples
Scanlon
Luverne Jackson
Hibbing
Glencoe
FosstonErskine
BemidjiVirginia
St. Paul
Owatonna
Moorhead
McGregor
Marshall
Mahnomen
Hinckley
Fairmont
Brainerd
St. Peter
Menomonie
La Crosse
Sandstone
St. Cloud
RochesterPipestone
Pine City
Faribault
Crookston
Cass Lake
Northfield
Eau Claire Eau Claire
Pine River
Moose Lake
Monticello
Litchfield
Hutchinson
Hackensack
Clara City
Burnsville
Alexandria
Albert LeaSioux Falls
Grand Forks
Worthington
Maple Grove
Forest Lake
Dodge Center
Pequot Lakes
North Branch
Little Falls
Grand Rapids
Fergus Falls
Eden PrairieGranite Falls
Detroit Lakes
765
757
762
760
768
756
759
750
767
757
7 60
768
M I N N E S O T A
W I S C O N S I N
I O W A
S O U T H D A K O T A
ONTARIO
ONTARIO
0 50 10025 Mi
Service 7am - 5pm
Service 5pm - 12am
Service 12am - 7am
Figure 2-5: Service to Minnesota Intercity Stops by Time of Day

Minnesota Intercity Bus Study 20142-16
passengers could potentially connect to local transit. Schedule numbers in red indicate that the local system’s service span does not cover the intercity bus arrival/departure time. Shaded rows indicate that no local transit system serves the intercity stop at all.
Though only a handful of stops (e.g. Austin, Cloquet, and Duluth) allow the opportunity to connect to/from an intercity bus and a feeder system for every trip on every day, almost three quarters of the stops allow for this on weekdays, or on weekdays and Saturdays. The analysis highlights that the intercity network currently has viable connectivity to local public transit, particularly Monday to Friday. However, an opportunity exists for the strategic expansion of local feeders. This could include additional weekend service, corresponding to times when much intercity bus travel occurs. Additional analysis to determine the feeder potential of local providers is included in Chapter 5.
Non-urban stops on S. 5311(f) routes
Potential for Feeder ConnectivityMonday Tuesday Wednesday Thursday Friday Saturday Sunday
Aikin 929, 930 NA NA 929, 930 929, 930 929, 930 929, 930Albert Lea 234, 235 234, 235 234, 235 234, 235 234, 235 234, 235 234, 235Alexandria NA NA NA NA RR 4 trips,
RR 2 tripsRR 6 trips RR 6 trips
Austin 234, 235 234, 235 234, 235 234, 235 234, 235 234, 235 234, 235Bagley 927, 928 927, 928 927, 928 927, 928 927, 928 927, 928 927, 928Bemidji 927, 928 927, 928 927, 928 927, 928 927, 928 927, 928 927, 928Brainerd 927, 928, 929,
930927, 928 927, 928 927, 928, 929,
930927, 928, 929, 930
927, 928, 929, 930
927, 928, 929, 930
Cass Lake 927, 928 927, 928 927, 928 927, 928 927, 928 927, 928 927, 928Clara City 925, 926 925, 926 925, 926 925, 926 925, 926 925, 926 925, 926Cloquet 906, 911, 929,
930906, 911 906, 911 906, 911, 929,
930906, 911, 929, 930
906, 911, 929, 930
906, 911, 929, 930
Crookston 927, 928 927, 928 927, 928 927, 928 927, 928 927, 928 927, 928Crosby 929, 930 NA NA 929, 930 929, 930 929, 930 929, 930Detroit Lakes 929, 930 NA NA 929, 930 929, 930 929, 930 929, 930Dodge Center 236, 237, 238,
239236, 237, 238, 239
236, 237, 238, 239
236, 237, 238, 239
236, 237, 238, 239
236, 237, 238, 239
236, 237, 238, 239
Duluth 906, 911, 919, 920, 929, 930
906, 911, 919, 920, 929, 930
906, 911, 919, 920, 929, 930
906, 911, 919, 920, 929, 930
906, 911, 919, 920, 929, 930
906, 911, 919, 920, 929, 930
906, 911, 919, 920, 929, 930
Erskine 927, 928 927, 928 927, 928 927, 928 927, 928 927, 928 927, 928Fosston 927, 928 927, 928 927, 928 927, 928 927, 928 927, 928 927, 928Glencoe 925, 926 925, 926 925, 926 925, 926 925, 926 925, 926 925, 926Glenwood NA NA NA NA RR 3 trips,
RR 3 tripsRR 6 trips RR 6 trips
Red schedules: no overlap with feeder system service. Black schedules: potential connectivity. Shaded rows: no existing feeder system. NA = no S. 5311(f) service scheduled. RR = Rainbow Rider Transit (no schedule numbers). *Selected days of the month only.
Table 2-4: Potential Feeder and S. 5311(f) Route Connectivity at Subsidized Stops

Minnesota Intercity Bus Study 2014 2-17
Non-urban stops on S. 5311(f) routes
Potential for Feeder ConnectivityMonday Tuesday Wednesday Thursday Friday Saturday Sunday
Grand Rapids 919, 920 919, 920 919, 920 919, 920 919, 920 919, 920 919, 920Granite Falls 925, 926 925, 926 925, 926 925, 926 925, 926 925, 926 925, 926Hackensack 927, 928 927, 928 927, 928 927, 928 927, 928 927, 928 927, 928Hibbing 919, 920 919, 920 919, 920 919, 920 919, 920 919, 920 919, 920Hinckley 906, 911 906, 911 906, 911 906, 911 906, 911 906, 911 906, 911Litchfield 925, 926 925, 926 925, 926 925, 926 925, 926 925, 926 925, 926Luverne 925, 926 925, 926 925, 926 925, 926 925, 926 925, 926 925, 926Mankato 234, 235, 236,
237, 238, 239234, 235, 236, 237, 238, 239
234, 235, 236, 237, 238, 239
234, 235, 236, 237, 238, 239
234, 235, 236, 237, 238, 239
234, 235, 236, 237, 238, 239
234, 235, 236, 237, 238, 239
Marshall 925, 926 925, 926 925, 926 925, 926 925, 926 925, 926 925, 926McGregor 929, 930 NA NA 929*, 930* 929, 930 929, 930 929, 930Moorhead 929, 930 NA NA 929, 930 929, 930 929, 930 929, 930Moose Lake 906, 911* 906, 911 906, 911 906, 911 906, 911* 906, 911 906, 911Morris NA NA NA NA RR 5 trips,
RR 1 tripRR 2 trips, RR 4 trips
RR 1 trip, RR 5 trips
Nisswa 927, 928 927, 928 927, 928 927, 928 927, 928 927, 928 927, 928North Branch 906, 911 906, 911 906, 911 906, 911 906, 911 906, 911 906, 911Owatonna 236, 237, 238,
239236, 237, 238, 239
236, 237, 238, 239
236, 237, 238, 239
236, 237, 238, 239
236, 239 236
Pequot Lakes 927, 928 927, 928 927, 928 928 927, 928 927, 928 927, 928Perham 929, 930 NA NA 929, 930 929, 930 929, 930 929, 930Pine City 906, 911 906, 911 906, 911 906, 911 906, 911 906, 911 906, 911Pine River 927, 928 927, 928 927, 928 927, 928 927, 928 927, 928 927, 928Pipestone 925, 926 925, 926 925, 926 925, 926 925, 926 925, 926 925, 926Rochester 234, 235, 236,
237, 238, 239234, 235, 236, 237, 238, 239
234, 235, 236, 237, 238, 239
234, 235, 236, 237, 238, 239
234, 235, 236, 237, 238, 239
234, 235, 236, 237, 238, 239
234, 235, 236, 237, 238, 239
Sandstone 906, 911 906, 911 906, 911 906, 911 906, 911 906, 911 906, 911Staples 929, 930 NA NA 929, 930 929, 930 929, 930 929, 930Starbuck NA NA NA NA RR 3 trips,
RR 3 tripsRR 6 trips RR 6 trips
Virginia 919, 920 919, 920 919, 920 919, 920 919, 920 919, 920 919, 920Wadena 929, 930 NA NA 929, 930 929, 930 929, 930 929, 930Walker 927, 928 927, 928 927, 928 927, 928 927, 928 927, 928 927, 928Waseca 236, 237, 238,
239236, 237, 238, 239
236, 237, 238, 239
236, 237, 238, 239
236, 237, 238, 239
236, 237, 238, 239
236, 237, 238, 239
Willmar 925, 926 925, 926 925, 926 925, 926 925, 926 925, 926 925, 926Red schedules: no overlap with feeder system service. Black schedules: potential connectivity. Shaded rows: no existing feeder system. NA = no S. 5311(f) service scheduled. RR = Rainbow Rider Transit (no schedule numbers). *Selected days of the month only.


Minnesota Intercity Bus Study 2014 3-1
This chapter examines the extent to which Minnesota’s current intercity bus network meets potential public need for intercity connections. It determines areas of high relative need based on the density and percentage of potentially transit-dependent populations. It identifies places that are likely to be intercity bus destinations: educational institutions, medical centers, correctional facilities, commercial airports, and military installations.
By overlaying the existing bus network with origin areas of higher relative need and potential destination points, the analysis reveals key intercity connections and gaps. Much of the current network appears to be responsive to identified need. Since the 2010 study, residents of places like Grand Rapids, Hibbing, Morris, and Virginia are now connected to the intercity network. Conversely, locations like International Falls, Lake City, New Ulm, Red Wing, Thief River Falls, and Two Harbors stand out as lacking service. Chapter 5 provides further analysis of these potential intercity stop candidates, as well as possible local/regional transit feeders.
Demographic Analysis
The need for any type of transit service, including intercity bus service, depends upon the size and distribution of an area’s population and on the demographic and economic characteristics of that population. Potentially transit-dependent population segments may require transit service to meet mobility needs (as an alternative to the private automobile) due to characteristics such as age, income, or automobile availability. Using data from the 2010 Census and the 2007-2011 American Community Survey (ACS), the following potentially transit-dependent population segments of the Minnesota population were selected:
1. Young adults (persons 18 to 34): enlisted military personnel, college students, and other young adults often do not have access to an automobile. Research suggests that individuals in this age range make up the bulk of intercity bus ridership.
Chapter 3
POPULATION CHARACTERISTICS AND NEED FOR INTERCITY BUS SERVICE

Minnesota Intercity Bus Study 20143-2
2. Elderly (persons 65 and above): advancing age can mean diminished ability or desire to drive (particularly on a long trip) and a need for access to medical facilities on a regular basis.
3. Persons living below poverty: persons that typically lack the economic means to own or operate a vehicle, or a vehicle perceived as capable of a long trip.
4. Autoless households: persons without access to a car must rely on alternative transportation.
These factors were chosen in part because of national data regarding intercity bus passenger characteristics.1 2 Passengers are most likely to be traveling for pleasure or personal business, have relatively low annual household incomes, and fall within the 18 to 35 age bracket. These characteristics are also supported by Greyhound’s 2004 annual report to the Securities and Exchange Commission (the last such report provided before the firm was merged into Laidlaw Transit). The average customer travels to visit friends or relatives and has an annual income below $35,000. These individuals may own automobiles that they think are reliable enough for a trip, but they travel by bus because the costs of a bus trip are lower than driving alone.
It should be noted that this analysis focuses mainly on the likely ridership for “traditional” intercity bus services, i.e. persons with higher transportation need characteristics. These are also persons likely to need local public transit. It does not fully address potential markets of “choice” riders—those who have a vehicle available, could drive or fly, and could choose to take transit or not. Research on choice riders is included in Appendix B.
METHODOLOGY
The first step in the needs analysis involved extracting block group level American Community Survey and Census 2010 data for the overall population and for each of the four needs categories (young adults, older adults, persons living below poverty, and autoless households). For each block group, the four categories were combined into aggregate measures of transportation need: 1) the density of potentially transit-dependent persons, and 2) the percentage of potentially transit-dependent persons.
1 U.S. Department of Transportation. Bureau of Transportation Statistics. 2001 National Household Travel Survey, preliminary long-distance trip file.
2 Fischer, Lauren and Joseph Schwieterman. Who Rides Curbside Buses? A Passengers Survey of Discount Curbside Bus Services in Six Eastern and Midwestern Cities. DePaul University. August 2011. http://las.depaul.edu/chaddick/docs/2011-2012_Reports/Who_Rides_Curbside_Buses_-__A_Passenger_.pdf

Minnesota Intercity Bus Study 2014 3-3
While transit service is often prioritized for areas that contain block groups with higher densities of potentially transit-dependent persons (ranking 1), it is also important to look at the percentage of the population with transit-dependent characteristics (ranking 2). Substantial percentages of transit-dependent populations indicate a high proportion of people who may need transit, though spread out over large and primarily rural areas.
The density and percentage of transit-dependent persons were mapped on a scale of “very low” to “very high.” This scale is based on the average for the state overall. For more details on methodology, see Appendix E.
RESULTS
It is important to recognize that identifying areas of high relative transit need is not the same as forecasting demand (ridership). Mapping the density and percentage of transit-dependent persons can highlight potential demand. However, rural areas especially may not have the density to support unsubsidized intercity bus service. Such areas may be candidates for rural feeder services, particularly as part of local rural transit operations.
DENSITY OF TRANSIT-DEPENDENT POPULATIONS
While a concentration of block groups with high relative need is clustered around the Twin Cities, areas with high or very high need are also spread throughout the state, mainly along major highways. With some exceptions, almost all of these areas are currently served by the intercity network. The block groups with high relative need (outside of the Twin Cities urbanized area) that are not currently served include:
• Region 1: Thief River Falls
• Region 2: Park Rapids
• Region 3: International Falls, Ely, Two Harbors, Silver Bay City
• Region 6W: Benson
• Region 7E: Princeton, Cambridge
• Region 7W: Melrose, Buffalo
• Region 8: Windom
• Region 9: New Ulm, Le Sueur
• Region 10: Kasson, Red Wing, Lake City
Minnesota Intercity Bus Study 20143-4
Figure 3-1 displays the density of transit-dependent populations statewide. Appendix E displays this information by Minnesota Economic Development Region.
PERCENTAGE OF TRANSIT-DEPENDENT POPULATIONS
Figure 3-2 shows relative level of need based on the percentage of potentially transit-dependent persons. Block groups with very high need are found in the Twin Cities, but also scattered throughout much more rural areas. Like the 2010 distribution, this includes the north central portion of the state and the southeastern corner. In some cases these block groups correspond to those identified as having a high density of transit-dependent persons.
Areas that are not currently served by the intercity bus network with the highest relative percentage of need include (west to east): Twin Valley, Sleepy Eye, New Ulm, Onamia, International Falls, Red Wing, Aurora, and Two Harbors. Some of these locations have had intercity stops in the past, and they may not warrant reinstated service. New Ulm, for example, had minimal intercity bus ridership, possibly due to the city’s robust volunteer driver program.
OVERALL POPULATION DENSITY
Another component of the demographic analysis is the overall distribution of population in the state. Figure 3-3 illustrates the overall population density of each block group in relationship to the existing intercity network. As in 2010, the majority of the population in the state is located in the Twin Cities area, and along major roads (I-94, I–35, I-90, US 169, US 52, US 10, Route 371). Places with the highest population densities correspond closely to those areas described above as having the highest relative transit dependence by density.
AUTOLESS HOUSEHOLDS
Households without at least one personal vehicle are more likely to depend on the mobility offered by transit and/or intercity bus than those households with access to a car. Although autoless households are reflected in both transit dependence measures, displaying this group separately is another way to illustrate the origins of potential intercity bus riders. As seen in Figure 3-4, places with a very high relative number of autoless households that are not served by the current intercity network include Roseau, Two Harbors, and the International Falls area in northern Minnesota. Closer to the Twin Cities, the greatest

Minnesota Intercity Bus Study 2014 3-5
ONTARIO
MANITOBA
M I N N E S O T A
W I S C O N S I N
I O W A
S O U T H D A K O T A
N O R T H D A K O T A
0 25 50 Mi
Intercity Bus Routes
Major Roads
Relative to Study Area
Low
Moderate
High
Very High
Figure 3-1: Density of Transit Dependent Populations

Minnesota Intercity Bus Study 20143-6
ONTARIO
MANITOBA
M I N N E S O T A
W I S C O N S I N
I O W A
S O U T H D A K O T A
N O R T H D A K O T A
0 25 50 Mi
Intercity Bus Routes
Major Roads
Relative to Study Area
Very Low
Low
Moderate
High
Very High
Figure 3-2: Percentage of Transit Dependent Populations

Minnesota Intercity Bus Study 2014 3-7
ONTARIO
MANITOBA
M I N N E S O T A
W I S C O N S I N
I O W A
S O U T H D A K O T A
N O R T H D A K O T A
0 25 50 Mi
Intercity Bus Routes
Major Roads
2010 Population Density
Persons per Sq. Mile
0 - 100
101 - 200
201 - 300
301 - 400
401 - 500
501+ (metro areas)
Figure 3-3: 2010 Minnesota Population Density

Minnesota Intercity Bus Study 20143-8
ONTARIO
MANITOBA
M I N N E S O T A
W I S C O N S I N
I O W A
S O U T H D A K O T A
N O R T H D A K O T A
0 25 50 Mi
Intercity Bus Routes
Major Roads
Relative to Study Area
Very Low
Low
Moderate
High
Very High
Figure 3-4: Relative Number of Autoless Households

Minnesota Intercity Bus Study 2014 3-9
numbers occur near Onamia, New Ulm, Sleepy Eye, Lake City, Canton, and Harmony. The latter two places may in part correspond to Fillmore County’s large Amish population.
Destinations/Facilities
The analysis of demographic data addressed the potential origin areas for intercity trips, but another consideration is whether or not the current routes serve the places that are likely to be attractors of intercity bus ridership. These include colleges and universities, military bases, major medical centers (with 40 or more beds), correctional facilities, and commercial airports. These destinations are mapped in Figure 3-5 and listed along with their locations in Appendix E.
As expected, the vast majority of destinations are clustered in the Twin Cities or in towns and cities along major interstates. Minnesota’s major destinations have remained relatively consistent in recent years. As in 2010, most are currently served by the intercity bus network. Explained in more detail in Chapter 5, 10 to 25 miles is a reasonable distance for residents to access the intercity network, thus the use of 10 and 25 mile buffers around each intercity stop. The majority of Minnesota’s educational facilities are within ten miles of the nearest intercity service point. White Earth Tribal and Community College, Hibbing Community College, Itasca Community College, Mesabi Range Community and Technical College, Riverland Community College, and the University of Minnesota Morris gained service since the 2010 study. The study specifically cited need for service to Morris, as the institution has on-campus residents and is over two hours by car from the nearest commercial airport.
Those colleges and universities that are located more than ten miles from intercity service but less than 25 miles include:
• Crown College in Saint Bonifacius (enrollment 1,198)
• Martin Luther College in New Ulm (enrollment 777)
• Saint John’s University in Collegeville (enrollment 2,010)
A number of educational facilities are more than 25 miles from the nearest intercity service point. These include:
• Minnesota West College in Canby (multiple campus enrollment 3,364)
• Northland College in Thief River Falls (enrollment 3,958)
• Rainy River Community College in International Falls (enrollment 376)

Minnesota Intercity Bus Study 20143-10
Fargo
Waseca
Austin
Sparta
Walker
PerhamNisswa
Duluth
Bagley
Aitkin
Mankato
Stanley
Willmar
Staples
Scanlon
Luverne Jackson
Glencoe
FosstonErskine
Virginia
Owatonna
McGregor
Marshall
Mahnomen
Hinckley
Fairmont
Brainerd
St. Peter
Menomonie
La Crosse
St. Cloud
Pipestone
Pine City
Faribault
Cass Lake
Eau Claire
Pine River
Moose Lake
Monticello
Litchfield
Hutchinson
Hackensack
Clara City
Alexandria
Sioux Falls
Grand Forks
Worthington
Forest Lake
North Branch
Little Falls
Grand Rapids
Granite Falls
ONTARIO
MANITOBA
M I N N E S O T A
W I S C O N S I N
I O W A
S O U T H D A K O T A
N O R T H D A K O T A
0 25 50 Mi
Intercity Bus Routes
10 mile stop buffer
25 mile stop buffer
Commercial Airport
Correctional Facility
College/University
Medical Facility
Military Installation
Figure 3-5: Minnesota Major Trip Generators

Minnesota Intercity Bus Study 2014 3-11
• Vermilion Community College in Ely (enrollment 781)
Although medical trips make up a small percentage of intercity bus trips, the ability for patients (especially Medicaid recipients) to travel from rural areas to major medical facilities is often a policy consideration for maintaining bus services. This analysis defines major medical facilities as those with 40 or more licensed beds, as well as the Minnesota Department of Health District Offices. Most major medical facilities in Minnesota currently have intercity bus service available, though several are located more than 25 miles from the nearest stop. This was the case in 2010 (e.g. facilities in International Falls and Thief River Falls). However, some facilities lost or gained intercity connections due to Jefferson Lines’ adjustments. St. Joseph’s Area Health Services in Park Rapids and the Mayo Clinic Health System in Red Wing lost service within 25 miles; Stevens Community Medical Center in Morris, University Medical Center Mesabi in Hibbing, Grand Itasca Clinic and Hospital in Grand Rapids, and Essentia Health Virginia all gained service within 10 miles.
As in the case of hospitals, demand from correctional facilities accounts for a small percentage of intercity bus trips. However, the ability to make trips between rural towns and correctional facilities may be crucial to families, released inmates, and employees. This analysis considered Minnesota Department of Corrections facilities only, not local or regional facilities. With the exceptions of Togo and Red Wing, all the correctional facilities in Minnesota are within 10 miles of an intercity bus stop. Intercity bus service is also accessible within ten miles of Minnesota’s major military installations. Finally, all the major commercial airports have intercity bus service within ten miles, except for International Falls and Thief River Falls. MSP has intercity bus service directly to the Lindbergh Terminal. Expanded service through Jefferson Lines since the 2010 study also offers access within ten miles of the Range Regional Airport in Hibbing.
Unmet Needs Identified in Coordinated Plans
Another part of the needs analysis involved reviewing Minnesota’s Coordinated Public Transit-Human Services Transportation Plans. Developed in 2006, these plans were updated across the state in 2011. The requirement for coordinated planning resulted from the 2005 SAFETEA-LU highway and transit funding legislation. MAP-21 continued the coordinated transportation planning requirements for S. 5310 recipients. A coordinated public transit-human services plan identifies the transportation needs of individuals with disabilities, seniors, and people with low incomes; provides strategies for meeting those local needs; and prioritizes transportation services for funding and implementation.

Minnesota Intercity Bus Study 20143-12
Minnesota’s coordinated public transit-human services transportation plans (developed by Minnesota Economic Development Region) were reviewed to determine if the assessment processes identified any needs for long-distance services, including potential needs for intercity bus service from rural areas. Since S. 5310 is now the major focus of the coordinated transportation plans, the absence of identified intercity bus needs may not indicate a lack of needs. Similar to the 2006 coordinated plans, intercity bus services were not detailed specifically. However, several plans did identify the need for long distance services that would cross jurisdictional boundaries and connect with local transit systems. Specific references to unmet intercity bus needs and/or recommended projects included the following:
• The East Central Regional Development Commission (Region 7E) cited “regional travel opportunities” as a potential project for implementation. This project would improve service by connecting local transit to intercity providers like Jefferson Lines.
• The Southwest Regional Development Commission (Region 8) listed “customer travel training” as a potential project, including teaching targeted populations to make connections between local transit systems and Land to Air Express.
• The Region 9 Development Commission noted the shift in service from Jefferson Lines to Land to Air in the Mankato area. Under potential projects, the plan included “corridor services” between counties and towns that connect with existing feeders. Another project was creating a “hub for public and private transportation providers” (including Land to Air) in Mankato that would be a station and a maintenance facility.

Minnesota Intercity Bus Study 2014 4-1
In order to better understand the role of intercity bus in meeting the state’s rural mobility needs and to determine potential program improvements, this study included surveys of both intercity bus passengers and of long-distance travelers in general. The onboard survey involved interviewing current intercity bus passengers during their trip. The household survey was a mixed methodology study (phone interviewing and online interviewing) designed to reach adults who have traveled on a trip of 75 miles or more (one-way) using any mode during the past year. Both survey efforts were conducted by WBA Research. Appendices F, G, and H present additional details, including a breakdown of the routes and regions surveyed and copies of the interview questions. Appendix F also describes the statistical interpretation of the survey results.
Survey Findings Among Intercity Travelers
Q: WHO IS SERVED BY INTERCITY BUS?
When considering who intercity buses can serve, two populations should be considered—those who use intercity buses already and those who may use them in the future (i.e., potential customers). According to the household survey, the typical adult Minnesotan traveler is approximately 46 years of age, employed and white, with a median household income of $63,000 per year and 50 percent having a college degree. Travelers—i.e. those who reported having taken a trip of 75 miles or more within the U.S. or Canada in the last year—are more likely to be female than male (65 percent vs. 35 percent). This contrasts with data from the National Household Travel Survey, in which women take only 43 percent of all long-distance trips.
Typical intercity bus passengers are about 40 years of age and more likely male (58 percent). They have a high school degree and perhaps some college and make a median income of $28,000 per year. More than half (55 percent) are not employed, though many (17 percent) are students. Still, about two in ten (18 percent) live below the
Chapter 4
PREFERENCES OF INTERCITY TRAVELERS

Minnesota Intercity Bus Study 20144-2
poverty line. Two-thirds (66 percent) are white, while about two in ten (19 percent) are African-American.
The following tables and charts present demographics comparing intercity bus passengers with long-distance travelers and with the state’s population overall. Relative to other long-distance travelers, intercity bus passengers are:
• Younger
• Lesslikelytobecurrentlyemployed
• Morelikelytobestudents
• Frommuchlowerincomehouseholds
• Amoreraciallydiversepopulation
Hispanic/Latino Intercity Bus Passengers AllLongDistanceTravelers Minnesota Population
Yes 6% 3% 5%
No 94% 97% 95%
Gender Intercity Bus Passengers AllLongDistanceTravelers Minnesota Population
Male 58% 35% 50%
Female 42% 65% 50%
0%
5%
10%
15%
20%
25%
30%
18 to
24
25 to
34
35 to
44
45 to
54
55 to
64
65 to
74
75+
ICB Passengers
Long Distance Travelers
MN Population
Table 4-1: DemographicComparison
Chart 4-1: AgeDistribution
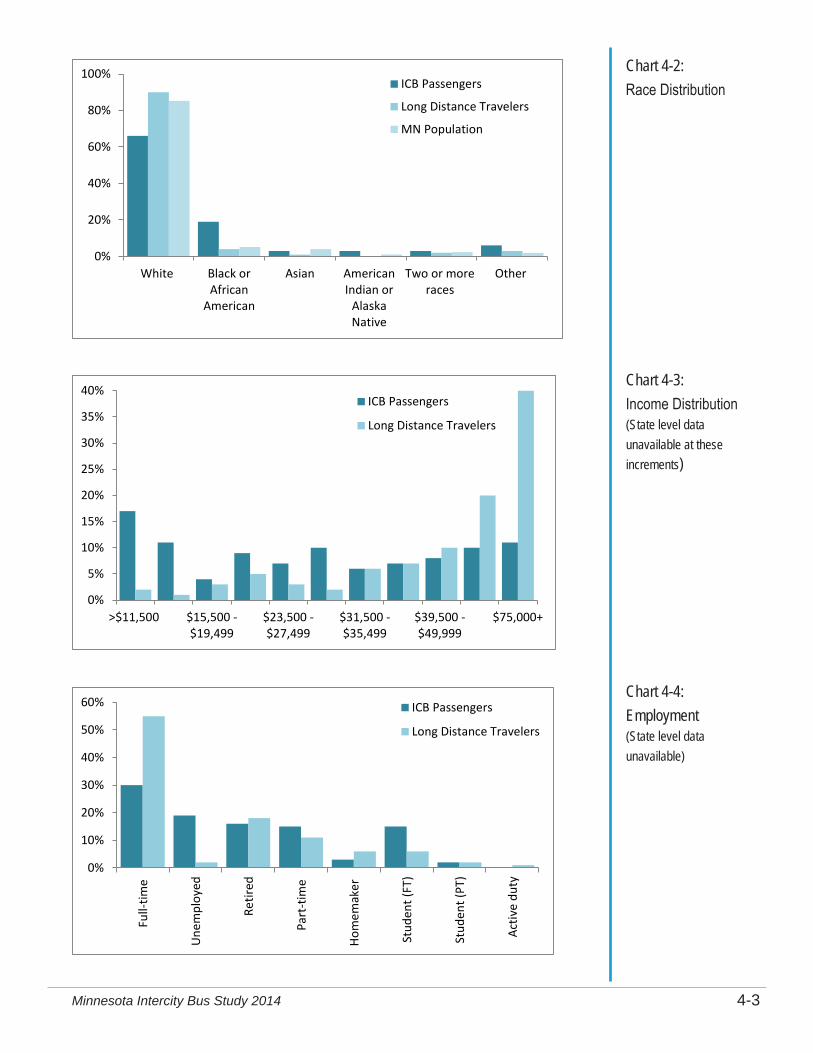
Minnesota Intercity Bus Study 2014 4-3
0%
20%
40%
60%
80%
100%
White Black orAfrican
American
Asian AmericanIndian or
AlaskaNative
Two or moreraces
Other
ICB Passengers
Long Distance Travelers
MN Population
0%
5%
10%
15%
20%
25%
30%
35%
40%
>$11,500 $15,500 -$19,499
$23,500 -$27,499
$31,500 -$35,499
$39,500 -$49,999
$75,000+
ICB Passengers
Long Distance Travelers
0%
10%
20%
30%
40%
50%
60%
Full-
time
Une
mpl
oyed
Retir
ed
Part
-tim
e
Hom
emak
er
Stud
ent (
FT)
Stud
ent (
PT)
Activ
e du
ty
ICB Passengers
Long Distance Travelers
Chart 4-2: RaceDistribution
Chart 4-3: IncomeDistribution (State level data unavailable at these increments)
Chart 4-4: Employment (State level data unavailable)

Minnesota Intercity Bus Study 20144-4
Q: WHERE DO INTERCITY BUSES NEED TO GO?
Among all long-distance travelers, most trips are taken to locations in-state. Residents travel on a trip of 75 miles or more in the continental U.S. or Canada once every three to six weeks, on average, and in the past year most often traveled within Minnesota (74 percent), or to nearby or bordering states such as Wisconsin (22 percent) and North Dakota(13percent).MinneapolisandDulutharethemostcommondestinations(21
and 18 percent) and Chicago is the most frequently traveled to city (10 percent) outside the state.
The destination patterns of intercity bus passengers are different. Minneapolis was the destination for 79 percent, with over eight in ten destined for the Twin Cities. DestinationsoutsidethestateincludedGrand Forks and Sioux Falls, with lower percentagestoWisconsinincludingLa
Crosse(4percent)andMadison(4percent).TheseresultslikelyreflectthestructureofMinnesota’s intercity bus routes, which center on the Twin Cities, and the fact that the survey focused on subsidized routes serving non-urbanized communities. The major carriers linking Minnesota with Wisconsin and Illinois were not surveyed (Greyhound and Megabus).
Q: WHY DO PEOPLE WANT TO MAKE THE TRIPS THAT THEY MAKE?
Among Minnesota long-distance travelers in general, most trips (81 percent) are made for social or recreational purposes. Only one in ten traveled last for work or school, with 4 percentoftripsbeingspecificallyforschool.Whilesocialorrecreationaltripsarealsothemost common reasons for using intercity buses, it only accounts for 63 percent of bus trips, while17percentareforworkandschool,with10percentbeingspecificallyforschool.Trips for personal business, such as to attend a wedding or funeral, also account for a larger proportion of intercity bus use than travel in general (20 vs. 9 percent).
Q: WHAT MOTIVATES PASSENGERS TO CHOOSE INTERCITY BUS?
The primary reasons people making long-distance trips gave for choosing a mode of transportation(ingeneral)aretheease,convenience,andflexibilitythemodeprovides
Top Mentioned Destinations
AllLongDistanceTravelers
Top Mentioned Destinations
Intercity Bus Passengers
Minneapolis, MN 21% Minneapolis, MN 79%
Duluth,MN 18% Duluth,MN 22%
Chicago,IL 10% Brainerd, MN 13%
St. Paul, MN 8% SiouxFalls,SD 10%
Fargo,ND 8% Fargo,ND 9%
Rochester, MN 6% GrandForks,ND 8%
St. Cloud, MN 6% Rochester, MN 7%
Table 4-2: Top Mentioned Destinations

Minnesota Intercity Bus Study 2014 4-5
(46 percent) followed by the cost (22 percent). Only one percent of long-distance travelers used an intercity bus service on their last trip, with the preferred mode being driving themselves or riding with others (87 percent). In fact, nearly all long-distance travelers who took the household survey (96 percent) have both a driver’s license and a vehicle available for their use, meaning that they could drive on trips. Respondents say theydrivebecauseitiseasy,convenient,andflexible,whereas they use other modes when these modes are faster.
Price is the number one reason that intercity bus passengers choose intercity buses (42 percent), followed by the unavailability of a personal vehicle (27 percent). Only 12 percent mentioned choosing an intercitybusbecauseofitsease,convenience,andflexibility.Servicechangestoaddressthese issues may help boost ridership in Minnesota.
A gap exists between the way in which current passengers and long-distance travelers in general perceive intercity bus service. More than half (54 percent) of passengers are satisfiedwiththecostofbusservice,whileonly22percentoflong-distancetravelershavea positive impression regarding the cost of bus service. Furthermore, while the speed of travel is seen as weakness of intercity bus travel, it is more of an issue for those not using buses. Only 12 percent of long-distance travelers rate intercity bus positively with regard to getting to a destination on time, compared to 36 percent of intercity bus passengers.
Q: HOW MUCH DO PASSENGERS VALUE INTERCITY BUS SERVICE?
A sizeable proportion of current customers are dependent on the intercity bus system. About three in ten current customers would not make the trips they made if not for intercity bus service, and 87 percent said they will consider using intercity bus services in again in thefuture.Lessthanhalf(47percent)ofcurrentpassengershaveadriver’slicenseandavehicle available for their trip, and 12 percent say this is their only available transportation.
Reasons for Using Intercity Bus Intercity Bus Passengers
Price / Cheaper Than Other Options 42%
Don’tDrive/HaveaCar 27%
Easier / Convenience 12%
Only Transportation Available / No Choice 12%
More Comfortable / Can Relax 6%
HasServicetoDestination 5%
Enjoy Ride / Scenery 4%
Table 4-3: Reasons for Using Intercity Bus
3% 8% 31% 57%
Would Not Consider
Might or Might Not Consider
Would Consider (87%)
Probably Would Consider DefinitelywouldConsider
Chart 4-5: Intercity Bus Passengers: Future Consideration of Intercity Bus Travel

Minnesota Intercity Bus Study 20144-6
Q: HOW DOES INTERCITY BUS COMPARE WITH OTHER MODES?
One of the barriers to increasing intercity bus ridership is that it is simply not “top-of-mind” for travelers when they think of modes for longer distance travel. Whereas almost everyone (of the long-distance traveler household survey) thinks of a car (98 percent), and more than half (54 percent) think of air service, only 20 percent think of bus service.
Furthermore, almost no one can nameaspecificintercitybusservice without prompting.
Compared to its chief competition—the personal automobile—intercity buses appeal to a somewhat different demographic. Intercity bus passengers are more likely to have a lower income, be a minority, and make about half as many trips per year.
Q: WHAT WOULD MAKE NON-USERS MORE LIKELY TO CONSIDER INTERCITY BUS?
While the onboard research revealed a strong loyalty towards intercity bus travel, awareness and perceptions of intercity bus service among most Minnesota long-distance travelers were less favorable.
While only one percent of long-distance travelers used an intercity bus on their last trip, six in ten (60 percent) report having used an intercity bus at some point in the past, though most use buses less than once a year. Additionally, nearly seven in ten long-distance traveler households (68 percent) include someone who has taken a trip on an intercity bus before. Three in ten would consider using an intercity bus in the future (31 percent), though only13percentsaidtheydefinitelywouldconsiderdoingso.Thisfiguredropsfrom31to23 percent when looking at those who have never used an intercity bus in the past.
A gap analysis revealed that key areas of dissatisfaction with intercity bus include schedulingflexibilitywhentravelingandtheamountoftimeittakestogettothedestination. Additionally, when asked what would make them more likely to consider
Chart4-6:LongDistanceTravelers:LongDistanceTripMode Awareness
Chart4-7:LongDistanceTravelers:Past Usage of Intercity Bus
98%
54%
23% 20%0%
20%
40%
60%
80%
100%
Car Plane Train Intercity Bus

Minnesota Intercity Bus Study 2014 4-7
intercity buses in the future, long-distance travelers most often cited intercity bus schedules and performance (41 percent) and improved costs (15 percent).
Specificscheduleandrouteimprovementsdesiredbylong-distancetravelersinclude:
• Moreroutes/destinations—14percent
• Morefrequency/morethanonceaday—12percent
• Fasterservice/lowertraveltime—9percent
Q: HOW DO INTERCITY BUS PASSENGERS USE THE BUS?
Among the passengers surveyed for the study, 76 percent are traveling alone, compared to 85 percent of all travelers. Fifty-eight percent of intercity bus passengers travel a few times peryearbybus,and19percentusethebusatleastonceamonth.Passengersfindoutabout the service from a recommendation (39 percent) or the Internet (29 percent). They maintaintheirrelationshipbyvisitingthebuscompanywebsite(57percent),thoughfirsttime or light users are more likely to buy a ticket at a station while heavy users are more likely to purchase their ticket online.
Q: HOW SATISFIED ARE CURRENT INTERCITY BUS PASSENGERS?
Nearlynineinten(87percent)ofintercitybuspassengersmentionedthattheydefinitelyor probably would consider using the service again, and 57 percent rate intercity bus serviceasa9or10where10isverysatisfied.SatisfactionwithintercitybusservicevariedbetweenthoseridingontheMnDOTsubsidizedroutesandthosecustomerson
Have Traveled on Intercity Buses Themselves 60%
Haven't Traveled on Intercity Buses Themselves 39%
Once a Month or
More5%
Once Every Two to Three
Months2%
A Few Times a Year
4%
About Once a Year6%
Less than Once a Year
42%
Q: HOW DOES INTERCITY BUS COMPARE WITH OTHER MODES?
One of the barriers to increasing intercity bus ridership is that it is simply not “top-of-mind” for travelers when they think of modes for longer distance travel. Whereas almost everyone (of the long-distance traveler household survey) thinks of a car (98 percent), and more than half (54 percent) think of air service, only 20 percent think of bus service.
Furthermore, almost no one can nameaspecificintercitybusservice without prompting.
Compared to its chief competition—the personal automobile—intercity buses appeal to a somewhat different demographic. Intercity bus passengers are more likely to have a lower income, be a minority, and make about half as many trips per year.
Q: WHAT WOULD MAKE NON-USERS MORE LIKELY TO CONSIDER INTERCITY BUS?
While the onboard research revealed a strong loyalty towards intercity bus travel, awareness and perceptions of intercity bus service among most Minnesota long-distance travelers were less favorable.
While only one percent of long-distance travelers used an intercity bus on their last trip, six in ten (60 percent) report having used an intercity bus at some point in the past, though most use buses less than once a year. Additionally, nearly seven in ten long-distance traveler households (68 percent) include someone who has taken a trip on an intercity bus before. Three in ten would consider using an intercity bus in the future (31 percent), though only13percentsaidtheydefinitelywouldconsiderdoingso.Thisfiguredropsfrom31to23 percent when looking at those who have never used an intercity bus in the past.
A gap analysis revealed that key areas of dissatisfaction with intercity bus include schedulingflexibilitywhentravelingandtheamountoftimeittakestogettothedestination. Additionally, when asked what would make them more likely to consider
Chart4-6:LongDistanceTravelers:LongDistanceTripMode Awareness
Chart4-7:LongDistanceTravelers:Past Usage of Intercity Bus

Minnesota Intercity Bus Study 20144-8
theunsubsidizedroutes,eventhoughtheservicesareprovidedbythesamefirmsusingthesameequipment(andthereisnoidentificationofservicesasbeingsubsidizedorunsubsidized). One theory is that the lower loads on the subsidized routes result is less crowding and thus greater satisfaction. Another difference in overall satisfaction was that passengers55andoveraremorelikelytobesatisfiedwiththeservice,andaremorelikelyto recommend it to others.
Overall, among passengers the areas of high satisfaction included:
• Driverprofessionalism
• Heating/airconditioning
• Availabilityofluggagespace
• Purchasingaticket
Areas of lower satisfaction included:
• Frequency
• Amountoftimeittakestogettothedestination
• AvailabilityofWi-Fiandpoweroutletsonthebuses
Q: WHAT HAS CHANGED SINCE THE 2010 MINNESOTA INTERCITY BUS NETWORK STUDY?
A similar survey was conducted in 2008 for the 2010 Minnesota Intercity Bus Network Study. Comparing the results of this survey with the earlier data revealed that passengers are generally older and less likely to be students. Passengers are more likely to have a college education than in the past (19 percent vs. 10 percent). The median income of passengers was lower, $28,000 in 2013 as compared to $40,000 in 2008. However, in 2013 a lower percentage of passengers were dependent on intercity bus (31 percent vs.47percent).Manyofthesedifferencesreflectthefactthatthe2013surveyswereconducted on weekdays in late August, after summer vacation travel and before the beginning of the academic year. This likely resulted in fewer students (who are younger, have higher family incomes, have fewer options, and have not yet received their college degrees). One other area of difference between the two surveys is an apparent increase in connectivity. More passengers in 2013 used public transportation to reach intercity bus services (10 percent) as compared to 2008 (6 percent), and more passengers are making connections with other intercity services (13 percent compared to 3 percent).

Minnesota Intercity Bus Study 2014 4-9
SUMMARY
The surveys highlighted that areas of dissatisfaction with intercity bus service are frequency of service, the amount of time it takes to get to destinations, and availability of power outlets/Wi-Fi. While the passenger survey and long-distance traveler household surveyresultsreflectgreatlyvaryingexperiencesandperceptions,keyissuesemergedthat could help improve the performance of intercity buses in Minnesota in the future:
• Theamountoftimeittakestogettodestinationsisveryimportanttobothridersand residents. Adding express service may increase interest in intercity bus travel, as 52 percent of passengers said that they would be very or somewhat likely to consider an express bus if it cost 30 percent more.
• WhilemostMinnesotanstravelwithinthestateortoothernearbystates,intercitybus as a travel mode comes to mind for very few. Increasing awareness of intercity bus may help to increase ridership, as for many, intercity bus is not in their consideration set and the default is to travel by car.


Minnesota Intercity Bus Study 2014 5-1
The MnDOT S. 5311(f) program and its implementation are the focus of this chapter. A brief program overview reveals that, since 2010, changes have included the use of state funding to offset local match, the use of capital for vehicle purchases, and the elimination of funding for planning studies conducted by grant subrecipients. The chapter also evaluates the federal FY 2013 network in terms of multiple performance measures. It identifies network gaps and potential new routes, estimating ridership and performance. The analysis leads to recommended services and policy alternatives for Minnesota’s S. 5311(f) program, included in Chapter 6.
Minnesota’s Intercity Bus Program
Minnesota is involved with intercity bus services in several ways, primarily through the implementation of the S. 5311(f) program. MnDOT’s Office of Transit provides grant funding through a competitive review process in which a designated committee selects projects from submitted applications. The Office of Transit manages the S. 5311(f) rural intercity bus program as part of its overall management of the S. 5311 program.
PROGRAM HISTORY
Minnesota’s use of S. 5311 funding for rural intercity bus service under the S. 5311(f) program began following MnDOT’s 1997-98 study of rural intercity bus needs. Since the program’s inception, MnDOT has funded operating assistance projects each year. Initially both Greyhound and Jefferson Lines participated, implementing a number of different schedules and routes over time in an attempt to serve many of Minnesota’s smaller towns. As noted in Chapter 1, S. 5311(f) funding requires a non-federal match of 50 percent of the net operating deficit of operating projects, and 20 percent for capital projects. Historically, MnDOT did not provide any state funding for local operating match, but instead required that applicant carriers provided the required cash match.
Chapter 5
PROGRAM OVERVIEW AND NETWORK EVALUATION

Minnesota Intercity Bus Study 20145-2
The operating assistance program faced its greatest challenge in August 2004, when Greyhound restructured its services in the north central region of the country, dropping all of its S. 5311(f) funded services. MnDOT contacted its other S. 5311(f) grantee, Jefferson Lines, who agreed to provide service on the Greyhound routes under six month contracts. Jefferson service started immediately after the end of Greyhound service, with additional marketing. For a number of years Jefferson provided all of the required local cash match, which is very unusual for a private for-profit company.
The other major change in the operating assistance part of the program was MnDOT’s decision to allow applicants to utilize the value of in-kind miles as local match for a number of projects since the 2010 study. As described in Chapter 1, under the S. 5311(f) program the federal share of funding is limited to a maximum of 50 percent of the net operating deficit (operating cost less any fares or other revenue). The remaining 50 percent of the deficit must be funded from non-federal sources. In 2007 FTA began a pilot project that permitted states to redefine S. 5311(f) projects so as to combine rural intercity bus route segments requiring S. 5311(f) operating subsidy together with connecting unsubsidized intercity bus service. The combined project includes the costs, revenues, and subsidy requirements of both segments. Under current FTA guidance, up to 50 percent of the value of the fully allocated operating costs of the unsubsidized segment can be counted as in-kind operating match. In a practical sense, projects can be designed in such a way that the entire net deficit is funded with federal dollars, eliminating the need for local cash operating match. MnDOT has permitted the use of this funding method for several years. A number of routes operated by Jefferson Lines shifted to this funding method, using as in-kind match the value of connecting unsubsidized Jefferson Lines services.
Prior to FY 2014 MnDOT did not provide any portion of the local match for S. 5311(f) operating projects. However, for SFY 2014, MnDOT provided state match to cover the non-federal 50 percent of the net operating deficit, rather than utilizing either carrier cash match or in-kind match (Jefferson Lines provided 50 percent cash match on two routes through SFY 2014). This was to enable the state to utilize unspent funding from previous fiscal years that had been obligated using the standard S. 5311 funding ratios (rather than the in-kind match method). The change should be regarded as a one-time adjustment in program policy to address grants management issues; though MnDOT is considering the continued use of state funding as a means to incentivize program participation. It should be noted that the previous study recommended that MnDOT consider the use of state funds for operating match in the event that in-kind miles are not sufficient, as it makes the intercity program more consistent with funding for local rural transit.

Minnesota Intercity Bus Study 2014 5-3
Over time, MnDOT’s S. 5311(f) program has also funded a number of capital projects, including facilities, maintenance, and vehicles. One early project that resulted in a federal policy change was the use of S. 5311(f) funding for a portion of the Hawthorne Transportation Center. MnDOT persuaded FTA to allow the use of this funding for a project in an urbanized area because the project serves residents who use rural intercity services to the station. The FTA program guidance now allows the use of S. 5311(f) on projects in urbanized areas in proportion to their use by rural riders.
Other capital projects have included funding to Jefferson Lines for vehicle rehabilitation, and to Greyhound Lines to retrofit over-the-road buses with wheelchair lifts to aid in compliance with Americans with Disabilities Act (ADA) requirements. In 2010 MnDOT provided capital funding for a number of vehicles under the ARRA stimulus program. In SFY 2012-13, regular (non-ARRA) 5311(f) money was used to purchase three mid-size cutaways for the operation of Jefferson Line’s non-urbanized services.
The program has also funded marketing efforts for intercity bus, including route specific marketing elements of operating assistance projects, and other marketing studies
PROGRAM PURPOSE AND OBJECTIVES
The S. 5311(f) program purpose follows guidance as included in FTA Circular 9040.1F. The national program objectives of supporting meaningful connections, services that address the intercity needs of residents in non-urbanized areas, and the infrastructure of the intercity bus network are included as objectives in the Minnesota program. Another program objective in Minnesota is to promote the maximum feasible coordination of intercity bus services with local public transit and other modes to provide intercity mobility throughout the state. These objectives fit within broader MnDOT goals as well as the performance measures discussed later in the chapter. The following types of projects are eligible under the MnDOT S. 5311(f) program.
Operating assistance:
• Up to 50 percent federal share of operating deficit on new or existing intercity routes, with 50 percent local or private match.
Intercity Bus and ADA Accessibility
Following the passage of the Americans with Disabilities Act of 1990, private firms
operating over-the-road buses (OTRBs) faced different federal accessibility regulations than
public operators. Some confusion existed regarding private firms that operated on
behalf of the state. However, the latest S. 5311 program guidance issued under MAP-21 (Proposed Circular 9040.1G) indicates that all vehicles used to provide FTA-funded intercity
bus service (by a public entity or under contract to a public entity) must be accessible to and usable by individuals with disabilities,
including those in wheelchairs (p. VIII-8).
In addition, all non-S. 5311 fixed route/schedule intercity service operated with
OTRBs by large firms (based on revenue) has to be accessible as of October 2012.
Service operated by small mixed service firms operating OTRBs (i.e. firms with less than 25 percent fixed route services) can still follow a
48 hour advanced notice requirement.

Minnesota Intercity Bus Study 20145-4
• Up to 100 percent of operating deficit on new or existing intercity routes, using in-kind local match, based on the capital value of unsubsidized connecting intercity routes.
• Up to 50 percent federal share of operating deficit on new or existing intercity routes, with up to 50 percent state match.
Capital assistance at a ratio of 80 percent federal and 20 percent state/local share for:
• Purchase or enhancement of intercity bus vehicles.
• Construction or enhancement of intercity bus facilities.
• Passenger amenities.
• Technology supporting intercity bus customer service or operations.
• Other operations and maintenance equipment.
Marketing assistance with up to 80 percent federal share, with a 20 percent state/local match. Potential projects could include advertising, traditional passenger information, local coordination activities, or mobility management.
Requests for operating assistance continue to require locally specific marketing activities regardless of whether assistance for a full marketing and/or market research project is the subject of the application. Operating assistance projects require the carrier to fully define the service in terms of frequencies, days of service, schedules, and stops. A route-specific marketing plan is strongly encouraged. The applicant must project costs and revenues for the route, estimate its net operating deficit, and identify the source of the operating match.
AVAILABLE FUNDING
As described in Chapter 1, the S. 5311(f) program sets aside a minimum of 15 percent of each state’s S. 5311 formula allocation for rural intercity bus assistance. Based on Minnesota’s overall program, Table 5-1 presents the S. 5311(f) amounts for recent years.
Federal FY S. 5311 (total) S. 5311(f)
2010 $ 12,704,164 $ 1,905,625
2011 $ 12,751,576 $ 1,912,736
2012 $ 12,767,441 $ 1,915,116
2013 $15,256,471 $2,288,471
Table 5-1: S. 5311(f) Federal Appropriations

Minnesota Intercity Bus Study 2014 5-5
ELIGIBLE APPLICANTS
Entities eligible to submit a project application include private, for-profit intercity carriers; private, non-profit intercity carriers; local transit providers; and public bodies proposing to provide intercity bus service. Each entity type is required to submit documentation that supports their legal status.
Carriers must hold the appropriate operating authority or be in compliance with Federal Motor Carrier Regulations by the time that a project commences (for FY 2014, this was July 1, 2013). The S. 5311(f) application includes this requirement, but does not provide any further guidance as to the appropriate operating authority or sources for further information on compliance with this requirement.
CONSULTATION AND TECHNICAL ASSISTANCE
MnDOT provides technical assistance to intercity carriers completing the S. 5311(f) application. Other MnDOT duties include facilitating coordination, preparing a statewide comprehensive application for FTA, conducting ongoing evaluations, and monitoring project results. Changes in this process since the previous study include the implementation of an annual workshop for applicants and an industry consultation, conducted at least every four years as called for by FTA requirements. The application now notes that the availability of in-kind match requires letters of support from operators of the unsubsidized connecting service, if the unsubsidized service provider is different from the applicant.
PROJECT REVIEW AND PERFORMANCE PERIOD
The Office of Transit conducts a preliminary review of submitted applications to determine their completeness. The intercity review committee then ranks the applications in order of funding importance. The most recent application was for the SFY 2014 period beginning July 1, 2013. In previous program years performance periods had stretched to as many as three fiscal years between application cycles. The next performance period will be 18 months in duration, from July 1, 2014 through December 31, 2015.
CERTIFICATION OF RURAL INTERCITY NEEDS
In May 2013 for the first time Minnesota filed a certification letter stating that it did not need to spend the full 15 percent of the total S. 5311 allocation for rural intercity projects.

Minnesota Intercity Bus Study 20145-6
Unspent S. 5311(f) funding had accumulated in MnDOT accounts, despite having an active program that addressed all the previously identified needs and valid applications. In part this occurred because some projects were slow to start, and because actual operating deficits were less than expected leaving obligated but unspent project balances. Table 5-2 presents recent federal and state amounts obligated and expended for the program.
CURRENT PROGRAM OF PROJECTS
Table 5-3 presents a summary of the projects funded in the most recent grant year (SFY 2014) showing the applicant, routes, and amount of funding. At each program solicitation, MnDOT may receive a number of individual project applications to be evaluated in terms of the state’s overall transportation goals and the program objectives. In that sense there is need to evaluate individual projects, both existing projects that are candidates for continuation, and potential new projects. Also, as noted above, MnDOT periodically conducts the required consultation process in order to determine whether there are unmet rural intercity needs—evaluating the overall network and the role of the S. 5311(f) program in adequately addressing these needs. Although the program has goals and objectives, in the past it has not used performance measures to assess the either individual projects or the overall program. The next section identifies potential performance measures.
Contract Start
Contract End
Federal Share State ShareOperating Capital Marketing Operating Capital Marketing
Obligated 1/1/09 6/30/11 $ 2,593,580 $ 1,203,920 $ 556,160 $0 $0 $0
Expended 1/1/09 6/30/11 $1,333,968 $1,203,920 $692,369 $0 $0 $0
Obligated 7/1/11 6/30/12 $ 1,054,831 $0 $ 391,060 $0 $0 $0
Expended 7/1/11 6/30/12 $916,657 $0 $354,356 $0 $0 $0
Obligated 7/1/11 6/30/13 $0 $ 864,000 $0 $0 $0 $0
Expended 7/1/11 6/30/13 $0 $428,555 $0 $0 $0 $0
Obligated 7/1/11 6/30/13 $ 1,273,904 $0 $ 453,600 $0 $0 $0
Expended 7/1/11 6/30/13 $1,155,057 $0 $409,279 $0 $0 $0
Obligated 4/1/13 5/15/13 $0 $0 $0 $0 $ 63,942 $0
Expended 4/1/13 5/15/13 $0 $0 $0 $0 $ 63,942 $0
Obligated 7/1/13 6/30/14 $ 999,300 $ 675,440 $ 591,600 $ 826,500 $0 $ 2,560
Expended 7/1/13 6/30/14 NA NA NA NA NA NA
Table 5-2: Federal and State S. 5311(f) Funding Obligations and Actual Expenditures
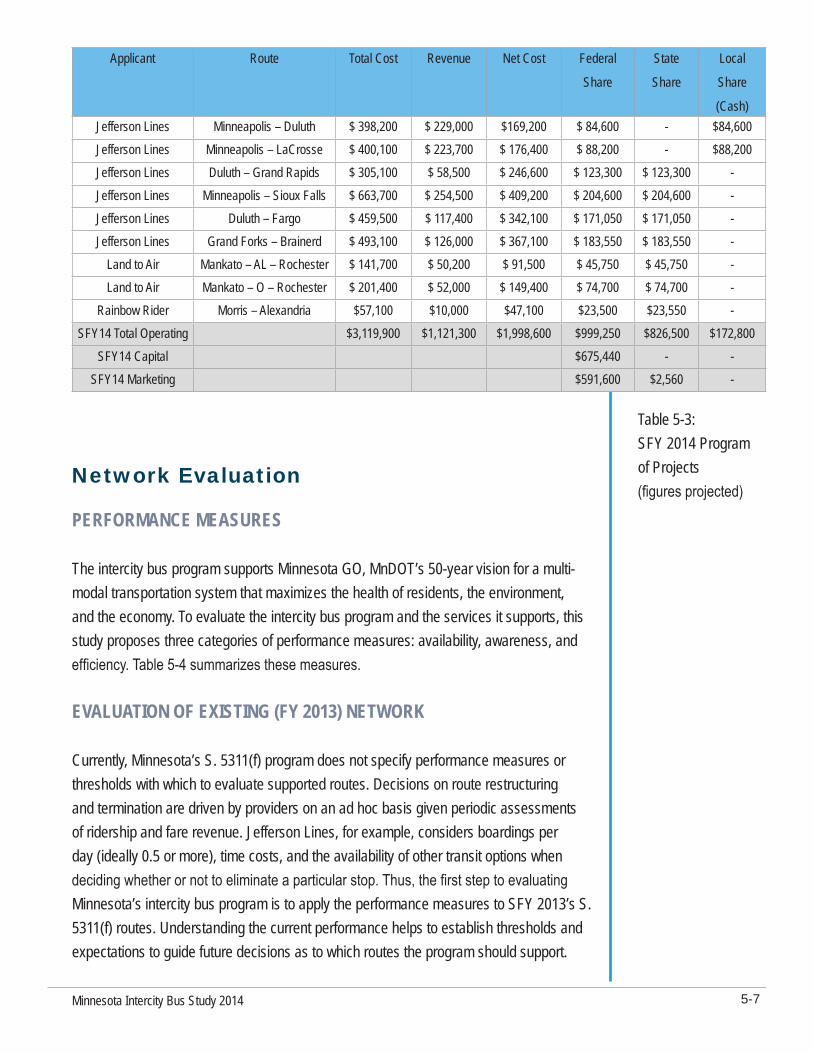
Minnesota Intercity Bus Study 2014 5-7
Applicant Route Total Cost Revenue Net Cost Federal
Share
State
Share
Local
Share
(Cash)Jefferson Lines Minneapolis – Duluth $ 398,200 $ 229,000 $169,200 $ 84,600 - $84,600Jefferson Lines Minneapolis – LaCrosse $ 400,100 $ 223,700 $ 176,400 $ 88,200 - $88,200Jefferson Lines Duluth – Grand Rapids $ 305,100 $ 58,500 $ 246,600 $ 123,300 $ 123,300 -Jefferson Lines Minneapolis – Sioux Falls $ 663,700 $ 254,500 $ 409,200 $ 204,600 $ 204,600 -Jefferson Lines Duluth – Fargo $ 459,500 $ 117,400 $ 342,100 $ 171,050 $ 171,050 -Jefferson Lines Grand Forks – Brainerd $ 493,100 $ 126,000 $ 367,100 $ 183,550 $ 183,550 -
Land to Air Mankato – AL – Rochester $ 141,700 $ 50,200 $ 91,500 $ 45,750 $ 45,750 -Land to Air Mankato – O – Rochester $ 201,400 $ 52,000 $ 149,400 $ 74,700 $ 74,700 -
Rainbow Rider Morris – Alexandria $57,100 $10,000 $47,100 $23,500 $23,550 -SFY14 Total Operating $3,119,900 $1,121,300 $1,998,600 $999,250 $826,500 $172,800
SFY14 Capital $675,440 - -SFY14 Marketing $591,600 $2,560 -
Network Evaluation
PERFORMANCE MEASURES
The intercity bus program supports Minnesota GO, MnDOT’s 50-year vision for a multi-modal transportation system that maximizes the health of residents, the environment, and the economy. To evaluate the intercity bus program and the services it supports, this study proposes three categories of performance measures: availability, awareness, and efficiency. Table 5-4 summarizes these measures.
EVALUATION OF EXISTING (FY 2013) NETWORK
Currently, Minnesota’s S. 5311(f) program does not specify performance measures or thresholds with which to evaluate supported routes. Decisions on route restructuring and termination are driven by providers on an ad hoc basis given periodic assessments of ridership and fare revenue. Jefferson Lines, for example, considers boardings per day (ideally 0.5 or more), time costs, and the availability of other transit options when deciding whether or not to eliminate a particular stop. Thus, the first step to evaluating Minnesota’s intercity bus program is to apply the performance measures to SFY 2013’s S. 5311(f) routes. Understanding the current performance helps to establish thresholds and expectations to guide future decisions as to which routes the program should support.
Table 5-3: SFY 2014 Program of Projects (figures projected)

Minnesota Intercity Bus Study 20145-8
Category Measure FY 13 Status Benchmark/ThresholdAvailability Number of non-urbanized
communities with stops56 communities Maintain or increase
Availability % population within 10 or 25 miles of an intercity stop
10 miles: 79% 25 miles: 95%
Maintain or increase
Availability Frequency of S. 5311(f) service as a % of network miles
< 7 RTs/wk: 17% 7 RTs/wk: 73% > 7 RTs/wk: 9%
At least daily service for all trunk routes; maintain or increase for
regional feeders
Awareness % population aware of intercity bus service
Household survey: 20%
Maintain or increase, based on annual omnibus survey
Efficiency Annual passenger boardings per capita, non-urbanized communities
Average and median: 0.07
Maintain or increase individual stop rates
Efficiency S. 5311(f) farebox recovery ratio by route
Average: 44% Median: 33%
40% or more for trunk routes, 20% or more for regional feeders
Efficiency Boardings per subsidized trip Average: 9 Median: 11
10 or more for trunk routes, 3 or more for regional feeders
NUMBER OF NON-URBANIZED COMMUNITIES WITH INTERCITY BUS STOPS
The number of communities with intercity bus stops is a measure of service availability. Currently, 67 communities across the state have intercity stops. Seven of these places have multiple stops (Crookston, Duluth, Minneapolis, Rochester, St. Cloud, St. Paul, and Winona). Of the 67 total communities, 56 are outside of an urbanized area of more than 50,000 in population. As MnDOT considers its S. 5311(f) projects, it should use 56 non-urbanized communities as a threshold to either maintain or increase.
PERCENTAGE OF THE POPULATION IN PROXIMITY TO AN INTERCITY STOP
The percentage of the population within a certain distance of both S.5311(f) and non-subsidized bus stops conveys intercity bus availability in terms of geographic coverage. In rural areas especially, 10 to 25 miles is a reasonable distance for residents to access the network.1 As of Census 2010, 79 percent of the Minnesota population lived within 10 miles of a Minnesota intercity stop. About 95 percent lived within 25 miles. These percentages
1 The 10 and 25 mile distances are based on Minnesota-specific findings and national industry assumptions. US DOT’s Research and Innovative Technology Administration (RITA), Bureau of Transportation Statistics (BTS) defines a “reasonable coverage radius” for intercity bus stations as 25 miles. Also, the household surveys discussed in Chapter 4 found that roughly half of Minnesotans live with ten miles of an intercity bus stop. See Scheduled Intercity Transportation: Rural Service Areas in the U.S. www.rita.dot.gov/bts/sites/rita.dot.gov.bts/files/publications/scheduled_intercity_transportation_and_the_us_rural_population/index.html.
Table 5-4: Intercity Bus Performance Measures

Minnesota Intercity Bus Study 2014 5-9
only increase when including stops very close to the Minnesota border like La Crosse and Grand Forks, indicating widespread intercity coverage. MnDOT should review future service changes with the goal of staying at or above these thresholds.
FREQUENCY OF S. 5311(F) SERVICE AS A PERCENTAGE OF NETWORK MILES
Another performance measure for the S. 5311(f) program is the availability of intercity bus service, specifically service frequency. The S. 5311(f) route network covers approximately 1,500 route miles (not accounting for trip frequency or double counting where multiple routes run on one road segment). Similar to the entire network, the majority of those miles have a service frequency of seven round trips per week. However, none of the subsidized route miles have frequencies greater than 21 round trips per week. Ensuring that all S. 5311(f) routes with an origin or destination in the Twin Cities have at least daily service is an appropriate frequency threshold. Additional frequency may be appropriate given demand.
Round Trips/ Week Total MN Route Miles S. 5311(f) Route Miles<7 287 13% 252 17%7 1,291 59% 1,063 73%
8 to 21 441 20% 131 9%22 to 55 159 7% 0 0%
>56 27 1% 0 0%TOTAL 2,205 100% 1,447 100%
PERCENTAGE OF THE POPULATION AWARE OF INTERCITY BUS SERVICE
Awareness of intercity services is critical to grow ridership and attract new customers. The household survey discussed in Chapter 4 found that, for many Minnesotans, intercity bus service is not in their consideration set as a means of long distance travel. Only 20 percent of residents mentioned intercity bus as a mode that came to mind. In the future, MnDOT will use its annual omnibus survey, a representative survey of Minnesota residents on a variety of transportation-related issues, to ask two questions on intercity bus:
Q: Are you aware of any inter-city bus service between your city and other Minnesota cities? [Yes, No, Not sure]
Q: Has someone in your household ridden an inter-city bus in the past year? [Yes, No, Not sure]
Table 5-5: Frequency of Service by Route Mile

Minnesota Intercity Bus Study 20145-10
The next omnibus survey will take place early in 2014. MnDOT may choose to use only that instrument for long-term tracking of awareness, due to slight differences in the presentation and wording of the omnibus and household surveys. However, this study’s results still serve as a useful snapshot of the public’s current awareness of intercity bus.
ANNUAL PASSENGER BOARDINGS PER CAPITA, NON-URBANIZED COMMUNITIES
Annual boardings on S. 5311(f) routes as a percentage of Minnesota’s rural population also indicate the productivity of the program. In SFY 2013, a total of 56,307 passenger boardings occurred on the S. 5311(f) routes (with 2 months of data for Jefferson Lines’ 919/920 route). This was about 6 percent of the 2010 non-urbanized area population within 10 miles of a non-urbanized area intercity bus stop. It was about three percent of the non-urbanized area population within 25 miles.
Shown in Appendix I (Table I-1), the average and median trip rates (boardings per capita) for stops on S. 5311(f) routes in FY 2013 were both 0.07. Going forward, stops falling below their FY 2013 trip rate should be reviewed to determine if there are potential actions that might be implemented to improve ridership. If either no actions can be identified or if following implementation ridership continues at that level or below, the carrier would be permitted to eliminate the stop.
FAREBOX RECOVERY RATIO
Farebox recovery is the ratio of fares collected to total operating costs. A high ratio indicates a market for intercity bus services and riders’ willingness to pay for the service. It also reflects the degree to which providers are minimizing operating costs. Because routes serving areas of low population cannot be expected to have the same farebox as those routes serving higher density locations, this evaluation proposes a three tier route classification:
1. Unsubsidized routes
2. S. 5311(f) “trunk routes” with an origin or destination in the Twin Cities
3. S. 5311(f) “regional feeders” that do not have and origin or destination in the Twin Cities
Each tier has a different farebox recovery threshold. For the purposes of the S. 5311(f) program, trunk routes should reach a farebox recovery ratio of at least 40 percent, and regional feeders should have a farebox of at least 20 percent. Routes with farebox ratios falling below their classification threshold should be evaluated for improvement, and if

Minnesota Intercity Bus Study 2014 5-11
farebox recovery continues at levels below these thresholds following improvement actions, funding for continued service would be considered for elimination.
In FY 2013, farebox recovery on the S. 5311(f) routes ranged from 5 percent to 77 percent, with an average of 44 percent and a median of 33 percent (see Appendix I, Table I-2). Of those with an origin or destination in the Twin Cities (trunk routes), only Jefferson Lines’ Red Wing route (since terminated) had a farebox recovery ratio less than the proposed 40 percent threshold. Of the regional feeder routes, Jefferson Lines’ Duluth–Grand Rapids route and Land to Air’s Owatonna–Mankato route did not meet the 20 percent threshold. However, the Jefferson route had only just been launched, and new services typically take a least two years to achieve their ridership potential. The Land to Air route has since been extended to Rochester, likely impacting its performance.
BOARDINGS PER SUBSIDIZED VEHICLE TRIP
Boardings per trip offer a sense of route level productivity by dividing the total annual passengers by the total annual trips for each S. 5311(f) route. As seen in Appendix I (Table I-2) boardings per trip on Minnesota’s S. 5311(f) routes ranged from 23 on Jefferson Lines’ Minneapolis–Milwaukee route to only 0.3 on Land to Air’s Owatonna–Mankato route in FY 2013. However, as noted under the farebox recovery measure, the Land to Air route’s extension to Rochester has likely impacted its performance. As in the case of farebox recovery, there are distinct tiers of service that should be reflected in evaluation. Using the same classification structure, the following thresholds for boardings per trip are recommended:
• S. 5311(f) trunk routes: 10 boardings per trip
• S. 5311(f) regional feeders: 3 boardings per trip
In the future, MnDOT should review and consider service modifications for routes with productivity below these levels (after they have been in operation for two years). In their first year, routes should achieve at least half of the target levels.
NETWORK GAPS
In addition to evaluating the existing S. 5311(f) network in terms of performance measures, it is also important to identify network gaps based on the demographic analysis of Chapter 3. The first step was identifying the places classified as having a high relative density or percentage of transit dependence. Twenty-four of these places are currently unserved by
Boardings Per Trip, SFY 2013 S. 5311(f)- Average: 9 Median: 11
Boardings Per Trip, Trunk Routes Only- Average: 13 Median: 12
Boardings Per Trip, Regional Feeders Only- Average: 5 Median: 3

Minnesota Intercity Bus Study 20145-12
the intercity network (see Figure 5-1). As shown in Appendix I, Table I-3, an annual number of intercity bus trips was then estimated for each candidate location. The estimated trips for many of the candidates was very low, as little as 71 trips for Onamia. However, the initial list is inclusive, as some of the lower ridership places could be tied to other locations along a route, for example, a connection from Duluth to Two Harbors and Silver Bay.
Another consideration was the distance of the candidate location from existing intercity bus stops. Again, places with lower ridership estimates may still be candidates for service if they are on existing routes (e.g. Kasson, Le Sueur, or Melrose), as the incremental cost of adding a stop is low. In addition, greater distances (e.g. more than 25 miles from a stop) mean more limited access for residents and may warrant expanded service. Some of the candidate locations were formerly intercity stops (e.g. Hastings, Red Wing, New Ulm, Cambridge, Lake City, and Park Rapids). Given their history and past attempts at service, these places may or may not justify restored service.
PERFORMANCE POTENTIAL OF UNSERVED CORRIDORS
The next step was to detail existing local transit connections at the candidate locations and analyze their feasibility. Seven of the 24 places had a reasonable local weekday connection, involving less than two hours of wait time. However, only one location had a weekend connection, when the highest volume of intercity bus travel tends to occur.
Though the evaluation of candidate locations revealed some potential new route corridors, it also highlighted the extensive coverage of the current intercity bus network. Unlike other states, intercity bus in Minnesota largely serves key regional destinations and trip generators. Thus, in addition to proposing new corridors or additional stops, another possibility is to strengthen or create local transit connections at existing intercity stops. This step of the evaluation looked at all the intercity stops and calculated the number of trips potentially generated by local transit transfers. The estimates were based on Chapter 4’s household survey findings that approximately 10 percent of intercity bus riders transfer from local transit. None of the existing stops can be expected to benefit from more than 212 annual local transit trips (see Appendix I, Table I-4). These low estimates suggest that bolstering local transit connections must be done in a targeted manner.
Because the network gap analysis resulted in the identification of candidate stop locations rather than routes, a subsequent phase involved the development of hypothetical routes. As a preliminary assessment of feasibility, the TCRP 147 Rural Intercity Demand Toolkit was used to estimate ridership for the potential routes (see Appendix J for a thorough
Red Wing
Buffalo
Farmington
Hastings
New Ulm
Silver Bay
Ely
Cambridge
Park Rapids
Le Sueur
Aurora
Windom
Kasson
Melrose
Benson
International Falls
Thief River Falls
Two Harbors
Sleepy Eye
Princeton
New Prague
Onamia
Twin Valley
Lake City
Morris
Walker
Mankato
Jackson
Erskine
Virginia
Owatonna
St. Peter
St. Cloud
Pine City
Faribault
Northfield
Monticello
Hackensack
Burnsville
Alexandria
Forest Lake
M I N N E S O T A
W I S C O N S I N
I O W A
S O U T H D A K O T A
N O R T H D A K O T A
ONTARIO
ONTARIO
0 25 50 Mi
Candidates
UZAs
2013 Routes
Existing ICB stop
10 mile stop buffer
25 mile stop buffer
Figure 5-1: Candidate Intercity Bus Stop Locations

Minnesota Intercity Bus Study 2014 5-13
the intercity network (see Figure 5-1). As shown in Appendix I, Table I-3, an annual number of intercity bus trips was then estimated for each candidate location. The estimated trips for many of the candidates was very low, as little as 71 trips for Onamia. However, the initial list is inclusive, as some of the lower ridership places could be tied to other locations along a route, for example, a connection from Duluth to Two Harbors and Silver Bay.
Another consideration was the distance of the candidate location from existing intercity bus stops. Again, places with lower ridership estimates may still be candidates for service if they are on existing routes (e.g. Kasson, Le Sueur, or Melrose), as the incremental cost of adding a stop is low. In addition, greater distances (e.g. more than 25 miles from a stop) mean more limited access for residents and may warrant expanded service. Some of the candidate locations were formerly intercity stops (e.g. Hastings, Red Wing, New Ulm, Cambridge, Lake City, and Park Rapids). Given their history and past attempts at service, these places may or may not justify restored service.
PERFORMANCE POTENTIAL OF UNSERVED CORRIDORS
The next step was to detail existing local transit connections at the candidate locations and analyze their feasibility. Seven of the 24 places had a reasonable local weekday connection, involving less than two hours of wait time. However, only one location had a weekend connection, when the highest volume of intercity bus travel tends to occur.
Though the evaluation of candidate locations revealed some potential new route corridors, it also highlighted the extensive coverage of the current intercity bus network. Unlike other states, intercity bus in Minnesota largely serves key regional destinations and trip generators. Thus, in addition to proposing new corridors or additional stops, another possibility is to strengthen or create local transit connections at existing intercity stops. This step of the evaluation looked at all the intercity stops and calculated the number of trips potentially generated by local transit transfers. The estimates were based on Chapter 4’s household survey findings that approximately 10 percent of intercity bus riders transfer from local transit. None of the existing stops can be expected to benefit from more than 212 annual local transit trips (see Appendix I, Table I-4). These low estimates suggest that bolstering local transit connections must be done in a targeted manner.
Because the network gap analysis resulted in the identification of candidate stop locations rather than routes, a subsequent phase involved the development of hypothetical routes. As a preliminary assessment of feasibility, the TCRP 147 Rural Intercity Demand Toolkit was used to estimate ridership for the potential routes (see Appendix J for a thorough
Red Wing
Buffalo
Farmington
Hastings
New Ulm
Silver Bay
Ely
Cambridge
Park Rapids
Le Sueur
Aurora
Windom
Kasson
Melrose
Benson
International Falls
Thief River Falls
Two Harbors
Sleepy Eye
Princeton
New Prague
Onamia
Twin Valley
Lake City
Morris
Walker
Mankato
Jackson
Erskine
Virginia
Owatonna
St. Peter
St. Cloud
Pine City
Faribault
Northfield
Monticello
Hackensack
Burnsville
Alexandria
Forest Lake
M I N N E S O T A
W I S C O N S I N
I O W A
S O U T H D A K O T A
N O R T H D A K O T A
ONTARIO
ONTARIO
0 25 50 Mi
Candidates
UZAs
2013 Routes
Existing ICB stop
10 mile stop buffer
25 mile stop buffer
Figure 5-1: Candidate Intercity Bus Stop Locations

Minnesota Intercity Bus Study 20145-14
explanation). Based on the Toolkit results, Figure 5-2 presents a map of the existing intercity network with the following seven potential intercity routes added.
• Thief River Falls – Crookston
• Thief River Falls – Erskine
• Virginia – International Falls
• Minneapolis – Grand Rapids via Rt. 169
• Minneapolis – Winona
• Silver Bay – Duluth
• Windom – Mankato
Appendix J, Tables I-5 and I-6, present the estimated ridership, operating costs, and revenues for the potential routes. The routes range in length from about 34 miles to almost 184. Estimated ridership ranges from 200 passengers annually on the Minneapolis–Aitkin–Grand Rapids route to almost 5,250 annually on the Minneapolis –Winona route. Assuming daily frequency, only the Minneapolis–Winona route meets the applicable boardings per trip performance measure threshold.
The projected farebox recovery levels of the potential routes range from one percent for the Duluth–Silver Bay route to 38 percent for the Minneapolis–Winona route. Again, only the latter approaches the 40 percent farebox recovery ratio threshold set for subsidized trunk routes. Net deficit per passenger ranges from $1,523 on the Minneapolis–Grand Rapids route to a low of $24 on the Minneapolis–Winona route.
Though the Minneapolis–Winona route appears to merit consideration based on the established performance measures, it is again important to note the availability of Amtrak service along that corridor. In addition, the Tri-Valley Heartland Express is currently studying the potential of a Thief River Falls–Crookston route. Thief River Falls is home to both the Sanford Medical Center and Northland Community and Technical College, which may add to projected ridership estimates. Chapter 6 will build on this network expansion analysis, recommending specific services and policies for MnDOT to pursue.
Red Wing
Buffalo
Farmington
Hastings
New Ulm
Silver Bay
Ely
Cambridge
Park Rapids
Le Sueur
Aurora
Windom
Kasson
Melrose
Benson
International Falls
Thief River Falls
Two Harbors
Sleepy Eye
Princeton
New Prague
Onamia
Twin Valley
Lake City
Morris
Walker
Mankato
Jackson
Erskine
Virginia
Owatonna
St. Peter
St. Cloud
Pine City
Faribault
Northfield
Monticello
Hackensack
Burnsville
Alexandria
Forest Lake
M I N N E S O T A
W I S C O N S I N
I O W A
S O U T H D A K O T A
N O R T H D A K O T A
ONTARIO
ONTARIO
0 25 50 Mi
Potential Route
CandidatesUZAs
2013 Routes
Existing ICB stop
10 mile stop buffer
25 mile stop buffer
Figure 5-2: Potential Intercity Routes

Minnesota Intercity Bus Study 2014 5-15
explanation). Based on the Toolkit results, Figure 5-2 presents a map of the existing intercity network with the following seven potential intercity routes added.
• Thief River Falls – Crookston
• Thief River Falls – Erskine
• Virginia – International Falls
• Minneapolis – Grand Rapids via Rt. 169
• Minneapolis – Winona
• Silver Bay – Duluth
• Windom – Mankato
Appendix J, Tables I-5 and I-6, present the estimated ridership, operating costs, and revenues for the potential routes. The routes range in length from about 34 miles to almost 184. Estimated ridership ranges from 200 passengers annually on the Minneapolis–Aitkin–Grand Rapids route to almost 5,250 annually on the Minneapolis –Winona route. Assuming daily frequency, only the Minneapolis–Winona route meets the applicable boardings per trip performance measure threshold.
The projected farebox recovery levels of the potential routes range from one percent for the Duluth–Silver Bay route to 38 percent for the Minneapolis–Winona route. Again, only the latter approaches the 40 percent farebox recovery ratio threshold set for subsidized trunk routes. Net deficit per passenger ranges from $1,523 on the Minneapolis–Grand Rapids route to a low of $24 on the Minneapolis–Winona route.
Though the Minneapolis–Winona route appears to merit consideration based on the established performance measures, it is again important to note the availability of Amtrak service along that corridor. In addition, the Tri-Valley Heartland Express is currently studying the potential of a Thief River Falls–Crookston route. Thief River Falls is home to both the Sanford Medical Center and Northland Community and Technical College, which may add to projected ridership estimates. Chapter 6 will build on this network expansion analysis, recommending specific services and policies for MnDOT to pursue.
Red Wing
Buffalo
Farmington
Hastings
New Ulm
Silver Bay
Ely
Cambridge
Park Rapids
Le Sueur
Aurora
Windom
Kasson
Melrose
Benson
International Falls
Thief River Falls
Two Harbors
Sleepy Eye
Princeton
New Prague
Onamia
Twin Valley
Lake City
Morris
Walker
Mankato
Jackson
Erskine
Virginia
Owatonna
St. Peter
St. Cloud
Pine City
Faribault
Northfield
Monticello
Hackensack
Burnsville
Alexandria
Forest Lake
M I N N E S O T A
W I S C O N S I N
I O W A
S O U T H D A K O T A
N O R T H D A K O T A
ONTARIO
ONTARIO
0 25 50 Mi
Potential Route
CandidatesUZAs
2013 Routes
Existing ICB stop
10 mile stop buffer
25 mile stop buffer
Figure 5-2: Potential Intercity Routes


Minnesota Intercity Bus Study 2014 6-1
The program recommendations presented in this chapter build upon the findings, research, and input documented in the previous chapters. The key findings are that Minnesota has a high level of intercity bus coverage, given the combination of the market-based services and those funded by MnDOT through the S. 5311(f) program. Survey findings reveal, however, that there is relatively little awareness of the available service.
This study’s technical advisory committee (TAC) provided significant input regarding potential changes to the program, based in part on their review of the findings and analysis, but also on their experience with other modes, services, and programs. In general, their consensus was that the primary focus of the program should be on maintaining the coverage of the existing statewide network and improving those aspects that involve customer contact and needs, developing the network rather than expanding it. A list of TAC members is included in Appendix K.
Program Options and Prioritization
Based on the TAC’s input and assessment, the program recommendations (each discussed in more detail below), in priority order, are:
1. Maintain the coverage of the current network,
2. Increase marketing and information efforts to raise awareness and usage,
3. Support intercity bus infrastructure by providing capital funding for vehicles, amenities, and passenger facilities, and
4. Allow limited service expansion.
In addition to the recommendations above, the TAC supported other program options at a lower priority. These included funding to replace carrier vehicles, fare reductions, use
Chapter 6
RECOMMENDATIONS

Minnesota Intercity Bus Study 20146-2
of intercity bus funding for transit connections, statewide signage, and new intercity bus routes.
The TAC recognized that improvements desired by intercity travelers who do not currently use intercity bus services may not be easily fulfilled by the MnDOT S. 5311(f) program, which is focused on providing service to rural communities. Under the current program, additional service frequency would add costs and reduce performance by spreading limited ridership over more trips—potentially to levels below the performance measures accepted by the TAC. The desire of intercity travelers for more stops or destinations was evaluated in Chapter 5, where it was determined that few unserved locations could be addressed by additional intercity bus routes while meeting minimum performance standards. Faster travel times can only be provided by eliminating stops and making services express. Since the desire is to maintain coverage and provide access from rural areas, this requires adding schedules that are express in addition to local services. Adding schedules is only feasible if demand is sufficient to support more than the current level of service. S. 5311(f) funding is for services from non-urbanized areas (under 50,000 population), so it cannot be used to fund the express services between urbanized areas. Faster services may be provided in the future where the market can support them (e.g. the Duluth–Twin Cities corridor).
1. MAINTAIN STATEWIDE NETWORK COVERAGE
Maintaining the statewide network (or expanding in cases that appear to have sufficient demand) includes several program implications:
• Continue operating assistance: fund current routes, subject to the application of the previously discussed performance measures (if these services are not meeting the performance criteria after a development period, they should be revised, and if they still are not productive resources should be shifted to other potentially more productive services).
• Revise the S. 5311(f) application: specifically solicit applications for particular corridors to maintain intercity bus services. The application may also be open to those who have proposals for different or other services, which would also be evaluated in terms of their ability to meet state goals and performance standards for the program.
• Potentially provide state funding for local match: draw on state funding for the local operating match if there are not sufficient unsubsidized connecting service miles available from the applicant to match the federal operating assistance. In the past

Minnesota Intercity Bus Study 2014 6-3
carriers also provided cash match for many S. 5311(f) funded services, but this practice may be more limited in the future as a result of increased competition on unsubsidized services. The role of state funding will depend on:
◦ The required subsidy to maintain the statewide network at the desired farebox recovery levels (from performance measures).
◦ The available unsubsidized miles with meaningful connections.
◦ To what extent Minnesota will utilize in-kind miles not captured in other states.
• Consider longer contract periods: extend grant contract periods (longer than a year) in order to promote carrier willingness to invest in equipment and facilities. Carriers have pointed out that obtaining funds to purchase vehicles or facilities may well require multi-year pay back periods, and that lenders see risk in one-year grant agreements under a competitive program. However, this presents grant management challenges for MnDOT, given FTA requirements for prompt grant close-outs.
2. INCREASE MARKETING, AWARENESS, AND INFORMATION
The second program priority is to provide support for projects that increase statewide awareness of the intercity bus network and its connections with local public transportation. The focus of this effort would be on statewide marketing actions to increase public awareness of the mode as a whole, and would be in addition to marketing funding provided to carriers to market specific subsidized routes. These activities could include:
• Employ marketing techniques such as “ambassadors” on campuses, etc. that are more likely to have payoff than high cost media (TV, etc.). Ambassadors could provide students with information on the intercity bus network and promote the mode at campus events.
• Increase the use of social media to reach potential riders.
• Support the development of transit information systems to include intercity services—develop GTSF (route and schedule) data for intercity network, make it available to Google Transit, app developers, and carriers.
The Oregon Department of Transportation (ODOT) S. 5311(f) program allows for two
types of application responses. As part of the overall grant solicitation, providers
may apply for funding for intercity services based on local needs or provider concepts. In addition, there is a separate solicitation
for specific services in corridors that ODOT has identified as gaps in the network. This hybrid approach allows the state to define
and maintain a statewide network, yet local or regional providers may also submit
proposals for locally-identified needs.

Minnesota Intercity Bus Study 20146-4
• Consider ways in which this information can be provided through MnDOT—511, etc.
• Undertake targeted marketing to reach public transit providers that are on the existing intercity bus network. Develop their ability to bring connecting local passengers to the network—have them make the information available to their customers. MnDOT may need to find a way to pay feeder trip costs, as providers may hesitate to spend local operating dollars.
• Develop and implement a statewide trailblazer and intercity bus stop signage program.
• Provide real-time information on bus location via cellphone to improve the customer experience—if the bus is only once or twice a day, on a long route, the customer would really like to know if it is running on-time or is late.
The appropriate amount of marketing expenditure as a percent of revenues (or percent of operating budget) varies considerably depending on the particular industry and market. A rule of thumb is that consumer product companies should spend between 6 and 12 percent of revenues on
marketing, with firms that are launching new products or entering new markets spending higher percentages, perhaps as much as 20 percent.
Typically transportation firms spend less—the rule of thumb for appropriate marketing budgets in urban transit is that a system should spend 2 percent of its operating budget on marketing. Southwest Airlines typically spends 2 percent of revenues on marketing, though the percentage was higher in its initial years. In considering the appropriate level of marketing funding for Minnesota’s intercity bus network, it should be noted that the state and its grantees have spent approximately $260,000 per year in federal and state funds over the past six years for marketing projects, approximately 9 percent of the total federal and state expenditures. This level of funding needs to be considered in relation to the total operating budget of both subsidized and non-subsidized services, not just the S. 5311(f) program routes. It may also have included activities that other industries or firms would consider as administrative expenses or the cost of selling (as opposed to marketing). In any event, the key issue will be
GO Bus is the brand developed for intercity bus services funded by the Ohio Department of Transportation using S. 5311(f). The GO Bus program has been quite successful,
including wrapped buses, Wi-Fi and power outlets on all buses, well-marked stop and
terminal locations, a supporting website with connecting services, a simplified and promoted
fare structure, extensive local promotion at stop locations in its service area, and support
coordination with local transit systems and agencies. The overall program budget is
approximately $2.8 million, less fare revenues of approximately $400,000. The annual
marketing budget is $54,000 or about 2.5%, with additional administrative staff time that
should be allocated to the marketing function.
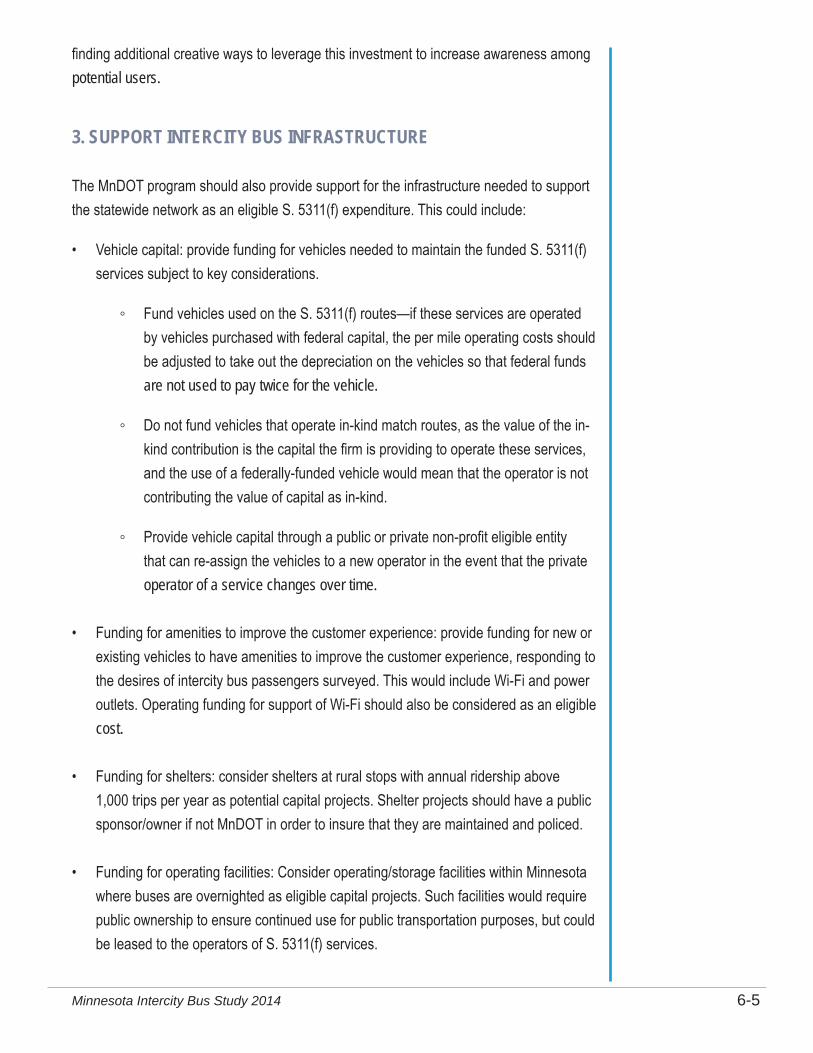
Minnesota Intercity Bus Study 2014 6-5
finding additional creative ways to leverage this investment to increase awareness among potential users.
3. SUPPORT INTERCITY BUS INFRASTRUCTURE
The MnDOT program should also provide support for the infrastructure needed to support the statewide network as an eligible S. 5311(f) expenditure. This could include:
• Vehicle capital: provide funding for vehicles needed to maintain the funded S. 5311(f) services subject to key considerations.
◦ Fund vehicles used on the S. 5311(f) routes—if these services are operated by vehicles purchased with federal capital, the per mile operating costs should be adjusted to take out the depreciation on the vehicles so that federal funds are not used to pay twice for the vehicle.
◦ Do not fund vehicles that operate in-kind match routes, as the value of the in-kind contribution is the capital the firm is providing to operate these services, and the use of a federally-funded vehicle would mean that the operator is not contributing the value of capital as in-kind.
◦ Provide vehicle capital through a public or private non-profit eligible entity that can re-assign the vehicles to a new operator in the event that the private operator of a service changes over time.
• Funding for amenities to improve the customer experience: provide funding for new or existing vehicles to have amenities to improve the customer experience, responding to the desires of intercity bus passengers surveyed. This would include Wi-Fi and power outlets. Operating funding for support of Wi-Fi should also be considered as an eligible cost.
• Funding for shelters: consider shelters at rural stops with annual ridership above 1,000 trips per year as potential capital projects. Shelter projects should have a public sponsor/owner if not MnDOT in order to insure that they are maintained and policed.
• Funding for operating facilities: Consider operating/storage facilities within Minnesota where buses are overnighted as eligible capital projects. Such facilities would require public ownership to ensure continued use for public transportation purposes, but could be leased to the operators of S. 5311(f) services.

Minnesota Intercity Bus Study 20146-6
• Funding for intermodal terminal facilities: consider public intermodal terminal facilities at high boarding locations/transfer points where passengers have to wait (e.g. Brainerd) as eligible projects. Minnesota already has a number of public terminals that service intercity bus passengers, and future projects should be limited to locations that do not already have such facilities, are major transfer locations, and have significant ridership. As in the case of operating facilities, these should be owned by a public entity to ensure continued use as a public transportation facility in the event that the operating carrier changes.
• Funding for elements of Park & Ride facilities: consider elements of Park & Ride facilities that would support rural intercity bus usage as eligible for intercity bus program funding. These facilities would also need to be publicly-owned, and the intercity bus elements could include bus slips, shelters, small buildings, and parking related to the level of bus ridership. Such facilities could be included in an overall park and ride strategy, and could be leased to bus operators.
4. PROVIDE LIMITED SERVICE EXPANSION
Finally, limited service expansion is a lower program priority, primarily by improving coordination between local public transit and intercity bus services. Potential projects could include:
• Rural intercity feeder services: fund a limited expansion of rural intercity feeder services (like the Alexandria-Morris connection) to link identified unmet need locations off the network (or on the network but not served by intercity bus) with nearby stops. Such services would need to be scheduled to make meaningful connections, ideally serving multiple markets (meeting local needs as well as intercity bus connections) if possible. They would likely be operated by rural transit providers. The frequency of such services may be less than daily.
• Strategic expansion of local public transit: fund additional service hours for local public transit systems. This could include additional service hours Friday evenings and on Sundays (in cases with local colleges especially), allowing local systems to provide connections during peak periods of intercity bus ridership.
• Limited intercity bus route service expansion: in order to address the goal of daily service, or to improve accessibility and ridership, consider funding a limited expansion of current network services, particularly with regard to frequency or to improve the attractiveness of schedules.

Minnesota Intercity Bus Study 2014 6-7
OVERALL CONSIDERATIONS
Achieving the primary goal of maintaining the statewide intercity network is feasible within the current funding context, with the program utilizing its S. 5311(f) allocation primarily for operating assistance. In FY 2013, the estimated net operating deficit identified in program operating grants was $1,998,600 ($999,250 federal funding, $826,500 state funding, and $172,800 local funding). No match was provided using in-kind funds. If there had been no state share or local cash match provided, and in-kind match had been used for all of the operating program, the federal share would have been equal to the net operating deficit, $1,998,600, which is less than the FY 2013 S. 5311(f) allocation of $2,288,471. While the actual annual net operating deficit may differ, the fact that it is less than the federal allocation means that, in general, maintaining this network is feasible even if federal funds are used for 100 percent of the subsidy. However, utilizing federal funding for operating assistance at this level on an on-going basis would leave limited federal funding for other program areas such as marketing or capital.
For the 2014-2015 grant application cycle, MnDOT notified potential applicants that available Federal funding would likely exceed the subsidy requests, if upcoming project applications followed historical precedent. This funding surplus results in part from accumulated program balances from previous years, as actual invoices have drawn down less than the obligated funding amounts (reflecting that some services have performed better than anticipated). Given the goal of maintaining the network, and the anticipated level of federal funding, the financially constrained program should fund operating projects at a level that is sustainable out of the annual federal allocation (using the in-kind match). Simultaneously, the program should expend funds out of the accumulated balance for investments that could potentially reduce the operating deficits in future years, either by reducing operating costs (through provision of vehicles), or increasing ridership (through improved awareness or customer amenities). The best combination of operating, capital, and marketing projects cannot be determined in advance of the applications, but the policies presented in this chapter, and the performance measures presented in Chapter 5 can help MnDOT evaluate applications and monitor the program over the next several years.
This study has documented that MnDOT, in partnership with its grantees, has developed and maintained a sustainable intercity bus network that links the rural areas and small towns of Greater Minnesota with the Twin Cities, offering connectivity to destinations across the country. This network complements the services that are offered by the private market, providing coverage that cannot be sustained by fare revenue alone. Current passengers are generally satisfied with the service, but many potential passengers are

Minnesota Intercity Bus Study 20146-8
unaware that intercity bus is an available option. Improved marketing and information is needed to grow ridership. This network differs from most transit programs in that it is designed to complement the services provided by the marketplace; thus it is more difficult to lay out a program of specific projects. Because of the dynamic relationship between the private industry that provides intercity services and the MnDOT rural intercity bus program, this study has focused on identifying overall priorities and developing performance measures to assist MnDOT in its ongoing management of the program.

Minnesota Intercity Bus Study 2014 A-1
Federal Policies
The 2005 federal transportation authorizing legislation, SAFETEA-LU (Safe, Accountable, Flexible, Efficient Transportation Equity Act: A Legacy for Users) included a change in the FTA definition of public transportation that affects the ability to use federal transit funds for intercity bus services. This definition is included in the most recent reauthorization, Moving Ahead for Progress in the 21st Century (MAP-21) enacted in July 2012. The language excludes intercity bus transportation from the definition of public transportation that is supported with federal funding. In SAFETEA-LU there were three exceptions: the S. 5311(f) rural intercity bus assistance program, intermodal facilities, and the S. 3038 Over-the-Road Bus Accessibility Program. Under MAP-21 the S. 3038 program has been eliminated, so there are now only the two exceptions for which federal funding can be used for intercity bus services. This means that public transit agencies that receive FTA funding cannot operate intercity bus service between urbanized areas (with stops only in the urbanized areas)—this is a market reserved for the private for-profit industry.
FEDERAL FUNDING FOR INTERCITY SERVICES—S. 5311(F)
Federal S. 5311(f) funds are used in a majority of states to support rural intercity bus services. S. 5311(f) has existed in the same general form since 1992, when it was created as the Section 18(i) program of assistance for rural intercity routes as part of the 1992 ISTEA (Intermodal Surface Transportation Efficiency Act) transportation authorizing legislation. This program was subsequently codified as 49 USC S. 5311(f), and is fully described in Chapter VIII of Circular 9040.1F, the current S. 5311 guidance. The basic outline of the program has remained the same since 1992, though there have been some changes and re-interpretations over the years as the program has been implemented. SAFETEA-LU included language that resulted in more substantial changes, and MAP-21 included some additional changes in this program.
Appendix A
FEDERAL AND CARRIER POLICIES

Minnesota Intercity Bus Study 2014A-2
CONSULTATION REQUIREMENT
The major program change under SAFETEA-LU was that states planning to certify (partially or completely) that they do not need S. 5311(f) funds to meet intercity travel needs are required to undergo a consultation process prior to certifying, and state transit programs are being evaluated on this activity as part of their FTA State Management Reviews. FTA requires the consultation process to include identification of the intercity carriers, definition of the activities the state will undertake as part of the consultation process, an opportunity for intercity carriers to submit information regarding service needs, a planning process that examines unmet needs, and documentation that the results of the consultation process support the decision to certify—if, in fact, that is the final decision. MAP-21 continues this requirement. In Minnesota, the current assessment of intercity bus needs consists of two parts: 1) this study, which is a planning-level analysis of needs with a broad range of inputs, and 2) the industry consultation, which is a more targeted outreach effort to solicit input from providers and invite their participation in the program. This study incorporates feedback gathered during the 2013 consultation.
REQUIREMENT FOR A MEANINGFUL CONNECTION TO THE NATIONAL NETWORK
The S. 5311(f) program is implemented by each state as part of its overall S. 5311 program management activities. FTA guidance makes clear that S. 5311(f)-funded intercity services must take schedule considerations into account to have a meaningful connection with scheduled intercity bus services to points outside the service area, adding a dimension (schedule) to the definition of a meaningful connection. The requirement that services funded under this program make a meaningful connection with the national network has the effect of narrowing the definition of eligible intercity service under S. 5311(f). Regional public transit and airport carriers are typically excluded from the definition.
UNSUBSIDIZED CONNECTING SERVICE AS IN-KIND OPERATING MATCH
Obtaining the 50 percent local cash operating match required under the S. 5311(f) program has been a major program issue, particularly in states that provide no state operating assistance. Historically Minnesota did not provide state sources of funding to serve the federal requirement for local match for the rural intercity program, but its major participating private carrier, Jefferson Lines, did provide the match through private revenues. As described in Chapter 1, FTA has issued guidance permitting the use of in-kind match based on the value of connecting private unsubsidized service for S. 5311(f) operating funds. If the value of the in-kind match for a particular project is sufficient, it is possible to operate S. 5311(f) connecting service without local cash match.

Minnesota Intercity Bus Study 2014 A-3
Potential changes in FTA guidance concerning the in-kind match funding method could assist states in drawing down available federal funding and avoiding the need to certify that there are no unmet needs solely because of lack of match. The in-kind match funding method began as a pilot program in 2007, and was continued administratively through the end of SAFETEA-LU. It is now included in MAP-21 as statute, so it is a part of the on-going program. The statutory language in MAP-21 does not include the previous administrative program’s limitation of the value of in-kind match to 50 percent of the fully-allocated cost of the unsubsidized connecting service. FTA’s draft update of the S. 5311 circular continues the 50 percent limit on the amount of the value of in-kind match—however these regulations are not final. If there is an increase in the allowable value of service as in-kind match, it will be easier to find enough match for services funded under this program.
Following recommendations in the previous study, Minnesota has used the in-kind match approach extensively to fund many rural intercity services, with Jefferson Lines providing the in-kind match.
S.3038 OVER-THE-ROAD BUS ACCESSIBILITY PROGRAM GRANTS
This program was authorized as part of TEA-21 (Transportation Equity Act for the 21st Century), continued under SAFETEA-LU, and eliminated under MAP-21. It made funds available to private operators of over-the-road buses to pay for the incremental capital and training costs associated with compliance of the final U.S. DOT rules on over-the-road accessibility.1 As the regulations addressing private operators of over-the-road buses required large fixed-route carriers (such as Greyhound) to be fully accessible by October 2012, this program was not continued.
FEDERAL MOTOR CARRIER SAFETY ADMINISTRATION (FMCSA)
The other major federal policy framework affecting intercity bus service is the regulatory framework of FMCSA. FMCSA is an agency of U.S. DOT, and is one remnant of the regulatory authority formerly exercised by the Interstate Commerce Commission. FMCSA does not have any role in the economic regulation of the intercity bus industry; its focus is on ensuring that the firms providing service in interstate commerce are financially responsible (have the required levels of insurance) and operate within the federal safety requirements. Thus FMCSA is important to MnDOT in that intercity bus carriers in the state that offer interline service to interstate passengers must meet FMCSA requirements, with some limited exceptions.
1 49 CFR Part 37, published in the Federal Register on September 28, 1998 (63 FR 51670).

Minnesota Intercity Bus Study 2014A-4
Greyhound, for example, requires that its interline partners have FMCSA authority to operate—even if they do not themselves operate interstate service. Under FMCSA rules, interstate commercial vehicle operators that receive FTA funding are required to have the highest insurance levels required by the states served.
FMCSA policing of insurance and safety allows MnDOT to address these issues by requiring FMCSA registration and compliance, rather than overseeing these regulations as part of its intercity bus program. The major changes in FMCSA oversight in recent years have included a stepped-up focus on intercity bus passenger carrier safety enforcement, particularly focusing on carriers that have identified safety issues. Changes have been made to make it more difficult for a carrier that is shut down for safety violations to reopen the next day under a different name.
Carrier Policies
INTERLINING AND THE NATIONAL BUS TRAFFIC ASSOCIATION
The NBTA is a non-profit clearinghouse for interline bus tickets that allow passengers to travel on more than one bus carrier. NBTA members can sell a single ticket to passengers who may need to use other carrier members to reach their final destination. In Minnesota, Jefferson Lines and Greyhound are NBTA members but Megabus is not. Because NBTA member carriers try to function as a network, they often serve common terminals and coordinate schedules to facilitate passenger connections. In addition, NBTA offers a sponsored membership to regional or rural public transit operators that provide connecting service to an NBTA member, allowing them to sell interline tickets and have the ticket cleared through NBTA. Rainbow Rider Transit is an example of a sponsored member.
FTA guidance states that rural intercity bus services funded by S. 5311(f) must provide meaningful connections with the national intercity bus network. In order to meet this requirement, many states have adopted S. 5311f) policies that require recipients to be NBTA members or participate in the sponsored carrier program.

Minnesota Intercity Bus Study 2014 B-1
Research on Curbside Buses
A limited number of studies have examined and collected reliable data on intercity bus services and ridership. The available data indicate that U.S. cities experienced a significant decline in conventional intercity bus service between 1960 and early 2006, due to the rise of car ownership and air travel, increasing household incomes, and the decline of city centers. Conventional intercity bus service had come to be considered a last resort of travel, but 2006 saw a revival of the industry. The level of intercity bus service nationwide increased for the first time in 40 years, largely due to new service provided by curbside buses.1 The trend of annual growth in intercity bus services has continued since then, as shown in Exhibit B-1.
1 Schwieterman, J., L. Fischer, S. Smith, and C. Towles. “The Return of the Intercity Bus: The Decline and Recovery of Scheduled Service to American Cities, 1960-2007.” Intercity Bus Research. Chaddick Institute for Metropolitan Development, DePaul University, 2007. Web. 2 Oct. 2013.
Exhibit B-1: Changing Level of Intercity Bus Service (Percentage Annual Growth and Decline).
Source: Schwieterman et al.
Appendix B
INTERCITY BUS RESEARCH
-1.4%
-2.9%
6.9%
9.8%
5.1%6.0%
7.1% 7.5%
-4.0%
-2.0%
0.0%
2.0%
4.0%
6.0%
8.0%
10.0%
12.0%
1960-80 1980-06 2006-7 2008 2009 2010 2011 2012

Minnesota Intercity Bus Study 2014B-2
The increased service levels primarily reflect service expansions and the development of new hubs by curbside operators, particularly BoltBus and Megabus, but also include expansion of Greyhound and Peter Pan’s premium service into new markets. The level of service provided by the curbside operators increased by more than 30 percent annually in both 2011 and 2012. Whereas curbside buses initially operated around Chicago and the northeast, service has expanded to the west, pacific northwest, and south. One of the newest developments has been corporate curbside buses starting to acquire regional bus lines to expand their national network, as exemplified by Coach USA to expand the Megabus network. This has introduced discounted, express intercity bus service to many corridors that lacked high quality intercity bus or rail service for many years.2
POLICY ISSUES REGARDING CURBSIDE BUSES
• Impact on Rural Intercity Bus Service. Curbside buses generally link major cities, often serving smaller cities only if they have a major university. The growth of curbside services may have had negative impacts on traditional intercity services, as firms such as Greyhound have eliminated stops in smaller towns in order to compete.
• Safety. The safety of curbside bus services has been a public concern highlighted through press coverage of several accidents in recent years.3 Consequently, both corporate curbside carriers and traditional intercity bus providers have promoted their commitment to safety.
• Equity. The predominant sale of curbside bus tickets online, which requires the use of a credit card, has implications for equity. Curbside bus operators have also had to address equity issues for persons with disabilities.
• Curbside Conditions in Cities. A significant concern raised by municipalities in the last few years has been the congestion on sidewalks and streets at locations where curbside buses pick up and drop off passengers. Curbside bus companies have increasingly worked with municipal officials to identify pick up and drop off locations, but this process has been contentious in some cities.
2 Schwieterman, J., B. Antolin, P. Largent, and M. Schulz. “The Motor Coach Metamorphosis: 2012 Year-in-Review of Intercity Bus Service in the United States.” Intercity Bus Research. Chaddick Institute for Metropolitan Development, DePaul University, 2013. Web. 2 Oct. 201
3 Ibid.

Minnesota Intercity Bus Study 2014 B-3
Other Recent Intercity Bus Research
TRANSPORTATION RESEARCH BOARD DOCUMENTS
In addition to the research covering the rise of curbside buses, there are a number of other recent publications addressing the intercity bus industry. The Transit Cooperative Research Program (TCRP) and the National Cooperative Highway Research Program (NCHRP) have three publications currently available addressing intercity bus services.
TCRP REPORT 79: EFFECTIVE APPROACHES TO MEETING RURAL INTERCITY BUS TRANSPORTATION NEEDS (2002)—KFH GROUP, INC.
This study was intended to assist communities, providers, and state administrators in identifying strategies to support rural intercity bus transportation, and to identify methods of planning, funding, operating, and marketing these services. It included a survey of states to identify funded intercity bus projects, and a survey of the projects to assess potential solutions and identify barriers and model strategies. The resulting report is divided into three parts: Part I addresses needs, funding, and programs; Part II defines strategies to support intercity services; and Part III provides detailed project descriptions.
The report identified potential barriers to the implementation of rural intercity bus projects, including lack of sponsors to provide local operating match. The report identified a number of different types of projects, and a process that could be used to identify appropriate projects given the needs and goals of a particular jurisdiction. Minnesota’s operating, capital, and marketing projects were included in the surveys and project descriptions.
TCRP REPORT 147: TOOLKIT FOR ESTIMATING DEMAND FOR RURAL INTERCITY BUS SERVICES (2011)—KFH GROUP, INC., WITH JASON K. SARTORI
The fundamental goal of this project was to develop an easy to use tool for estimating the potential demand for rural intercity bus services. The study collected data from over a hundred projects, classifying them in an effort to reduce the wide variation in service types, providers, and ridership. Eventually a more limited set of projects was used to develop two tools to estimate rural intercity bus ridership. One tool is a regression model that estimates ridership as a function of route length, carrier type, and whether or not service is provided to an airport and/or a major correctional facility. The other tool is a trip rate model developed from data collected in the National Household Travel Survey, in which ridership

Minnesota Intercity Bus Study 2014B-4
is based on stop level population and then summed over the route. Neither model is sensitive to fares or frequency, as the calibration base had little variation in per mile fares or frequency. Data from Jefferson Lines was used as part of the calibration. The Toolkit is used in this study to assess potential routes, as explained in more detail in Appendix J.
NCHRP RESEARCH RESULTS DIGEST 356: ANALYSIS OF STATE RURAL INTERCITY BUS STRATEGIES-REQUIREMENTS FOR UTILIZATION OF S. 5311(F) FUNDING (2011)—KFH GROUP, INC.
This report documents research conducted under two NCHRP Project 20-65 task orders: Task 20—Analysis of Rural Intercity Bus Strategy and Task 25—Evaluate Requirements for the Utilization of Section 5311(f) Funds for Intercity Bus Service. In many ways an update to TCRP Report 79, this project involved a survey of state rural intercity bus programs to identify implementation progress and strategies. It included an assessment of regular-route service (funded and not funded), state implementation of the S. 5311(f) program, classification and assessment of different state approaches, case studies of “successful” programs, and then a general description of a “model program.”
The MnDOT intercity bus program was included as one of the case studies of “successful” programs, and the model program has many elements of Minnesota’s program. The model includes some additional elements that could be considered for Minnesota—including a shift from an “open” application process (applicants develop the services or projects and submit them) to one in which the state identifies corridors, services, or projects and then solicits specific applications to address those needs.
OTHER RESEARCH
In addition to the TCRP/NCHRP research, there have been additional papers on intercity bus over the past few years. Mintesnot Woldeamanuel evaluated the intercity bus industry based on sustainability indicators.4 He found that intercity bus is an environmentally friendly, economically viable mode of long-distance travel, worthy of policy consideration as a means of serving an increasing population of older adults, rural residents, and those without a personal vehicle (by choice or not).
4 Woldeamanuel, Mintesnot. “Evaluating the Competitiveness of Intercity Buses in Terms of Sustainability Indicators.” Journal of Public Transportation 15.3 (2012): 77-96. Print.

Minnesota Intercity Bus Study 2014 B-5
An intercity bus service funding and assessment methodology was developed by a team of researchers for the Montana DOT.5 This paper includes an overview of the S. 5311(f) program and its requirements, but the primary focus is on a methodology developed for Montana to determine if its rural intercity bus needs are adequately met, and if so how to allocate funds to other rural services. Basically the process identifies existing and potential routes based upon historic route patterns, demographic analysis, and public input. For these routes actual or estimated demand is used to estimate cost per mile and cost per ride, and a threshold set (at the 85th percentile) below which proposed projects are considered not cost effective. The percentile is based upon its use in traffic engineering and in setting speed limits.
Another state-supported research project is the Analysis of the 2011 Michigan DOT Intercity Rail and Bus Passenger Surveys.6 This report documents surveys of intercity bus and rail passengers by the Michigan DOT. Passengers on Greyhound and Indian Trails intercity services were surveyed in the spring of 2011, along with passengers on Amtrak rail and Amtrak Thruway buses. The survey collected information on passenger characteristics, boarding and alighting locations, access modes and travel times, destinations, trip purpose, and possible alternative modes. In general, Michigan’s intercity bus passengers were making trips to visit friends or family (59 percent). Most passengers used an auto to access the service, though 12-15 percent used local transit, and 22-27 percent used another intercity bus (highlighting the importance of network connections). The main reasons for choosing intercity bus included total cost of the trip (55 percent) and the convenience of the schedule (37 percent). Rider characteristics included a median age of 31.5, slightly more female riders, and a median household income of $19,100.
5 Ye, Zhirui, David Kack, Jaydeep Chaudhari, and Levi Ewan, “Intercity Bus Service Funding and Assessment Methodology.” Journal of Public Transportation 15.3 (2012): 113-128. Print.
6 Sperry, B.R. and C.A. Morgan. “Analysis of the 2011 Michigan DOT Intercity Rail and Bus Passenger Surveys.” Prepared for the Michigan Dept. of Transportation. Texas Transportation Institute, 2012. Print.


Minnesota Intercity Bus Study 2014 C-1
Provider Service Area Intermediate Stops Service Hours
Freq. Scheduled Trips
One-Way Fares
Reservation Required?
Notes
Chippewa Valley Airport Service
Eau Claire, WI and Rice Lake, WI to MSP
Hudson, Baldwin, and Menomonie, WI on the Eau Claire route. Barron, Turtle Lake, and Baldwin on the Rice Lake route.
3 a.m. - 1:35 a.m. daily (last trip leaves Eau Claire at 6:10 p.m. and MSP at 11:55 p.m.). Driver may wait 15 min.
1.5 - 2.5 hours
11 RT daily $25-$50, $15 for children 10 years and under with parent. $25 from Rice Lake, discounted rates for groups of 3 or more.
Yes, prepaid reservations (by credit card) required to MSP, online, by phone, or locations in Eau Claire, Menomonie, Hudson, Baldwin; trips originating in Minneapolis do not require reservations. Reservations for groups of 3+ must be made by phone.
The VA Medical Center in Minneapolis and Mall of America are also served after airport, upon request. Long-term parking available at Menomonie, Baldwin and Hudson. Now includes service to Rice Lake that was once provided by Rice Lake Shuttle.
Executive Express / Go My Ride
Willmar, Morris, Alexandria, Wadena, Brainerd to MSP. Service to other out-state cities in central Minnesota can be made by special arrangement.
Albany, Albertville, Avon, Baxter, Bertha, Browerville, Camp Ripley, Clarissa, Clearwater, Cold Spring, College of St. Benedict, Cyrus, Eagle Bend, Glenwood, Hewitt, Litchfield, Little Falls, Long Prairie, Maple Grove, Melrose, Monticello, New London, Osakis, Paynesville, Plymouth, Rogers, Sauk Centre, Spicer, Starbuck, St. Cloud, St. John’s Univ.
3:30 a.m. - 11:30 p.m. daily
1 - 2 hours (14xs daily)
2 to 13 RT per route daily
$30-65 one-way and $48-113 round-trip for 1 passenger; More for additional passengers; $1-4 fuel surcharge per person per way.
Yes, online or by phone. Can confirm reservation with credit card, or company will call or email to confirm. Walkups at MSP and St. Cloud.
Also provides private charter and delivery services. Has customer service counter in Lindbergh Terminal.
Appendix C
MINNEAPOLIS-ST. PAUL (MSP) AIRPORT SHUTTLES

Minnesota Intercity Bus Study 2014C-2
Provider Service Area Intermediate Stops Service Hours
Freq. Scheduled Trips
One-Way Fares
Reservation Required?
Notes
Go Carefree Shuttle
La Crosse, WI
Winona and Rochester served once per day
5:55 a.m. - 11:15 p.m. (last trip leaves MSP at 8:15 p.m.)
Approx. 1.5-3 hrs
Mon - Sat: 7 RT; Sun: 6 RT
$25-$49, $20-$29 for children 12 years and under
Yes. Online reservation system only for travel that originates or ends in Minneapolis. Phone reservations for all trips.
Go Rochester Direct serves as their agent at MSP. Also provides same-day package delivery.
GO Rochester Direct
Rochester to MSP
By request only: Cannon Falls, Zumbrota, Pine Island, Oronoco
Mon -Sat 3:30 a.m.-11:45 p.m. Sun 5 a.m.- 10:45 p.m.
30-45 min.
Mon - Fri 19 RT; Sat - Sun 18 RT
One-way regular $29, senior $27, child $19, Mayo employee $23. RT regular $55, senior $52, child $35, Mayo employee $46
Advance reservations are required to guarantee service. Walkups at MSP are welcome pending seating availability.
Major Rochester destinations include IBM and Mayo Clinic. Based in Kahler Grand Hotel in Rochester. Also have counter at Lindbergh Terminal of MSP. Originally Rochester Direct, now partners in the GO Airport Shuttle network. Can verify or cancel reservation online. Reservations must be cancelled 24 hrs prior, or credit card may be charged.
J & J Shuttle New Ulm, West Haven
Will pick up in towns en route to the Twin Cities
Mon - Fri, leaves new Ulm at 7 a.m., Sat/Sun by request
NA NA $40 Yes No counter or scheduled service from MSP.

Minnesota Intercity Bus Study 2014 C-3
Provider Service Area Intermediate Stops Service Hours
Freq. Scheduled Trips
One-Way Fares
Reservation Required?
Notes
Land to Air Express
Mankato to MSP
St. Peter and major motels along I-494 en route to MSP. La Sueur, Belle Plaine, Jordon by reservation.
Mon - Fri 4:30 a.m.- 10:45 p.m. (last trip leaves Mankato at 5 p.m. and MSP at 9 p.m.) Sat/Sun 8 a.m. - 10:35 p.m.
Approx. 2-4 hours
Mon - Fri: 6 RT; Sat-Sun-Holiday: 3 RT
$35 from Mankato. $65 RT. Children 12 and under free with paid adult.
No, can buy tickets at locations in Mankato and St. Peter or through travel agents. For guaranteed seating, phone reservations required 24 hrs in advance.
Also offers charter service for groups of 14 or less.
Lakes Express
Baxter/Brainerd to MSP
Little Falls, St. Cloud, and Monticello; stops at St. Cloud State, St. Bens, St. Johns, Clearwater, Elk River, Maple Grove, and Rogers also available (though not scheduled)
1:15 a.m. - 2:15 a.m. daily (last trip leaves Baxter at 8:45 p.m. and MSP at 11 p.m.)
every 3.5 hours
7 RT daily, no major holidays.
$30-$55 Yes, at least 24 hours in advance by phone. Call for walkup availability.
Will pick up at any Baxter or Brainerd hotel, or can arrange taxi service for home pick-up. 24 hr advance cancellation or changes. Service counter in Lindbergh Terminal. Offers charter service for groups of <14 and same day delivery/ courier service.

Minnesota Intercity Bus Study 2014C-4
Provider Service Area Intermediate Stops Service Hours
Freq. Scheduled Trips
One-Way Fares
Reservation Required?
Notes
NWT Express
Northwestern WI to MSP
Almena, Barron, Cameron, Cumberland, Hayward, New Richmond, Rice Lake, Shell Lake, Spooner, St. Croix Falls, Stone Lake, Trego, Amery, and Turtle Lake, WI
Mon-Wed-Fri-Sun: 8:30 a.m. - 10:15 p.m.; Tues-Thurs-Sat 6 a.m - 7:45 a.m.
7 hours 2 RT daily $68-85 (depending on city of origin), seniors $62-79. RT $128 - $158. Possible fuel surcharge, 2nd and 3rd rider discounts.
Yes, reservation must be made 24 hours in advance (or must pay $15 late booking fee) online, by email, or by phone; payment required prior to travel.
For service on Fri or Sun, minimum of 2 paid passengers required. Based in Hayward, WI, provides scheduled passenger and package delivery service between Hayward and Twin Cities. Also offers charter service. $15 fee charged for changes or cancellations; no refunds for cancellations within 24 hrs of departure or for no shows. Surcharges for bags apply.
RideSafe MSP, St. Paul, Anoka
NA 7 days per week, groups only
NA NA $100 to $150 per group
Yes No counter or scheduled service from MSP.
Skyline Shuttle
Duluth to MSP
Hinckley by request, in advance for other stops
2:25 a.m. - 1:55 a.m. daily
1.5 - 2.5 hours
10 RT daily $49 RT from Hinckley, $69 RT from Duluth; various discounts apply.
Advance reservations are required to guarantee service. 12 hour cancellation policy.
Major destinations served include Mall of America, Grand Casino Hinckley, and State Capitol. Reservations can be cancelled 12 hours prior to departure. Cancellations less than 12 hours before will be turned into “open” reservation which can be used any time in the future.

Minnesota Intercity Bus Study 2014 D-1
Appendix D
LOCAL TRANSIT CONNECTIONS
Local Transit Connections By System
Local System Approx. Span Service type Potential Intercity Stop ConnectionsAlbert Lea Transit (now SMART)
M-F 7am-430pm Route deviation, dial-a-ride, and subscription in the city of Albert Lea
Ole's East Side Shell
Arrowhead Transit M-F 6am-8pm; Sat 9am-5pm; Sun 8am-2pm (schedules vary by city)
Route deviation and dial-a-ride in 8 counties: Aitkin, Carlton, Cook, Itasca, Koochiching, Lake, Pine, St. Louis
Aitkin City Hall, Paul Bunyan Transit Stop, Che-Wa-Ka-E-Gon Convenience Store, Jefferson Lines Terminal, UM-D Bookstore, Itascan Motel, Hwy 371 (Discharge Only), Tobies, MNDOT Wayside Rest MP 173, Best Oil Co - Little Store, McDonald's, Victory Gas Station, Scanlon Park N Ride, Village Inn, City Hall, Mickey's Pizza and Subs, North Country Café, Wendys, Super Valu
Austin - Mower Co. Area Transit (now SMART)
M-F 6am-10pm; Sat 9am-5pm; Sun 1pm-5pm
Route deviation, dial-a-ride, and subscription in the city of Austin and Mower County
Mileage Fuel Stop
Becker County Transit
M-F 8am-6pm Route deviation and dial-a-ride in the city of Detroit Lakes and Becker County
White Earth Transit Station
Brainerd / Crow Wing Public Transit
M-F 715am-430pm Route deviation and dial-a-ride in the cities of Brainerd and Baxter, and Crow Wing County
Mickey's Pizza and Subs, North Country Café, Wendys, Super Valu
Chisago / Isanti County Heartland Express
M-F 6am-6pm Route deviation and dial-a-ride in Chisago and Isanti Counties
McDonald's
Cities Area Transit (CAT)
M-F 6am-10pm; Sat 8am-10pm
Fixed route and dial-a-ride in the cities of Grand Forks and East Grand Forks
Grand Forks
Duluth Transit Authority
M-F 430am-1230am; Sat 6am-8pm; Sun 740am-740pm
Fixed route and dial-a-ride (Stride) in the cities of Duluth, Proctor, Hermantown, and Superior
Jefferson Lines Terminal, UM-D Bookstore
East Grand Forks Transit
M-F 6am-10pm; Sat 8am-10pm
Fixed route and dial-a-ride in the city of East Grand Forks
Grand Forks
Faribault County Prairie Express
M-F 7am-5pm Dial-a-ride in Faribault County and surrounding area
Ole's East Side Shell, Nelson's Market Place, Land to Air Depot, Freedom Valu Center
Fosston Transit M-F 8am-430pm; Sun 8am-12pm
Dial-a-ride in the city of Fosston Le Piers West Convenience Store
Granite Falls Heartland Express
M-F 630am-530pm Dial-a-ride in the city of Granite Falls Tri-County Co-op

Minnesota Intercity Bus Study 2014D-2
Greater Mankato Transit System
M-F 635am-535pm; Sat 10am-530pm
Fixed route and paratransit in the cities of Mankato and North Mankato
Land to Air Deport
Hibbing Area Transit
M-F 6am-8pm; Sat 9am-3pm; Sun 9am-2pm
Route deviation and dial-a-ride in the city of Hibbing
Country Kitchen
Kandiyohi Area Transit
M-F 530am-530pm; Sat 8am-430pm
Route deviation and demand response in the city of Willmar and Kandiyohi County
Lakeview Inn
La Crescent Apple Express
M-F 6am-6pm Route deviation in the cities of La Crescent and La Crosse
La Crosse Bus Depot
Lincoln County Heartland Express
M-F 830am-430pm Dial-a-ride in Lincoln County and the surrounding area
Ampride
Mahnomen County Heartland Express
M-F 730am-430pm Dial-a-ride in Mahnomen County Shooting Star Casino
Martin County Transit
M-F 5am-6pm; Sat 5am-10pm; Sun 8am-10pm
Dial-a-ride in Martin County and the city of Fairmont
Freedom Valu Center
Maple Grove Transit
M-F 550am-7pm; Sat 8am-430pm
Commuter express and dial-a-ride in the city of Maple Grove
Maple Grove Transit Station
Meeker County Public Transit
M-F 630am-6pm; Sat 8am-1pm; Sun 8am-12pm
Route deviation and dial-a-ride in Meeker County and the city of Litchfield
Shell Outpost
Metro Transit 24/7 Fixed routes in 5 counties: Anoka, Dakota, Hennepin, Ramsey, and Washington
Megabus, 95th Avenue Park & Ride, Hawthorne Transportation Center, University of MN, Jefferson Lines - Union Depot, Midway Shopping Center, Forest Lake Transit Center, MN Valley Transit Authority, MSP Airport, Southwest Transit Station, Mall of America, Maple Grove Transit Station
Minnesota Valley Transit Authority
M-F 445am-1130pm; Sat 730am-1030pm; Sun 730am-930pm
Fixed route and flexible fixed route in cities of Apple Valley, Burnsville, Eagan, Rosemount, Savage, and Lakeville
Minnesota Valley Transit Authority, Mall of America, MSP International Airport
Moorhead Area Transit
M-F 615am-1015pm; Sat 715am-1015pm
Fixed route and paratransit in the cities of Moorhead and Dilworth
MN State University
Morris Transit M-F 6am-10pm; Sat 12pm-4pm; Sun 8am-1230pm
Dial-a-ride in the city of Morris University of MN
Paul Bunyan Transit
M-F 7am-6pm; Sat 8am-5pm
Route deviation, dial-a-ride, and subscription in the city of Bemidji and Beltrami County
Paul Bunyan Transit Stop
Pine River Ride with Us
M-F 845am-4pm Dial-a-ride in the city of Pine River City Hall
Pipestone County Transit
M-F 7am-5pm; Sat 9am-3pm; Sun 8am-1pm
Dial-a-ride in Pipestone County Lange's Cafe
Prairie Five Rides M-F 6am-6pm Dial-a-ride in 5 counties: Big Stone, Chippewa, Lac Qui Parle, Swift, and Yellow Medicine
Ampride, Metro Bus, Pilot Travel Center, MSP International Airport, Kwik & Ezy
Prairieland Transit System
M-F 7am-6pm Route deviation and dial-a-ride in Nobles County Cenex/Ampride
Rainbow Rider Transit
M-F 6am-6pm; Sat 730am-5pm
Dial-a-ride in six counties: Douglas, Grant, Pope, Stevens, Traverse, and Todd
Pilot/ Flying J Truck Stop, University of MN, Ernie's

Minnesota Intercity Bus Study 2014 D-3
RiverRider Public Transit
M-F 7am-5pm Route deviation and dial-a-ride in Sherburne and Wright Counties
Cruisers Convenience Store, Metro Bus, Pilot Travel Center
Rochester City Lines
M-F 530am-10pm; Sat 7am-7pm
Fixed route and dial-a-ride in the city of Rochester Rochester City Line Bus Stop, Rochester Airport, Mileage Fuel Stop
Rock County Heartland Express
M-F 730am-5pm Dial-a-ride in Rock County Express Way Luverne
SEMAC (now Rolling Hills Transit)
M-F 8am-430pm Route deviation, dial-a-ride, and subscription in the Counties of Dodge, Fillmore, Houston, and Winona and the city of Blooming Prairie
Dodge Center Park & Ride, Rochester City Line Bus Stop, Rochester Airport, Sinclair Convenience Store, Transit Stop @ Winona State
Shakopee Transit M-F 540am-720pm Express bus, local circulator, and shuttle service in the city of Shakopee and downtown Minneapolis
Mall of America
Southwest Transit M-F 5am-930pm Fixed route in the cities of Chanhassen, Chaska, and Eden Prairie
Southwest Transit Station
St. Cloud Metro Bus
M-F 530am-12am; Sat 745am-645pm; Sun 9am-6pm
Fixed route and dial-a-ride in the cities of St. Cloud, Sartell, Sauk Rapids, and Waite Park
Pilot Travel Center, Metro Bus
St. Peter Transit M-F 7am-8pm; Sat 10am-5pm
Dial-a-ride in the cities of Kasota and St. Peter St. Peter Co-op
Steele County Area Transit (now SMART)
M-F 6am-6pm; Sat 9am-3pm; Sun 730am-1pm
Route deviation and demand response in the city of Owatonna and Steele County
Oakdale Motel
Stewartville Heartland Express
M-F 830am-5pm Dial-a-ride in the city of Stewartville and limited service to Rochester
Rochester City Line Bus Stop, Rochester Airport
Three Rivers Hiawathaland Transit
M-F 6am-645pm; Sat 7am-5pm
Route deviation and dial-a-ride in Goodhue, Rice, and Wabasha Counties
Nelson's Market Place
Trailblazer Transit M-F 630am-530pm Dial-a-ride and volunteer transportation in Sibley and McLeod Counties
Go for It C Store, Cenex
Transit Alternatives M-F 6am-6pm Route deviation, dial-a-ride, and subscription in Clay and Otter Tail Counties
White Earth Transit Station, Olson Oil Company, Tesoro
Tri-Cap Transit Connection
M-F 7am-5pm Flex route and dial-a-ride in Benton, Morrison, and Stearns Counties
Pilot Travel Center, Metro Bus
Tri-Valley Heartland Express
M-F 7am-5pm Route deviation and dial-a-ride in the city of Bagley and 6 counties: Polk, Norman, Marshall, Pennington, Red Lake, and Kittson
Westside Express - Tesoro, Tri-Valley Heartland Express, University of MN Crookston, Le Piers West Convenience Store, MN State University, Ness Cafe
Wadena County Friendly Rider Transit
M-F 715am-530pm; Sat 10am-2pm; Sun 8am-1230pm
Route deviation and dial-a-ride in Wadena and northern Todd Counties
TJ's Detail Center, Ernie's
Waseca County Transit
M/W 8am-3pm; F 8am-1230pm
Demand response in Waseca County Casey's General Store
Watonwan Take Me There (TMT)
M-F 6am-5pm Dial-a-ride and subscription in Watonwan County and the surrounding area
Land to Air Depot, Freedom Valu Center
Western Community Action
M-F 545am-9pm; Sat 830am-615pm; Sun 8am-4pm
Route deviation, dial-a-ride, and subscription in Jackson, Lyon, and Redwood Counties; limited service in Cottonwood and Lincoln Counties
Ampride, Burger King
Winona Transit Service
M-F 6am-615pm Route deviation and subscription in the cities of Winona and Goodview
Sinclair Convenience Store, Transit Stop @ Winona State
Source: http://www.dot.state.mn.us/transit/reports/transitreports/12/index-2012.html


Minnesota Intercity Study 2014 E-1
Demographic Analysis Methodology
The demographic analysis presented in Chapter 3 employs a scale of “very low” to “very high” to display the locations in Minnesota with potentially transit dependent persons (see Table E-1). The scale is based on the average for the state overall. It is important to note that a block group classified as “very low” can still have a significant number of potentially transit-dependent persons; “very low” only means below the average for Minnesota. At the other end of the spectrum, “very high” means greater than twice the state average. The classification method follows a structure introduced in a 2004 NCHRP report for assessing environmental justice impacts.1 Figures E-1 to E-4 display the density of transit-dependent persons in Minnesota by Economic Development Region.
Number/Percentage of Vulnerable Persons or Households Potential Transit Dependence Score
<= the state average 1 (Very Low)
> average and <= 1.33 times average 2 (Low)
> 1.33 times average and <= 1.67 times average 3 (Moderate)
> 1.67 times average and <= 2 times average 4 (High)
> 2 times the state average 5 (Very High)
The methodology used in this analysis differs from the 2010 study in that it does not include those persons with a disability as a transit-dependent population segment. Due to Census reporting, the most current disability information at the block group level is from Census 2000. This information is both dated and incompatible with 2010 block group geographies. In addition, the analysis increases the youth/young adult category from 18-24 to 18-34. The change reflects findings by Fischer and Schwieterman (2011) that almost three quarters of intercity passengers fall within the latter range.
1 Forkenbrock, D. and Sheeley, J. 2004. Effective Methods for Environmental Justice Assessment. NCHRP Report 532. Transportation Research Board. Washington, DC: National Academy Press.
Table E-1: Transit Dependence Classification
Appendix E
DEMOGRAPHIC AND LAND USE ANALYSIS

Minnesota Intercity Bus Study 2014E-2
R E G I O N 4R E G I O N 4
R E G I O N 1R E G I O N 1
R E G I O N 2R E G I O N 2
R E G I O N 5R E G I O N 5
Hibbing
Cohasset
St. Cloud
Baxter
North Branch
St. Augusta St. Francis
Moorhead
Bemidji
Alexandria
Fergus Falls
Sartell
Detroit Lakes
Mora
Little Falls
Rush
Pine
Morris
Wadena
Park Rapids
Glenwood
Sandstone
Crookston
Milaca
Foley
Perham
Melrose
Princeton
International Falls
East Grand Forks
Roseau
Thief River Falls
Barnesville
Breckenridge
Long Prairie
Moose Lake
0 20 40 Mi
Intercity Bus Routes
EDR Boundaries
Relative to Study Area
Very Low
Low
Moderate
High
Very High
Figure E-1: Density of Transit Dependent Populations, Economic Development Regions 1, 2, 4, & 5

Minnesota Intercity Bus Study 2014 E-3
R E G I O N R E G I O N
7 W7 W
R E G I O N 3R E G I O N 3
R E G I O N 7 ER E G I O N 7 E
Hibbing
Duluth
St. Paul
Hugo Blaine
Mountain Iron
Elk River Scandia
Minneapolis
Cloquet
East Bethel
Grant
Otsego
Cohasset
St. Cloud
Baxter
Minnetrista
North Branch
St. Augusta
Willmar
Bemidji
Chisago
Buffalo
Sartell
Mora
Little Falls
Rush
Pine
Ely
Cambridge
Wadena
Park Rapids
Litchfield
Sandstone
Milaca
Foley Melrose
International Falls
Moose Lake
Hutchinson
Annandale
Two Harbors
Long Prairie
M I N N E S O T A
W I S C O N S I N
0 20 40 Mi
Intercity Bus Routes
EDR Boundaries
Relative to Study Area
Very Low
Low
Moderate
High
Very High
Figure E-2: Density of Transit Dependent Populations, Economic Development Regions 3, 7E, & 7W

Minnesota Intercity Bus Study 2014E-4
R E G I O N 6 WR E G I O N 6 W
R E G I O N 6 ER E G I O N 6 E
R E G I O N 8R E G I O N 8
R E G I O N 9R E G I O N 9
Elk River
Minneapolis
Otsego Andover
Orono
Corcoran
Lakeville
St. Cloud
Bloomington
Baxter
Shakopee
St. Augusta
Chaska
Mankato
Fairmont
Willmar
Faribault
Alexandria
Becker
Fridley
Albert Lea
Buffalo
Fergus Falls
Sartell
Marshall
New Ulm
Owatonna
Mora
Isanti
Little Falls
Hutchinson
Morris
Worthington
St. Peter
Wadena
Jackson
Litchfield
Delano
Le Sueur
Glenwood
Belle Plaine
Windom
Milaca
Luverne
Foley
Pipestone
Montevideo
Perham
Melrose
Benson
Princeton
Redwood Falls
Glencoe
Blue Earth
Lonsdale
Zimmerman
Albany
Annandale
St. James
Watertown
Cold Spring
Cokato
Barnesville
Sleepy Eye
Breckenridge
Long Prairie
Lake Crystal
0 20 40 Mi
Intercity Bus Routes
EDR Boundaries
Relative to Study Area
Very Low
Low
Moderate
High
Very High
Figure E-3: Density of Transit Dependent Populations, Economic Development Regions 6E, 6W, 8, & 9

Minnesota Intercity Bus Study 2014 E-5
R E G I O N 1 0R E G I O N 1 0
St. Paul
Hugo
Eagan
Blaine
Rochester
Elk River
Scandia
Minneapolis
Afton
Lakeville
East Bethel
Grant
Red Wing
Otsego Andover
Orono
Corcoran
Plymouth
Ham Lake
Rosemount
Bloomington
Shakopee
Winona
Minnetrista
North Branch
Cottage Grove Chaska
Lake Elmo
St. Francis
Wyoming
Austin
Faribault
Chisago
Roseville
Albert Lea
Owatonna
Farmington
Hastings
Wabasha
Big Lake
Isanti
Rush
Lake Northfield
Waseca
Cambridge
Delano
Belle Plaine
Jordan
Byron
Princeton
St. Charles
Cannon Falls Lonsdale
Pine Island
La Crescent
Zimmerman
Caledonia
Stewartville
Zumbrota
Plainview
Elko New Market
Montgomery
New Prague
Dodge Center
M I N N E S O T A
W I S C O N S I N
I O W A
0 10 20 Mi
Intercity Bus Routes
EDR Boundaries
Relative to Study Area
Very Low
Low
Moderate
High
Very High
Figure E-4: Density of Transit Dependent Populations, Economic Development Region 10

Minnesota Intercity Bus Study 2014E-6
Minnesota Destinations and Facilities
CORRECTIONAL FACILITIESName City < 10
miles10-25 miles
> 25 miles
Stillwater Bayport xFaribault Faribault xLino Lakes Lino Lakes xWillow River/Moose Lake Moose Lake xRed Wing Red Wing xRush City Rush City xShakopee Shakopee xSt. Cloud St. Cloud xOak Park Heights Stillwater xTogo Togo xSource: MN Department of Corrections. http://www.corr.state.mn.us/facilities/default.htm
EDUCATIONAL FACILITIESName City 2011 Enrollment < 10
miles10-25 miles
> 25 miles
Academy College Minneapolis 191 xAdler Graduate School Richfield 84 xAlexandria Technical College Alexandria 2,770 xAmerican Academy of Acupuncture Roseville 110 xAmerican Indian OIC Minneapolis 111 xAnoka Technical College Anoka 2,389 xAnoka-Ramsey Community College Coon Rapids 9,234 xAnthem College St. Louis Park 298 xApostolic Bible Institute St. Paul xArgosy University, Twin Cities Eagan 2,145 xArt Institutes International Minnesota Minneapolis 1,794 xAugsburg College Minneapolis 3,908 xAveda Institute Minneapolis Minneapolis 369 xBemidji State University Bemidji 5,368 xBethany College of Missions Bloomington xBethany Lutheran College Mankato 612 xBethel University St. Paul xBrown College Mendota Heights 485 xCardinal Stritch University Edina xCarleton College Northfield 2,018 xCentral Lakes College Brainerd 4,406 x
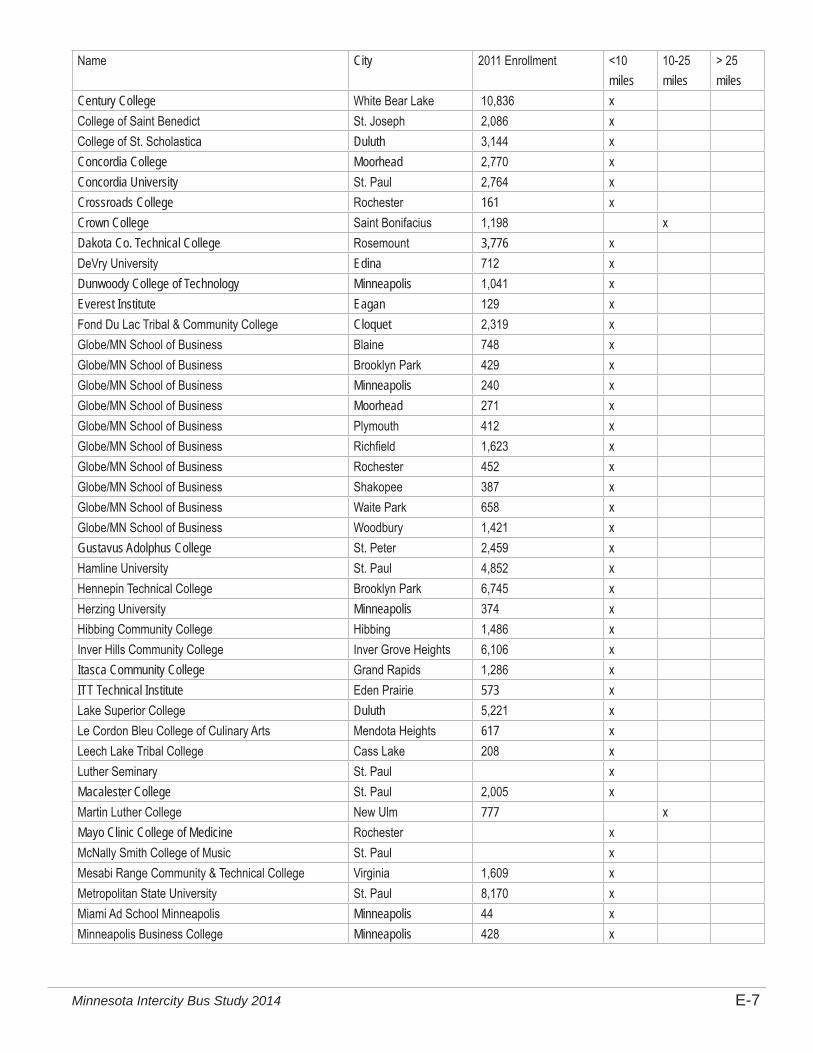
Minnesota Intercity Bus Study 2014 E-7
Name City 2011 Enrollment <10 miles
10-25 miles
> 25 miles
Century College White Bear Lake 10,836 xCollege of Saint Benedict St. Joseph 2,086 xCollege of St. Scholastica Duluth 3,144 xConcordia College Moorhead 2,770 xConcordia University St. Paul 2,764 xCrossroads College Rochester 161 xCrown College Saint Bonifacius 1,198 xDakota Co. Technical College Rosemount 3,776 xDeVry University Edina 712 xDunwoody College of Technology Minneapolis 1,041 xEverest Institute Eagan 129 xFond Du Lac Tribal & Community College Cloquet 2,319 xGlobe/MN School of Business Blaine 748 xGlobe/MN School of Business Brooklyn Park 429 xGlobe/MN School of Business Minneapolis 240 xGlobe/MN School of Business Moorhead 271 xGlobe/MN School of Business Plymouth 412 xGlobe/MN School of Business Richfield 1,623 xGlobe/MN School of Business Rochester 452 xGlobe/MN School of Business Shakopee 387 xGlobe/MN School of Business Waite Park 658 xGlobe/MN School of Business Woodbury 1,421 xGustavus Adolphus College St. Peter 2,459 xHamline University St. Paul 4,852 xHennepin Technical College Brooklyn Park 6,745 xHerzing University Minneapolis 374 xHibbing Community College Hibbing 1,486 xInver Hills Community College Inver Grove Heights 6,106 xItasca Community College Grand Rapids 1,286 xITT Technical Institute Eden Prairie 573 xLake Superior College Duluth 5,221 xLe Cordon Bleu College of Culinary Arts Mendota Heights 617 xLeech Lake Tribal College Cass Lake 208 xLuther Seminary St. Paul xMacalester College St. Paul 2,005 xMartin Luther College New Ulm 777 xMayo Clinic College of Medicine Rochester xMcNally Smith College of Music St. Paul xMesabi Range Community & Technical College Virginia 1,609 xMetropolitan State University St. Paul 8,170 xMiami Ad School Minneapolis Minneapolis 44 xMinneapolis Business College Minneapolis 428 x

Minnesota Intercity Bus Study 2014E-8
Name City 2011 Enrollment <10 miles
10-25 miles
> 25 miles
Minneapolis College of Art and Design Minneapolis 665 xMinneapolis Community & Technical College Minneapolis 10,191 xMinnesota School of Cosmetology Woodbury xMinnesota State College - SE Technical Winona 2,418 xMinnesota State Community & Technical College Fergus Falls 6,950 xMinnesota State University Mankato 15,709 xMinnesota State University Moorhead 7,244 xMinnesota West Community & Technical College Pipestone 3,364 xMN State Community & Technical College Detroit Lakes 6,950* xMN State Community & Technical College Moorhead 6,950* xMN State Community & Technical College Wadena 6,950* xMN West Community & Technical College Canby 3,364* xMN West Community & Technical College Granite Falls 3,364* xMN West Community & Technical College Jackson 3,364* xMN West Community & Technical College Worthington 3,364* xNational American University Bloomington 603 xNational American University Brooklyn Center 836 xNational American University Roseville 529 xNormandale Community College Bloomington 9,942 xNorth Central University Minneapolis 1,384 xNorth Hennepin Community College Brooklyn Park 7,432 xNorthland Community & Technical College Thief River Falls 3,958 xNorthwest Technical College Bemidji 1,371 xNorthwest Technical Institute Eagan xNorthwestern College St. Paul 3,043 xNorthwestern Health Sciences University Bloomington xOak Hills Christian College Bemidji 117 xPine Technical College Pine City 1,155 xRainy River Community College International Falls 376 xRasmussen College Brooklyn Park 6,651* xRasmussen College Eagan 6,651* xRasmussen College Eden Prairie 6,651* xRasmussen College Lake Elmo 6,651* xRasmussen College Mankato 6,651* xRasmussen College Moorhead 6,651* xRasmussen College St. Cloud 6,651* xRidgewater College Willmar 4,146 xRiverland Community College Austin 3,720* xRiverland Community College Albert Lea 3,720* xRiverland Community College Owatonna 3,720* xRochester Community & Technical College Rochester 6,055 xSaint John Vianney College Seminary St. Paul x

Minnesota Intercity Bus Study 2014 E-9
Name City 2011 Enrollment <10 miles
10-25 miles
> 25 miles
Saint John’s University Collegeville 2,010 xSaint Mary’s Univ. of MN Rochester 5,688* xSaint Mary’s Univ. of MN Minneapolis 5,688* xSaint Mary’s Univ. of MN Winona 5,688* xSaint Paul College St. Paul 6,322 xSouth Central College North Mankato 4,083* xSouth Central College Faribault 4,083* xSouthwest MN State University Marshall 6,761 xSt. Catherine University Minneapolis 5,227* xSt. Catherine University St. Paul 5,227* x
St. Cloud State University St. Cloud 17,604 xSt. Cloud Technical College St. Cloud 4,708 xSt. Olaf College Northfield 3,179 xSummit Academy OIC Minneapolis 179 xTechSkills Bloomington 42 xUnited Theological Seminary New Brighton 177 xUniversity of Minnesota Crookston 2,653 xUniversity of Minnesota Duluth 11,806 xUniversity of Minnesota Morris 1,932 xUniversity of Minnesota Rochester 273 xUniversity of Minnesota Minneapolis 52,556 xUniversity of Phoenix St. Louis Park 274 xUniversity of St. Thomas Minneapolis 10,506* xUniversity of St. Thomas St. Paul 10,506* xVermilion Community College Ely 781 xWhite Earth Tribal & Community College Mahnomen 101 xWilliam Mitchell College of Law St. Paul 1,011 xWinona State University Winona 8,960 x*Enrollment split between multiple campuses. Sources: http://www.ohe.state.mn.us/pdf/enrollment/basicdata/basicData2011.pdf http://www.mnprivatecolleges.org/our-colleges http://www.mnscu.edu/colleges/campuses.html

Minnesota Intercity Bus Study 2014E-10
COMMERCIAL AIRPORTSName Code City < 10
miles10-25 miles
> 25 miles
Minneapolis-St. Paul International MSPLindbergh Terminal St. Paul xHumphrey Terminal Minneapolis xBemidji Regional BJI Bemidji xBrainerd Lakes Regional BRD Brainerd xRange Regional HIB Hibbing xDuluth International DLH Duluth xInternational Falls INL International Falls xRochester International RST Rochester xSt. Cloud International STC St. Cloud xThief River Falls Regional TVF Thief River Falls xSource: http://www.dot.state.mn.us/aero/airports.html
MILITARY INSTALLATIONSName City < 10
milesCamp Ripley- MN National Guard Little Falls xDuluth Air National Guard Duluth xMarine Safety Unit Duluth Duluth xMinneapolis-St. Paul Air Reserve Station Minneapolis xSources: http://usmilitary.about.com/od/theorderlyroom/l/blstatefacts.htm http://www.militaryinstallations.dod.mil http://www.minnesotanationalguard.org
MEDICAL FACILITIESName City MN Licensed Bed
Capacity< 10 miles
10-25 miles
> 25 miles
Abbott Northwestern Hospital Minneapolis 952 xAvera Marshall Regional Medical Center Marshall 49 xBuffalo Hospital Buffalo 65 xCambridge Medical Center Cambridge 86 xChildren’s Hospital & Clinics Minneapolis 279 xCuyuna Regional Medical Center Crosby 42 xDistrict One Hospital Faribault 49 xDouglas County Hospital Alexandria 127 xEssentia Health Duluth Duluth 165 xEssentia Health Fosston Fosston 43 x

Minnesota Intercity Bus Study 2014 E-11
Name City MN Licensed Bed Capacity
<10 miles
10-25 miles
>25 miles
Essentia Health St. Josephs Brainerd 162 xEssentia Health St. Mary’s Duluth 380 xEssentia Health St. Mary’s Detroit Lakes 87 xEssentia Health Virginia Virginia 83 xFairview Lakes Medical Center Wyoming 61 xFairview Northland Regional Princeton 54 xFairview Ridges Hospital Burnsville 150 xFairview Southdale Hospital Edina 390 xFirstlight Health System Mora 49 xGillette Childrens Hospital St. Paul 60 xGlencoe Regional Health Services Glencoe 49 xGrand Itasca Clinic & Hospital Grand Rapids 64 xHealtheast Bethesda Hospital St. Paul 254 xHealtheast St Johns Hospital Maplewood 184 xHealtheast Woodwinds Hospital Woodbury 86 xHennepin County Medical Center Minneapolis 894 xHutchinson Health Hutchinson 66 xLake Region Healthcare Fergus Falls 108 xLakeview Memorial Hospital Stillwater 97 xMaple Grove Hospital Maple Grove 130 xMayo Clinic Health System Albert Lea 77 xMayo Clinic Health System Austin 82 xMayo Clinic Health System Fairmont 57 xMayo Clinic Health System Mankato 272 xMayo Clinic Health System New Prague 49 xMayo Clinic Health System Red Wing 50 xMayo Clinic Methodist Hospital Rochester 794 xMayo Clinic St. Mary’s Hospital Rochester 1265 xMercy Hospital Coon Rapids 271 xMN DOH Central District Rochester xMN DOH Freeman Building St. Paul xMN DOH Golden Rule Building Saint Paul xMN DOH NE District Duluth xMN DOH NW District Bemidji xMN DOH S. Central District Fergus Falls xMN DOH SE District Marshall xMN DOH SW District Mankato xMN DOH West Central District St. Cloud xNew Ulm Medical Center New Ulm 62 xNorth Memorial Medical Center Robbinsdale 518 xOlmsted Medical Center Rochester 61 xOwatonna Hospital Owatonna 43 x

Minnesota Intercity Bus Study 2014E-12
Name City MN Licensed Bed Capacity
<10 miles
10-25 miles
>25 miles
Park Nicollet Methodist Hospital St. Louis Park 426 xPipestone County Medical Center Pipestone 44 xRainy Lake Medical Center International Falls 49 xRegency Hospital Golden Valley 92 xRegina Medical Center Hastings 57 xRegions Hospital St. Paul 454 xRice Memorial Hospital Willmar 136 xRiverview Hospital & Nursing Home Crookston 49 xRiverview Medical Center Waconia 109 xSanford Bemidji Medical Center Bemidji 118 xSanford Medical Center Thief River Falls Thief River Falls 99 xSanford Worthington Medical Worthington 48 xShriners Hospital For Children Minneapolis 40 xSt. Cloud Hospital St. Cloud 489 xSt. Francis Regional Medical Center Shakopee 93 xSt. Gabriels Hospital Little Falls 49 xSt. Josephs Area Health Services Park Rapids 50 xSt. Josephs Hospital St. Paul 401 xSt. Luke’s Hospital Duluth 267 xStevens Community Medical Center Morris 54 xTri County Hospital Wadena 49 xUnited Hospital St. Paul 546 xUnited Hospital District Blue Earth 43 xUnity Hospital Fridley 275 xUniversity Medical Center Mesabi Hibbing 175 xUniversity of Minnesota Medical Center Minneapolis 1700 xWinona Health Services Winona 99 xSources: http://www.health.state.mn.us/divs/fpc/directory/showprovideroutput.cfm http://www.health.state.mn.us/index.html

Minnesota Intercity Bus Study 2014 F-1
Appendix F
SURVEY METHODOLOGY AND DETAILS
Notes on Reading the Survey ResultsStatistically significant differences are noted through the use of boxes ( ) and letters. If a statistically significant difference occurs, a box is shown on the significantly higher of the two (or three) data points. Additionally, letters are used to note which percentage is significantly lower.
In the example at the right, those who took 5 to 12 trips in the past year are significantly more likely than those who took more than 12 trips to live 10 miles or less from the most convenient bus stop. Similarly, those who took more than 12 trips are significantly more likely than those who took 4 or less trips to live more than 10 miles from the most convenient bus stop.
All figures represent the total population sampled (610 for the household survey and 318 for the onboard survey), unless otherwise noted.
Standard Error of the DataHousehold Survey If the percentage found is around:
50% 40% or 60%
30% or 70%
20% or 80%
10% or 90%
1% or 99%
Then, the standard error in percentage points for a total sample of n = 610 is: ±4.0 ±3.9 ±3.6 ±3.2 ±2.4 ±0.8
For example, if a question yielded a percentage of 20%, then we can be sure 95 out of 100 times that the true percentage would lie between 16.8% and 23.2% (20% ±3.2 percentage points).
Onboard Survey If the percentage found is around:
50% 40% or 60%
30% or 70%
20% or 80%
10% or 90%
1% or 99%
Then, the standard error in percentage points for a total sample of n = 318 is: ±5.5 ±5.4 ±5.0 ±4.4 ±3.3 ±1.1
For example, if a question yielded a percentage of 20%, then we can be sure 95 out of 100 times that the true percentage would lie between 15.6% and 24.4% (20% ±4.4 percentage points).
Distance from Home to Most Convenient Bus StopTravel Frequency in the
Past Year10 miles or
lessMore than 10
miles4 or less trips (A) 51% 36%5 to 12 trips (B) 53% C 46%More than 12 trips (C) 37% 55% A

Minnesota Intercity Bus Study 2014F-2
Onboard Survey Details
In total, 318 onboard interviews were conducted among passengers on 36 different Jefferson Lines and Land to Air Express intercity buses. The interviewing was conducted August 26 - 29, 2013 by five WBA professional intercept interviewers. In some cases the interviewer only rode the bus for a portion of the route.
Route Company Origin Destination S. 5311(f) Status Dates Surveyed
Interviews
234 Land to Air Rochester Mankato Subsidized 8/27 1235 Land to Air Mankato Rochester Subsidized 8/28 3701 Jefferson Minneapolis Sioux Falls, SD Unsubsidized 8/26 14702 Jefferson Sioux Falls, SD Minneapolis Unsubsidized 8/26 16906 Jefferson Duluth Minneapolis Subsidized 8/28 13911 Jefferson Minneapolis Duluth Subsidized 8/26, 8/27,
8/2830
912 Jefferson Duluth Minneapolis Unsubsidized 8/27, 8/29 25919 Jefferson Duluth Grand Rapids Subsidized 8/28 3920 Jefferson Grand Rapids Duluth Subsidized 8/29 4925 Jefferson Minneapolis Sioux Falls, SD Subsidized 8/26, 8/27,
8/28, 8/2919
926 Jefferson Sioux Falls, SD Minneapolis Subsidized 8/26, 8/27, 8/28, 8/29
25
927 Jefferson Minneapolis Fargo, ND Subsidized 8/26, 8/27, 8/28, 8/29
60
928 Jefferson Fargo, ND Minneapolis Subsidized 8/26, 8/27, 8/28, 8/29
30
929 Jefferson Duluth Fargo, ND Subsidized 8/26 9930 Jefferson Fargo, ND Duluth Subsidized 8/29 12965 Jefferson Minneapolis Milwaukee, WI Subsidized 8/26, 8/27,
8/2827
966 Jefferson Milwaukee, WI Minneapolis Subsidized 8/27, 8/28, 8/29
27

Minnesota Intercity Bus Study 2014 F-3
Household Survey Details
The household survey included 610 interviews of Minnesota residents conducted September 18 - 29, 2013 by WBA’s professional telephone interviewers. To qualify, respondents needed to live in Minnesota and have traveled from home on at least one trip of 75 miles or more one-way to a destination in the continental U.S. or Canada within the past twelve months. Quotas were set for each Economic Development Region. The number of interviews completed among residents of each region is consistent with the region’s relative population. Weights were applied to make the data consistent with the ages of the actual population of the residents of Minnesota.
Region Population Percent Interviews Percent1 86,091 1.6% 10 1.6%2 83,023 1.6% 9 1.5%3 326,225 6.2% 37 6.1%4 221,688 4.2% 25 4.1%5 163,003 3.1% 19 3.1%6 163,110 3.1% 17 2.8%7 566,081 10.7% 67 11.0%8 119,151 2.2% 15 2.5%9 231,302 4.4% 26 4.3%
10 494,684 9.3% 56 9.2%11 2,849,567 53.7% 329 53.9%
Total 5,303,925 100% 610 100%


Minnesota Intercity Bus Study 2014 G-1
Appendix G
ONBOARD SURVEY QUESTIONS

Minnesota Intercity Bus Study 2014G-2

Minnesota Intercity Bus Study 2014 G-3
Minnesota Intercity Bus Study 2014G-4

Minnesota Intercity Bus Study 2014 G-5

Minnesota Intercity Bus Study 2014G-6
Minnesota Intercity Bus Study 2014 G-7

Minnesota Intercity Bus Study 2014G-8

Minnesota Intercity Bus Study 2014 G-9

Minnesota Intercity Bus Study 2014G-10

Minnesota Intercity Bus Study 2014 G-11

Minnesota Intercity Bus Study 2014 H-1
Appendix H
HOUSEHOLD SURVEY QUESTIONS

Minnesota Intercity Bus Study 2014H-2
Minnesota Intercity Bus Study 2014 H-3

Minnesota Intercity Bus Study 2014H-4

Minnesota Intercity Bus Study 2014 H-5

Minnesota Intercity Bus Study 2014H-6

Minnesota Intercity Bus Study 2014 H-7

Minnesota Intercity Bus Study 2014H-8

Minnesota Intercity Bus Study 2014 H-9

Minnesota Intercity Bus Study 2014H-10

Minnesota Intercity Bus Study 2014 H-11


Minnesota Intercity Bus Study 2014 I-1
Appendix I
S. 5311(F) NETWORK PERFORMANCE AND EVALUATION
Stop FY 2013 Ridership Trip Rate 2010 Place PopulationScanlon 683 0.69 991Hinckley 626 0.35 1,800
Cass Lake 234 0.3 770Detroit Lakes 1,399 0.16 8,569
Walker 147 0.16 941Granite Falls 385 0.13 2,897
Bemidji 1,757 0.13 13,431Winona 3,125 0.11 27,592
Albert Lea 1,964 0.11 18,016
Perham 310 0.1 2,985Fosston 126 0.08 1,527
Bagley 112 0.08 1,392Erskine 36 0.07 503
Pine City 213 0.07 3,123Moose Lake 163 0.06 2,751
Clara City 76 0.06 1,360Marshall 685 0.05 13,680
Willmar 950 0.05 19,610Sandstone 120 0.04 2,849
Crookston 307 0.04 7,891Glencoe 155 0.03 5,631
Pipestone 114 0.03 4,317Luverne 111 0.02 4,745
North Branch 204 0.02 10,125Litchfield 125 0.02 6,726
Austin 457 0.02 24,718Hutchinson 147 0.01 14,178
Total 14,731 - 203,118
*Table I-1 does not include any stops within urbanized areas. It does not include Wadena, due to that location’s prior status as a transfer point.
Table I-1: Annual Passenger Boardings Per Capita in Non-Urbanized Communities
Average Ridership: 546 Median Ridership: 213
Average Trip Rate: 0.07 Median Trip Rate: 0.07
Trip Rate Standard Deviation: 0.14

Minnesota Intercity Bus Study 2014I-2
Table
I-2:
FY 20
13 S
. 531
1(f)
Route
Per
forma
nce
Prov
ider
Sche
dule
Numb
erRo
ute
Pass
enge
rsTr
ips pe
r
week
Annu
al
Trips
Boar
dings
per T
rip
Total
Rev
enue
(M
N)To
tal C
osts
(MN)
Fare
Box
Ra
tio
Twin
Citie
s
Trun
k Rou
te?Je
fferso
n Line
s90
6Du
luth t
o Minn
eapo
lis 5,
683
7 36
4 15
.6 $1
56,99
4 $2
04,86
5 77
%Y
909
Minn
eapo
lis to
Dulu
th 3,
734
7 36
4 10
.3 $8
4,208
$2
05,74
2 41
%Y
910
Dulut
h to M
innea
polis
via M
ora
4,96
7 7
364
13.6
$121
,119
$206
,518
59%
Y91
1Mi
nnea
polis
to D
uluth
via M
ora
6,65
4 7
364
18.3
$164
,933
$225
,407
73%
Y92
9W
aden
a to F
argo
* 3,
364
5 26
0 12
.9 $5
1,311
$1
15,69
7 44
%93
0Fa
rgo t
o Wad
ena*
3,44
2 5
260
13.2
$51,7
10
$113
,332
46%
932
Minn
eapo
lis to
Milw
auke
e 8,
386
7 36
4 23
.0 $1
24,59
7 $1
96,70
0 63
%Y
935
Milw
auke
e to M
innea
polis
7,47
0 7
364
20.5
$99,5
39
$198
,333
50%
Y91
9Du
luth t
o Gra
nd R
apids
** 55
7
56
1.0
$778
$1
4,432
5%
920
Gran
d Rap
ids to
Dulu
th**
141
7 56
2.
5 $1
,374
$15,1
76
9%92
3Ro
ches
ter to
Minn
eapo
lis vi
a Red
Wing
614
7XH
355
1.7
$8,78
2 $1
29,88
7 7%
Y92
4Mi
nnea
polis
to R
oche
ster v
ia Re
d Wing
648
7XH
355
1.8
$9,41
9 $1
27,58
3 7%
Y92
5Mi
nnea
polis
to S
ioux F
alls
1,99
1 4X
5H
203
9.8
$63,1
06
$191
,003
33%
Y92
6Si
oux F
alls t
o Minn
eapo
lis 2,
260
4X5H
20
3 11
.1 $7
8,799
$1
93,03
7 41
%Y
927
Farg
o via
Bemi
dji (s
outh)
2,16
6 3X
H 14
6 14
.8 $4
6,623
$1
42,99
4 33
%92
8Fa
rgo v
ia Be
midji
(nor
th) 2,
096
3XH
146
14.4
$40,0
70
$143
,482
28%
Land
to A
ir23
2Ow
atonn
a to M
anka
to 18
9 14
72
8 0.
3 $1
,865
$25,7
47
7%23
3Ma
nkato
to O
waton
na 30
3 14
72
8 0.
4 $3
,007
$25,7
47
12%
234
Roch
ester
to M
anka
to 1,
095
7 36
4 3.
0 $1
6,090
$6
9,963
23
%23
5Ma
nkato
to R
oche
ster
1,04
9 7
364
2.9
$16,3
13
$69,9
63
23%
TOTA
L 56
,307
6,40
8 $1
,140,6
36
$2,61
5,607
44
%
XH=
“Exc
ept H
olida
ys.” A
ssum
es 10
annu
al ho
liday
s.
*Wad
ena t
o/fro
m Fa
rgo i
s now
serve
d by a
restr
uctur
ed 92
9/930
betw
een D
uluth
and F
argo
. **D
ata fo
r Jeff
erso
n Line
s’ 91
9/920
only
includ
es 2
month
s rep
orted
.

Minnesota Intercity Bus Study 2014 I-3
Table
I-3:
Cand
idate
Inter
city B
us S
top Lo
catio
ns (c
ontin
ued n
ext p
age)
*The
annu
al trip
estim
ate us
es an
equa
tion i
nclud
ing 20
10 ho
useh
olds,
an in
tercit
y mod
e sha
re of
.018
5, an
d a da
ily lo
ng di
stanc
e trip
rate
of 0.0
3. Se
e NCH
RP R
epor
t 735
, Lon
g-Di
stanc
e an
d Rur
al Tr
avel
Tran
sfera
ble P
aram
eters
for S
tatew
ide Tr
avel
Fore
casti
ng M
odels
, Was
hingto
n, DC
2012
, Tab
le 6.7
and S
. 1. F
or ve
rifica
tion,
estim
ates w
ere a
lso ca
lculat
ed fo
r exis
ting r
ural
stops
and c
ompa
red t
o actu
al FY
2013
rider
ship.
The
aver
age d
iffere
nce i
n actu
al rid
ersh
ip an
d the
equa
tion e
stima
te wa
s 65 t
rips.
Need
s
Analy
sis
Plac
e Res
ults
2010
Pop.
2010
#
of HH
s
Est.
Annu
al
Trips
On ex
isting
route
, no
stop
< 10
mi
to sto
p
10-2
5 mi
to sto
p
>25 m
i
to sto
p
Prior
ICB
stop?
Loca
l Tra
nsit A
genc
yDa
ily
Conn
ectio
n
to IC
B
Inter
city C
onne
ction
Note
s
Hasti
ngs
22,17
2 8,
735
1,76
9 x
xMe
tro Tr
ansit
Farm
ington
21
,086
7,06
6 1,
431
xMe
tro Tr
ansit
Y To
Minn
eapo
lis vi
a com
muter
bus
from
Park&
Ride
. No W
eeke
nds.
Red W
ing 16
,459
7,01
7 1,
421
xx
Hiaw
athala
nd Tr
ansit
YTo
Minn
eapo
lis, v
ia Am
trak E
mpire
Build
er (7
27 &
828)
New
Ulm
13,52
2 5,
732
1,16
1 x
Brow
n Cou
nty H
eartla
nd
Expr
ess (
Dial-
A-Ri
de)
Prev
iously
serve
d
Buffa
lo 15
,453
5,69
9 1,
154
xBu
ffalo
Allie
d Tra
nsit
10 m
iles f
rom
Monti
cello
Thief
Rive
r Fa
lls 8,
573
3,80
2 77
0 x
Tri-V
alley
Hea
rtland
Exp
ress
Comm
unity
colle
ge
Camb
ridge
8,11
1 3,
137
635
xIsa
nti-C
hisag
o Hea
rtland
Expr
ess
YSe
rved u
ntil F
Y13.
To N
orth
Bran
ch.
Not o
n Wee
kend
sInt
. Fall
s 6,
424
2,90
3 58
8 x
Arro
whea
d Tra
nsit
Two t
rips a
mon
th to
Dulut
h, Vi
rgini
a
and B
emidj
i and
Gra
nd R
apids
New
Prag
ue 7,
321
2,71
1 54
9 x
Smar
tLink
Tran
sit
(Dial
-A-R
ide)
No lin
k to N
orthfi
eld
Lake
City
5,06
3 2,
238
453
xx
Hiaw
athala
nd Tr
ansit
YTo
Roc
heste
r. No W
eeke
nds
Kass
on 5,
931
2,22
4 45
1 x
Roch
ester
City
Line
s &
Rollin
g Hills
Tran
sit
YTo
Roc
heste
r. No W
eeke
nds
Wind
om 4,
646
1,99
4 40
4 x
Wes
tern C
ommu
nity A
ction
-
Comm
unity
Tran
sit
Near
est s
top is
Jack
son,
10-2
5 mile
s

Minnesota Intercity Bus Study 2014I-4
Table
I-3:
Cand
idate
Inter
city B
us S
top Lo
catio
ns (c
ontin
ued)
*The
annu
al trip
estim
ate us
es an
equa
tion i
nclud
ing 20
10 ho
useh
olds,
an in
tercit
y mod
e sha
re of
.018
5, an
d a da
ily lo
ng di
stanc
e trip
rate
of 0.0
3. Se
e NCH
RP R
epor
t 735
, Lon
g-Di
stanc
e an
d Rur
al Tr
avel
Tran
sfera
ble P
aram
eters
for S
tatew
ide Tr
avel
Fore
casti
ng M
odels
, Was
hingto
n, DC
2012
, Tab
le 6.7
and S
. 1. F
or ve
rifica
tion,
estim
ates w
ere a
lso ca
lculat
ed fo
r exis
ting r
ural
stops
and c
ompa
red t
o actu
al FY
2013
rider
ship.
The
aver
age d
iffere
nce i
n actu
al rid
ersh
ip an
d the
equa
tion e
stima
te wa
s 65 t
rips.
Need
s
Analy
sis
Plac
e Res
ults
2010
Pop.
2010
#
of HH
s
Est.
Annu
al
Trips
On ex
isting
route
, no
stop
< 10
mi
to sto
p
10-2
5 mi
to sto
p
>25 m
i
to sto
p
Prior
ICB
stop?
Loca
l Tra
nsit A
genc
yDa
ily
Conn
ectio
n
to IC
B
Inter
city C
onne
ction
Note
s
Princ
eton
4,69
8 1,
926
390
xTim
ber T
rails
Tran
sitNe
ares
t stop
is M
ontic
ello,
10-2
5 mi
lesPa
rk Ra
pids
3,70
9 1,
772
359
xx
Hubb
ard C
ounty
Hea
rtland
Ex
pres
s (Di
al-A-
Ride
)Y
Serve
d unti
l last
year.
To B
emidj
i and
W
alker.
No W
eeke
nds
Ely
3,46
0 1,
681
341
xAr
rowh
ead T
rans
itOn
e trip
a we
ek to
Virg
inia &
Hibb
ing
Two H
arbo
rs 3,
745
1,64
9 33
4 x
Arro
whea
d Tra
nsit
Two t
rips p
er m
onth
to Du
luth
Le S
ueur
4,05
8 1,
640
332
xTim
ber T
rails
Tran
sit
(Dial
-A-R
ide)
On M
anka
to La
nd to
Air r
oute
Slee
py E
ye 3,
599
1,47
5 29
9 x
Brow
n Cou
nty H
eartla
nd
Expr
ess (
Dial-
A-Ri
de)
More
than
25 m
i
Bens
on 3,
240
1,46
9 29
8 x
Prair
ie Fiv
e (Di
al-A-
Ride
)25
mi fr
om M
orris
Melro
se 3,
598
1,30
9 26
5 x
xTr
i-Cap
Tran
sit (D
ial-A
-Ride
)On
exist
ing G
rand
For
ks ro
ute
Silve
r Bay
Ci
ty 1,
887
836
169
xAr
rowh
ead T
rans
itTw
o trip
s a m
onth
to Du
luth
Auro
ra 1,
682
777
157
xAr
rowh
ead T
rans
itY
To V
irgini
a. No
Wee
kend
s
Twin
Valle
y 82
4 35
7 72
x
Tri-V
alley
Hea
rtland
Exp
ress
Just
over
10 m
i to M
ahno
men
Onam
ia 87
8 34
9 71
x
Timbe
r Tra
ils Tr
ansit
(D
ial-A
-Ride
)Ov
er 25
mi to
Little
Fall
s

Minnesota Intercity Bus Study 2014 I-5
Table
I-4:
Poten
tial L
ocal
Tran
sit C
onne
ction
s for
Exis
ting I
nterci
ty St
ops (
conti
nued
next
page
)
*Ass
umes
that
10 pe
rcent
of int
ercit
y ride
rs tra
nsfer
from
loca
l tran
sit, p
er ho
useh
old su
rveys
.
Non-
Urba
n Stop
2010
Pop
.20
10 H
HsEs
t. Ann
ual
Trips
Est. L
ocal
Tran
sit
Trips
to IC
B*
Loca
l Tra
nsit S
ystem
Wee
kend
Servi
ce?
Aitki
n 2,
165
936
190
19
Arro
whea
d Tra
nsit
Al
bert
Lea
18,01
6 7,
774
1,57
5 15
7 A
lbert
Lea T
rans
it, Au
stin-
Mowe
r Co.
Area
Tran
sit (n
ow S
MART
), Fa
ribau
lt Cou
nty P
E Y
Al
exan
dria
11,07
0 5,
298
1,07
3 10
7 Tr
ansit
Alte
rnati
ves,
Rainb
ow R
ider T
rans
it Y
Au
stin
24,71
8 10
,131
2,05
2 20
5 A
ustin
-Mow
er C
o. Ar
ea Tr
ansit
, Albe
rt Le
a Tra
nsit (
now
SMAR
T) Y
Ba
gley
1,39
2 61
9 12
5 13
Tr
i-Vall
ey H
eartla
nd E
xpre
ss, W
hite E
arth
Triba
l Tra
nsit
Bemi
dji 13
,431
5,33
9 1,
082
108
Arro
whea
d Tra
nsit,
Hubb
ard C
ounty
Hea
rtland
Exp
ress
, Pau
l Bun
yan T
rans
it, FA
R No
rth P
ublic
Tran
sit
Y
Brain
erd
13,59
0 5,
851
1,18
5 11
9 A
rrowh
ead T
rans
it, Br
ainer
d/Cro
w W
ing C
ounty
Tran
sit
Y
Cass
Lake
770
305
62
6 W
hite E
arth
Triba
l Tra
nsit
Clar
a City
1,36
0 58
4 11
8 12
Cr
ooks
ton 7,
891
3,10
9 63
0 63
Tr
i-Vall
ey H
eartla
nd E
xpre
ss
Cros
by 2,
386
1,06
5 21
6 22
A
rrowh
ead T
rans
it, Br
ainer
d/Cro
w W
ing C
ounty
Tran
sit
Y
Detro
it Lak
es 8,
569
3,86
4 78
3 78
Tr
ansit
Alte
rnati
ves,
Whit
e Ear
th Tr
ibal T
rans
it, Be
cker
Cou
nty Tr
ansit
Do
dge C
enter
2,67
0 99
8 20
2 20
S
EMAC
(now
Roll
ing H
ills Tr
ansit
)Er
skine
503
234
47
5 Tr
i-Vall
ey H
eartla
nd E
xpre
ss
Fairm
ont
10,66
6 4,
812
975
97
Mar
tin C
ounty
Tran
sit
Y
Farib
ault
23,35
2 8,
317
1,68
5 16
8 T
hree
Rive
rs Hi
awath
aland
Tran
sit
Ferg
us F
alls
13,13
8 5,
814
1,17
8 11
8 Tr
ansit
Alte
rnati
ves
Fore
st La
ke 18
,377
7,01
5 1,
421
142
Metr
o Tra
nsit
Y
Foss
ton 1,
527
670
136
14
Tri-V
alley
Hea
rtland
Exp
ress
, Fos
ston T
rans
it Gl
enco
e 5,
631
2,22
0 45
0 45
Tr
ailbla
zer T
rans
it Gr
and R
apids
10,86
9 4,
615
935
93
Arro
whea
d Tra
nsit
Y
Gran
ite F
alls
2,89
7 1,
282
260
26
Pra
irie F
ive R
ides,
Gran
ite F
alls H
E Ha
cken
sack
313
143
29
3 Hi
bbing
16,36
1 7,
414
1,50
2 15
0 A
rrowh
ead T
rans
it, Hi
bbing
Are
a Tra
nsit
Y
Hinc
kley
1,80
0 73
6 14
9 15
A
rrowh
ead T
rans
it Y
Hu
tchins
on 14
,178
5,95
0 1,
205
121
Trail
blaze
r Tra
nsit,
Meek
er C
ounty
Pub
lic Tr
ansit
Ja
ckso
n 3,
299
1,48
9 30
2 30
M
artin
Cou
nty Tr
ansit
, WCA
Com
munit
y Tra
nsit
Litch
field
6,72
6 2,
747
556
56
Mee
ker C
ounty
Pub
lic Tr
ansit
Y

Minnesota Intercity Bus Study 2014I-6
Table
I-4:
Poten
tial L
ocal
Tran
sit C
onne
ction
s for
Exis
ting I
nterci
ty St
ops (
conti
nued
)
*Ass
umes
that
10 pe
rcent
of int
ercit
y ride
rs tra
nsfer
from
loca
l tran
sit, p
er ho
useh
old su
rveys
.
Non-
Urba
n Stop
2010
Pop
.20
10 H
HsEs
t. Ann
ual
Trips
Est. L
ocal
Tran
sit
Trips
to IC
B*
Loca
l Tra
nsit S
ystem
Wee
kend
Servi
ce?
Little
Fall
s 8,
343
3,60
8 73
1 73
Tr
i-CAP
Tran
sit C
onne
ction
Lu
vern
e 4,
745
2,04
8 41
5 41
R
ock C
ounty
Hea
rtland
Exp
ress
Ma
hnom
en 1,
214
529
107
11
Mah
nome
n Cou
nty H
E, W
hite E
arth
Triba
l Tra
nsit
Marsh
all 13
,680
5,39
4 1,
093
109
Linc
oln C
ounty
HE,
WCA
Com
munit
y Tra
nsit
Y
McGr
egor
391
180
36
4 A
rrowh
ead T
rans
it
Monti
cello
12,75
9 4,
693
951
95
Rive
rRide
r Pub
lic Tr
ansit
Mo
ose L
ake
2,75
1 64
8 13
1 13
A
rrowh
ead T
rans
it
Morri
s 5,
286
1,98
6 40
2 40
R
ainbo
w Ri
der T
rans
it, Mo
rris T
rans
it Y
Ni
sswa
1,97
1 87
6 17
7 18
B
raine
rd/C
row
Wing
Cou
nty Tr
ansit
No
rth B
ranc
h 10
,125
3,60
4 73
0 73
C
hisag
o-Isa
nti C
ounty
HE
North
field
20,00
7 6,
272
1,27
1 12
7 T
hree
Rive
rs Hi
awath
aland
Tran
sit
Owato
nna
25,59
9 10
,068
2,04
0 20
4 S
teele
Coun
ty Ar
ea Tr
ansit
, Albe
rt Le
a Tra
nsit (
now
SMAR
T) Y
Pe
quot
Lake
s 2,
162
955
193
19
Bra
inerd
/Cro
w W
ing C
ounty
Tran
sit
Perh
am 2,
985
1,30
4 26
4 26
Tr
ansit
Alte
rnati
ves
Pine
City
3,12
3 1,
322
268
27
Arro
whea
d Tra
nsit,
Timbe
r Tra
ils P
ublic
Tran
sit
Y
Pine
Rive
r 94
4 41
7 84
8
Bra
inerd
/Cro
w W
ing C
ounty
Tran
sit, P
ine R
iver R
ide W
ith U
s Pi
pesto
ne 4,
317
1,92
3 39
0 39
P
ipesto
ne C
ounty
Tran
sit
Y
Sand
stone
2,84
9 60
2 12
2 12
A
rrowh
ead T
rans
it
Scan
lon 99
1 42
6 86
9
Arro
whea
d Tra
nsit
St. P
eter
11,19
6 3,
491
707
71
St. P
eter T
rans
it Y
St
aples
2,98
1 1,
222
248
25
Wad
ena C
ounty
Tran
sit
Y
Virg
inia
8,71
2 4,
242
859
86
Arro
whea
d Tra
nsit
Y
Wad
ena
4,08
8 1,
840
373
37
Wad
ena C
ounty
Tran
sit
Y
Walk
er 94
1 45
2 92
9
Was
eca
9,41
0 3,
504
710
71
Was
eca C
ounty
Tran
sit
Willm
ar 19
,610
7,67
7 1,
555
156
Kan
diyoh
i Are
a Tra
nsit
Y
Wino
na 27
,592
10,44
9 2,
117
212
Wino
na Tr
ansit
W
orthi
ngton
12,76
4 4,
458
903
90
Pra
irielan
d Tra
nsit

Minnesota Intercity Bus Study 2014 J-1
Appendix J
TCRP REPORT 147: RURAL INTERCITY DEMAND TOOLKIT
TCRP Report 147: Toolkit for Estimating Demand for Rural Intercity Bus Services was used to estimate ridership for and assess the feasibility of the potential routes documented in Chapter 5. The Toolkit can be found online at http://onlinepubs.trb.org/onlinepubs/tcrp/tcrp_rpt_147.pdf.
The Toolkit includes two models that generate estimates of annual ridership, based on user inputs. The first model is a regression model, a statistical equation based on the length of the route and the average population of the stops served (excluding the largest population stop, which is the assumed destination). The next model is a trip rate model using National Household Travel Survey data. It accounts for regional variation in long-distance public transportation trip rates of rural residents.
User inputs include stop population (either Urbanized Area or Urban Cluster population), route length, whether the route would serve a commercial airport and/or a correctional facility, and whether it would be operated by a national intercity bus operator.
The Toolkit can be adjusted to evaluate particular situations that may affect potential ridership. Both models already eliminate the population of the destination city as it is assumed that very few residents there would take advantage of a new opportunity for travel to a rural area that was previously unserved. In some cases it is also useful to remove other cities that already have substantial intercity bus service, where the potential impact of a small incremental expansion of service would be limited. For example, this analysis dropped Minneapolis from the Minneapolis–Winona route, leaving Red Wing as the destination. The ridership estimate thus reflects the remaining towns along the route and is much closer to likely demand.
Because of differences between the regression and trip rate model results in many of the corridors, the two demand estimates were averaged to provide a single number. This was done to be on the conservative side with regard to potential ridership. The Toolkit is also limited in that the models do not provide for testing the impact of multiple frequencies.

Minnesota Intercity Bus Study 2014J-2
Route Description One-Way Miles
Serves Airport
Serves Correc. Facility
Likely Operator
Regression Model
Ridership
Trip Rate Model
Ridership
Est. Ave. Ridership
Thief River Falls - Red Lake Falls - Crookston - Grand Forks (ND)
64 -- -- Non-Intercity
0 1,300 650
Thief River Falls - Erskine 34 -- -- Non-Intercity
0 600 300
Virginia - International Falls 98 -- -- Non-Intercity
0 600 300
Minneapolis - Elk River - Princeton - Onamia- Aitkin - Grand Rapids
184 -- -- Non-Intercity
400 0 200
Minneapolis - Red Wing - Lake City - Winona
119 -- Yes Non-Intercity
1,600 8,900 5,250
Silver Bay - Two Harbors - Duluth 55 -- -- Non-Intercity
0 200 100
Windom - Sleepy Eye - New Ulm - Mankato
91 -- -- Non-Intercity
0 900 450
Route Description One-Way Miles
Est. Avg. Ridership
Est. Annual
Revenue
Est. Farebox Recovery
Est. Annual Operating
Cost
Net Operating
Deficit
Net Deficit/ Passenger
Thief River Falls - Red Lake Falls - Crookston - Grand Forks (ND)
64 650 $4,992 4.6% $107,456 -$102,464 -$158
Thief River Falls - Erskine 34 300 $1,224 2.1% $57,086 -$55,862 -$186Virginia - International Falls 98 300 $3,528 2.1% $164,542 -$161,014 -$537Minneapolis - Elk River - Princeton - Onamia- Aitkin - Grand Rapids
184 200 $4,416 1.4% $308,936 -$304,520 -$1,523
Minneapolis - Red Wing - Lake City - Winona
119 5,250 $74,970 37.5% $199,801 -$124,831 -$24
Silver Bay - Two Harbors - Duluth 55 100 $660 0.7% $92,345 -$91,685 -$917Windom - Sleepy Eye - New Ulm - Mankato
91 450 $4,914 3.2% $152,789 -$147,875 -$329
Table J-5: Predicted Ridership for Potential Routes
Table J-6: Revenue and Costs for Potential Routes
Applying the Toolkit to Chapter 5’s potential routes resulted in the following estimates. Table J-5 presents estimated ridership, and Table J-6 presents estimated operating costs and revenues. For all seven potential routes, the assumed operator was a non-intercity provider. An operating cost of $2.30 per mile was used. These figures were multiplied by the number of round-trip miles for the proposed service. Intercity services generally operate 365 days per year, so that level of service was used for all cost estimates. For revenue estimates, this analysis assumed that average passenger-trip length is 80 percent of route length (as some passengers will not ride the entire length of the route). Revenue per passenger mile was assumed to be $0.15, based on estimates from current services.

Minnesota Intercity Bus Study 2014 J-3
The Toolkit was also used to estimate demand on the SFY 2013 S. 5311(f) routes, and this was compared to actual ridership, as can be seen in Table J-7. The purpose of this exercise was to validate the use of the Toolkit to estimate demand on potential routes, and at the same time compare actual ridership to model estimates. For the most part, the Toolkit estimates are comparable to the actual ridership, suggesting that there is validity in using it to evaluate potential corridors. Because the Toolkit was calibrated with data from S. 5311(f) services across the country, the fact that actual and estimated demand are relatively close suggests that most of the Minnesota routes are performing as can be expected given their operating environment.
Route One-Way Miles
Serves Airport
Serves Correc. Facility
Regression Model
Ridership
Trip Rate Model
Ridership
Est. Ave. Ridership
SFY 2013 Actual Ridership
Duluth to Minneapolis 196 Yes Yes 3,800 14,700 9,250 9,417Minneapolis to DuluthDuluth to Minneapolis via Mora 176 -- Yes 3,800 14,500 9,150 11,621Minneapolis to Duluth via MoraWadena to Fargo 92 -- -- 0 200 100 6,806Fargo to WadenaMinneapolis to Milwaukee 426 -- -- 10,300 19,100 14,700 15,856Milwaukee to MinneapolisDuluth to Grand Rapids 123 -- -- 200 0 100 196Grand Rapids to DuluthRochester to Minneapolis via Red Wing 132 -- -- 900 900 900 1,262Minneapolis to Rochester via Red WingMinneapolis to Sioux Falls 288 -- -- 4,400 770 2,585 4,251Sioux Falls to MinneapolisFargo via Bemidji (south) 430 -- Yes 5,200 6,800 6,000 4,262Fargo via Bemidji (north)Owatonna to Mankato 44 -- -- 0 1,200 600 492Mankato to OwatonnaRochester to Mankato 125 -- -- 2,200 2,000 2,100 2,144Mankato to Rochester
Table J-7: Predicted and Actual Ridership for S. 5311(f) Subsidized SFY 2013 Routes


Minnesota Intercity Bus Study 2014 K-1
Appendix K TECHNICAL ADVISORY COMMITTEE
Technical Advisory Committee (TAC) Invitee Organization
Jack Larson Arrowhead TransitHarold Jennison Rainbow Rider TransitBonnie Buchanan Jefferson Bus LinesJason Mekalson Land to Air ExpressJan Klassen MnDOT District 7Praveena Pidaparthi MnDOT Office of Passenger RailMike Schadauer MnDOT Office of TransitArlie Johnson Metropolitan Airports CommissionDave Pesch Rochester/Olmsted Council of Governments Katie Caskey MnDOT Office of Transportation System ManagementMichael Corbett MnDOT Office of Transportation System Management