MINNESOTA HOSPITALITY INDUSTRY EXPECTATIONS OF GRADUATES ... · PDF fileMINNESOTA HOSPITALITY...
61
MINNESOTA HOSPITALITY INDUSTRY EXPECTATIONS OF GRADUATES FROM THE HOTEL-RESTAURANT MANAGEMENT PROGRAM AT ALEXANDRIA TECHNICAL COLLEGE by Robert J. Defries A Research Paper Submitted in Partial Fulfillment of the Requirements for the Master of Science Degree With a Major in Hospitality & Tourism Administration Approved: 3 Semester Credits _____________________ Robert Davies Graduate Program Director Hospitality & Tourism The Graduate College University of Wisconsin-Stout June, 2001
-
Upload
nguyendung -
Category
Documents
-
view
229 -
download
2
Transcript of MINNESOTA HOSPITALITY INDUSTRY EXPECTATIONS OF GRADUATES ... · PDF fileMINNESOTA HOSPITALITY...

MINNESOTA HOSPITALITY INDUSTRY EXPECTATIONS OF GRADUATES FROM THE HOTEL-RESTAURANT MANAGEMENT PROGRAM AT ALEXANDRIA TECHNICAL
COLLEGE
by
Robert J. Defries
A Research Paper
Submitted in Partial Fulfillment of the Requirements for the
Master of Science Degree With a Major in
Hospitality & Tourism Administration
Approved: 3 Semester Credits
_____________________ Robert Davies
Graduate Program Director Hospitality & Tourism
The Graduate College University of Wisconsin-Stout
June, 2001

The Graduate School
University of Wisconsin-Stout Menomonie, WI 54751
ABSTRACT
Defries Robert J. (Writer) (Last Name) (First) (Initial) MINNESOTA HOSPITALITY INDUSTRY EXPECTATIONS OF GRADUATES FROM THE HOTEL-RESTAURANT MANAGEMENT PROGRAM AT ALEXANDRIA TECHNICAL COLLEGE_______________________________ (Title) Hospitality and Tourism Robert Davies 7/01 61 (Graduate Major) (Research Advisor) (Mo./Yr.) (# pages) American Psychological Association (APA) Publication Manual (Name of Style Manual used in this Study) This study examined Minnesota Hospitality Industry expectations of graduates from the two-year Hotel-Restaurant Management Program (HRM) at Alexandria Technical College in Alexandria, Minnesota. The study investigated industry management perceptions of the general business, general education, and industry specific skills and personal traits needed by graduates as they leave college and accept entry-level management positions. A questionnaire was given to a sampling of Minnesota’s lodging and foodservice industry. The questionnaire addressed demographic data, importance of general education and industry specific skills, skills best learned in industry or in the college setting, and a prioritization of personal traits expected of graduates.
II

It was found that the highest ranking skills were delivering quality customer
service, employee relations, motivating employees, problem solving, managing diversity,
planning and conducting training, interpersonal speaking, sanitation, and food and
beverage controls. General business skills were most valued, with general education and
technical skills following. Traits that ranked the highest included positive attitude,
honesty, and hardworking. The skills perceived to be best learned on the job included
delivering quality customer service, housekeeping management, facilities and
maintenance management, front office management, and employee relations. Skills
found to be best learned in the classroom included writing skills, computer skills,
hospitality law, accounting, math, and public speaking.
The HRM program should strongly consider analyzing its current curriculum to include study in these priority areas, with future studies conducted bi-annually.
III
Acknowledgements
I heartily thank Bob Davies for his superb coaching, mentoring and advising.
Bob went the extra mile to help make this study possible. I also wish to thank Harlan
Karlstad for his support in creating and completing this study, and Larry Shellito for the
resources that helped to make the study possible.
Many thanks go to my wife Kay and my daughter Libby, who encouraged me to
continue my education and for the support and listening ear they provided. You two
are the greatest!
IV
TABLE OF CONTENTS
ABSTRACT I
ACKNOWLEDGEMENTS III
TABLE OF CONTENTS IV
CHAPTER 1 – INTRODUCTION 1
Significance of the Study 1
Statement of the problem 5
Terms 7
CHAPTER 2 – LITERATURE REVIEW 8
Overview 8
Minnesota Agency and Statutory Expectations 8
An Overview of Industry Expectations of College Graduates 9
Technical Expectations of Industry 10
Industry General Business & General Education Expectations 12
V
CHAPTER 3 – METHODOLOGY 18 Subjects 18 Sampling 18 Survey Instrument 19 Survey Procedures 20 Limitations 20 CHAPTER 4 – RESULTS 21 CHAPTER 5 - SUMMARY AND CONCLUSIONS 38 Summary 38 Discussion of Study Objectives 40 Discussion/Analysis of Results 41 Recommendations 43 REFERENCES 46 APPENDICES 48 Table 1 - Skills Needed by Graduates (Summary) 48 Table 2 – Skills Needed by Graduates (By industry type category) 49 Table 3 – Personal Traits Needed by Graduates 50 Table 4 – Where Skills are Learned Best 51 Survey 52
VI

CHAPTER 1
Study Introduction
Significance of the Study
The instructors in the Hotel-Restaurant Management (HRM) Program at
Alexandria Technical College (ATC) are attempting to determine the relevance of the
program curriculum, leading to revisions in curriculum. To provide direction for these
potential revisions, a determination of the needs of the potential employers in
Minnesota’s hospitality industry is needed. Minnesota will be the target since ATC
receives most of its funding from the state of Minnesota and most graduates seek
employment within the state. Minnesota lodging and restaurant facilities will be asked
to participate in the study. This study, through the use of secondary and primary data,
will attempt to determine what the industry expects of ATC HRM graduates.
To express the significance of the study in a simplistic view, a basic premise in
marketing can be looked at. This basic premise is to determine needs of the consumer,
then develop and deliver need-satisfying products and services. The mission of the
HRM program at ATC reflects this.
Up to this point, the needs of the employer customers of the program have been
determined through a program advisory council. The council is made up of ten to
twelve industry leaders from Minnesota who meet once per year with the HRM
program instructors. A primary function of the council is to review and make
curriculum recommendations for the program, and make recommendations for program
budget, field trips, and other program activities.
1

The board has served its purpose well. But a limitation is that it is a rather small,
unscientific sample population who may or may not reflect the industry as a whole. For
that reason, the program was looking to a larger population, then using random and
non-random sampling to obtain a response that stands much more chance of reflecting
the industry as a whole. The study will attempt to provide the board with findings from
a broader base, enabling curriculum recommendations to be more encompassing.
The Alexandria Technical College is undergoing a major strategic planning
initiative, which serves as another internal influence on HRM graduate expectations.
Unlike previous strategic planning models used, the planning process specifically
involves program areas of study in the tactical portion of the planning model. The
tactical portion of the strategic planning model is referred to as Program Management.
The Program Management model is a method of program evaluation with a
primary goal of attempting to keep ATC academic programs current with the needs of
the industries the programs serves. This study attempts to define regional needs of the
hospitality industry and assist in justifying program curriculum choices.
An important external influence that affects the program and is a driving force
behind this study is the North Central Association of Colleges and Universities (NCA)
Criteria Three (NCA, 2000). This mandates assessment of student academic
achievement. In order to assess student learning, student outcomes need to be
determined. The HRM program is looking to use the findings of this study to assist in
determining the skills and learning that needs assessment.
The NCA assessment mandate is rooted in a 1988 Federal Department of
Education directive to regional accrediting bodies, with NCA being one of the larger of
2
these. This directive asks the regional accrediting bodies to require assessment in their
member schools. The roots of this directive came from the U.S. Congress in the mid-
1990’s (Mauriello, 1995). The Federal Government was concerned with the
accountability of funding that higher education institutions receive. In essence, the
Federal Government wants “proof” that the funding received is producing a “result.”
With the conservative shift in congressional control, the general consensus was that
standards and accountability were needed in higher education. While the Congress
may not presently be as conservative, the issue of accountability is still there.
NCA has also established another requirement that all college programs have a
coherent general education requirement (NCA, 2000). This could have presented a
problem to the HRM program as Minnesota Statute 136F.32 does not allow general
education in diploma programs without approval from the program’s advisory council.
The HRM Advisory Council approved a general education component, so a conflict
does not exist.
ATC has taken these mandates seriously and has developed a comprehensive
academic assessment plan. At ATC, each academic program develops outcomes for the
respective programs. The program must then identify and implement methods for
assessing student performance related to these outcomes (ATC Assessment Plan, 1998).
These outcomes are classified under the following headings:
1) Demonstrate computer proficiency at a level compatible with job demands 2) Exhibit positive attitudes and work habits 3) Demonstrate proper sanitation techniques 4) Understand financial reports 5) Display a working knowledge of hospitality marketing functions 6) Apply work skills appropriate to the industry 7) Develop a business plan 8) Practice effective supervision, leadership and human relations skills
3

These program-specific outcomes are in addition to seven outcomes that
are expected of every ATC graduate:
1) Demonstrate effective communication skills 2) Display responsible and ethical behavior 3) Demonstrate professional attitude 4) Demonstrate problem-solving skills 5) Demonstrate the ability to work in teams 6) Be sensitive to issues of equity and social needs 7) Balance work and family
The assessments of these outcomes are used in a continuous improvement cycle to help
in making curriculum and delivery adjustments for program courses.
The U.S. Department of Labor Occupational Outlook Handbook (Department of
Labor, 2000) also provides direction for setting expectations of graduates. The
handbook states that lodging managers must possess several technical and general
skills. Examples of technical skills include housekeeping, foodservice administration
and catering, and maintenance and engineering. Similarly, the Handbook identifies
nutrition and food planning, culinary skills and sanitation as needed skills for restaurant
managers (Department of Labor, 2000). These reports also show a strong relationship
in the similarity of the non-technical skills that both lodging and restaurant managers
should possess.
Several factors affect the priority of technical skills needed by restaurant and
lodging managers. One factor affecting this priority is the level of the position a
graduate accepts. Graduates of a hospitality graduate program are more likely to need
upper-level skills that may not be technically oriented (Keiser, 2000). It is assumed
that graduate-level students have experience in the technical aspects of hospitality
4

management and can relate to the lower-level management positions. More global,
strategic skills would be expected from this group.
The importance of non-technical skills was also noted in a Canadian study
(Rossing, 1997). The top expectations of a Manitoba sampling of small to medium
sized hotels and restaurants were of a non-technical nature. The expectation areas with
the highest ranking were personal behavior, teamwork and academic. The lowest
ranking were of a technical nature.
From a U.S. industry perspective, widely mentioned research came from the
National Restaurant Association’s research report entitled Foodservice Manager 2000
(1992). The report was designed to show what the educational priorities of hospitality
graduates in the year 2000 should be. The report identifies the top priorities as (in order
from most important to least), communication, leadership, customer relations, training
and motivation. Again, the importance of non-technical skills is noted.
The proposed study will attempt to determine if Minnesota’s hospitality industry
has similar expectations of ATC HRM graduates. The study will examine technical
and non-technical expectations, the priority of these expectations, and other factors that
the industry deems important to graduates.
Statement of the Problem
The stated problem is, “What are Minnesota Hospitality Industry expectations of
graduates from the Hotel-Restaurant Management Program at Alexandria Technical
College?”
This study attempted to determine several objectives related to industry
5
expectations of HRM graduates. The four major objectives of this study were to
examine:
1. The industry-specific technical skill expectations of HRM graduates.
2. The industry general business and general education expectations of HRM
graduates.
3. The personal traits and other skills that are expected of HRM graduates.
4. Where the learning for the various skills should take place.
6
KEY WORDS AND PHRASES
Alexandria Technical College (ATC)
Bar/Night Club
Curriculum
General Business Expectations
General Education Expectations
Hospitality Industry
Hotel-Restaurant Management Program (HRM)
Industry/Technical Expectations
Lodging
Minnesota Hotel and Lodging Association (MHLA)
Minnesota Restaurant Association (MRA)
North Central Association of Colleges and Universities (NCA)
Personal Traits
Program Management
Resort
Restaurant
7
CHAPTER 2
Review of Literature
Overview
To provide direction for the study, this literature review focused on secondary
data that indicated employer expectations of hospitality graduates. The review looked
not only at the industry, but started with a review of governmental, accrediting
organizations, and other stakeholder expectations of the graduates.
Minnesota Agency and Statutory Expectations
The state agency that directs Alexandria Technical College is the Minnesota State
Colleges and Universities (MnSCU). MnSCU has a set of Board Policies that must be
followed. Although most of these policies relate to the overall operation of the college,
there are some that affect the program level. The first policy, MnSCU Board Policy
3.17 (2000), establishes the type of awards that can be offered to graduating students.
The HRM program currently offers the degree and the diploma. The degree must have
a minimum of 18 credits in general education, while the diploma has no general
education criteria. The HRM degree currently has the minimum 18 credits of general
education while the diploma has 12. In fact, there are only two classes that are different
between the two. Of the 40 students currently in the program, 33 are on the diploma
track and 7 are on the degree track.
In addition to MnSCU guidelines, Minnesota Statute 136F.32 (1999) mandates
that technical colleges must offer diploma programs unless MnSCU has determined
that the only acceptable credential is a degree for that program. The statute further
indicates that diploma programs cannot have a general education component unless
8

there is an articulation agreement requiring it, a trade or industry requires it, or a
program advisory board requires it.
The maximum credit total of the diploma or degree allowed by MnSCU is
seventy-two credits. A waiver for the HRM program could be applied for to possibly
obtain an increase to the credit total. However, based on previous experience, the
likelihood of being granted an increase by MnSCU is minimal so the program will stay
at the seventy-two-credit threshold.
At the 2000 HRM advisory board meeting, it was agreed that 12 credits of general
education are needed in the current diploma track. Findings from this study may lead
to new recommendations to raise or lower that limit.
An Overview of Industry Expectations of College Graduates
While the expectations of government and accreditation stakeholders are
important to college programs, the most important set of expectations for the HRM
program at ATC are those of its graduates’ potential employers. This study attempted
to determine more closely the expectations of these stakeholders. These expectations
were expressed in the form of skills and traits that the industry expected from graduates
of the HRM program.
Previous research of expectations of college graduates is not available in large
quantities. Specific research to hospitality industry expectations is in even shorter
supply. The review of literature that follows highlighted findings of some of this
research, which served as a guide to the study. These findings were broken down into
two categories. These categories were 1) Technical Expectations of Industry, and,
9

2) Industry General Business and General Education Expectations. Technical
expectations included those skills that were specific to hotel and restaurant
management. Since there were many similarities between restaurant and lodging
technical skills, these expectations were not separated, but listed together. Industry
General Business and General Education Expectations included those skills that are
more general and not specific to the hospitality industry.
An argument that exists among college faculty is the importance of technical
skills versus the importance of general business skills and general education
requirements. Many faculty are reluctant to replace industry-specific training with
more general, non-industry specific curricula (Bach, Milman, 1996). This study found
that part of this reluctance may be due to issues regarding job security. If a program
incorporates curriculum that is not specific to industry, program instructors may not be
qualified to teach this subject matter. Fewer courses raise concerns of job cuts.
The order of the topic headings for this literature review didn’t necessarily reflect
the priority of the areas covered. It is generally regarded that graduates of hospitality
programs have received proper instruction and possess adequate technical skills. On
the other hand, some studies indicate that while technical skills of graduates are
adequate, interpersonal skills possessed by graduates of hospitality programs are not
adequate (Smith, 1991).
Technical Expectations of Industry
Most of the literature reviewed focuses on technical and non-technical
expectations. The terms technical and non-technical are not used in the same context
by all researchers. Information technology (computer skills) can have both technical
10
and non-technical implications. In either case, the expectation that the industry has for
these skills is middle or higher in comparison to other expectations. A study (Breiter,
Hort, 2000) attempted to prioritize this broad area. The findings of their study show
that the use of inventory, point of sale, scheduling, accounting and purchasing software
rank highest. These are obviously technically related expectations. Payroll, word
processing and spreadsheet software were ranked as the next important areas. These
could be considered non-technical. The results of this study show that broad topic
headings for expectations will give only limited direction to redefining the curriculum
of a hospitality program. If the proposed study cannot determine specific expectations,
a follow-up study may be needed for further clarification of the expectations.
A 1999 study (Rudolph) was intended to identify the highest technical
competencies expected of hospitality graduates. Computer skills and human resources
were ranked as high priorities as were cost concept understanding, time management,
understanding of marketing, and understanding technological applications. Some of
these skills could be identified as non-technical.
Several limitations seem apparent in this study. All of the expectations identified
in this study were expressed at a basic knowledge or an understanding level of learning,
versus an application level as many other studies did. The expectations were also not
just from current industry sources. This was a Delphi study using educators from
“prestigious institutions” such as Michigan State, UNLV, and the University of
Delaware, with many of the respondents holding the positions of department chair or
dean. The industry experts were made up of company presidents, property general
managers and human resources leaders. It is unknown as to how many of the
11
respondents in this study had actually been involved in the hiring process of an
individual in the last five years.
The Educational Institute (EI) of the American Hotel and Motel Association
(AH&MA) conducted a survey (1996) to determine the departments of lodging
properties with the highest priority of training need. The findings of this study reveal
that the front office department had the greatest need, followed by food and beverage
service departments, housekeeping, food and beverage production and maintenance.
The most pressing need in front office was for guest service training, with supervision
and leadership skills also ranking high.
The study also indicated that achieving the certifications currently offered by the
EI were not a high priority. Skills, not recognition was the key to making the training
meaningful. This was apparent to the faculty of the HRM program. Students in the
program at one time could earn up to 14 certifications from EI. The HRM program
then shifted away from the certification focus to an outcome focus, with only 3 EI
certification opportunities left in the program. This has allowed the program to assess
industry expectations, instead of being tied to assessing EI text expectations.
Once again, another national study has shown that the while technical skills are
important, the non-technical skills are at a higher priority. While there are
shortcomings to this study, the results are comparable to other studies of industry
expectations.
Industry General Business and General Education Expectations
Most research available for this review suggests that non-technical expectations
are a higher priority for the industry than technical. This may be a misnomer, in that
12
many employers expect the technical skills to be there, and may look past these skills to
the non-technical areas. An attempt of this study was to prioritize technical versus non-
technical. Given the limitations of credits, resources and other variables, the content
and priority of these expectations was important to the recommendations made to the
HRM program from the study.
Both lodging and restaurant industry non-technical expectations abound.
Graduates of hospitality programs should be able to handle stress, deal with a diverse
workforce, solve problems and pay attention to details. Written, verbal and non-verbal
communication skills are essential along with personal qualities such as initiative, self-
discipline, organization, motivation, delegation and leadership (Department of Labor,
2000).
The expectations cited above are of a very general nature and are best suited to
provide a broad framework. Much of the information acquired for the report came
from information provided by the National Restaurant Association and the American
Hotel & Motel Association. This information may be based more on opinion rather
than research based, as no specific sources are identified in the report.
Further review of current literature finds three non-technical areas of industry
expectation coming to the forefront. These areas include human resource management,
dealing with a culturally diverse workforce, and the practice of ethic behavior in the
workplace. This is also reflected on the ATC campus, as these three areas are among
the eight expected outcomes of all ATC graduates (ATC General Advisory Council,
2000).
13

Ethics is an important business discussion, especially for the hospitality industry,
as noted by Khan and McCleary in their 1996 study of the hospitality industry. A study
on teaching ethics to hospitality program students identifies several ethical concerns for
hospitality industry managers. With access to supplies such as food, linens, cleaning
products, etc., employee pilferage is an emerging concern. When the stress of working
long, odd hours sets in, some managers may be able to justify stealing these items as
they see themselves as deserving. This also makes it easier to become involved with
alcohol and drug abuse, and the misuse of food, beverage and room products and
services. Stress could also lead to sexual harassment and inappropriate relationships
with customers and guests.
Leadership skills are highly valued by the hospitality industry. In a 1996 study of
hospitality industry leaders, (Breiter & Clements), leadership was ranked as the highest
priority. Managerial communication, employee relations and training were ranked
second, third and fourth, respectively. Technical skills such as hospitality law, food
and beverage management and rooms division management were ranked toward the
bottom of twenty skills cited. The importance of human resource skills is driven home
again by the results of this study. This study also had the closest resemblance to the
proposed study, so the findings here took on added meaning.
A study completed by Hubbard and Popovich (1996) also echoes the importance
of leadership. An important distinction is made between learning what leadership is to
actually teaching students how to manage.
In another view, research completed by Campbell and Muller (1995) shows that
different levels of management have different expectations. Area managers considered
14
human resources as a higher priority than store managers. This poses some new
questions. Is the curriculum of the program designed to prepare employees for entry-
level employment, for upper level management responsibility, both or more?
A 1994 study (Gardner, Sciarini) looked at factors that hospitality industry
recruiters considered important in the selection process. Their findings indicate that a
willingness to relocate was their most important selection factor, followed by extra-
curricular activities and major grade point average. These findings may not fit directly
into the topical headings of this literature review, but they can be interpreted as
personal traits (willingness to relocate), evidence of leadership qualities (extra-
curricular), and technical skills (major gpa).
Another important finding of the Gardner and Sciarini study (1994) was that
computer and foreign language skills ranked lowest. This may be due to the notion that
recruiters just hire graduates and may have no additional contact after the graduate
begins work. A study of the operation managers of the companies that the recruiters
work for may yield a far different set of expectations.
The Gardner & Sciarini study (1994) also found that recruiters might not have an
awareness of factors they use in making decisions. A study of this nature may make
them more conscious of their decision factors and expectations.
The Enz and Fulford study (1993) site the most important issues to a chain’s
success as increasing profitability, delivering quality, service, cleanliness and
atmosphere, reducing turnover, determining customer needs, attracting and retaining
employees, and name recognition and positive climate. From the surface it would seem
that only a few of these issues are human resource related. In addition to the affect on
15
operational areas, all of these are human resource oriented. For example, organizations
that have chosen to attach costs to the staffing process (hiring, training, orienting, etc.)
find a staggering effect on the income statement. With an increasing shortage in labor
supply and stable consumer demand of industry products, the concern for this is likely
to continue. Delivering quality service, cleanliness and atmosphere is also human
resource related, as is determining customer needs. The selection and training
processes are a key to hiring persons who possess these skills or to provide training to
instill and reinforce them. The same holds true with image and reputation.
This study (Enz, Fulford, 1993) also found that selection and retention of staff,
and the reduction of employee turnover were important skills to possess. Given the
labor intensive nature of the hospitality industry the importance of selection and
retention continues to be a concern.
The study of cultural diversity is an issue that the hospitality industry finds
important. Since the geographic locations of jobs secured by HRM program graduates
have seen a marked change in population demographics and socio-economics,
graduates must be able to deal with a more diverse work force, customer base, and
ownership of their respective operations. A 1992 study by Gamio and Sneed suggests
that hospitality graduates will face a very diverse workforce in the three fore-mentioned
areas. While greater Minnesota may face this to a lesser extent, graduates of the HRM
program who work in metropolitan areas have provided informal testimonials on the
importance of being ready to work with people from many backgrounds, and to serve a
culturally diverse customer base. Similarly, the Alexandria area has recently welcomed
owners of three existing lodging operations who are relatively new residents of the
16

United States. Current students who work at these operations have experienced the
opportunities presented when working with people from other cultures. As many of the
HRM program students come from rural areas with little or no diversity, this has been
an “eye-opener” to many of them, with the experience being largely positive.
Among hospitality recruiters, human resource management skills possessed by
job candidates are a high priority in the selection process (Van Hoof, 1991). Although
human resource management is a broad subject area, specific areas are identified.
Finally, an earlier study supports the notion that leadership is an important skill.
A 1990 study found that leadership and motivation are important expectations for
hospitality programs to consider. Getting the job done as a hospitality manager
requires successful management and leadership skills to administer a service staff
(Tanke, 1990).
The review of literature showed that there are several expectations of college
graduates. The expectations come from government, accrediting bodies, and the
industry. These expectations were of a technical and a non-technical nature. The study
attempted to determine which of these expectations were most important, and to place
priority on these important areas.
17

CHAPTER 3
Methodology
This chapter discusses the methods and procedures utilized in this study including
the population, research design and procedures, data analysis procedures and the
limitations of the methodology. The purpose of this study was to examine the Minnesota
hospitality industry’s expectations of graduates from the Hotel-Restaurant Management
Program (HRM) at Alexandria Technical College. The study investigated the perceptions
of various levels of management in lodging, food and beverage, and other areas of the
industry where HRM graduates were typically employed. A questionnaire was used to
collect data from the population. This questionnaire was based on the study objectives
and also referenced a 1997 questionnaire developed by the Department of Hospitality and
Tourism at the University of Wisconsin-Stout.
Subjects
The population of this study was the membership list of the Minnesota Hotel and
Lodging Association and the Minnesota Restaurant Association. These associations are
part of Hospitality Minnesota, the largest hospitality trade organization in Minnesota.
HRM graduates typically go to work in lodging and restaurant operations in Minnesota,
and these associations represent the vast majority of the employers of HRM graduates.
Sampling The typical dispersion of HRM graduate employment positions is fifty percent
restaurant and fifty percent lodging. Based on this trend a stratified random sampling
process was used. One hundred eight (108) companies were selected from each of the
two associations listed above for a total sample population of 216. The total population is
18

2,787. Approximately two-thirds of the total population was restaurants, with the
remainder classified as lodging.
Survey Instrument
The four-page questionnaire used for this study was divided into four areas. The
survey is found in the appendix. The first area attempted to gather general business and
respondent demographic data. This included the type and location of the business, the
number of establishments owned and/or operated by the respondent’s company, sales
volume and affiliation, position, longevity in position and education level of respondents,
and the number of graduates hired by the respondent’s company and the colleges or other
sources used for hiring.
The second area of the questionnaire used a common Likert Scale with a 1 – 5
(1=least important; 5=most important) rating scale. This area attempted to determine the
priorities of skills from a list of 26 identified skill sets. These skills were divided into
three general areas: General education skills; general business skills; and industry
specific skills. The individual skills were randomly dispersed on the page.
The third area asked respondents to identify the top six personal traits most
desired in graduates. A list of 28 personal traits developed by the researcher was used,
and respondents were asked to check the six traits perceived to be most important in
graduates.
The fourth area asked respondents to determine whether the 26 skill areas were
best learned in a college classroom environment or on the job.
19

Survey Procedures
The surveys were mailed on March 15, 2001. The questionnaire included a cover
letter asking the respondent to mail the survey back in a self-addressed, stamped envelope
by March 31, 2001.
Limitations The respondents in this study were owners and/or management of establishments
that were identified as members of either the Minnesota Hotel and Lodging Association,
or the Minnesota Restaurant Association. Although the majority of potential employers
of HRM graduates are members of one or both associations, not all are. It is therefore
unknown if the data can be generalized to represent all employers of HRM graduates.
Since some HRM graduates leave the state, it is unknown if the data can be generalized
for employers in other states. The research is also limited to use by the HRM program at
Alexandria Technical College.
20

CHAPTER 4
Results The purpose of this study was to determine what the industry expects of ATC
HRM graduates. This chapter will present the results with background information first,
with demographic and general data next. The next sections will present the results of the
respondents’ expectations of graduate skills, graduate personal traits, and where these
skills are best learned. The last section will show relationships between the independent
variables. The results were examined and analyzed by using SPSS (Statistical Program
for the Social Sciences).
Frequencies and percentages were run on the demographic and general data
provided by the respondents. The questionnaire was mailed to a sample of 216 industry
businesses. Sixty-six (66) surveys were returned, resulting in a 30.7% return rate.
Of the respondents, 53% indicated they worked for lodging establishments, 30%
worked for restaurants, and 17% represented other types of establishments such as bars
and resorts. The placement of the respondent varies from 41% in Twin Cities
Metropolitan locations, 86% in Greater Minnesota locations, and 8% located outside
Minnesota. The totals do not equal 100% because some businesses have multiple
locations. Businesses with one establishment represented 24% of the total respondents,
while 43% indicated their company had two to ten outlets, and 33% had 11 or more
outlets.
The study found that businesses with average establishment sales of less than two
million dollars in sales equaled 34% of the respondents, businesses with two million to
six million dollars represented 37%, and 29% had average establishment sales of over six
21
million dollars. With regard to affiliation or operation type, 58% of the businesses were
franchises, 35% were independent, and 7% categorized their business as other. Analysis
of the age grouping indicated that respondents varied from 43% between 18-34 years old,
39% between 35-49 years old, and 18% older than 49 years of age.
The respondents were also asked to identify their position within the firm, with
21% of the respondents identifying themselves as owners or corporate or multi-unit
managers, 42% identifying themselves as general managers, and 37% indicating they
were department managers. Six percent of the respondents were in their positions for less
than one year, 24% were 1-2 years, 30% were 2-5 years, and 40% were over 5 years in
their current position.
Respondents were asked to identify the highest level of education completed.
Those citing high school were 8% of the total, 17% had some college, 17% had a two-
year degree, 53% had a four-year degree, 4 percent had a graduate degree, and 1%
indicated they had other training/education.
With regard to the average number of managers the respondents hired per year
9% hired 0, 57% hired 1-3, 23% hired 4-7, and 11% hired 8 or more. When citing which
colleges the respondents hired management candidates from, 39% indicated Alexandria
Technical College, 5% indicated Iowa State University, 28% indicated Normandale
Community College, 5% identified North Dakota State University, 14% listed University
of Minnesota-Crookston, 52% listed UW-Stout, 40% indicated other hospitality/culinary
programs, 32% cited other non-hospitality programs, and 25% used none of the above. It
should be noted that percentages do not equal 100% as the respondents could select more
than one response.
22
The respondents were asked if they had hired ATC graduates, with 41%
indicating they had and 59% indicating they had not, or were unsure if they had.
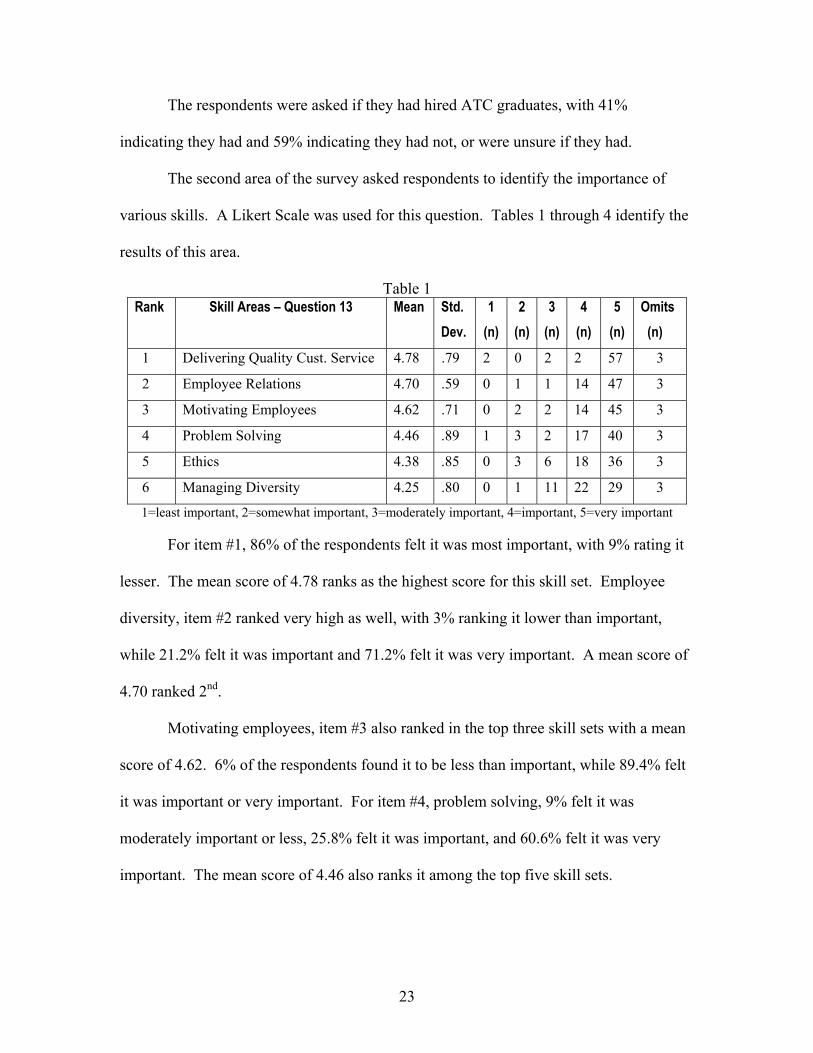
The second area of the survey asked respondents to identify the importance of
various skills. A Likert Scale was used for this question. Tables 1 through 4 identify the
results of this area.
Table 1 Rank Skill Areas – Question 13 Mean Std.
Dev. 1
(n) 2
(n) 3
(n) 4
(n) 5
(n) Omits (n)
1 Delivering Quality Cust. Service 4.78 .79 2 0 2 2 57 3
2 Employee Relations 4.70 .59 0 1 1 14 47 3
3 Motivating Employees 4.62 .71 0 2 2 14 45 3
4 Problem Solving 4.46 .89 1 3 2 17 40 3
5 Ethics 4.38 .85 0 3 6 18 36 3
6 Managing Diversity 4.25 .80 0 1 11 22 29 3
1=least important, 2=somewhat important, 3=moderately important, 4=important, 5=very important
For item #1, 86% of the respondents felt it was most important, with 9% rating it
lesser. The mean score of 4.78 ranks as the highest score for this skill set. Employee
diversity, item #2 ranked very high as well, with 3% ranking it lower than important,
while 21.2% felt it was important and 71.2% felt it was very important. A mean score of
4.70 ranked 2nd.
Motivating employees, item #3 also ranked in the top three skill sets with a mean
score of 4.62. 6% of the respondents found it to be less than important, while 89.4% felt
it was important or very important. For item #4, problem solving, 9% felt it was
moderately important or less, 25.8% felt it was important, and 60.6% felt it was very
important. The mean score of 4.46 also ranks it among the top five skill sets.
23
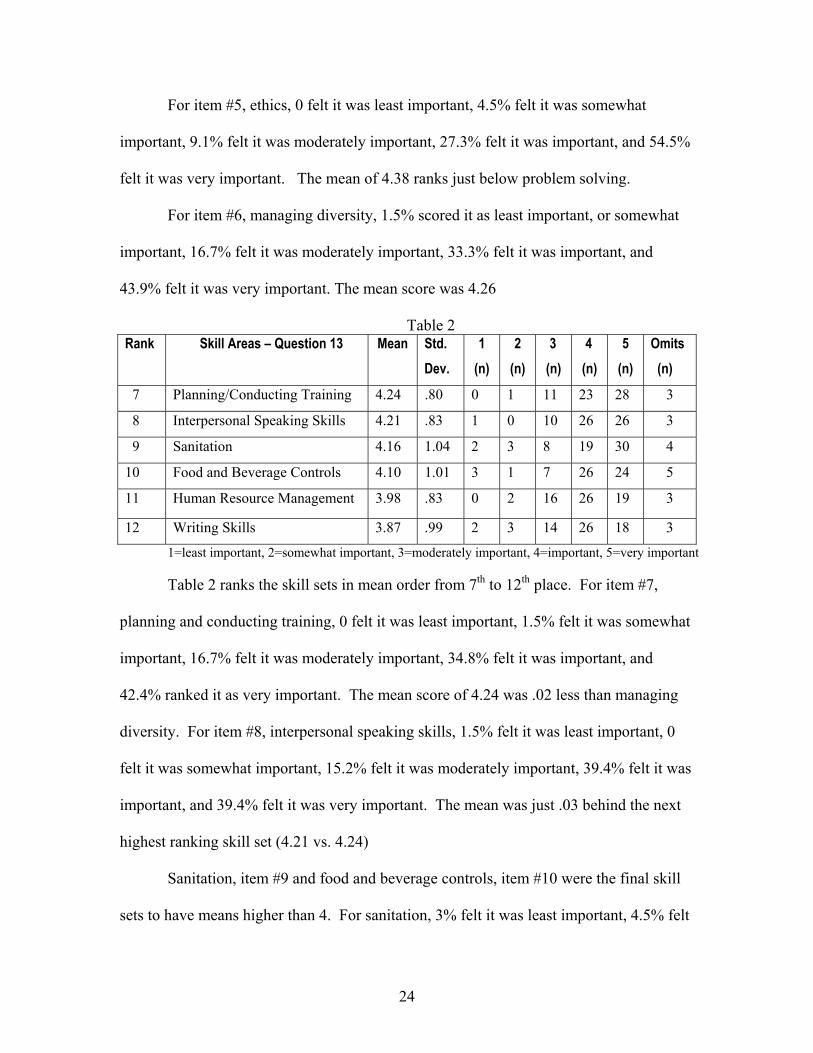
For item #5, ethics, 0 felt it was least important, 4.5% felt it was somewhat
important, 9.1% felt it was moderately important, 27.3% felt it was important, and 54.5%
felt it was very important. The mean of 4.38 ranks just below problem solving.
For item #6, managing diversity, 1.5% scored it as least important, or somewhat
important, 16.7% felt it was moderately important, 33.3% felt it was important, and
43.9% felt it was very important. The mean score was 4.26
Table 2 Rank Skill Areas – Question 13 Mean Std.
Dev. 1
(n) 2
(n) 3 (n)
4 (n)
5 (n)
Omits (n)
7 Planning/Conducting Training 4.24 .80 0 1 11 23 28 3
8 Interpersonal Speaking Skills 4.21 .83 1 0 10 26 26 3
9 Sanitation 4.16 1.04 2 3 8 19 30 4
10 Food and Beverage Controls 4.10 1.01 3 1 7 26 24 5
11 Human Resource Management 3.98 .83 0 2 16 26 19 3
12 Writing Skills 3.87 .99 2 3 14 26 18 3
1=least important, 2=somewhat important, 3=moderately important, 4=important, 5=very important
Table 2 ranks the skill sets in mean order from 7th to 12th place. For item #7,
planning and conducting training, 0 felt it was least important, 1.5% felt it was somewhat
important, 16.7% felt it was moderately important, 34.8% felt it was important, and
42.4% ranked it as very important. The mean score of 4.24 was .02 less than managing
diversity. For item #8, interpersonal speaking skills, 1.5% felt it was least important, 0
felt it was somewhat important, 15.2% felt it was moderately important, 39.4% felt it was
important, and 39.4% felt it was very important. The mean was just .03 behind the next
highest ranking skill set (4.21 vs. 4.24)
Sanitation, item #9 and food and beverage controls, item #10 were the final skill
sets to have means higher than 4. For sanitation, 3% felt it was least important, 4.5% felt
24

it was somewhat important, 12.1% felt it was moderately important, 28.8% felt it was
important, and 45.5% felt it was very important. Food and beverage controls scores
ranged from 4.5% feeling it was least important, 1.5% felt it was somewhat important,
10.6% felt it was moderately important, 39.4% felt it was important, and 36.4% felt it
was very important.
For item #11, human resource management, 0 felt it was least important, 3% felt
it was somewhat important, 24.2% felt it was moderately important, 39.4% felt it was
important, and 28.8% felt it was very important. For item #12, writing skills, 3% felt it
was least important, 4.5% felt it was somewhat important, 21.2% felt it was moderately
important, 39.4% felt it was important, and 27.3% felt it was very important.
Table 3 Rank Skill Areas – Question 13 Mean Std.
Dev. 1
(n) 2
(n) 3 (n)
4 (n)
5 (n)
Omits (n)
13 Marketing, Advertising, Sales 3.85 1.13 2 6 14 17 23 4
14 Front Office Management 3.75 .95 2 3 17 28 13 3
15 Bar and Beverage Management 3.74 1.20 6 1 14 22 18 5
16 Public Speaking Skills 3.70 .93 1 4 21 24 13 3
17 Facilities/Maintenance Mgmt. 3.67 1.08 4 2 20 22 15 3
18 Hospitality Law 3.67 1.12 4 4 17 22 16 3
19 Hospitality Industry Math
Skills
3.67 1.03 2 4 23 18 16 3
1=least important, 2=somewhat important, 3=moderately important, 4=important, 5=very important
Table 3 ranks skill sets 13 through 18. For item #13, marketing, 3% felt it was
least important, 9.1% felt it was somewhat important, 21.2% felt it was moderately
important, 25.8% felt it was important, and 34.8% felt it was very important. For item
#14, front office, 3% felt it was least important, 4.5% felt it was somewhat important,
25
25.8% felt it was moderately important, 42.4% felt it was important, and 19.7% felt it
was very important.
For item #15, bar and beverage management, 9.1% felt it was least important,
1.5% felt it was somewhat important, 21.2% felt it was moderately important, 33.3% felt
it was important, and 27.3% felt it was very important. For item #16, public speaking,
1.5% felt it was least important, 6.1% felt it was somewhat important, 31.8% felt it was
moderately important, 36.4% felt it was important, and 19.7% felt it was very important.
For item #17, facilities management, 6.1% felt it was least important, 3% felt it was
somewhat important, 30.3% felt it was moderately important, 33.3% felt it was
important, and 22.7% felt it was very important.
For item #18, hospitality law, 6.1% felt it was least important, 6.1% felt it was
somewhat important, 25.8% felt it was moderately important, 33.3% felt it was
important, and 24.2% felt it was very important. For item #19, math skills, 3% felt it was
least important, 6.1% felt it was somewhat important, 34.8% felt it was moderately
important, 27.3% felt it was important, and 24.2% felt it was very important.
Table 4 Rank Skill Areas – Question 13 Mean Std.
Dev. 1
(n) 2
(n) 3 (n)
4 (n)
5 (n)
Omits (n)
20 Accounting 3.60 1.14 4 5 19 19 16 3
21 Current Industry Issues/Trends 3.60 .93 1 6 20 25 10 4
22 Computer: Word Processing,
Spreadsheets, etc
3.57 .98 2 6 19 26 10 3
23 Housekeeping Management 3.41 1.24 7 7 12 24 11 5
24 Culinary Skills 3.35 1.31 7 9 16 15 15 4
25 Menu Planning 3.27 1.19 6 10 16 21 9 4
26 Nutrition and Food Planning 3.02 1.07 7 10 22 19 3 5
1=least important, 2=somewhat important, 3=moderately important, 4=important, 5=very important
26
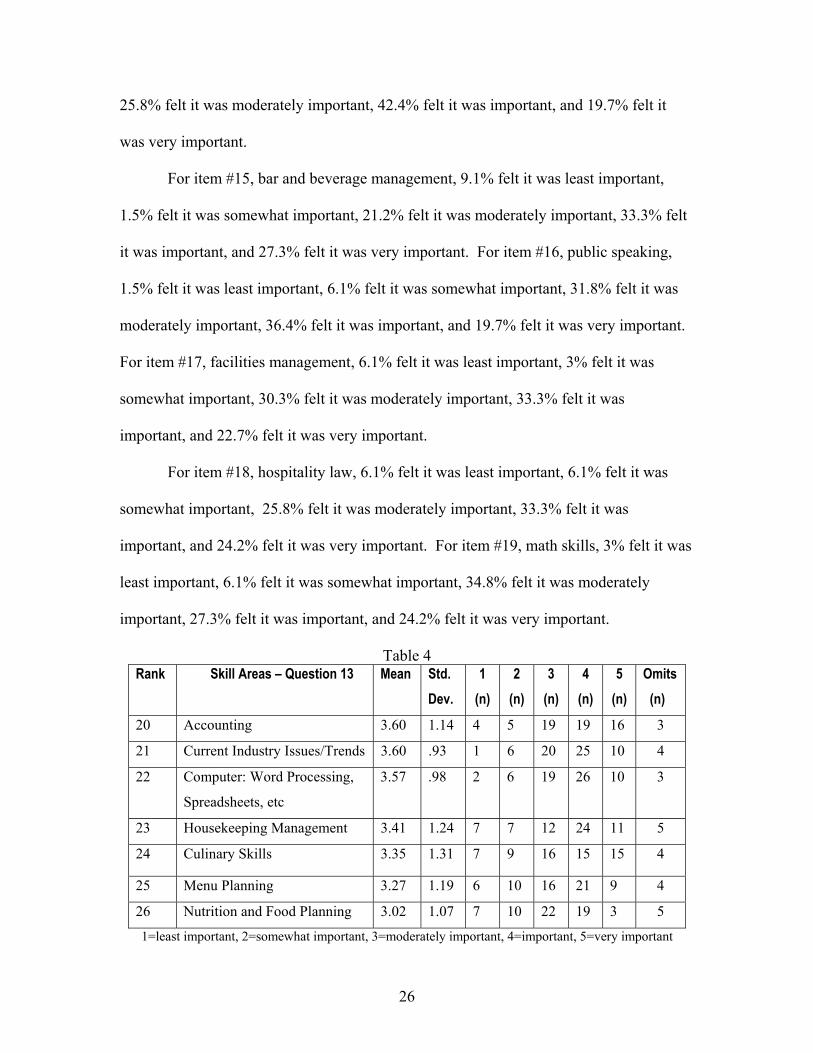
The final table (table 4) for the skill sets ranks items 20 through 26. This
grouping hide the widest mean score range, from 3.60 in accounting and current issues, to
item 26, nutrition. For item #20, accounting, 6.1% felt it was least important, 7.6% felt it
was somewhat important, 28.8% felt it was moderately important, 28.8% felt it was
important, and 24.2% felt it was very important. For item #21, current issues, 1.5% felt it
was least important, 9.1% felt it was somewhat important, 30.3% felt it was moderately
important, 37.9% felt it was important, and 15.2% felt it was very important. For item
#22, computer skills, 3% felt it was least important, 9.1% felt it was somewhat important,
28.8% felt it was moderately important, 39.4% felt it was important, and 15.2% felt it
was very important.
For item #23, housekeeping management, 10.6% felt it was least important,
10.6% felt it was somewhat important, 18.2% felt it was moderately important, 36.4%
felt it was important, and 16.7% felt it was very important. For item #24, culinary skills,
10.6% felt it was least important, 13.6% felt it was somewhat important, 24.2% felt it was
moderately important, 22.7% felt it was important, and 22.7% felt it was very important.
For item #25, menu planning, 9.1% felt it was least important, 15.2% felt it was
somewhat important, 24.2% felt it was moderately important, 31.8% felt it was
important, and 13.6% felt it was very important. For the last item, nutrition, 10.6% felt it
was least important, 15.2% felt it was somewhat important, 33.3% felt it was moderately
important, 28.8% felt it was important, and 4.5% felt it was very important.
The findings for the skill areas were also categorized into three areas. The first
area was lodging, including full and limited service. Restaurants made up the second
area, including establishments that do and do not serve liquor. The third area included
27

respondents classifying their establishments as bars and nightclubs, resorts, and other.
Using the mean as a basis for ranking, the following ranks were established for each of
the 3 areas. The first area is lodging, shown below, in table 5.
Table 5 Skill Area – Question 13
Lodging (n=34) Total Mean
Lodg. Mean
Lodg. Rank
Delivering Quality Customer Service 4.78 4.76 1
Employee Relations 4.70 4.56 2
Motivating Employees 4.62 4.50 3
Problem Solving 4.46 4.50 4
Ethics 4.38 4.32 5
Managing Diversity 4.25 4.18 6
Marketing, Advertising, Sales, Strategic Plan. 3.85 4.09 7
Sanitation 4.16 4.03 8
Planning and Conducting Training 4.24 3.97 9
Human Resource Management 3.98 3.97 10
Front Office Management 3.75 3.94 11
Interpersonal Speaking Skills 4.21 3.91 12
Writing Skills 3.87 3.88 13
Hospitality Law 3.67 3.85 14
Facilities and Maintenance Management 3.67 3.82 15
Computer: Word Processing, Spreadsheets, etc 3.57 3.76 16
Food and Beverage Controls 4.10 3.75 17
Housekeeping Management 3.41 3.74 18
Hospitality Industry Math Skills 3.67 3.68 19
Accounting 3.60 3.68 20
Public Speaking Skills 3.70 3.62 21
Current Industry Issues and Trends 3.60 3.61 22
Bar and Beverage Management 3.74 3.56 23
Culinary Skills 3.35 3.36 24
Menu Planning 3.27 3.33 25
Nutrition and Food Planning 3.02 3.18 26
28
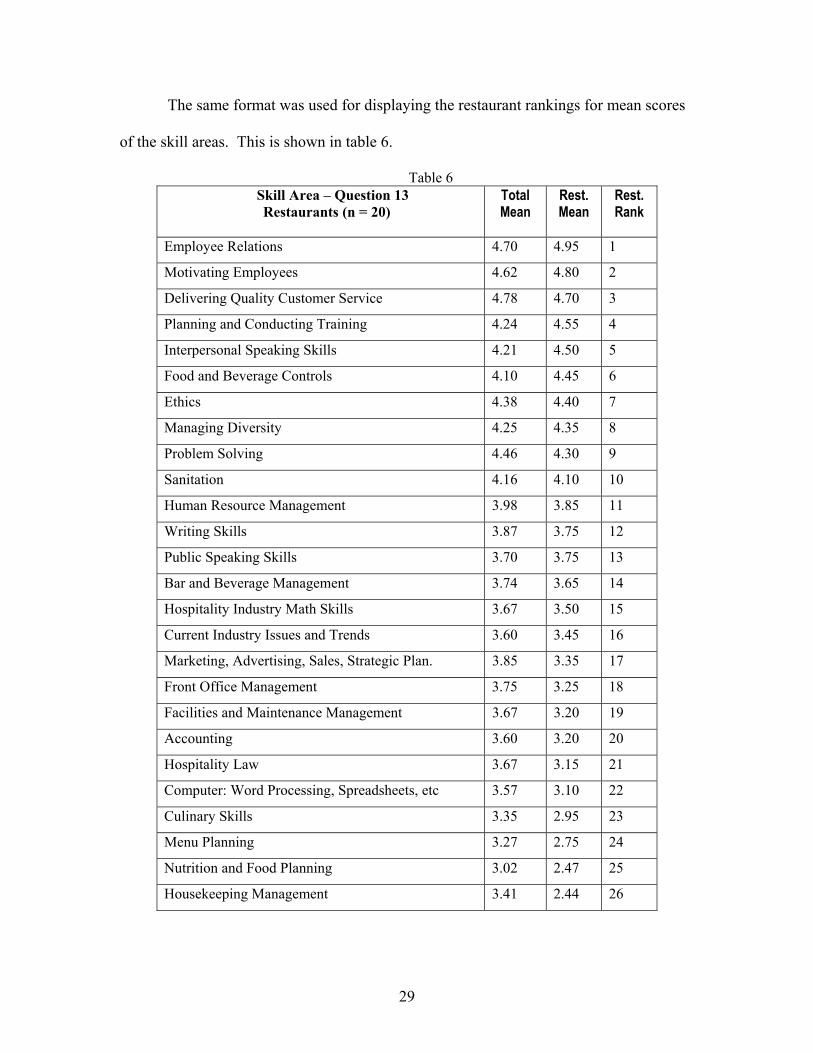
The same format was used for displaying the restaurant rankings for mean scores
of the skill areas. This is shown in table 6.
Table 6 Skill Area – Question 13 Restaurants (n = 20)
Total Mean
Rest. Mean
Rest. Rank
Employee Relations 4.70 4.95 1
Motivating Employees 4.62 4.80 2
Delivering Quality Customer Service 4.78 4.70 3
Planning and Conducting Training 4.24 4.55 4
Interpersonal Speaking Skills 4.21 4.50 5
Food and Beverage Controls 4.10 4.45 6
Ethics 4.38 4.40 7
Managing Diversity 4.25 4.35 8
Problem Solving 4.46 4.30 9
Sanitation 4.16 4.10 10
Human Resource Management 3.98 3.85 11
Writing Skills 3.87 3.75 12
Public Speaking Skills 3.70 3.75 13
Bar and Beverage Management 3.74 3.65 14
Hospitality Industry Math Skills 3.67 3.50 15
Current Industry Issues and Trends 3.60 3.45 16
Marketing, Advertising, Sales, Strategic Plan. 3.85 3.35 17
Front Office Management 3.75 3.25 18
Facilities and Maintenance Management 3.67 3.20 19
Accounting 3.60 3.20 20
Hospitality Law 3.67 3.15 21
Computer: Word Processing, Spreadsheets, etc 3.57 3.10 22
Culinary Skills 3.35 2.95 23
Menu Planning 3.27 2.75 24
Nutrition and Food Planning 3.02 2.47 25
Housekeeping Management 3.41 2.44 26
29

Last, bars, resorts and other establishment mean rankings for skills are shown in
table 7.
Table 7 Skill Area – Question 13 Bars, Resorts & Other
Total Mean
Bar, Resort Other Mean
Bar, Resort Other Rank
Delivering Quality Customer Service 4.78 5.00 1
Sanitation 4.16 4.78 2
Employee Relations 4.70 4.67 3(t)
Motivating Employees 4.62 4.67 3(t)
Problem Solving 4.46 4.67 3(t)
Interpersonal Speaking Skills 4.21 4.67 3(t)
Ethics 4.38 4.56 7(t)
Planning and Conducting Training 4.24 4.56 7(t)
Food and Beverage Controls 4.10 4.56 7(t)
Bar and Beverage Management 3.74 4.56 7(t)
Managing Diversity 4.25 4.33 11(t)
Human Resource Management 3.98 4.33 11(t)
Accounting 3.60 4.22 13(t)
Culinary Skills 3.35 4.22 13(t)
Menu Planning 3.27 4.22 13(t)
Writing Skills 3.87 4.11 16(t)
Marketing, Advertising, Sales, Plan. 3.85 4.11 16(t)
Front Office Management 3.75 4.11 16(t)
Public Speaking Skills 3.70 4.11 16(t)
Facilities and Maintenance Mgmt. 3.67 4.11 16(t)
Hospitality Law 3.67 4.11 21(t)
Housekeeping Management 3.41 4.11 21(t)
Hospitality Industry Math Skills 3.67 4.00 23
Current Industry Issues and Trends 3.60 3.89 24(t)
Computer: Word Processing, etc 3.57 3.89 24(t)
Nutrition and Food Planning 3.02 3.56 26
30

The next area of the survey asked respondents to identify the top six personal
traits they valued in graduates. Twenty-eight personal traits were listed, and respondents
were asked to check what they perceived to be the six most important traits from the list.
Table 8 displays the top 9 traits.
Table 8 Rank total
Question 14 - Personal Traits
Frequency total
Lodging Frequency
Restaurant Frequency
Bar, Resort, Other Freq.
1 Positive Attitude 44 25 13 6
2 Honest 34 18 9 7
3 Hardworking 33 19 9 5
4 Practices Teamwork 27 15 8 4
5 Willingness to Learn 26 16 6 4
6 Takes Pride in Job 25 13 9 3
7(t) Trustworthy 17 10 6 4
7(t) Prof. Appearance 17 9 5 3
7(t) Flexible 17 10 3 4
(t) = tie
Positive attitude was the highest ranking trait. Over 70% (71.4%) of lodging
checked yes, 65% of restaurants checked yes, 54.5% of other checked yes, and 66.7% of
the total checking yes. Honesty ranked 2nd, with 51.4% of lodging checked yes, 45.0% of
restaurants checked yes, 63.6% of other checked yes, and 51.5% of the total checking
yes. Hardworking scored a close third, with 54.3% of lodging checked yes, 45.0% of
restaurants checked yes, 45.5% of other checked yes, and 50.0% of the total checking
yes.
Scores for the remaining traits dip a bit. With practices teamwork, 42.9% of
lodging checked yes, 40.0% of restaurants checked yes, 36.4% of other checked yes, with
40.9% of the total checking yes. For willingness to learn it followed closely behind
31

teamwork. Over 45% (45.7%) of lodging checked yes, 30.0% of restaurants checked yes,
36.4% of other checked yes, with 39.4% of the total checking yes. For takes pride in
job, 37.1% of lodging checked yes, 45.0% of restaurants checked yes, 27.3% of other
checked yes, with 37.9% of the total checking yes. For trustworthy, 28.6% of lodging
checked yes, 30.0% of restaurants checked yes, 36.4% of other checked yes, with 30.3%
of the total checking yes. For professional appearance, 25.7% of lodging checked yes,
25.0% of restaurants checked yes, 27.3% of other checked yes, with 25.8% of the total
checking yes. For flexible, 28.6% of lodging checked yes, 115.0% of restaurants checked
yes, 36.4% of other checked yes, with 25.8% of the total checking yes.
Table 9 Rank total
Question 14 - Personal Traits
Frequency total
Lodging Frequency
Restaurant Frequency
Bar, Resort, Other Freq.
10 Self-Starter 16 11 3 2
11 Dependable 15 9 4 2
12 Responsible 14 7 5 2
13 Adapts Easily to Change 13 6 3 4
14(t) Courteous/Considerate 12 6 3 3
14(t) Likes Job 12 4 7 1
14(t) Dedicated 12 7 3 2
17(t) Pleasant & Cheerful 11 6 0 5
17(t) Able to Work Ind. 11 3 5 3
(t) = tie
Table 9 identifies the next highest ranking (by total score) traits. For self-starter,
31.4% of lodging checked yes, 15.0% of restaurants checked yes, 18.2% of other checked
yes, with 24.2% of the total checking yes. For dependable, 25.7% of lodging checked
yes, 20.0% of restaurants checked yes, 18.2% of other checked yes, with 22.7% of the
total checking yes.
32
For responsible, 20.0% of lodging checked yes, 25.0% of restaurants checked yes,
18.2% of other checked yes, with 21.2% of the total checking yes. For adapts easily to
change, 17.1% of lodging checked yes, 15.0% of restaurants checked yes, 36.4% of other
checked yes, with 19.7% of the total checking yes. For courteous and considerate,
17.1% of lodging checked yes, 15.0% of restaurants checked yes, 27.3% of other checked
yes, with 18.2% of the total checking yes. For likes job, 11.4% of lodging checked yes,
35.0% of restaurants checked yes, 9.1% of other checked yes, with 18.2% of the total
checking yes. For dedicated, 20.0% of lodging checked yes, 15.0% of restaurants
checked yes, 18.2% of other checked yes, with 18.2% of the total checking yes.
For pleasant and cheerful, 17.1% of lodging checked yes, 0 restaurants checked
yes, 45.5% of other checked yes, with 16.7% of the total checking yes. For able to work
independently, 8.6% of lodging checked yes, 35.0% of restaurants checked yes, 27.3% of
other checked yes, with 16.7% of the total checking yes.
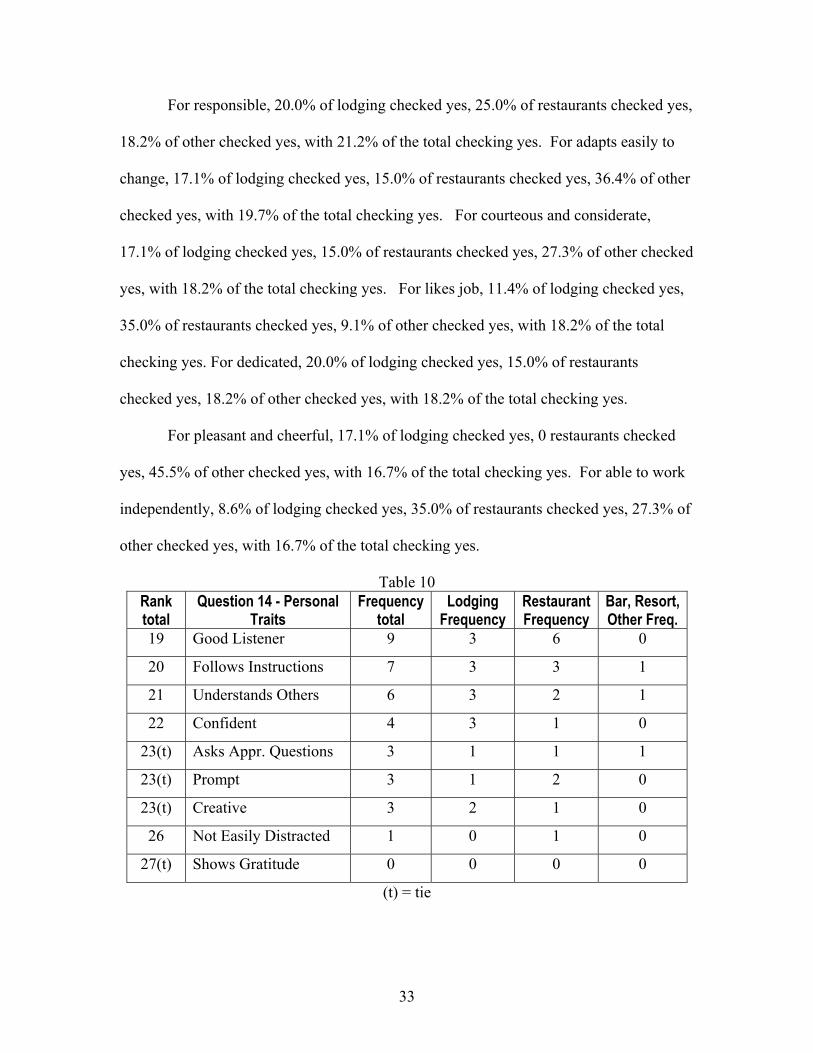
Table 10 Rank total
Question 14 - Personal Traits
Frequency total
Lodging Frequency
Restaurant Frequency
Bar, Resort, Other Freq.
19 Good Listener 9 3 6 0
20 Follows Instructions 7 3 3 1
21 Understands Others 6 3 2 1
22 Confident 4 3 1 0
23(t) Asks Appr. Questions 3 1 1 1
23(t) Prompt 3 1 2 0
23(t) Creative 3 2 1 0
26 Not Easily Distracted 1 0 1 0
27(t) Shows Gratitude 0 0 0 0
(t) = tie
33

Table 10 identifies the lowest ranking personal traits. For good listener, 8.6% of
lodging checked yes, 30.0% of restaurants checked yes, 0 other checked yes, with 13.6%
of the total checking yes. For follows instructions, 8.6% of lodging checked yes, 15.0%
of restaurants checked yes, 9.1% of other checked yes, with 10.6% of the total checking
yes. For empathy, 8.6% of lodging checked yes, 10.0% of restaurants checked yes, 9.1%
of other checked yes, with 9.1% of the total checking yes. For the remaining traits, a
total of 4 or less yes checkmarks were tallied.
The last area covered in the survey asked respondents to indicate where the 26
skills are best learned. The choices were on the job or in college. Some respondents
checked both. The results were tallied but were not broken down according to types of
establishments. Tables 11 through 13 show the results of this area.
Table 11 Skill Area On the Job
Frequency In College Frequency
Both Frequency
Total Frequency
Omits
Delivering Quality Cust. Service 49 11 4 64 2
Housekeeping Management 45 12 3 60 6
Facilities/Maintenance Mgmt. 43 15 4 62 4
Front Office Management 42 18 2 62 4
Employee Relations 42 12 10 64 2
Motivating Employees 38 18 8 64 2
Bar & Beverage Management 36 21 3 60 6
Managing Diversity 36 23 5 64 2
Table 11 identifies the skills respondents felt would be best learned on the job.
For customer service, 74.2% identified on the job as the best place to learn this skill,
16.7% identified college, 6.1% said both, and 3.0% were omits. For housekeeping
management, 68.2% identified college as the best, 18.2% said college, 4.5% said, both,
34

with 9.1% omits. For facilities and maintenance, 65.2% identified on the job, 22.7% said
college, 6.1% said both, with 6.1% omits. For front office, 63.6% identified in the job,
27.3% said college, 3.0% said both, with 6.1% omits. For employee relations, 63.6%
said on the job, 18.2% said college, 15.2% said both, with 3% omits. For motivating
employees, 57.6% said on the job, 27.3% said college, 12.1% identified both, with 3.0%
omits. For bar and beverage, 54.5% identified on the job, 31.8% said college, 4.5% said
both, with 9.1% omits. For managing diversity, 54.5% identified on the job, 34.8% said
college, 7.6% said both, with 3.0% omits.
Table 12 Skill Area On the Job
Frequency In College Frequency
Both Frequency
Total Frequency
Omits
Sanitation 34 25 4 63 3
Planning and Conducting Training 32 28 3 63 3
Problem Solving 31 24 9 64 2
Current Industry Issues/Trends 30 30 4 64 2
Food and Beverage Controls 27 31 5 63 3
Interpersonal Speaking 24 37 3 64 2
Menu Planning 23 34 5 62 4
Human Resource Management 20 40 4 64 2
Culinary Skills 19 38 4 61 5
Table 12 shows the skill sets that respondents felt needed both on the job and in
college training. For sanitation, 51.5% said on the job, 37.9% said college, 6.1% said
both, with 4.5% omits. For training, 48.5% said on the job, 42.4% said college, 4.5%
said both, with 4.5% omits. For problem solving, 47.0% said on the job, 36.4% said
college, 13.6% said both, with 3.0% omits. For issues and trends, 45.5% were tallied for
both on the job and college, 6.1% said both, with 3.0% omits. For food and beverage
35

controls, 40.9% said on the job, 47.0% said college, 7.6% said both, with 4.5% omits.
For interpersonal speaking, 36.4% said on the job, 56.1% said college, 4.5% said both,
with 3.0% omits. For menu planning, 34.8% said on the job, 51.5% said college, 7.6%
said both, with 6.1% omits. For human resource management, 30.3% said on the job,
60.6% said college, 6.1% said both, with 3.0 omits. For culinary skills, 28.8% said on the
job, 57.6% said college, 6.1% said both, with 7.6% omits.
Table 13 Skill Area On the Job
Frequency In College Frequency
Both Frequency
Total Frequency
Omits
Marketing, Advertising, Sales 18 41 2 61 5
Ethics 18 38 7 63 3
Public Speaking 8 53 1 62 4
Hospitality Industry Math 7 54 2 63 3
Accounting 6 54 3 63 3
Nutrition & Food Planning 6 52 2 60 6
Computer Skills 3 58 2 63 3
Writing Skills 3 59 1 63 3
Hospitality Law 3 57 3 63 3
Table 13 shows the skill sets that respondents felt were learned best on the job.
For marketing, 27.3% said on the job, 62.1% said college, 3.0% said both, with 7.6%
omits. For ethics, 27.3% said on the job, 57.6% identified college, 10.6% said both, with
4.5% omits. For public speaking, 12.1% said on the job, 80.3% said college, 1.5% said
both, with 6.1% omits. For math, 10.6% said on the job, 81.8% said college, 3.0% said
both, with 4.5% omits. For accounting, 9.1% said on the job, 81.8% identified college,
4.5% said both, with 4.5% omits. For nutrition, 9.1% said on the job, 78.8% said college,
3.0% said both, with 9.1% omits. For computer skills, 4.5% said on the job, 87.9%
36
identified college, 3.0% said both, with 4.5% omits. For writing skills, 4.5% said on the
job, 89.4% said college, 1.5% said both, with 4.5% omits. Finally, for hospitality law,
4.5% said on the job, 86.4% said college, 4.5% said both, with 4.5% omits.
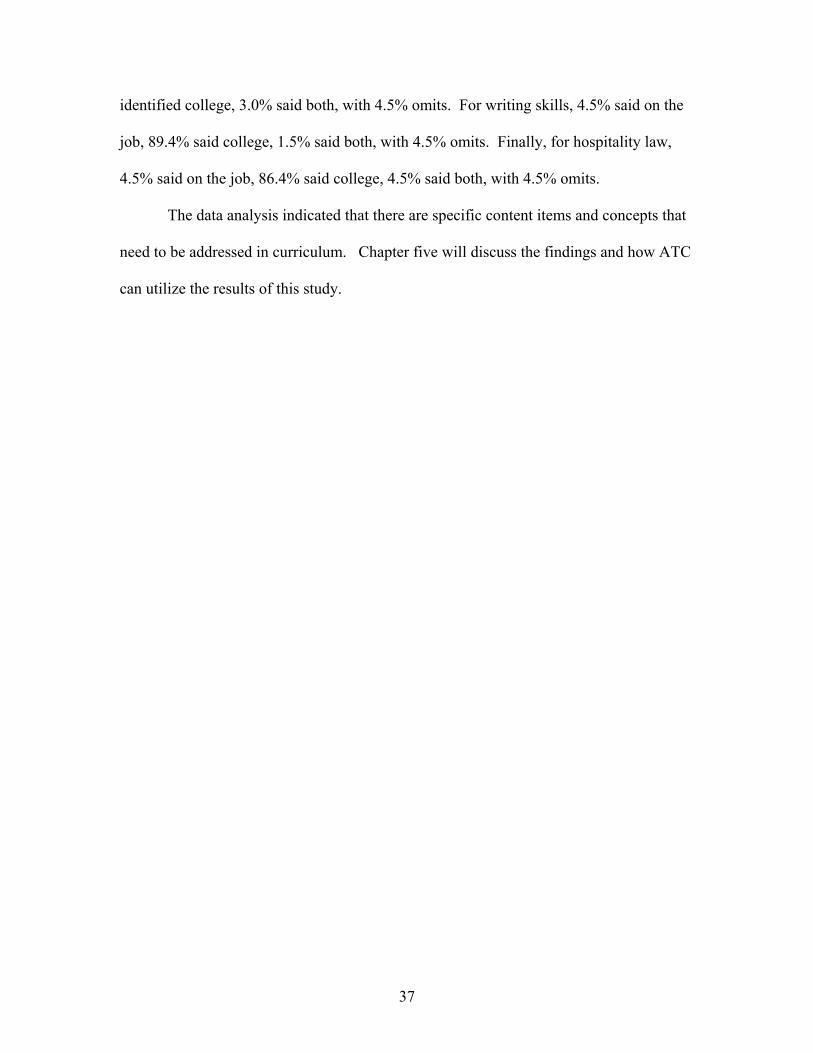
The data analysis indicated that there are specific content items and concepts that
need to be addressed in curriculum. Chapter five will discuss the findings and how ATC
can utilize the results of this study.
37
CHAPTER 5
Summary and Conclusions
Summary
The purpose of this study was to gather data to help determine the relevance of
the program curriculum, leading to revisions in the Alexandria Technical College
Hotel-Restaurant Management program curriculum. This study investigated industry
respondents’ perceptions of skill areas, personal traits, where the training should take
place, and general demographic data of the respondents. The four major objectives of
this study were to examine:
1. The industry-specific technical skill expectations of HRM graduates.
2. The industry general business and general education expectations of HRM
graduates.
3. The personal traits and other skills that are expected of HRM graduates.
4. Where the learning for the various skills should take place.
The review of literature provided an overview of the expectations of the HRM
program and of its graduates. The expectations of government, accrediting
organizations, industry, and other stakeholders were examined. The literature
identified the forces that curriculum managers must consider as curriculum is
developed and changed, as well as a move away from a program with mostly technical
components to a mixed program that includes general education, general business
courses, while maintaining a pertinent technical base.
The population for the study was the 2,787 members of the Minnesota Hotel and
Lodging Association and the Minnesota Restaurant Association. A stratified random
38
sampling was done using the membership lists, with 108 members randomly selected
from each association, for a total sample population of 216 establishments.
The questionnaire used for this study was divided into four areas. The first area
attempted to gather general business and respondent demographic data. This included the
type and location of the business, the number of establishments owned and/or operated by
the respondent’s company, sales volume and affiliation, position, longevity in position
and education level of respondents, and the number of graduates hired by the
respondent’s company and the colleges or other sources used for hiring.
The second area of the questionnaire used a common Likert Scale with a 1 – 5
(1=least important; 5=most important) rating scale. This area attempted to determine the
priorities of skills from a list of 26 skills. These skills were divided into three general
areas: General education skills; general business skills; and industry specific skills. The
individual skills were randomly dispersed on the page.
The third area asked respondents to identify the top six personal traits most
desired in graduates. A list of 28 personal traits developed by the researcher was used,
and respondents were asked to check the six traits perceived to be most important in
graduates.
The fourth area asked respondents to determine whether the 26 skill areas were
best learned in a college classroom environment or on the job.
The questionnaires were tabulated and analyzed using SPSS (Statistical Program
for the Social Sciences).
39
Discussion of Study Objectives
The first objective was to examine which skills in industry specific technical areas
were most important. Delivering quality customer service had the highest overall mean
score, followed by employee relations and motivating employees. However, these skills
were not categorized as industry specific. Sanitation scored highest in the overall
industry specific skill set area with a mean of 4.16. Food and beverage controls was a
close second, at 4.16 mean average. Front office management along with bar and
beverage management ranked third and fourth, at 3.75 and 3.74 respectively. Facilities
management, hospitality law and hospitality math tied at 3.67, followed closely by
current industry issues and trends at 3.60. Housekeeping, culinary, menu planning and
nutrition were the lowest ranking technical skills, but the mean scores for each were still
above 3.0, indicating a moderate importance.
The highest ranking industry skill set, sanitation, finished in ninth place overall,
with a mean score of 4.16 . The ranking of this skill set and the other industry specific
skill sets is consistent with previous research identified in the literature review. Non-
industry skills were ranked higher than industry specific skills.
The second objective was to examine the industry general business and general
education expectations of HRM graduates. Delivering quality customer service had the
highest overall ranking with a mean score of 4.78. Employee relations and motivating
employees were a close second and third. Problem solving and ethics ranked fourth and
fifth, with managing diversity, planning/conducting training and interpersonal speaking
skills next. All of these skills had an mean average Likert score of important or higher.
These eight highest overall ranking skill sets were of a non-technical nature.
40

The third objective was to examine personal trait expectations. Overall,
respondents cited possessing a positive attitude most often. Honesty and hardworking
were a distant second and third, but were cited by at least half of the respondents.
Practices teamwork, willingness to learn, and takes pride in job were cited by at least
38% of the respondents.
These six traits were also ranked in the top six by both the lodging and restaurant
subcategories, indicating their importance across various components of the industry.
The fourth objective was to determine which setting for learning the skill sets
would be best. The respondents indicated that 11 of the skill sets would be best learned
on the job, while 15 of the skill sets would be best learned in college. The skill sets with
the highest frequency of scores for on the job included delivering quality customer
service, housekeeping management, facilities/maintenance management, front office
management and employee relations. The skill sets with the highest frequency scores for
in college were hospitality law, writing skills, computer skills, nutrition, accounting, math
and public speaking.
Discussion/Analysis of Results
The response rate for the study was rather low, at 30.7%. It was hoped that a response rate of at least 70% would be achieved. However, the number of responses
(66) is far greater than any previous survey conducted for the HRM program.
Analysis shows that over half (53%) of the respondents were classified as lodging, and
only 30% were restaurants. This does not match the mix of HRM graduates, currently at
nearly 50% for each area.
After examination of the general and demographic data the following conclusions
41
can be derived. It was found that the majority of the respondents (53%) were classified as lodging establishments and that the majority of respondents were from locations in greater Minnesota (59.1%). Most of the establishments (43.0%) were part of a multi-unit operation and over half were franchises (57.6%). 81.8% of the respondents were under the age of 50 and 79% were in property level positions. Over two-thirds (69.7%) of the respondents were in their current position for more than two years and over half (57.0%) had at least a 4-year degree. Almost all (91%) of the respondents hired at least 1 management candidate each year and over one-third (38.5%) had hired an Alexandria Technical College HRM program graduate, ranking second only to UW-Stout Hospitality and Tourism graduates (51.5%). A large majority (66.7%) of the respondents did not hire graduates from non-hospitality programs.
Examination of the skill priority area for all establishments revealed that the
highest ranking skills valued by respondents were delivering quality customer service
(mean = 4.78), followed by employee relations (mean = 4.70), motivating employees
(mean = 4.62), problem solving (mean = 4.38), managing diversity (mean = 4.25),
planning and conducting training (mean = 4.24) interpersonal speaking skills (mean =
4.21), sanitation (mean = 4.16), and food and beverage controls (mean = 4.10). None of
the skill areas had a mean score of less than 3.0, with nutrition and food planning ranking
lowest (mean = 3.02). The top three overall skill rankings were also the top three ranked
skill areas for the lodging category and the restaurant category, with lodging matching the
overall rankings. When the skill areas are categorized into three areas, general business
ranks as the highest priority (mean = 4.28), general education is next (3.95), followed
closely by industry specific skills (mean = 3.62)
42
The overall personal trait findings indicate that a positive attitude is the most
desired trait in graduates (61.7% checked), followed by honest (51.5% checked), and
hardworking (50% checked). All three categories of establishments (lodging, restaurant
and other) ranked these as the top three traits as well.
Respondents identified delivering quality customer service as the skill best
learned on the job (74.2% checked), with housekeeping management (68.2%), facilities
and maintenance management (65.2%), and front office and employee relations ranked
next (63.6%). The skills that the respondents ranked as best learned in college included
writing skills (89.4%), computer skills (87.9%), hospitality law (86.4%), accounting and
math tied (81.8%), public speaking (80.3%), and nutrition (78.8%).
Recommendations This study attempted to determine what industry expects of hospitality graduates.
The study focused on four areas, demographics and general information, skills, personal
traits, and the best setting for learning skills. The study found that all of the skill areas
were at least moderately important. Six traits were identified as most important, and the
majority of skills were best learned on the job.
The Hotel-Restaurant Management Program at Alexandria Technical College
should consider the following as curriculum recommendations are made:
• Examine the current work experiences, and include assignments that are related to
delivering quality customer service, housekeeping, facilities management and
front office management (for lodging sites), motivating employees, bar and
beverage management (for applicable sites), and managing diversity.
43

• Make quality customer service management a larger portion of the issues class,
renaming the course to reflect this.
• Create a segment in supervision courses for employee relations and motivating
employees, updating the current problem-solving unit.
• Discuss the findings of this study with the advisory board to clarify skill area
expectations in ethics, motivating employees, employee relations, and other areas
ranked high by respondents.
• Examine the ethics course in the general education area and compare to the ethics
unit in the issues course.
• Add a unit in diversity management to the second supervision course.
• Add a human resource component to the training course, clarifying the specific
needs in this area with the advisory board.
• Discuss combining the bar and beverage course with menu planning, to free up
credits for general business courses in human resources, managing diversity, and
others.
• Bring in industry guest speakers to discuss traits that are important in hiring
graduates, focusing on how graduates can show they have a positive attitude, be
honest, hardworking, practice teamwork, show a willingness to learn, and taking
pride in their job.
• Have student references complete a rating sheet in the work experiences that rates
their performance in the top skill areas and the top trait areas.
• Have advisory board members discuss the survey instrument and change
accordingly. Remove those general and demographic questions that are of less
44
importance, and examine the traits list, reducing duplication and confusion in the
traits. Adding a brief explanation of the trait would be helpful. This will increase
the likelihood of a higher response rate for future studies.
• Make the survey a bi-annual event, with more follow-up using post cards and
reminder calls. The response rate must be increased to increase the validity of the
data generated. The mix of establishment classifications should more closely
match the dispersion of graduates.
• Document the recommendations in the program annual report along with
corresponding changes.
It is strongly recommended that the HRM program continue to work with industry
to meet the expectations they have of graduates. The HRM program must also
examine the training content of companies that hire graduates. Common training
content should be examined to determine if the curriculum needs to include particular
subject areas, if industry doesn’t have expectations for training in these areas. The
work experiences currently in the HRM program could become more formalized to
match the expectations for a graduate, especially if the graduate has a specific area of
interest. This examination of expectations does not stop with this study. Instead, this
study provides a framework for ongoing examination of the program’s customers.
45

REFERENCES
Alexandria Technical College. (2000). A summary of the college advisory board’s recommendations for college-wide student outcomes.
Alexandria Technical College. (1998). Assessment Plan. Bach, S.A. & Milman, A. (1996). A novel technique for reviewing hospitality
curriculum. Hospitality & Tourism Educator. 8. 37-40. Breiter, D. & Clements, C.J. (1996). Hospitality management curricula for the 21st
century. Hospitality & Tourism Educator, 8, 57-60. Breiter, D., & Hoart, H. (2000). Competencies in foodservice information technology
expected by the foodservice industry of graduates of hospitality bachelor’s degree programs in the United States. Journal of Hospitality & Tourism Education, 12, pp 11-17.
Campbell, D.F. & Muller, C.C. (1995). The attributes and attitudes of multiunit
managers in a national quick service restaurant firm. Hospitality Research Journal, 19, 3-18.
Enz, C.A. & Fulford, M.D. (1993). The impact of human resource management on
organization success: suggestions for hospitality educators. Hospitality & Tourism Educator, 5, 11-13.
Gamio, M.O. & Sneed, J. (1992). Cross-cultural training practices and needs in the
hospitality industry. Hospitality Research Journal, 15, 13-26. Gardner, P. & Sciarini, M.P. (1994). Prescreening of hospitality graduates: a study of
hospitality recruiter decision strategies. Hospitality Research Journal, 18, 97-114. Hubbard, S.S. & Popovich, P. (1996). Teaching leadership skills to hospitality students.
Hospitality & Tourism Educator, 8, 39-40. Keiser, J.D. (2000). Exploratory demand analysis for a part-time or executive master’s
degree in hospitality management. Journal of Hospitality & Tourism Education, 12, 33-38.
Khan, M.M. & McCleary, K.W. (1996). A proposed model for teaching ethics in
hospitality. Hospitality & Tourism Educator, 8, 7-12. Mauriello, C.E. (1995). The politics of national standards. The NEA Higher Education
Journal, XI, 121-132. Minnesota State Colleges and Universities Board Policy 3.17 (1981).
46
Minnesota State Colleges and Universities, Minnesota Statutes Ann. Statute 136F.32.
(1999). National Restaurant Association. (1992). Foodservice manager 2000. (Research Rep.).
Chicago: Author.
North Central Association of Colleges and Universities. (2000). General institution requirements.
North Central Association of Colleges and Universities. (2000). Criterion three. Occupational Outlook Handbook. (2000). (pp 55-57; 76-79) Washington, DC,
Department of Labor. Posner, G.J. (1992). Analyzing the curriculum. New York: McGraw Hill. Rudolph, R. (1999, Fall). The desirable technical competencies of hospitality graduates
in the 21st century (CD-ROM from hospitality department at Georgia State University. Praxis.
Secretary’s Commission on Achieving Necessary Skills. (1991). What work requires
of schools. Washington, DC, Department of Labor. (NTIS No. PB92-146711) Smith, K.D. (1991). Management skills for hospitality operations. In R.A. Brymer
(Ed.), Hospitality management: An introduction to the industry (6th ed.) (pp. 208-215). Dubuque, IA: Kendall/Hunt.
Tanke, M. (1990). Human resource management for the hospitality industry. Albany,
NY: Delmar. The Educational Institute of the American Hotel and Motel Association. (1996). 1996
industry aggregate findings. (Research Rep.). East Lansing, MI: Author. Van Hoof, H.B. (1991). Entering the job market with a master’s degree in hospitality
management. Hospitality & Tourism Educator, 4, 50-57, 73.
47

APPENDICES
Table 1 Skills needed by graduates
Rank Skill Areas – Question 13 Mean Std. Dev.
1 (n)
2 (n)
3 (n)
4 (n)
5 (n)
Omits (n)
1 Delivering Quality Customer Service 4.78 .79 2 0 2 2 57 3
2 Employee Relations 4.70 .59 0 1 1 14 47 3
3 Motivating Employees 4.62 .71 0 2 2 14 45 3
4 Problem Solving 4.46 .89 1 3 2 17 40 3
5 Ethics 4.38 .85 0 3 6 18 36 3
6 Managing Diversity 4.25 .80 0 1 11 22 29 3
7 Planning and Conducting Training 4.24 .80 0 1 11 23 28 3
8 Interpersonal Speaking Skills 4.21 .83 1 0 10 26 26 3
9 Sanitation 4.16 1.04 2 3 8 19 30 4
10 Food and Beverage Controls 4.10 1.01 3 1 7 26 24 5
11 Human Resource Management 3.98 .83 0 2 16 26 19 3
12 Writing Skills 3.87 .99 2 3 14 26 18 3
13 Marketing, Advertising, Sales, Plan. 3.85 1.13 2 6 14 17 23 4
14 Front Office Management 3.75 .95 2 3 17 28 13 3
15 Bar and Beverage Management 3.74 1.20 6 1 14 22 18 5
16 Public Speaking Skills 3.70 .93 1 4 21 24 13 3
17 Facilities and Maintenance Mgmt. 3.67 1.08 4 2 20 22 15 3
18 Hospitality Law 3.67 1.12 4 4 17 22 16 3
19 Hospitality Industry Math Skills 3.67 1.03 2 4 23 18 16 3
20 Accounting 3.60 1.14 4 5 19 19 16 3
21 Current Industry Issues and Trends 3.60 .93 1 6 20 25 10 4
22 Computer: Word Proc., Spr.sheets, etc 3.57 .98 2 6 19 26 10 3
23 Housekeeping Management 3.41 1.24 7 7 12 24 11 5
24 Culinary Skills 3.35 1.31 7 9 16 15 15 4
25 Menu Planning 3.27 1.19 6 10 16 21 9 4
26 Nutrition and Food Planning 3.02 1.07 7 10 22 19 3 5
1=least important, 2=somewhat important, 3=moderately important, 4=important, 5=very important
48
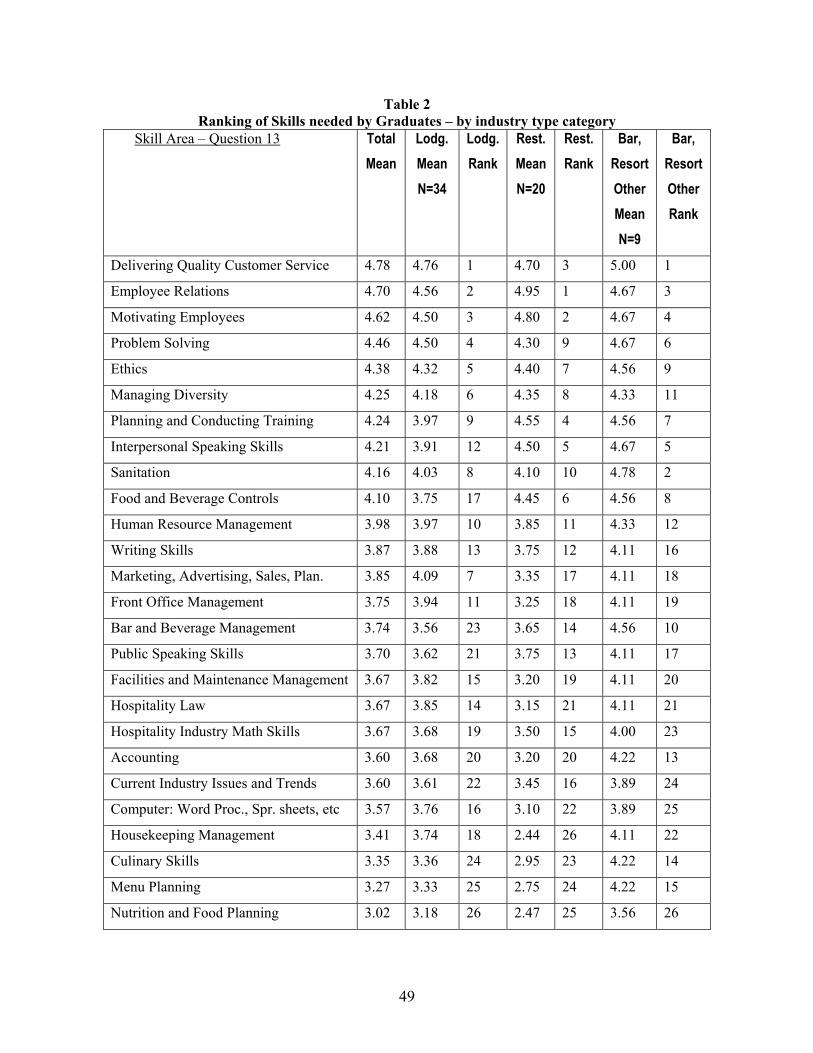
Table 2 Ranking of Skills needed by Graduates – by industry type category
Skill Area – Question 13 Total Mean
Lodg. Mean N=34
Lodg. Rank
Rest. Mean N=20
Rest. Rank
Bar, Resort Other Mean N=9
Bar, Resort Other Rank
Delivering Quality Customer Service 4.78 4.76 1 4.70 3 5.00 1
Employee Relations 4.70 4.56 2 4.95 1 4.67 3
Motivating Employees 4.62 4.50 3 4.80 2 4.67 4
Problem Solving 4.46 4.50 4 4.30 9 4.67 6
Ethics 4.38 4.32 5 4.40 7 4.56 9
Managing Diversity 4.25 4.18 6 4.35 8 4.33 11
Planning and Conducting Training 4.24 3.97 9 4.55 4 4.56 7
Interpersonal Speaking Skills 4.21 3.91 12 4.50 5 4.67 5
Sanitation 4.16 4.03 8 4.10 10 4.78 2
Food and Beverage Controls 4.10 3.75 17 4.45 6 4.56 8
Human Resource Management 3.98 3.97 10 3.85 11 4.33 12
Writing Skills 3.87 3.88 13 3.75 12 4.11 16
Marketing, Advertising, Sales, Plan. 3.85 4.09 7 3.35 17 4.11 18
Front Office Management 3.75 3.94 11 3.25 18 4.11 19
Bar and Beverage Management 3.74 3.56 23 3.65 14 4.56 10
Public Speaking Skills 3.70 3.62 21 3.75 13 4.11 17
Facilities and Maintenance Management 3.67 3.82 15 3.20 19 4.11 20
Hospitality Law 3.67 3.85 14 3.15 21 4.11 21
Hospitality Industry Math Skills 3.67 3.68 19 3.50 15 4.00 23
Accounting 3.60 3.68 20 3.20 20 4.22 13
Current Industry Issues and Trends 3.60 3.61 22 3.45 16 3.89 24
Computer: Word Proc., Spr. sheets, etc 3.57 3.76 16 3.10 22 3.89 25
Housekeeping Management 3.41 3.74 18 2.44 26 4.11 22
Culinary Skills 3.35 3.36 24 2.95 23 4.22 14
Menu Planning 3.27 3.33 25 2.75 24 4.22 15
Nutrition and Food Planning 3.02 3.18 26 2.47 25 3.56 26
49

50
Table 3 Personal Traits needed by Graduates
(t) = tie
Rank total
Question 14 - Personal Traits
Frequency total
Lodging Frequency
Restaurant Frequency
Bar, Resort, Other Freq.
1 Positive Attitude 44 25 13 6
2 Honest 34 18 9 7
3 Hardworking 33 19 9 5
4 Practices Teamwork 27 15 8 4
5 Willingness to Learn 26 16 6 4
6 Takes Pride in Job 25 13 9 3
7(t) Trustworthy 17 10 6 4
7(t) Professional Appearance 17 9 5 3
7(t) Flexible 17 10 3 4
10 Self-Starter 16 11 3 2
11 Dependable 15 9 4 2
12 Responsible 14 7 5 2
13 Adapts Easily to Change 13 6 3 4
14(t) Courteous & Considerate 12 6 3 3
14(t) Likes Job 12 4 7 1
14(t) Dedicated 12 7 3 2
17(t) Pleasant & Cheerful 11 6 0 5
17(t) Able to Work Ind. 11 3 5 3
19 Good Listener 9 3 6 0
20 Follows Instructions 7 3 3 1
21 Understands
Others/Empathy
6 3 2 1
22 Confident 4 3 1 0
23(t) Asks Appropriate Ques. 3 1 1 1
23(t) Prompt 3 1 2 0
23(t) Creative 3 2 1 0
26 Not Easily Distracted 1 0 1 0
27(t) Shows Gratitude 0 0 0 0
27(t) Understanding/ Accepting 0 0 0 0

Table 4 Where Skills are best learned
Skill Area On the Job Frequency
In College Frequency
Both Frequency
Total Frequency
Omits
Delivering Quality Cust. Service 49 11 4 64 2
Housekeeping Management 45 12 3 60 6
Facilities and Maintenance Mgmt. 43 15 4 62 4
Front Office Management 42 18 2 62 4
Employee Relations 42 12 10 64 2
Motivating Employees 38 18 8 64 2
Bar & Beverage Management 36 21 3 60 6
Managing Diversity 36 23 5 64 2
Sanitation 34 25 4 63 3
Planning and Conducting Training 32 28 3 63 3
Problem Solving 31 24 9 64 2
Current Industry Issues/Trends 30 30 4 64 2
Food and Beverage Management 27 31 5 63 3
Interpersonal Speaking 24 37 3 64 2
Menu Planning 23 34 5 62 4
Human Resource Management 20 40 4 64 2
Culinary Skills 19 38 4 61 5
Marketing, Advertising, Sales 18 41 2 61 5
Ethics 18 38 7 63 3
Public Speaking 8 53 1 62 4
Hospitality Industry Math 7 54 2 63 3
Accounting 6 54 3 63 3
Nutrition & Food Planning 6 52 2 60 6
Computer Skills 3 58 2 63 3
Writing Skills 3 59 1 63 3
Hospitality Law 3 57 3 63 3
51
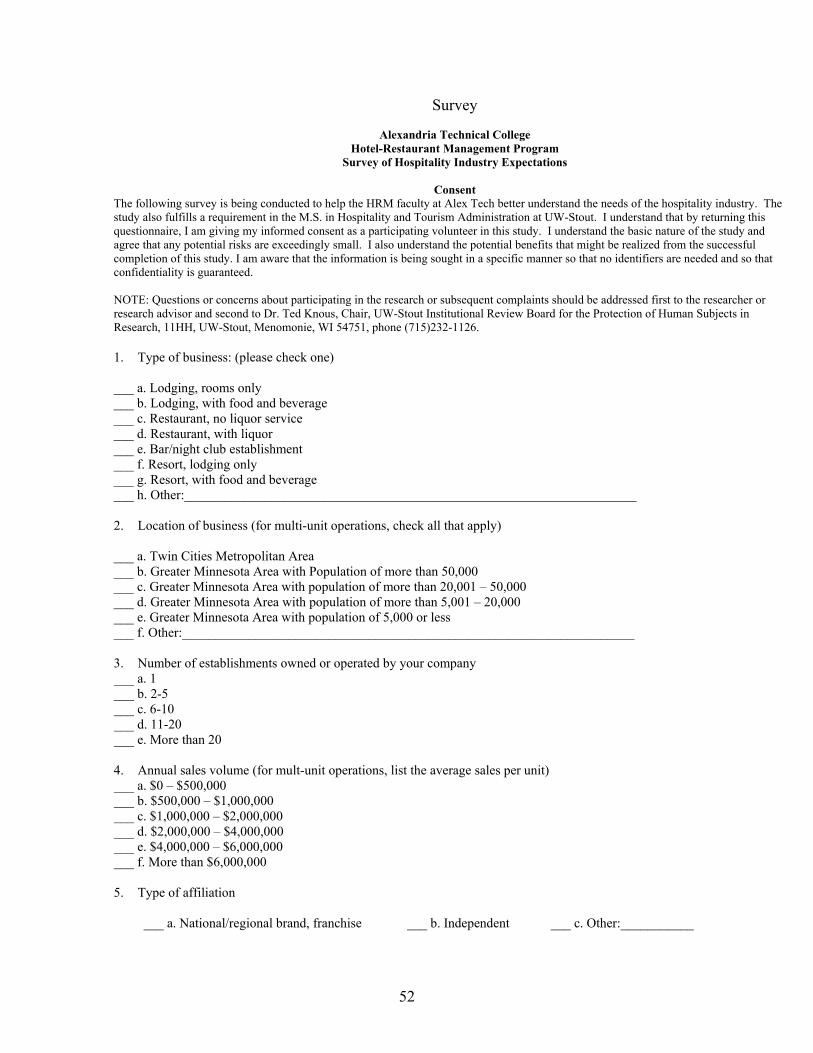
Survey
Alexandria Technical College Hotel-Restaurant Management Program
Survey of Hospitality Industry Expectations
Consent The following survey is being conducted to help the HRM faculty at Alex Tech better understand the needs of the hospitality industry. The study also fulfills a requirement in the M.S. in Hospitality and Tourism Administration at UW-Stout. I understand that by returning this questionnaire, I am giving my informed consent as a participating volunteer in this study. I understand the basic nature of the study and agree that any potential risks are exceedingly small. I also understand the potential benefits that might be realized from the successful completion of this study. I am aware that the information is being sought in a specific manner so that no identifiers are needed and so that confidentiality is guaranteed. NOTE: Questions or concerns about participating in the research or subsequent complaints should be addressed first to the researcher or research advisor and second to Dr. Ted Knous, Chair, UW-Stout Institutional Review Board for the Protection of Human Subjects in Research, 11HH, UW-Stout, Menomonie, WI 54751, phone (715)232-1126. 1. Type of business: (please check one) ___ a. Lodging, rooms only ___ b. Lodging, with food and beverage ___ c. Restaurant, no liquor service ___ d. Restaurant, with liquor ___ e. Bar/night club establishment ___ f. Resort, lodging only ___ g. Resort, with food and beverage ___ h. Other:____________________________________________________________________ 2. Location of business (for multi-unit operations, check all that apply) ___ a. Twin Cities Metropolitan Area ___ b. Greater Minnesota Area with Population of more than 50,000 ___ c. Greater Minnesota Area with population of more than 20,001 – 50,000 ___ d. Greater Minnesota Area with population of more than 5,001 – 20,000 ___ e. Greater Minnesota Area with population of 5,000 or less ___ f. Other:____________________________________________________________________ 3. Number of establishments owned or operated by your company ___ a. 1 ___ b. 2-5 ___ c. 6-10 ___ d. 11-20 ___ e. More than 20 4. Annual sales volume (for mult-unit operations, list the average sales per unit) ___ a. $0 – $500,000 ___ b. $500,000 – $1,000,000 ___ c. $1,000,000 – $2,000,000 ___ d. $2,000,000 – $4,000,000 ___ e. $4,000,000 – $6,000,000 ___ f. More than $6,000,000 5. Type of affiliation ___ a. National/regional brand, franchise ___ b. Independent ___ c. Other:___________
52
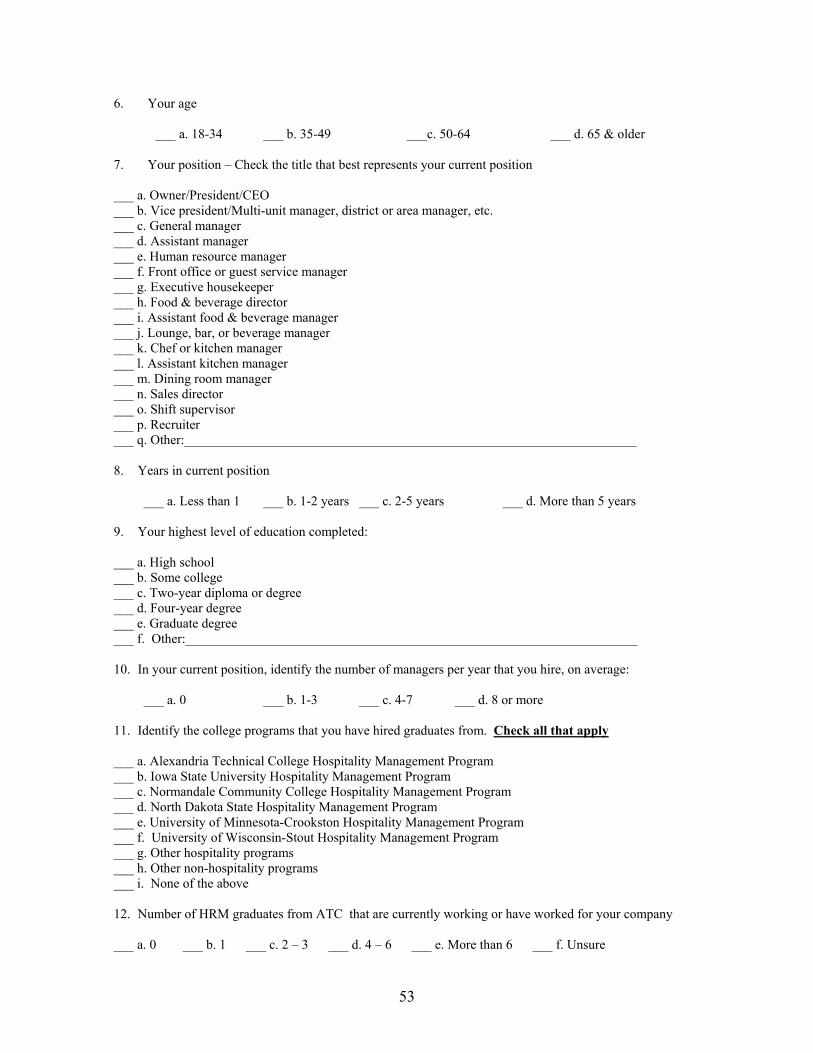
6. Your age ___ a. 18-34 ___ b. 35-49 ___c. 50-64 ___ d. 65 & older 7. Your position – Check the title that best represents your current position ___ a. Owner/President/CEO ___ b. Vice president/Multi-unit manager, district or area manager, etc. ___ c. General manager ___ d. Assistant manager ___ e. Human resource manager ___ f. Front office or guest service manager ___ g. Executive housekeeper ___ h. Food & beverage director ___ i. Assistant food & beverage manager ___ j. Lounge, bar, or beverage manager ___ k. Chef or kitchen manager ___ l. Assistant kitchen manager ___ m. Dining room manager ___ n. Sales director ___ o. Shift supervisor ___ p. Recruiter ___ q. Other:____________________________________________________________________ 8. Years in current position ___ a. Less than 1 ___ b. 1-2 years ___ c. 2-5 years ___ d. More than 5 years 9. Your highest level of education completed: ___ a. High school ___ b. Some college ___ c. Two-year diploma or degree ___ d. Four-year degree ___ e. Graduate degree ___ f. Other:____________________________________________________________________ 10. In your current position, identify the number of managers per year that you hire, on average: ___ a. 0 ___ b. 1-3 ___ c. 4-7 ___ d. 8 or more 11. Identify the college programs that you have hired graduates from. Check all that apply ___ a. Alexandria Technical College Hospitality Management Program ___ b. Iowa State University Hospitality Management Program ___ c. Normandale Community College Hospitality Management Program ___ d. North Dakota State Hospitality Management Program ___ e. University of Minnesota-Crookston Hospitality Management Program ___ f. University of Wisconsin-Stout Hospitality Management Program ___ g. Other hospitality programs ___ h. Other non-hospitality programs ___ i. None of the above 12. Number of HRM graduates from ATC that are currently working or have worked for your company ___ a. 0 ___ b. 1 ___ c. 2 – 3 ___ d. 4 – 6 ___ e. More than 6 ___ f. Unsure
53

13. Part 1: For each of the following skill areas, circle the number 1 through 5 that identifies the level of importance you attach to it. Use the following scale:
1=least important 2=somewhat important 3=moderately important 4=important 5=most important Part 2: In the last two columns on the right margin of this page there are two responses; “On the job,” and “In college.” For the corresponding skill, identify whether this skill is best learned on the job after graduation, or best learned in college. Please circle either response for each skill category. Part 1 Part 2 (circle 1) (circle 1) least important most important a. Marketing, Advertising, Sales, Strategic Planning 1 2 3 4 5 On the job In college
b. Delivering Quality Customer Service 1 2 3 4 5 On the job In college
c. Front Office Management 1 2 3 4 5 On the job In college
d. Bar & Beverage Management 1 2 3 4 5 On the job In college
e. Computer: Word Processing, Spreadsheets, Database 1 2 3 4 5 On the job In college
f. Writing Skills 1 2 3 4 5 On the job In college
g. Public Speaking Skills 1 2 3 4 5 On the job In college
h. Interpersonal Speaking Skills 1 2 3 4 5 On the job In college
i. Planning & Conducting Training 1 2 3 4 5 On the job In college
j. Accounting 1 2 3 4 5 On the job In college
k. Sanitation 1 2 3 4 5 On the job In college
l. Housekeeping Management 1 2 3 4 5 On the job In college
m. Facilities & Maintenance Management 1 2 3 4 5 On the job In college
n. Food & Beverage Controls 1 2 3 4 5 On the job In college
o. Current Industry Issues & Trends 1 2 3 4 5 On the job In college
p. Ethics 1 2 3 4 5 On the job In college
q. Menu Planning 1 2 3 4 5 On the job In college
r. Hospitality Law 1 2 3 4 5 On the job In college
s. Hospitality Industry Math Skills 1 2 3 4 5 On the job In college
t. Nutrition & Food Planning 1 2 3 4 5 On the job In college
u. Culinary Skills 1 2 3 4 5 On the job In college
v. Human Resource Management 1 2 3 4 5 On the job In college
w. Motivating Employees 1 2 3 4 5 On the job In college
x. Managing Diversity 1 2 3 4 5 On the job In college
y. Employee Relations 1 2 3 4 5 On the job In college
z. Problem Solving 1 2 3 4 5 On the job In college
54
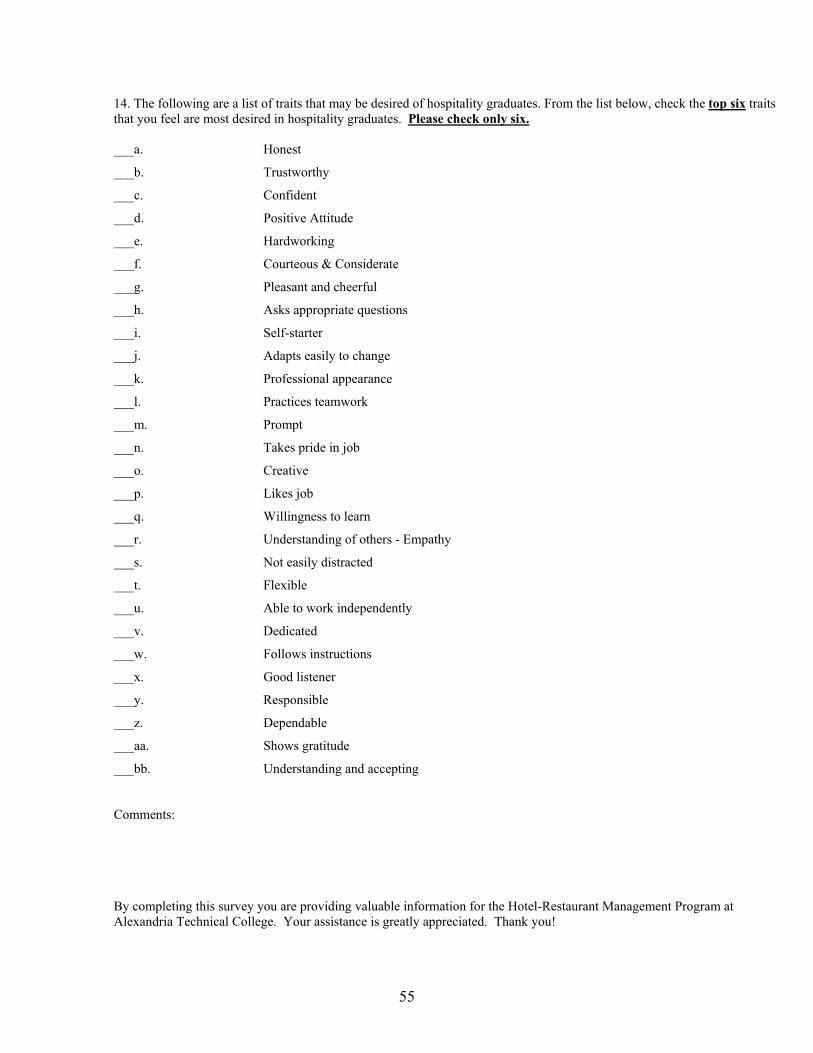
14. The following are a list of traits that may be desired of hospitality graduates. From the list below, check the top six traits that you feel are most desired in hospitality graduates. Please check only six. ___a. Honest
___b. Trustworthy
___c. Confident
___d. Positive Attitude
___e. Hardworking
___f. Courteous & Considerate
___g. Pleasant and cheerful
___h. Asks appropriate questions
___i. Self-starter
___j. Adapts easily to change
___k. Professional appearance
___l. Practices teamwork
___m. Prompt
___n. Takes pride in job
___o. Creative
___p. Likes job
___q. Willingness to learn
___r. Understanding of others - Empathy
___s. Not easily distracted
___t. Flexible
___u. Able to work independently
___v. Dedicated
___w. Follows instructions
___x. Good listener
___y. Responsible
___z. Dependable
___aa. Shows gratitude
___bb. Understanding and accepting
Comments: By completing this survey you are providing valuable information for the Hotel-Restaurant Management Program at Alexandria Technical College. Your assistance is greatly appreciated. Thank you!
55