

Minnesota FluSurv -NET - Texas
34
Minnesota FluSurv-NET Melissa McMahon | Senior Epidemiologist September 24 th , 2019
Transcript of Minnesota FluSurv -NET - Texas

Minnesota FluSurv-NET
Melissa McMahon | Senior Epidemiologist
September 24th, 2019
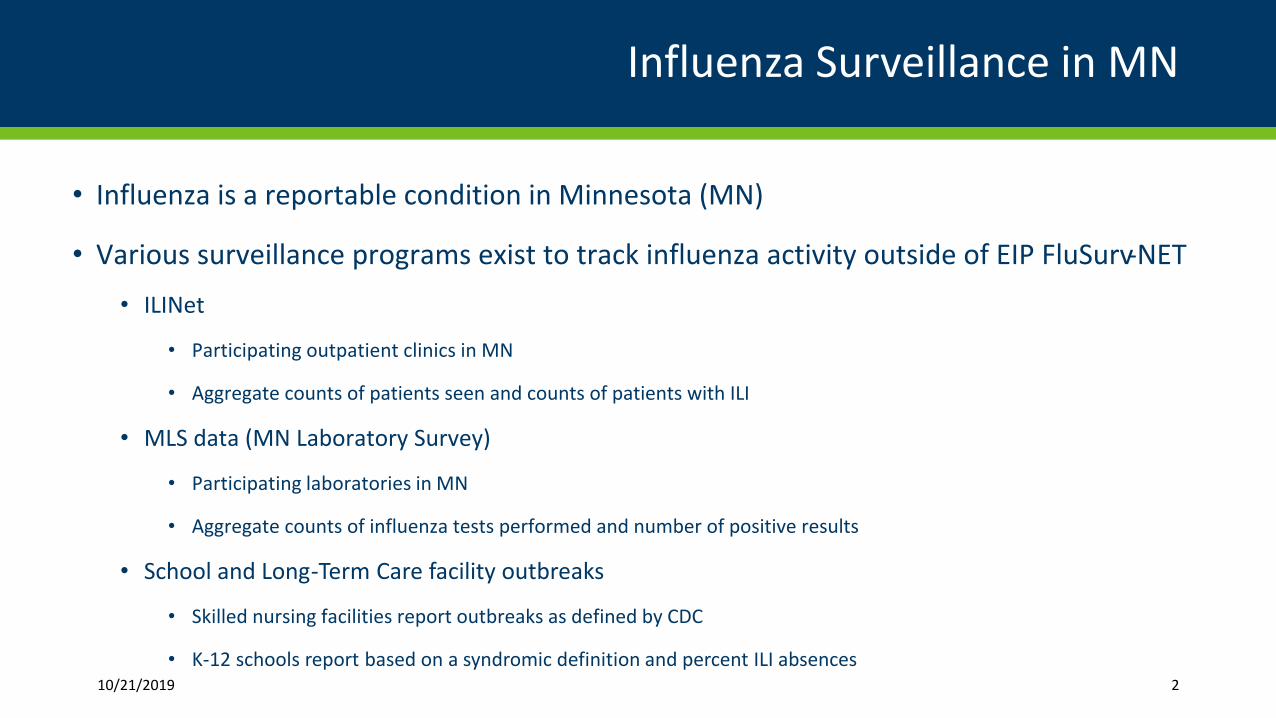
Influenza Surveillance in MN
• Influenza is a reportable condition in Minnesota (MN)
• Various surveillance programs exist to track influenza activity outside of EIP FluSurv-NET
• ILINet
• Participating outpatient clinics in MN
• Aggregate counts of patients seen and counts of patients with ILI
• MLS data (MN Laboratory Survey)
• Participating laboratories in MN
• Aggregate counts of influenza tests performed and number of positive results
• School and Long-Term Care facility outbreaks
• Skilled nursing facilities report outbreaks as defined by CDC
• K-12 schools report based on a syndromic definition and percent ILI absences10/21/2019 2
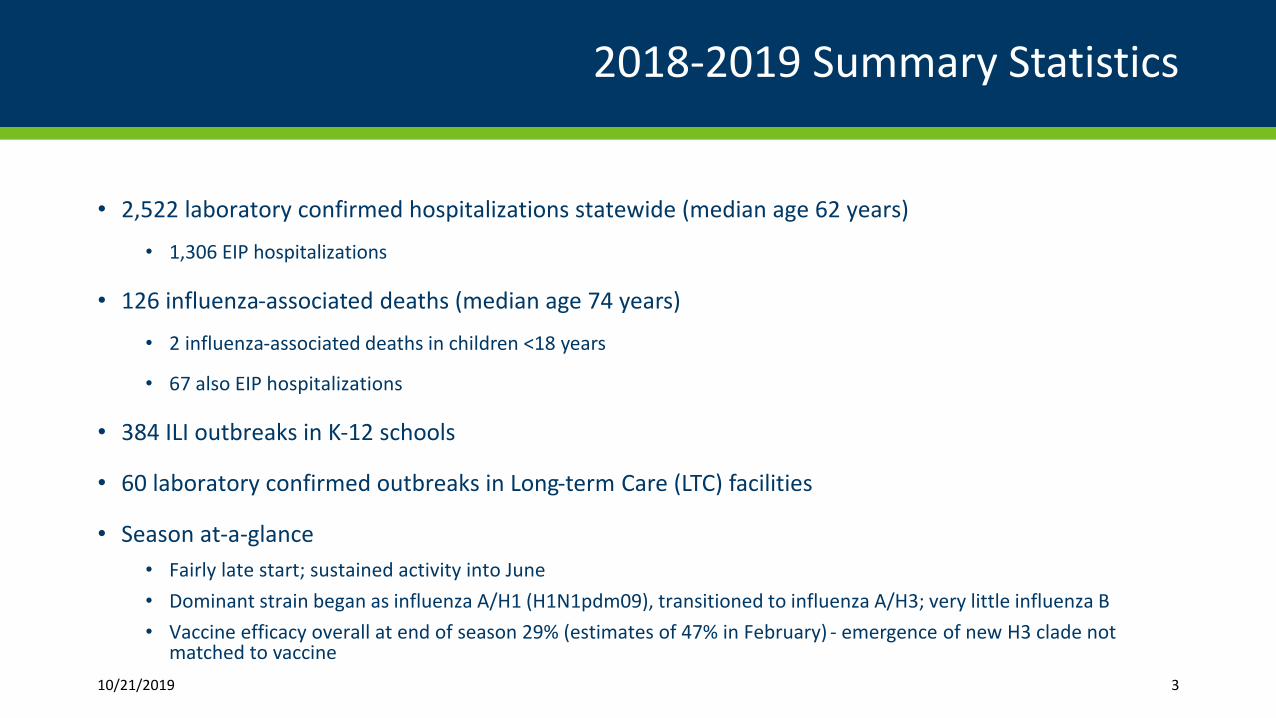
2018-2019 Summary Statistics
• 2,522 laboratory confirmed hospitalizations statewide (median age 62 years)
• 1,306 EIP hospitalizations
• 126 influenza-associated deaths (median age 74 years)
• 2 influenza-associated deaths in children <18 years
• 67 also EIP hospitalizations
• 384 ILI outbreaks in K-12 schools
• 60 laboratory confirmed outbreaks in Long-term Care (LTC) facilities
• Season at-a-glance• Fairly late start; sustained activity into June• Dominant strain began as influenza A/H1 (H1N1pdm09), transitioned to influenza A/H3; very little influenza B• Vaccine efficacy overall at end of season 29% (estimates of 47% in February) - emergence of new H3 clade not
matched to vaccine10/21/2019 3
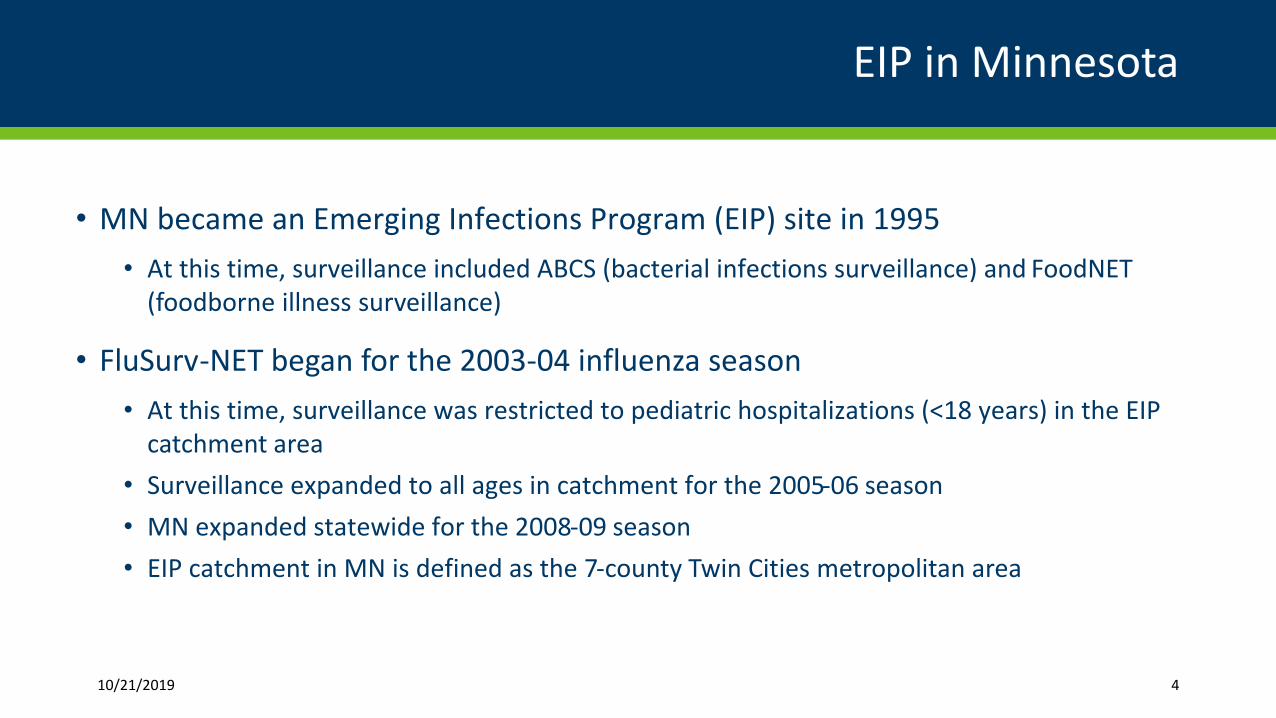
EIP in Minnesota
• MN became an Emerging Infections Program (EIP) site in 1995• At this time, surveillance included ABCS (bacterial infections surveillance) and FoodNET
(foodborne illness surveillance)
• FluSurv-NET began for the 2003-04 influenza season• At this time, surveillance was restricted to pediatric hospitalizations (<18 years) in the EIP
catchment area• Surveillance expanded to all ages in catchment for the 2005-06 season• MN expanded statewide for the 2008-09 season• EIP catchment in MN is defined as the 7-county Twin Cities metropolitan area
10/21/2019 4
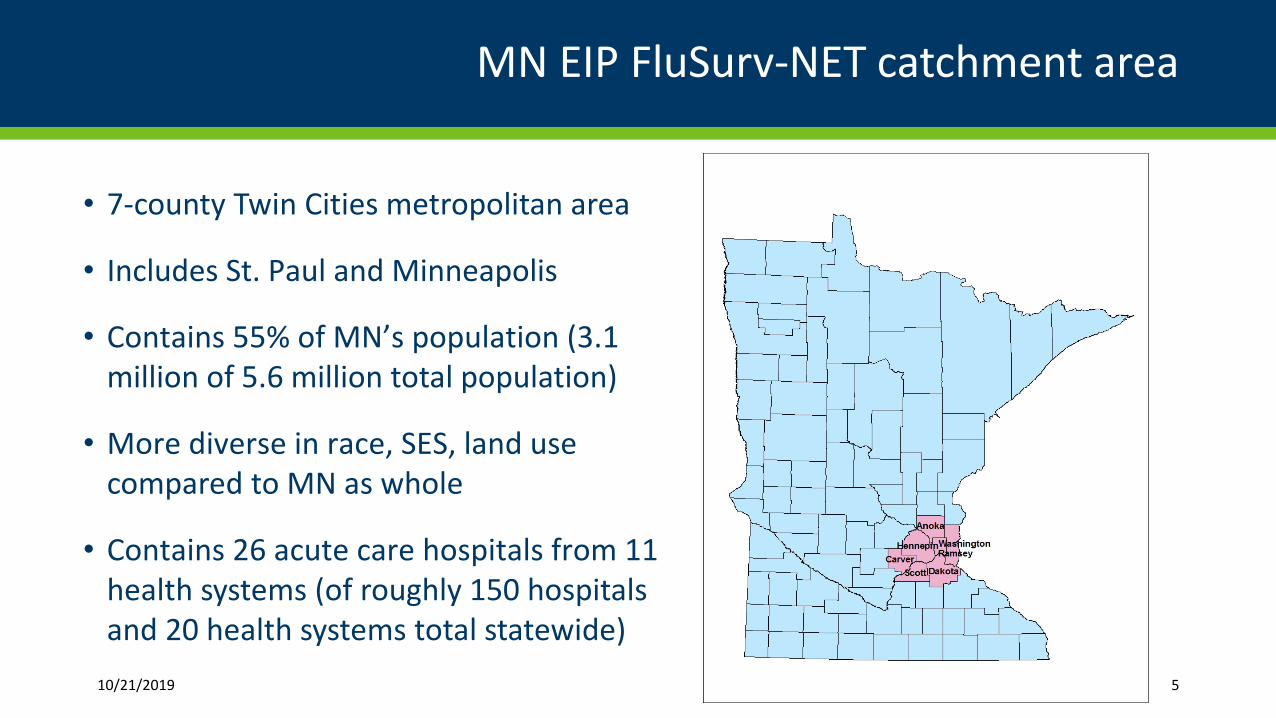
MN EIP FluSurv-NET catchment area
• 7-county Twin Cities metropolitan area
• Includes St. Paul and Minneapolis
• Contains 55% of MN’s population (3.1million of 5.6 million total population)
• More diverse in race, SES, land usecompared to MN as whole
• Contains 26 acute care hospitals from 11health systems (of roughly 150 hospitalsand 20 health systems total statewide)
10/21/2019 5
FluSurv-NET Structure and Funding
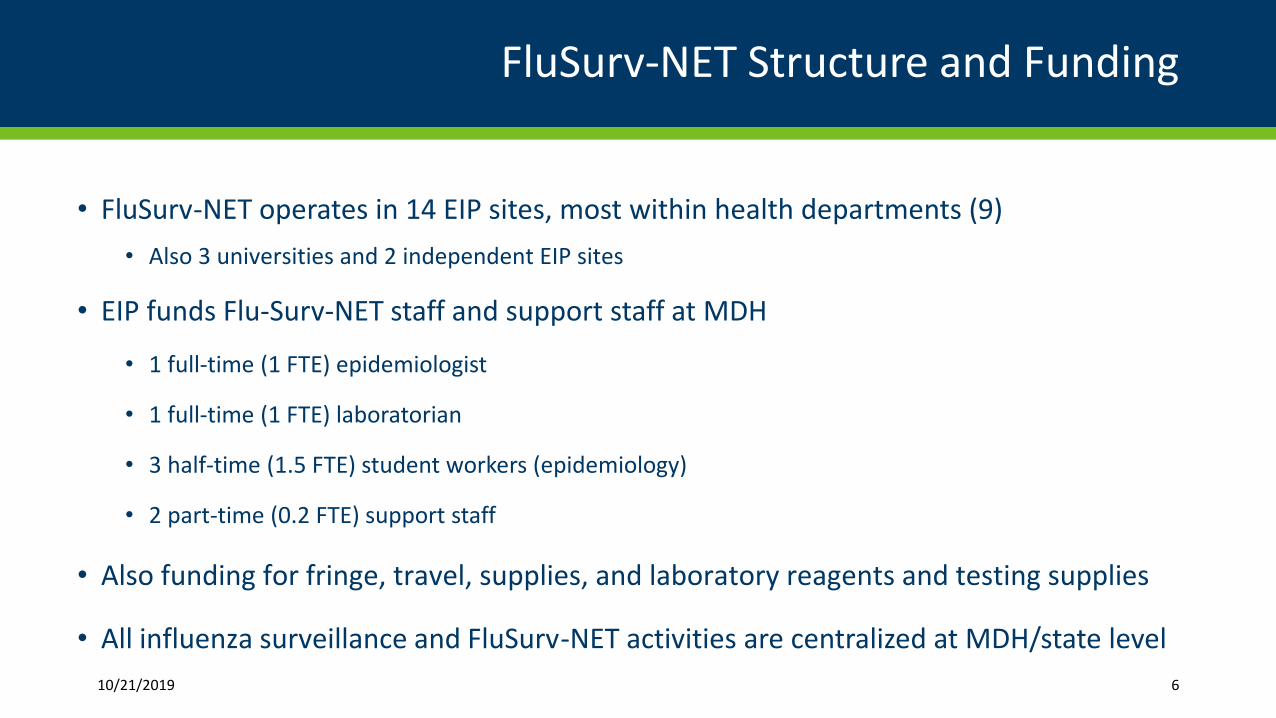
• FluSurv-NET operates in 14 EIP sites, most within health departments (9)• Also 3 universities and 2 independent EIP sites
• EIP funds Flu-Surv-NET staff and support staff at MDH
• 1 full-time (1 FTE) epidemiologist
• 1 full-time (1 FTE) laboratorian
• 3 half-time (1.5 FTE) student workers (epidemiology)
• 2 part-time (0.2 FTE) support staff
• Also funding for fringe, travel, supplies, and laboratory reagents and testing supplies
• All influenza surveillance and FluSurv-NET activities are centralized at MDH/state level10/21/2019 6
FluSurv-NET and Associated EIP Studies
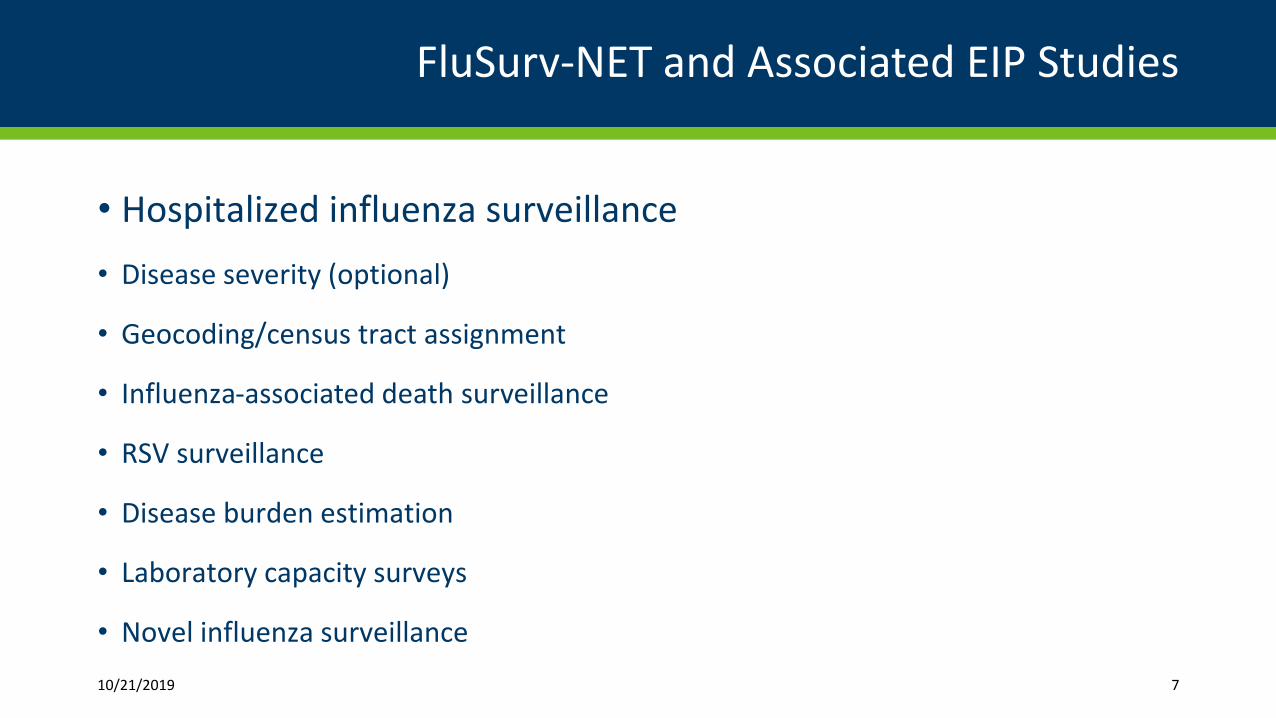
• Hospitalized influenza surveillance• Disease severity (optional)
• Geocoding/census tract assignment
• Influenza-associated death surveillance
• RSV surveillance
• Disease burden estimation
• Laboratory capacity surveys
• Novel influenza surveillance10/21/2019 7
Hospitalized Influenza Surveillance
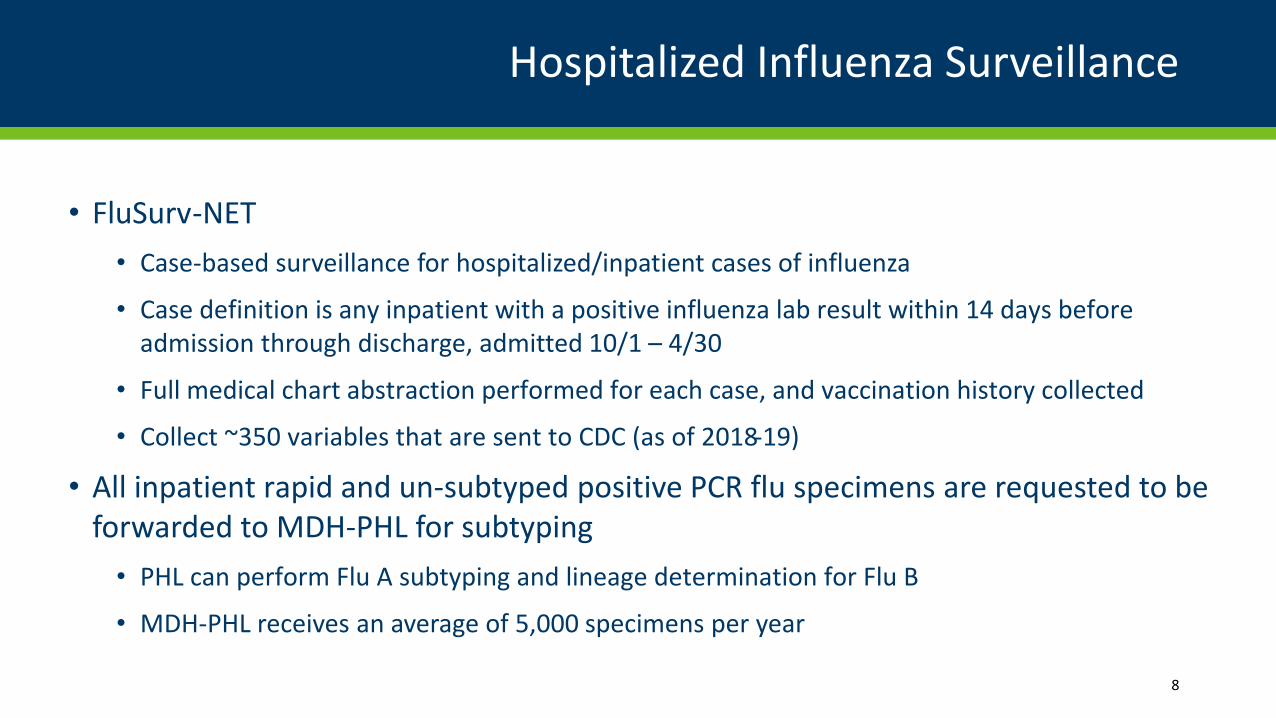
• FluSurv-NET• Case-based surveillance for hospitalized/inpatient cases of influenza
• Case definition is any inpatient with a positive influenza lab result within 14 days before admission through discharge, admitted 10/1 – 4/30
• Full medical chart abstraction performed for each case, and vaccination history collected
• Collect ~350 variables that are sent to CDC (as of 2018-19)
• All inpatient rapid and un-subtyped positive PCR flu specimens are requested to be forwarded to MDH-PHL for subtyping
• PHL can perform Flu A subtyping and lineage determination for Flu B
• MDH-PHL receives an average of 5,000 specimens per year
8
Statewide Hospitalization Data (Non-EIP Project)
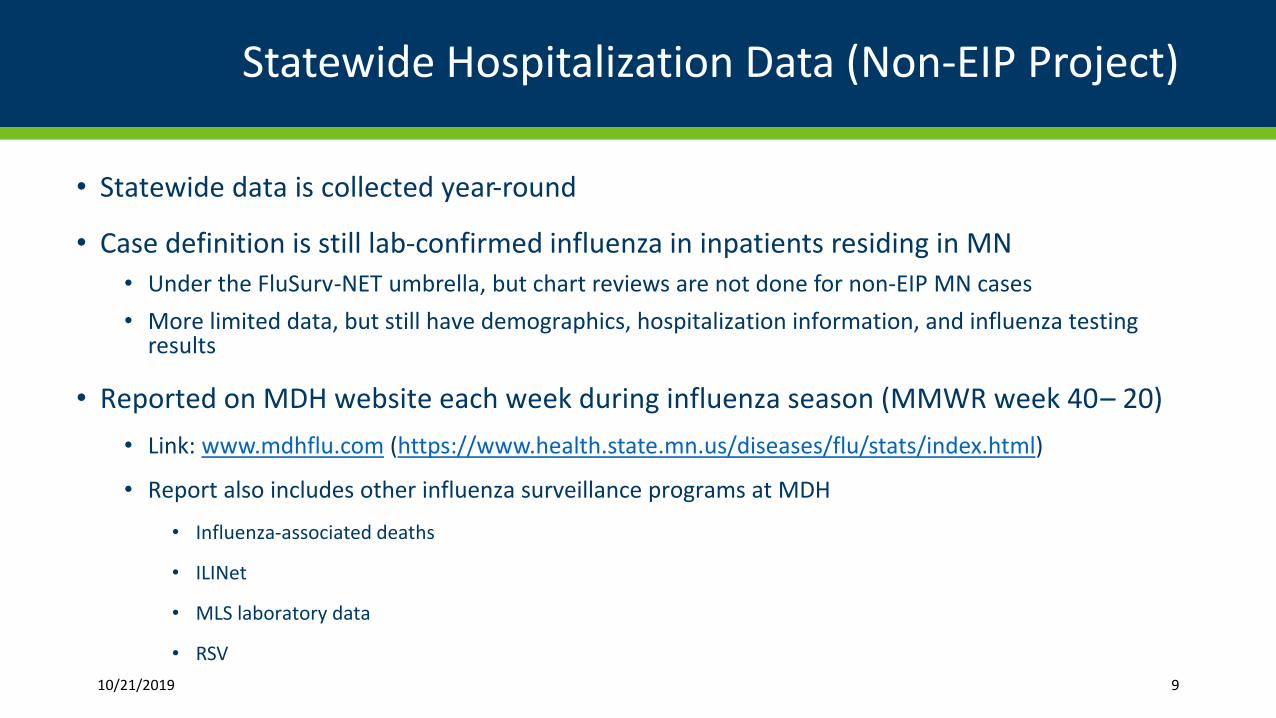
• Statewide data is collected year-round
• Case definition is still lab-confirmed influenza in inpatients residing in MN• Under the FluSurv-NET umbrella, but chart reviews are not done for non-EIP MN cases• More limited data, but still have demographics, hospitalization information, and influenza testing
results
• Reported on MDH website each week during influenza season (MMWR week 40 – 20)• Link: www.mdhflu.com (https://www.health.state.mn.us/diseases/flu/stats/index.html)
• Report also includes other influenza surveillance programs at MDH
• Influenza-associated deaths
• ILINet
• MLS laboratory data
• RSV10/21/2019 9
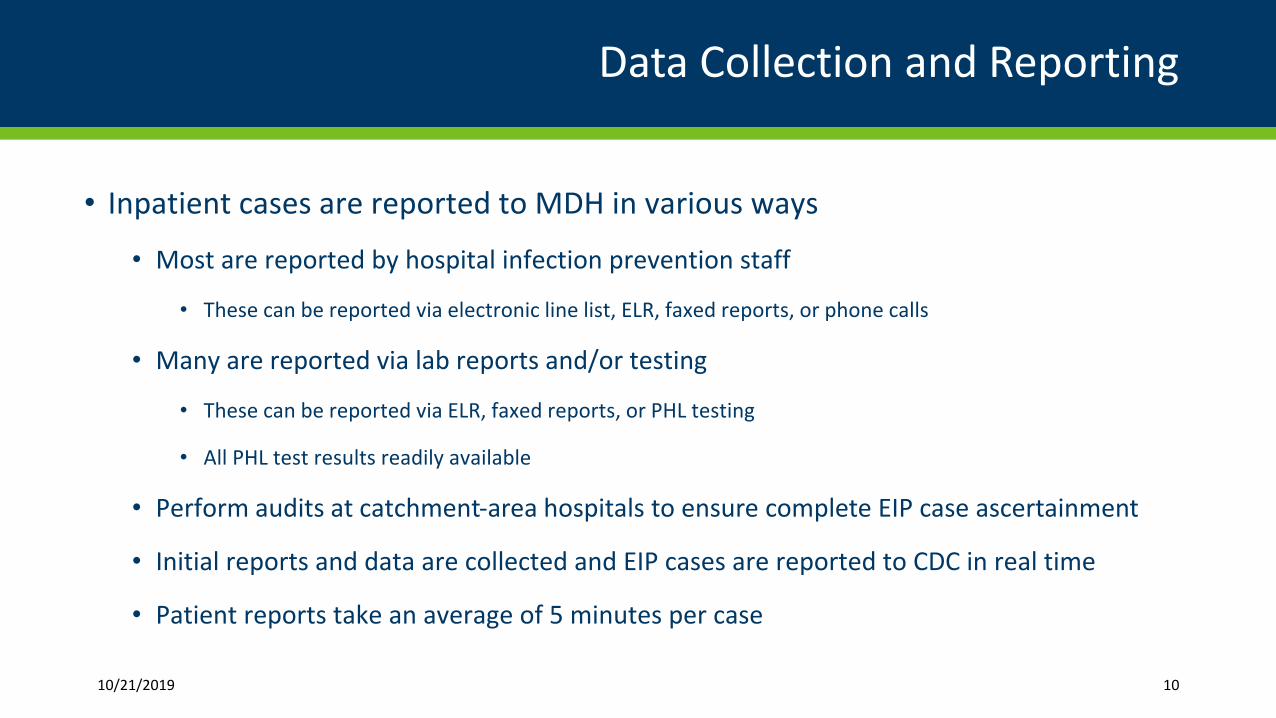
Data Collection and Reporting
• Inpatient cases are reported to MDH in various ways
• Most are reported by hospital infection prevention staff
• These can be reported via electronic line list, ELR, faxed reports, or phone calls
• Many are reported via lab reports and/or testing
• These can be reported via ELR, faxed reports, or PHL testing
• All PHL test results readily available
• Perform audits at catchment-area hospitals to ensure complete EIP case ascertainment
• Initial reports and data are collected and EIP cases are reported to CDC in real time
• Patient reports take an average of 5 minutes per case
10/21/2019 10
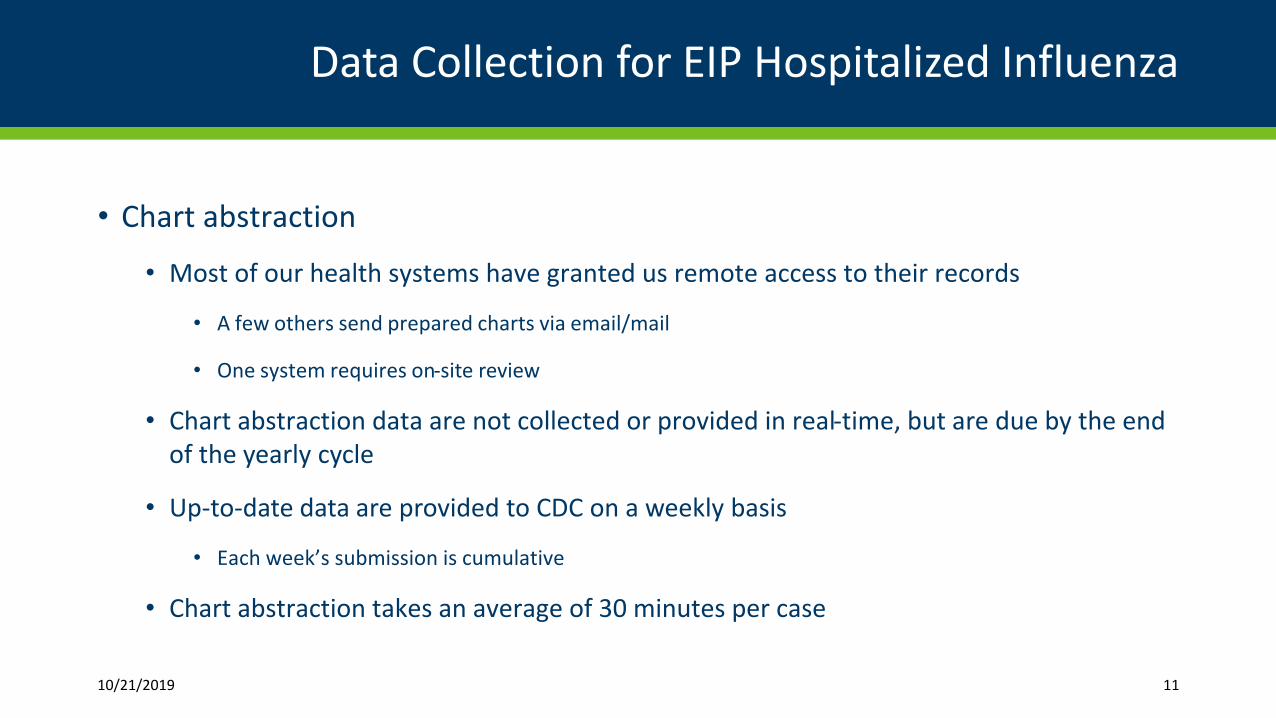
Data Collection for EIP Hospitalized Influenza
• Chart abstraction
• Most of our health systems have granted us remote access to their records
• A few others send prepared charts via email/mail
• One system requires on-site review
• Chart abstraction data are not collected or provided in real-time, but are due by the end of the yearly cycle
• Up-to-date data are provided to CDC on a weekly basis
• Each week’s submission is cumulative
• Chart abstraction takes an average of 30 minutes per case
10/21/2019 11
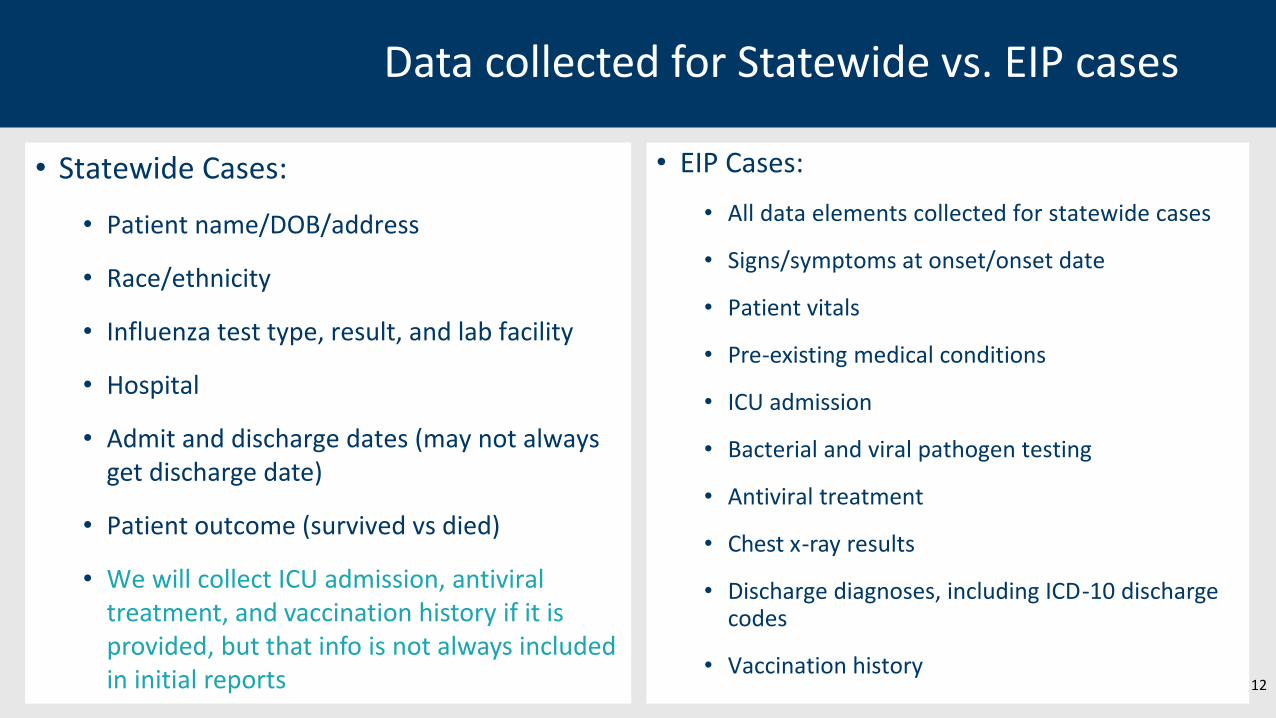
Data collected for Statewide vs. EIP cases
• Statewide Cases:
• Patient name/DOB/address
• Race/ethnicity
• Influenza test type, result, and lab facility
• Hospital
• Admit and discharge dates (may not always get discharge date)
• Patient outcome (survived vs died)
• We will collect ICU admission, antiviral treatment, and vaccination history if it is provided, but that info is not always included in initial reports
• EIP Cases:
• All data elements collected for statewide cases
• Signs/symptoms at onset/onset date
• Patient vitals
• Pre-existing medical conditions
• ICU admission
• Bacterial and viral pathogen testing
• Antiviral treatment
• Chest x-ray results
• Discharge diagnoses, including ICD-10 discharge codes
• Vaccination history12
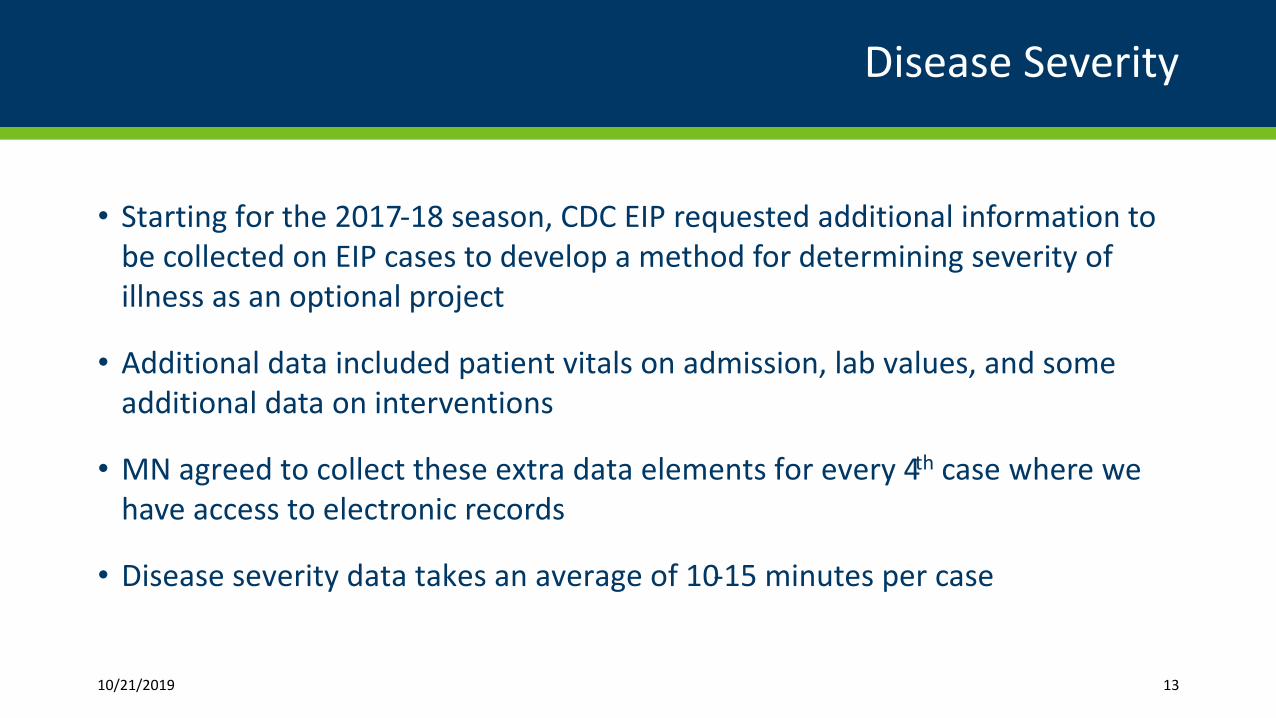
Disease Severity
• Starting for the 2017-18 season, CDC EIP requested additional information to be collected on EIP cases to develop a method for determining severity of illness as an optional project
• Additional data included patient vitals on admission, lab values, and some additional data on interventions
• MN agreed to collect these extra data elements for every 4th case where we have access to electronic records
• Disease severity data takes an average of 10-15 minutes per case
10/21/2019 13
Geocoding
• Another extra requirement from CDC EIP is that all cases are geocoded and assigned to a census tract
• CDC does not have access to patient address or exact location
• Census tracts are more useful in neighborhood-level geographical analyses using poverty, SES, crowding, or race/ethnicity data by census tract
• Census tracts are more useful than zip code for these types of analyses, since they are more homogenous
• Project takes around one week to complete, since address data is collected upon case report
• Majority of this time is spent cleaning the address data
• Actual geocoding and data preparation takes a few hours
10/21/2019 14
Death Ascertainment
• In addition to the routine influenza-associated death surveillance performed in MN, CDC EIP has a special study to ensure complete ascertainment of deaths following influenza hospitalization
• Matches death records with influenza hospitalizations to find any cases who have died after discharge (within 30 days)
• Collects additional information on cause(s) of death
• Project takes a few hours to complete, as the matching is entirely done using SAS code
10/21/2019 15
MN Influenza Death Surveillance (Non-EIP Project)
• Influenza-associated deaths are reportable in MN. While there is a special requirement for pediatric deaths, data are collected for all ages.
• Influenza-associated deaths are typically reported by Vital Records (MDH) and hospitalized influenza surveillance.
• Case definition includes:• Hospitalized influenza patients who die inpatient, or within 30 days of discharge• Individuals with “Influenza” listed as a cause of death• Individuals who test positive for influenza post-mortem• Individuals associated with a LTCF ILI outbreak (with or without flu testing)• Individuals who die within 60 days of a positive influenza test, without recovery from
influenza symptoms
16
RSV Surveillance
• The FluSurv-NET surveillance platform was used to launch hospitalized RSV surveillance in 2016
• Retrospective surveillance was done for adults for the 2014-15 and 2015-16 influenza seasons
• Real-time surveillance began in 2016 for pediatric cases, then for all ages
• Case ascertainment and chart abstraction for RSV use influenza surveillance model
• Multiple special studies combine influenza and RSV to streamline the process
10/21/2019 17
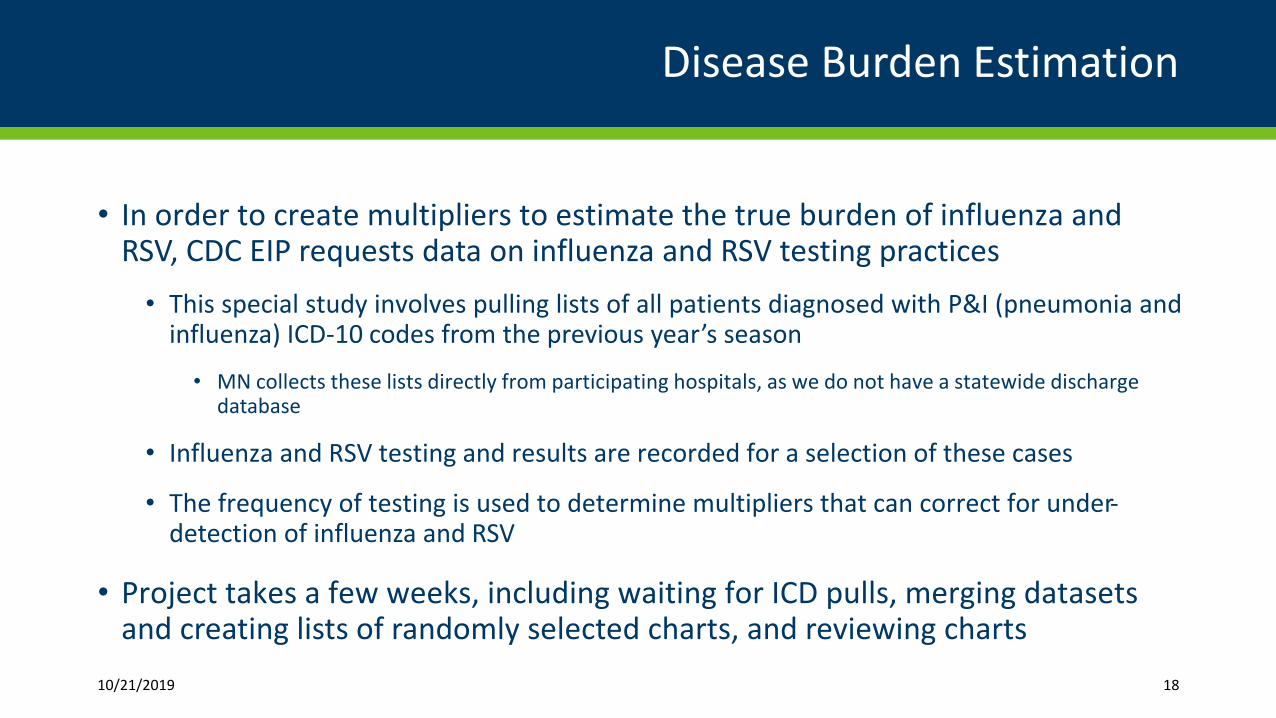
Disease Burden Estimation
• In order to create multipliers to estimate the true burden of influenza and RSV, CDC EIP requests data on influenza and RSV testing practices
• This special study involves pulling lists of all patients diagnosed with P&I (pneumonia and influenza) ICD-10 codes from the previous year’s season
• MN collects these lists directly from participating hospitals, as we do not have a statewide discharge database
• Influenza and RSV testing and results are recorded for a selection of these cases
• The frequency of testing is used to determine multipliers that can correct for under-detection of influenza and RSV
• Project takes a few weeks, including waiting for ICD pulls, merging datasets and creating lists of randomly selected charts, and reviewing charts
10/21/2019 18
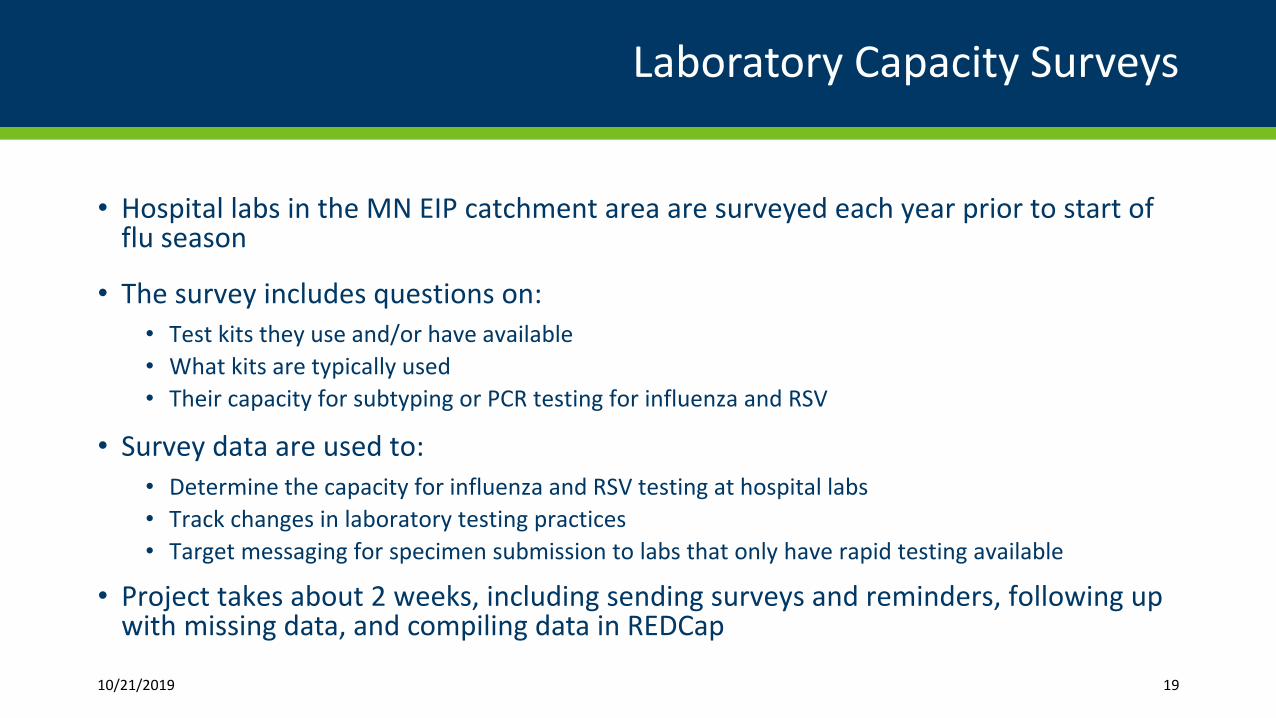
Laboratory Capacity Surveys
• Hospital labs in the MN EIP catchment area are surveyed each year prior to start of flu season
• The survey includes questions on: • Test kits they use and/or have available• What kits are typically used• Their capacity for subtyping or PCR testing for influenza and RSV
• Survey data are used to:• Determine the capacity for influenza and RSV testing at hospital labs• Track changes in laboratory testing practices• Target messaging for specimen submission to labs that only have rapid testing available
• Project takes about 2 weeks, including sending surveys and reminders, following up with missing data, and compiling data in REDCap
10/21/2019 19
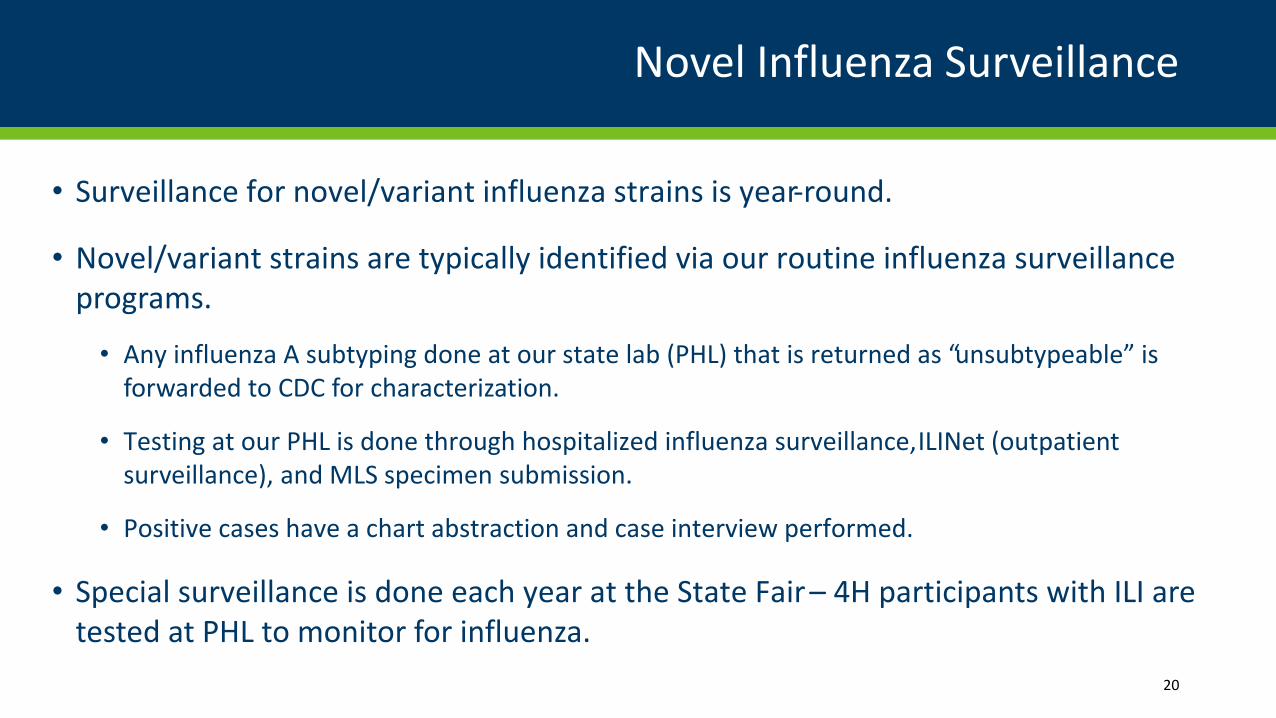
Novel Influenza Surveillance
• Surveillance for novel/variant influenza strains is year-round.
• Novel/variant strains are typically identified via our routine influenza surveillance programs.
• Any influenza A subtyping done at our state lab (PHL) that is returned as “unsubtypeable” is forwarded to CDC for characterization.
• Testing at our PHL is done through hospitalized influenza surveillance, ILINet (outpatient surveillance), and MLS specimen submission.
• Positive cases have a chart abstraction and case interview performed.
• Special surveillance is done each year at the State Fair – 4H participants with ILI are tested at PHL to monitor for influenza.
20
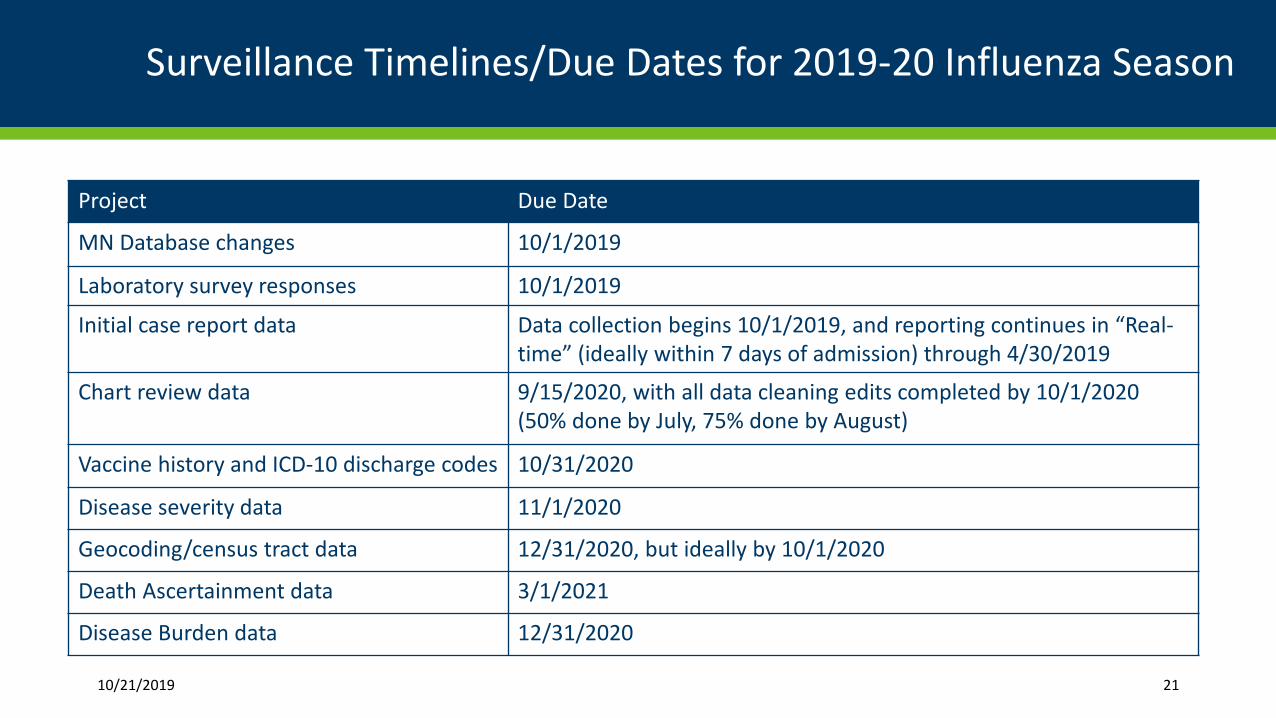
Surveillance Timelines/Due Dates for 2019-20 Influenza Season
Project Due Date
MN Database changes 10/1/2019
Laboratory survey responses 10/1/2019
Initial case report data Data collection begins 10/1/2019, and reporting continues in “Real-time” (ideally within 7 days of admission) through 4/30/2019
Chart review data 9/15/2020, with all data cleaning edits completed by 10/1/2020 (50% done by July, 75% done by August)
Vaccine history and ICD-10 discharge codes 10/31/2020
Disease severity data 11/1/2020
Geocoding/census tract data 12/31/2020, but ideally by 10/1/2020
Death Ascertainment data 3/1/2021
Disease Burden data 12/31/2020
10/21/2019 21
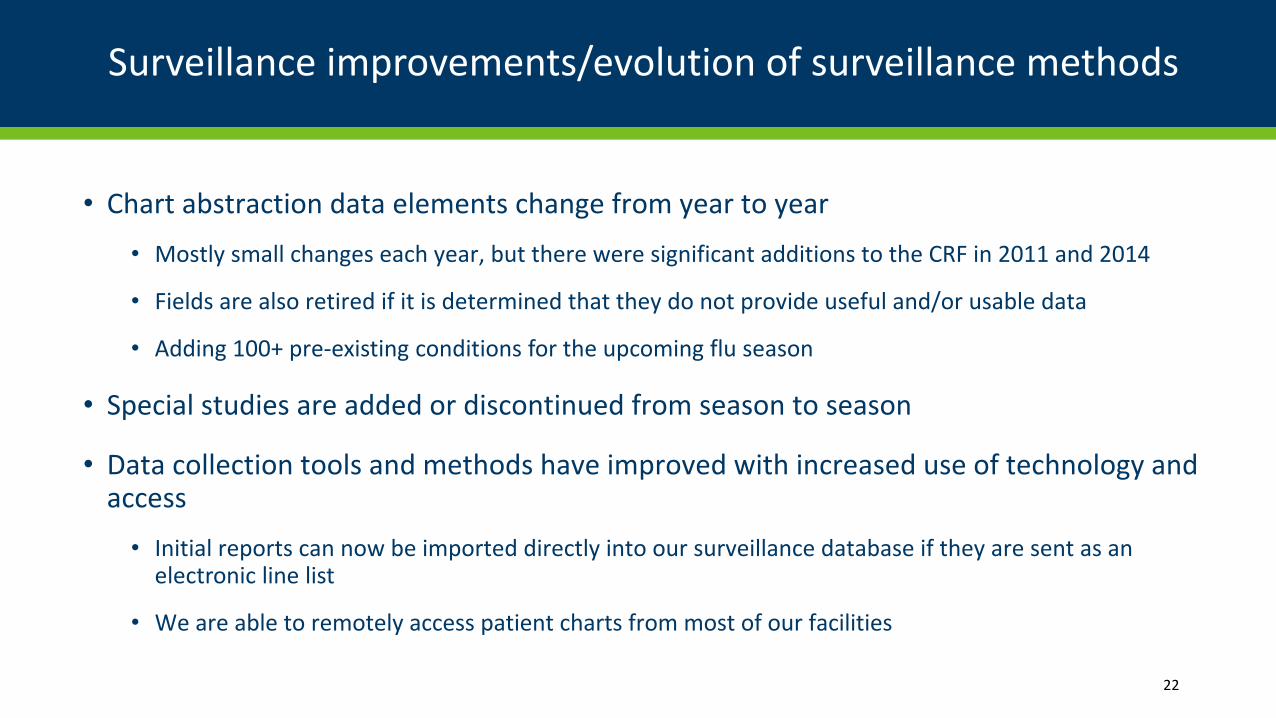
Surveillance improvements/evolution of surveillance methods
• Chart abstraction data elements change from year to year
• Mostly small changes each year, but there were significant additions to the CRF in 2011 and 2014
• Fields are also retired if it is determined that they do not provide useful and/or usable data
• Adding 100+ pre-existing conditions for the upcoming flu season
• Special studies are added or discontinued from season to season
• Data collection tools and methods have improved with increased use of technology and access
• Initial reports can now be imported directly into our surveillance database if they are sent as an electronic line list
• We are able to remotely access patient charts from most of our facilities
22
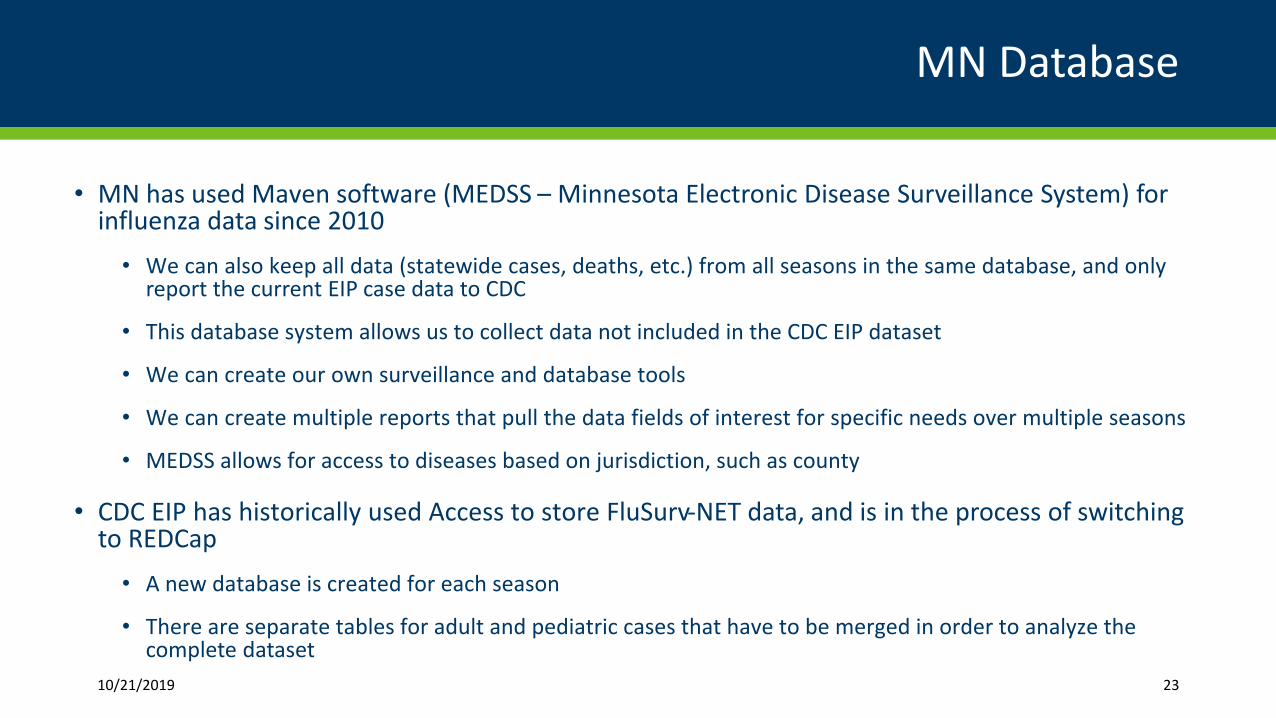
MN Database
• MN has used Maven software (MEDSS – Minnesota Electronic Disease Surveillance System) for influenza data since 2010
• We can also keep all data (statewide cases, deaths, etc.) from all seasons in the same database, and only report the current EIP case data to CDC
• This database system allows us to collect data not included in the CDC EIP dataset
• We can create our own surveillance and database tools
• We can create multiple reports that pull the data fields of interest for specific needs over multiple seasons
• MEDSS allows for access to diseases based on jurisdiction, such as county
• CDC EIP has historically used Access to store FluSurv-NET data, and is in the process of switching to REDCap
• A new database is created for each season
• There are separate tables for adult and pediatric cases that have to be merged in order to analyze the complete dataset
10/21/2019 23
MN Influenza Data
24
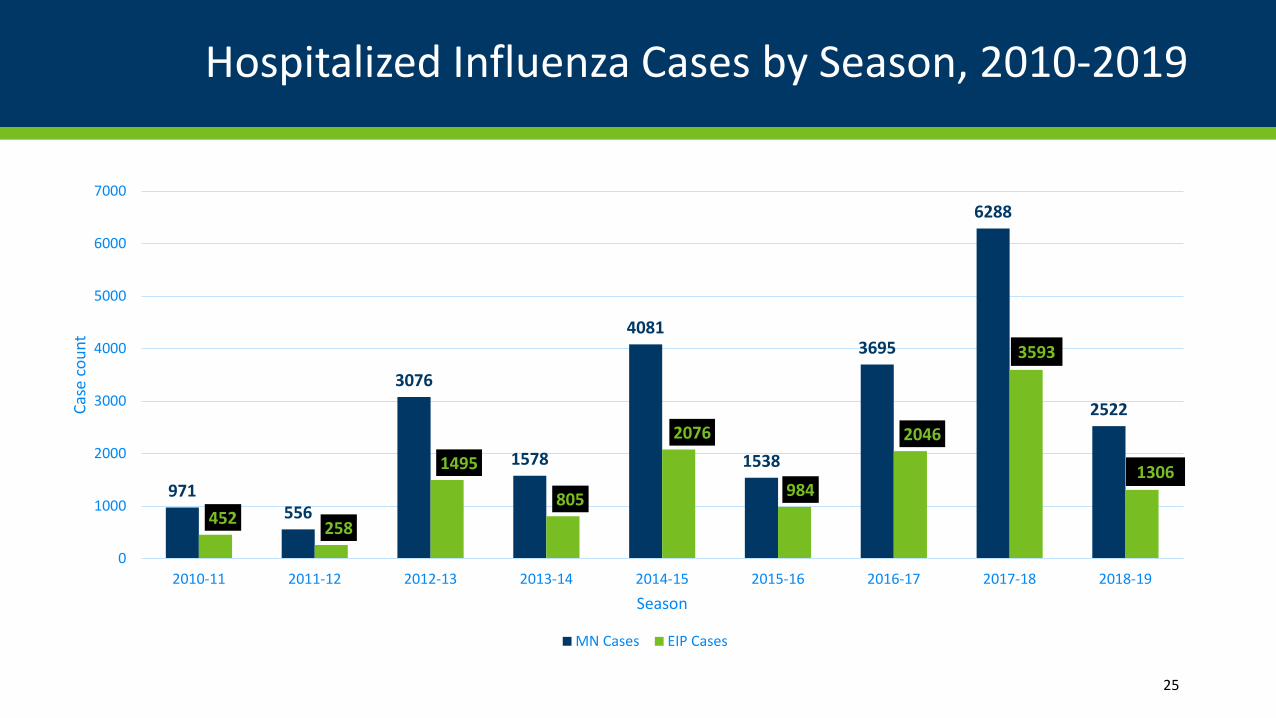
Hospitalized Influenza Cases by Season, 2010-2019
25
971556
3076
1578
4081
1538
3695
6288
2522
452 258
1495
805
2076
984
2046
3593
1306
0
1000
2000
3000
4000
5000
6000
7000
2010-11 2011-12 2012-13 2013-14 2014-15 2015-16 2016-17 2017-18 2018-19
Case
cou
nt
Season
MN Cases EIP Cases
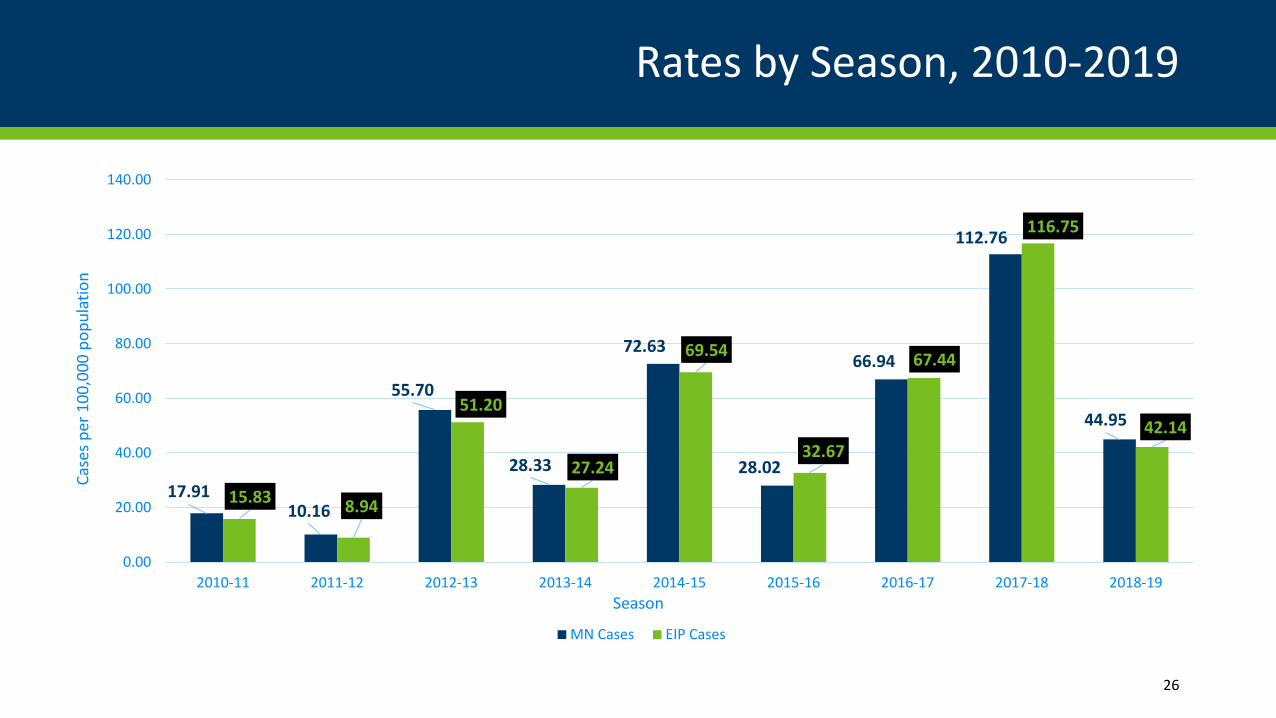
Rates by Season, 2010-2019
26
17.9110.16
55.70
28.33
72.63
28.02
66.94
112.76
44.95
15.83 8.94
51.20
27.24
69.54
32.67
67.44
116.75
42.14
0.00
20.00
40.00
60.00
80.00
100.00
120.00
140.00
2010-11 2011-12 2012-13 2013-14 2014-15 2015-16 2016-17 2017-18 2018-19
Case
s per
100
,000
pop
ulat
ion
Season
MN Cases EIP Cases
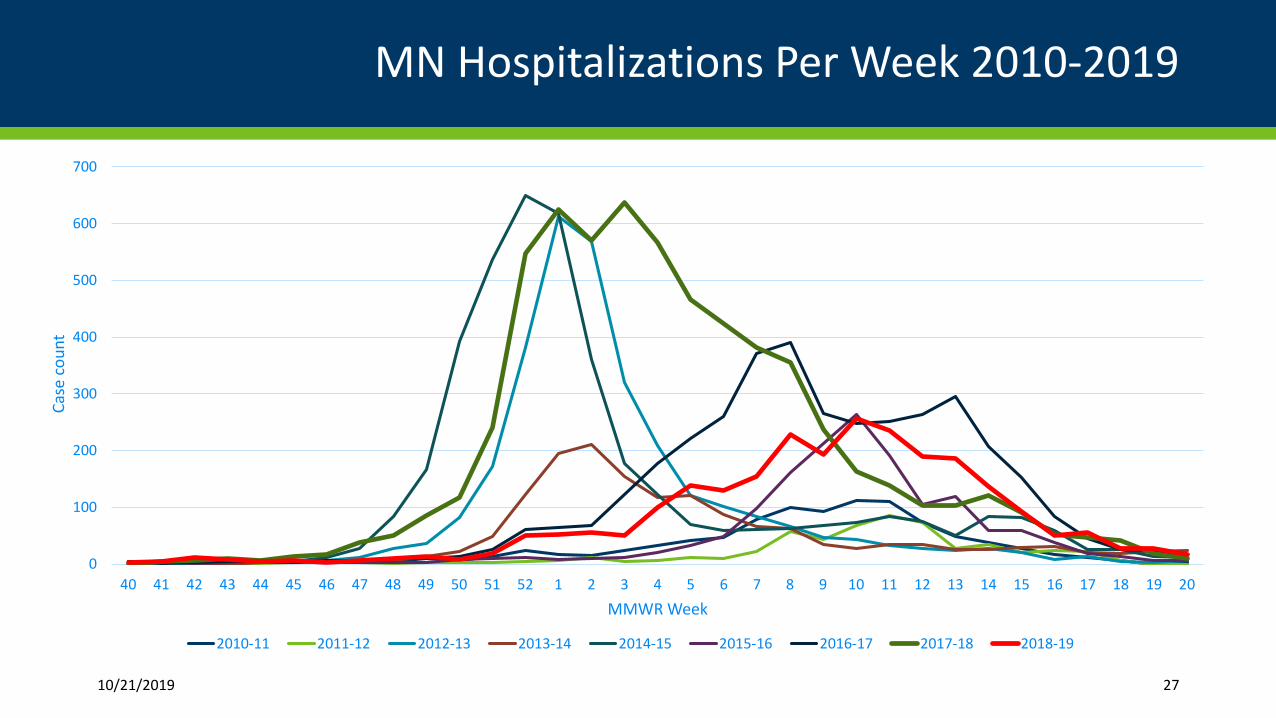
MN Hospitalizations Per Week 2010-2019
10/21/2019 27
0
100
200
300
400
500
600
700
40 41 42 43 44 45 46 47 48 49 50 51 52 1 2 3 4 5 6 7 8 9 10 11 12 13 14 15 16 17 18 19 20
Case
cou
nt
MMWR Week
2010-11 2011-12 2012-13 2013-14 2014-15 2015-16 2016-17 2017-18 2018-19
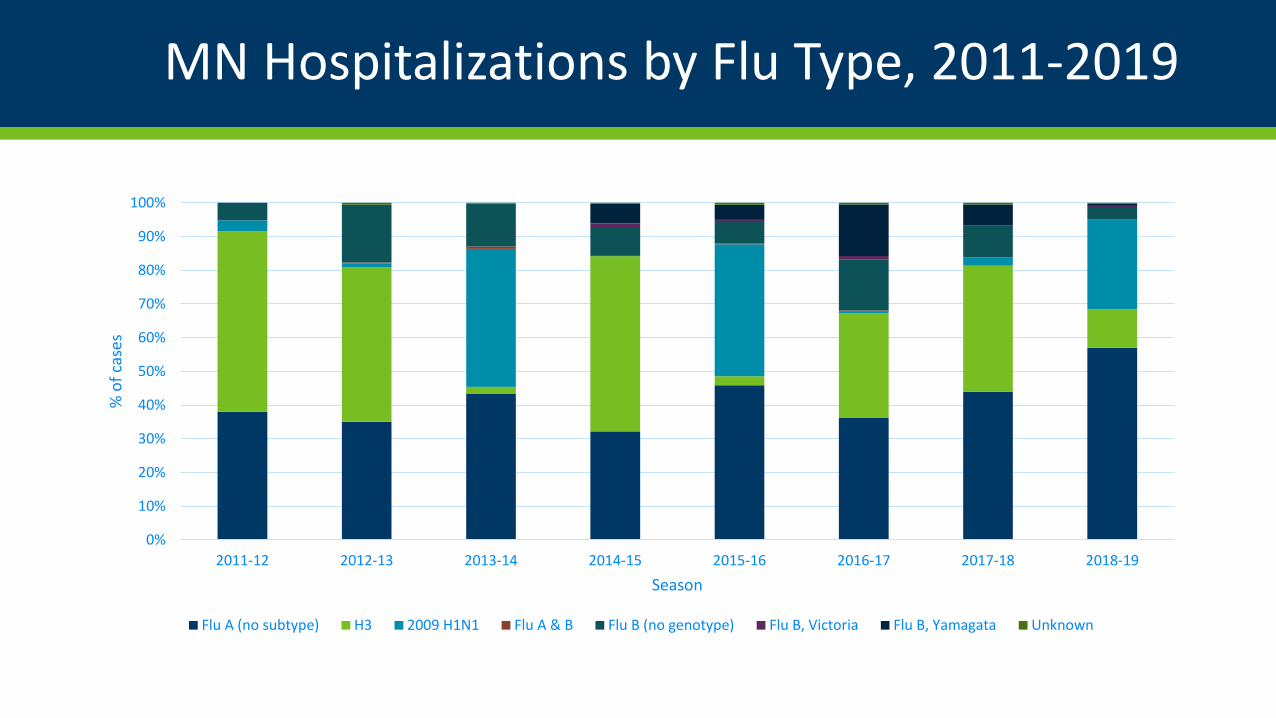
MN Hospitalizations by Flu Type, 2011-2019
0%
10%
20%
30%
40%
50%
60%
70%
80%
90%
100%
2011-12 2012-13 2013-14 2014-15 2015-16 2016-17 2017-18 2018-19
% o
f cas
es
Season
Flu A (no subtype) H3 2009 H1N1 Flu A & B Flu B (no genotype) Flu B, Victoria Flu B, Yamagata Unknown
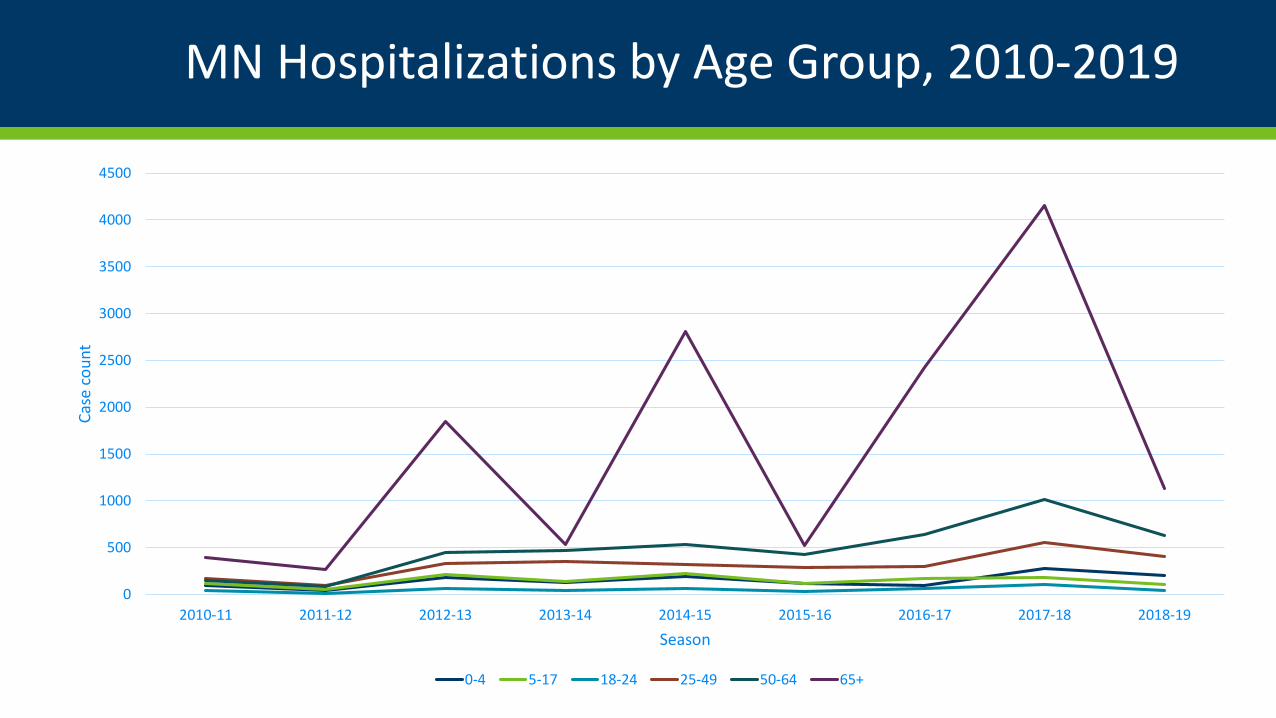
MN Hospitalizations by Age Group, 2010-2019
0
500
1000
1500
2000
2500
3000
3500
4000
4500
2010-11 2011-12 2012-13 2013-14 2014-15 2015-16 2016-17 2017-18 2018-19
Case
cou
nt
Season
0-4 5-17 18-24 25-49 50-64 65+
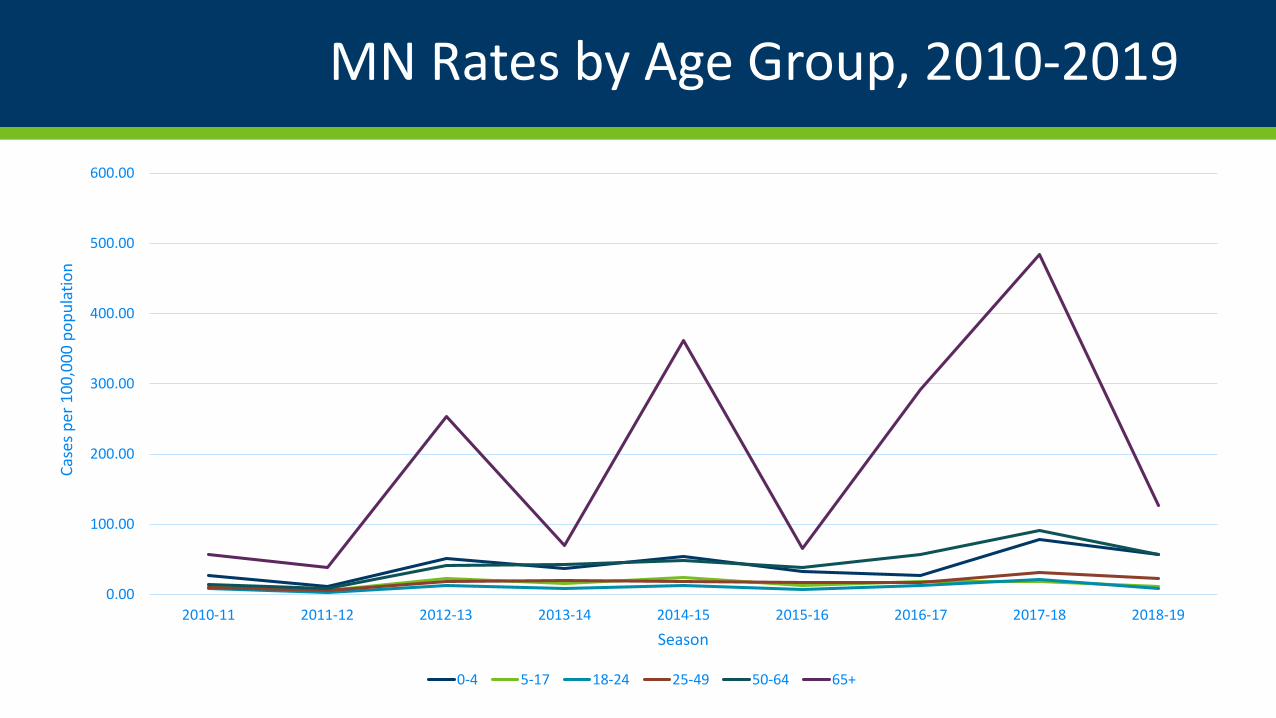
MN Rates by Age Group, 2010-2019
0.00
100.00
200.00
300.00
400.00
500.00
600.00
2010-11 2011-12 2012-13 2013-14 2014-15 2015-16 2016-17 2017-18 2018-19
Case
s per
100
,000
pop
ulat
ion
Season
0-4 5-17 18-24 25-49 50-64 65+
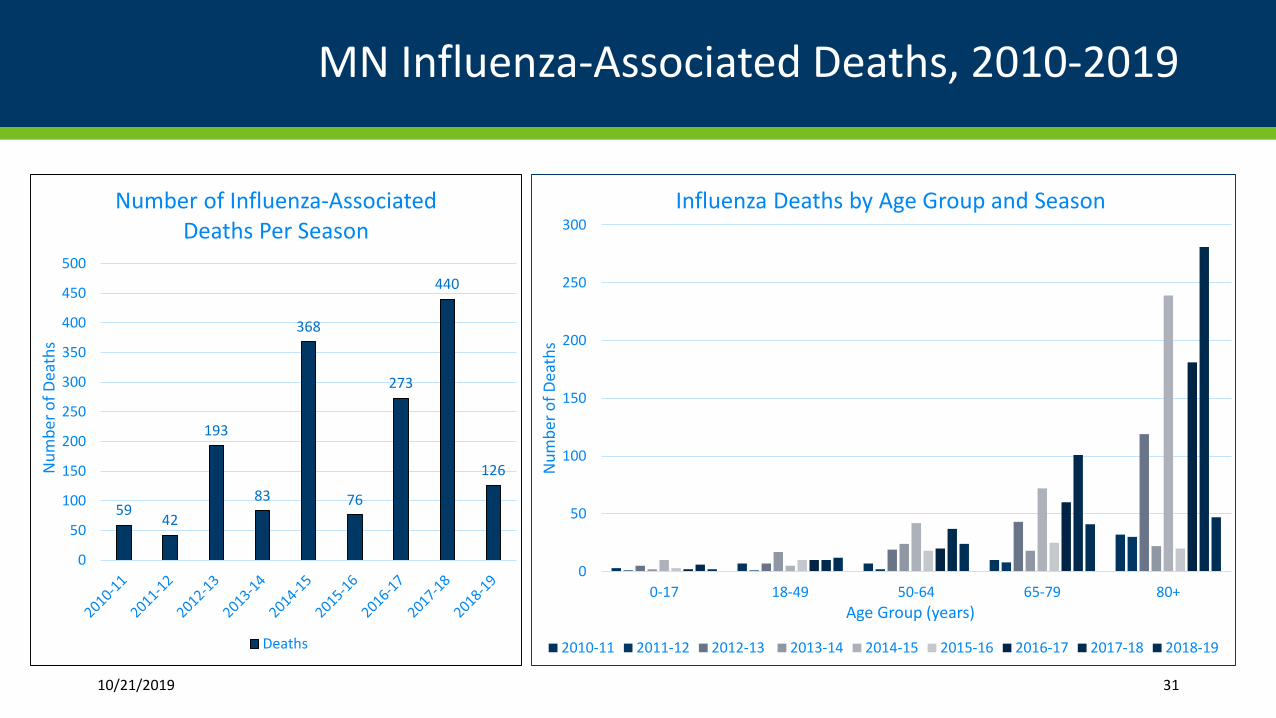
MN Influenza-Associated Deaths, 2010-2019
59 42
193
83
368
76
273
440
126
0
50
100
150
200
250
300
350
400
450
500
Num
ber o
f Dea
ths
Number of Influenza-Associated Deaths Per Season
Deaths
10/21/2019 31
0
50
100
150
200
250
300
0-17 18-49 50-64 65-79 80+
Num
ber o
f Dea
ths
Age Group (years)
Influenza Deaths by Age Group and Season
2010-11 2011-12 2012-13 2013-14 2014-15 2015-16 2016-17 2017-18 2018-19
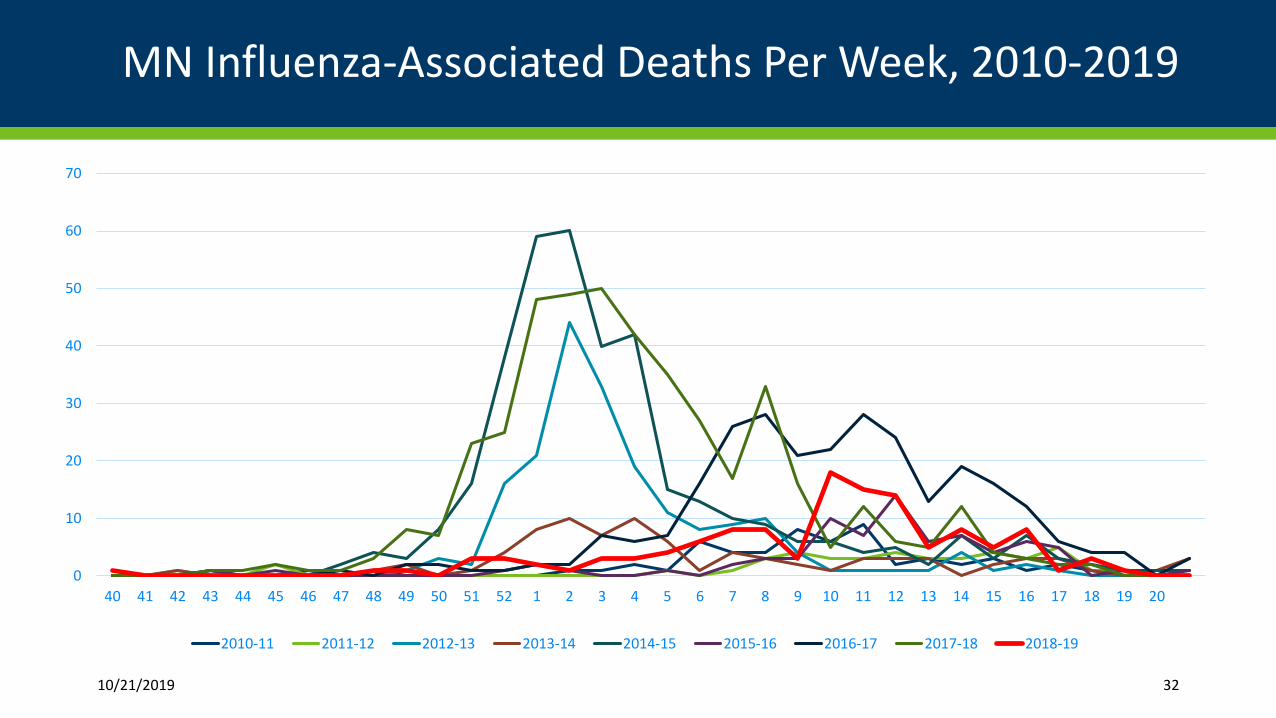
MN Influenza-Associated Deaths Per Week, 2010-2019
10/21/2019 32
0
10
20
30
40
50
60
70
40 41 42 43 44 45 46 47 48 49 50 51 52 1 2 3 4 5 6 7 8 9 10 11 12 13 14 15 16 17 18 19 20
2010-11 2011-12 2012-13 2013-14 2014-15 2015-16 2016-17 2017-18 2018-19

Questions?
33