Ministry of Natural Resources State of the Aggregate ... · Ministry of Natural Resources State of...
195
Ministry of Natural Resources State of the Aggregate Resource in Ontario Study Paper 3 – The Value of Aggregates
-
Upload
nguyenkhanh -
Category
Documents
-
view
237 -
download
0
Transcript of Ministry of Natural Resources State of the Aggregate ... · Ministry of Natural Resources State of...

Ministry of Natural Resources
State of the Aggregate Resource in Ontario Study Paper 3 – The Value of Aggregates

MNR Number 52656 ISBN 978-1-4435-3795-7 2010, Queen’s Printer for Ontario

Prepared by:
AECOM Canada Ltd.
300 – 300 Town Centre Boulevard, Markham, ON, Canada L3R 5Z6
T 905.477.8400 F 905.477.1456 www.aecom.com
Project Number:
112870/60119329
Date:
December 18, 2009
Ministry of Natural Resources
State of the Aggregate Resource in Ontario Study Paper 3 – The Value of Aggregates
FINAL REPORT


(60119329_mnr_ final_dec 19 2009.docx)
Statement of Qualifications and Limitations The attached Report (the “Report”) has been prepared by AECOM Canada Ltd. (“Consultant”) for the benefit of the client (“Client”) in accordance with the agreement between Consultant and Client, including the scope of work detailed therein (the “Agreement”). The information, data, recommendations and conclusions contained in the Report:
are subject to the scope, schedule, and other constraints and limitations in the Agreement and the qualifications contained in the Report (the “Limitations”)
represent Consultant‟s professional judgement in light of the Limitations and industry standards for the preparation of similar reports
may be based on information provided to Consultant which has not been independently verified
have not been updated since the date of issuance of the Report and their accuracy is limited to the time period and circumstances in which they were collected, processed, made or issued
must be read as a whole and sections thereof should not be read out of such context
were prepared for the specific purposes described in the Report and the Agreement
in the case of subsurface, environmental or geotechnical conditions, may be based on limited testing and on the assumption that such conditions are uniform and not variable either geographically or over time
Unless expressly stated to the contrary in the Report or the Agreement, Consultant:
shall not be responsible for any events or circumstances that may have occurred since the date on which the Report was prepared or for any inaccuracies contained in information that was provided to Consultant
agrees that the Report represents its professional judgement as described above for the specific purpose described in the Report and the Agreement, but Consultant makes no other representations with respect to the Report or any part thereof
in the case of subsurface, environmental or geotechnical conditions, is not responsible for variability in such conditions geographically or over time
Any use of this Report is subject to this Statement of Qualifications and Limitations. Any damages arising from improper use of the Report or parts thereof shall be borne by the party making such use. This Statement of Qualifications and Limitations is attached to and forms part of the Report.


AECOM
2 – 512 Woolwich Street 519 763 7783 tel
Guelph, ON, Canada N1H 3X7 519 763 1668 fax
www.aecom.com
Letter Of Trans_FINAL_Dec 18.Docx
December 18, 2009
Brian Hollingsworth
Aggregate and Petroleum Resources Section, 5th Floor South Tower
Ontario Ministry of Natural Resources
300 Water St.
P.O. Box 7000
Peterborough ON K9J 8M5
Dear Brian Hollingsworth:
Project No: 112870/60119329
Regarding: SAROS Paper 3 – The Value of Aggregates Draft Final Report
Please find attached the final report of the SAROS Paper 3 – The Value of Aggregates. We are
providing four printed copies of our report and we have made the report available electronically to the
MNR.
Please don’t hesitate to contact me with any questions or if further clarification is required. This has
been a highly challenging and stimulating assignment, and we thank you for the opportunity to have
worked on this project.
Sincerely,
AECOM Canada Ltd.
JME Maxwell MBA, PMP
JM:lb Encl.


(60119329_mnr_ final_dec 19 2009.docx)
Distribution List
# of Copies
Association / Company Name PDF Hard Copy
5 Ministry of Natural Resources 1 4
1 AECOM Canada 1 1


(60119329_mnr_ final_dec 19 2009.docx)
Signature Page
Report Prepared By: Report Reviewed By:
Andy Keir, M.Sc. (Econ), MCIP, RPP JME Maxwell, MBA, PMP


(60119329_mnr_ final_dec 19 2009.docx) - i -
Glossary Aggregate - The Ontario Aggregate Resources Act (ARA) and Regulation 244/97 (1990),
defines aggregates as gravel, sand, clay, earth, shale, stone, limestone, dolostone, sandstone, marble, granite, rock or other prescribed material Agriculture Land Capability Class Descriptions (Agriculture and Agri-Food Canada,
2008) include -
Class 1 - Soils in this class have no significant limitations in use for crops;
Class 2 - Soils in this class have moderate limitations that restrict the range of
crops or require moderate conservation practices;
Class 3 - Soils in this class have moderately severe limitations that restrict the
range of crops or require special conservation practices;
Class 4 - Soils in this class have severe limitations that restrict the range of crops or
require special conservation practices;
Class 5 - Soils in this class gave very severe limitations that restrict their capability
in producing perennial forage crops, and improvement practices are feasible;
Class 6 - Soils in this class are capable only of producing perennial forage crops,
and improvement practices are not feasible;
Class 7 - Soils in this class have no capacity for arable culture or permanent
pasture; and
Class 0 - Organic Soils (not placed in capability classes).
ANSI – Area of Natural and Scientific Interests. Biodiversity - defined by the Convention on Biological Diversity as “the variability among living organisms from all sources including, inter alia, terrestrial, marine and other aquatic ecosystems and the ecological complexes of which they are part; this includes diversity within species, between species and of ecosystems” (United Nations 1992:Article 2). CPCA – Canadian Portland Cement Association.
(60119329_mnr_ final_dec 19 2009.docx) - ii -
Direct Effects - Initial changes in employment, income and output resulting from production spending in a subject sector. Downstream Effects – Effects in sectors that purchase goods and services from a subject sector where initial production spending took place. Economic Outputs – Includes Gross Domestic Product (GDP), Labour Income, Full Time Equivalent (FTE) jobs and Gross Output. Ecosystem Goods and Services – represent the benefits human populations derive (such as food or waste assimilation), directly or indirectly, from ecosystem functions. Ecosystem Services – the benefits people obtain from ecosystems. They are subdivided in to five categories:
Supporting Service – provide the basic ingredients that sustain all other
ecosystem services;
Provisioning Services – production of food, fiber, energy, genetic resources;
Regulating Services – Regulation of climate, air, water quality, land stability,
waste, pests, pollination;
Cultural Services – Research, education, spiritual, recreational benefits; and
Preserving Services – Guarding against uncertainty through the maintenance of
biodiversity.
Edge Effects – occur naturally and are induced by human involvement by fractionating a natural area into smaller habitats. The fragmented habitats‟ new edges experience a different environment , which can change the species composition, gradients of moisture, sunlight, soil, air temperature, wind speed, etc. FOB (Freight on Board) - Pricing a commodity to include the cost of loading onto freight vehicles at the point of sale but excluding the cost of transporting the goods from the point of sale to the buyer. Full-Time Equivalent (FTE) Jobs - A ratio indicating the level of employment associated with a business where an FTE of 1.0 represents one person working at full time hours and an FTE of 0.5 represents one person working for half of that time.
(60119329_mnr_ final_dec 19 2009.docx) - iii -
Gross Domestic Product (GDP) – The value of all currently produced final goods and services created in a particular time period. This can be considered for the entire economy, or by industry. Gross Output – The total value of sales related to a good or service, including the value intermediary goods or services used in their production. Indirect Effects – Subsequent changes in employment, income, and output in all economic sectors that support sectors that are directly affected. Induced Effects – Subsequent changes in employment, income and output in all economic sectors as a result of income spending by employees in the direct and indirect sectors. Labour Income – the sum of wages and salaries plus supplementary income. Model Shock – a “model shock” is the term used for commissioning Statistics Canada to run their Interprovincial Input / Output model for a specific industry account or commodity group using a specified output amount in a selected province. This calibration and subsequent model run, produce a set of multipliers that show how the specified output impacts the Canadian economy directly and indirectly across all industry sectors and commodity groups . Multipliers - factors of proportionality that measure the effect of one variable on another. For example a $1 million in gross output may result in $1.3 million of GDP. The gross output to GDP multiplier is therefore 1.3. North American Industry Classification (NAIC) – Standard classification system used by national statistical agencies to collect, analyze, code and report upon industry-related activity.
OMB – Ontario Municipal Board. PDE – Perceived Direct Experience. Pit - Land or land under water from which unconsolidated aggregate (usually sand and gravel) is being or has been excavated. Quarry - Land or land under water from which consolidated rock (bedrock) is or has been excavated via blasting. Social Value - the value (positive, negative or neutral) that people assign to their environment (building or place), a product or a service.
(60119329_mnr_ final_dec 19 2009.docx) - iv -
Statistics Canada Input / Output (Stats Can I/O) Models – Portray the economy of a geographic area for a fixed period of time. The models divide all economic activity into sectors. They initially calculate the effect of spending to produce one dollar‟s worth of output in a subject economic sector. Subsequently, they calculate the “rippled” effects of this first expenditure in all other sectors of the economy that support the subject sector. Taxes – the taxes revered to in this document include the following:
Federal Federal trading profits on lottery and race tracks Federal gas tax Federal duty tax Federal air tax GST
Provincial Provincial gallon tax Provincial trading profits Provincial gas tax Provincial amusement tax P.S.T H.S.T
Municipal Municipal amusement tax M.S.T
TOARC – TOARC was incorporated in 1997 to act as trustee of the Aggregate Resources Trust, a trust created under the authority of the Aggregate Resources Act and pursuant to a trust indenture between the Corporation and the Minister of Natural Resources for the Province of Ontario.
TOARC has assumed, in the public interest, the responsibilities provided for in an indenture between the Minister of Natural Resources and the Corporation as of the 27th day of June 1997. Those responsibilities include the collection and disbursement of aggregate fees, the rehabilitation of abandoned pits and quarries, the rehabilitation of sites where licences or permits have been revoked, the collection and publication of production statistics and other information and the education and training of those in or interested in the aggregate industry.
Upstream Effects – Effects in sectors that supply goods and services to a subject sector where initial production spending took place.
(60119329_mnr_ final_dec 19 2009.docx) - v -
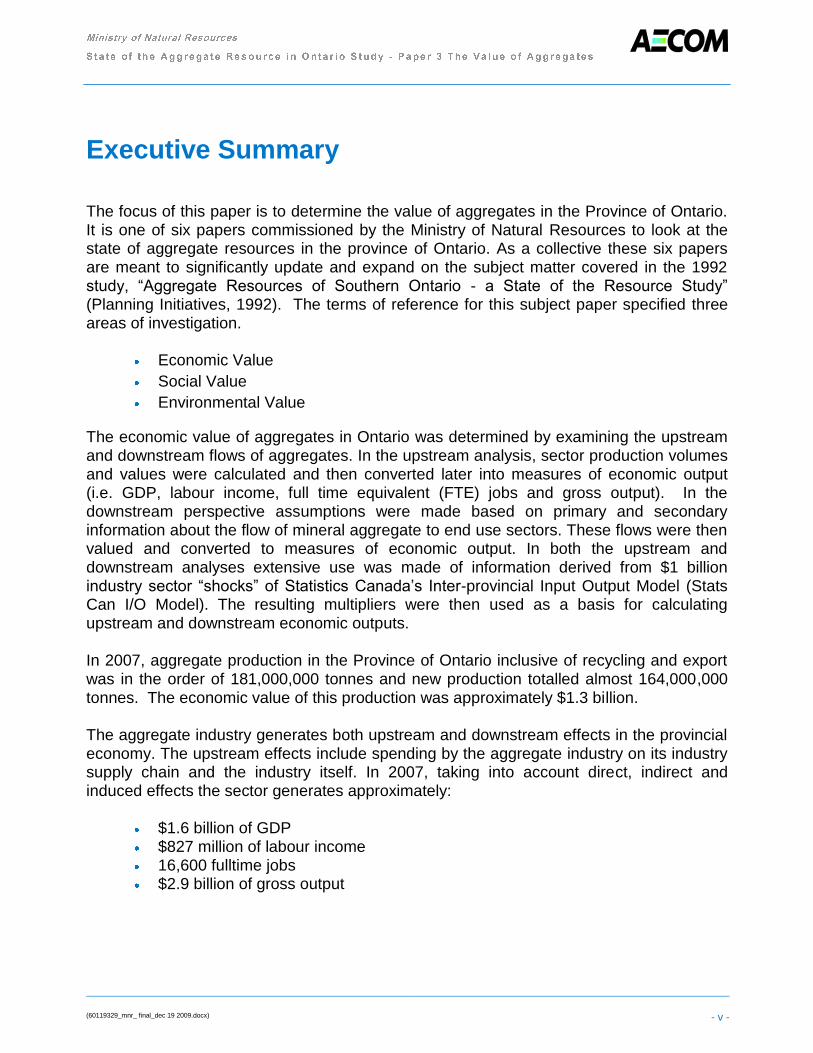
Executive Summary The focus of this paper is to determine the value of aggregates in the Province of Ontario. It is one of six papers commissioned by the Ministry of Natural Resources to look at the state of aggregate resources in the province of Ontario. As a collective these six papers are meant to significantly update and expand on the subject matter covered in the 1992 study, “Aggregate Resources of Southern Ontario - a State of the Resource Study” (Planning Initiatives, 1992). The terms of reference for this subject paper specified three areas of investigation.
Economic Value
Social Value
Environmental Value
The economic value of aggregates in Ontario was determined by examining the upstream and downstream flows of aggregates. In the upstream analysis, sector production volumes and values were calculated and then converted later into measures of economic output (i.e. GDP, labour income, full time equivalent (FTE) jobs and gross output). In the downstream perspective assumptions were made based on primary and secondary information about the flow of mineral aggregate to end use sectors. These flows were then valued and converted to measures of economic output. In both the upstream and downstream analyses extensive use was made of information derived from $1 billion industry sector “shocks” of Statistics Canada‟s Inter-provincial Input Output Model (Stats Can I/O Model). The resulting multipliers were then used as a basis for calculating upstream and downstream economic outputs. In 2007, aggregate production in the Province of Ontario inclusive of recycling and export was in the order of 181,000,000 tonnes and new production totalled almost 164,000,000
tonnes. The economic value of this production was approximately $1.3 billion. The aggregate industry generates both upstream and downstream effects in the provincial economy. The upstream effects include spending by the aggregate industry on its industry supply chain and the industry itself. In 2007, taking into account direct, indirect and induced effects the sector generates approximately:
$1.6 billion of GDP $827 million of labour income 16,600 fulltime jobs $2.9 billion of gross output

(60119329_mnr_ final_dec 19 2009.docx) - vi -
The downstream economic effects include economic effects in sectors that purchase goods and services from a subject sector where initial production spending took place. The 2007 aggregate production volumes were tracked downstream to 16 end use sectors. These sectors were subsequently grouped into three categories: Cement and Concrete, Other Products and Construction.
Approximately 21% of the provincial aggregate production, by value, flows to industries in the cement and concrete category and 57% to various forms of construction. The remaining 22% is destined for a suite of industry sectors in the Other Products category. The economic output attributable to aggregate production in the downstream sectors is:
$1.6 billion of GDP $940 million of labour income 18,300 fulltime jobs $3.2 billion of gross output
In terms of the whole industry categories themselves, the majority of the value add (GDP) falls to construction (59%), The cement and concrete category accounts for 22% and the other products category 19%. The downstream industry categories and sectors referred to in this study generate the following economic outputs:
$22 billion of GDP $13 billion of labour income 245,000 fulltime jobs $44.7 billion of gross output
This paper concluded that aggregate plays an important role in the Ontario economy. Although it is a low price commodity, its use is in a very high volume. It is an essential ingredient for the preceding end use industry categories. And these categories in turn play a large role in the provincial economy.
Aggregate moves to a wide variety of end users and it is an essential ingredient in the industry sectors associated with construction and manufacturing. Although it is not the dominant input in most sectors in terms of value, it is nevertheless an essential input and one for which there is no obvious substitute at the present time. To further examine the economic impacts of aggregates, case studies were identified by examining the list of 25 infrastructure projects in Ontario with the largest cost or value between 2005 and 2009. Of the 25 largest infrastructure projects the vast majority were energy and hospital/healthcare projects. Almost half of these projects took place in the Greater Toronto Area.

(60119329_mnr_ final_dec 19 2009.docx) - vii -
A short list of five infrastructure projects was selected for case studies. Once identified, project information was gathered through unstructured interviews with relevant Project Managers and other Project Contacts. These case studies were selected through a qualitative assessment to find projects that would be aggregate intensive, represent a wide range in project sizes, project types and cover a wide geographic area. Through the assessment of the value of aggregates in five case studies selected we can conclude that the value of aggregates in infrastructure projects is a relatively small component of the total project. For each of the five case studies that were looked at, all of the projects had a readily available local source of aggregate to be used in the project. Although the value of aggregates is a relatively small component of project value, it is a product that does not have many readily available substitutes and without aggregates available it is unclear how these major projects would proceed. The social value associated with aggregates and aggregate extraction was examined to facilitate a better understanding of its role in society in terms of the level of importance and costs and benefits. In this area of the study, two main approaches were used to understand how Ontarians value the built environment and the social costs and benefits associated with aggregate extraction. The first approach was through Public Attitide Research that was administered by telephone to 1,420 Ontario residents. The second approach was a content analysis of recorded public comments related to aggregate extraction from Ontario Municipal Board (OMB) hearings and from 31MNR licence applications. These 31 licence applications were supplied by the MNR to represent the most recent licence applications and were also used in the Environmental Value section of this paper. Approximately nine cases from the Niagara Escarpment Commission (NEC) were also reviewed, though not included in the content analysis. The social costs and benefits of aggregate extraction were assessed through the telephone surveys of Ontario residents. From the perspective of community well-being, respondents in general do not rank development and infrastructure projects highly among
the other things that they value about their community. However, when respondents were asked to rate the importance of various development and infrastructure projects, many were ranked with high importance. This leads us to conclude that respondents did not seem willing to trade the most important things that they value about their community for development and infrastructure projects. Respondents that live near a pit or quarry were more likely to name nuisance effects as a social cost of aggregate extraction. However, respondents that live near an aggregate truck transportation route were more likely to state economic aspects of aggregate extraction as a social benefit. Based on the findings from the geographical variation study, we can conclude that respondents who live in an urban area (such as Area 4 – GTA) rate parks and trails as an important aspect of their community. Also, respondents from the GTA highlighted new institutional buildings as important. Respondents who live in the far northeast and northwest areas of the Canadian Portland Cement Association geographic

(60119329_mnr_ final_dec 19 2009.docx) - viii -
areas are most likely to name development and infrastructure projects as a benefit of aggregate extraction. As a result of the content analyses from a combination of the MNR (31 cases) and OMB data (76 cases), it is clear that the three most frequently reported public complaints are regarding noise pollution, truck traffic and volume and air pollution and dust. These themes were also common among the case files from the NEC, though the NEC files were not coded and included in the content analysis. The content analysis represents public concerns from a specific group of people who are directly affected by the aggregate activities. However, when surveying a more statistically significant representation of the Ontario population (through the Public Attitude Research), environmental impacts emerge as the main costs to aggregate extraction. Therefore, the results from the different approaches of data collection are varied. Finally, the base knowledge of the aggregate industry seems to be varied and respondents are not very familiar with the aggregate industry. This lack of familiarity indicates that the aggregate industry is not “top of mind” for a statistically significant representation of the Ontario population and there are opportunities to build awareness and education amongst the public. The environmental value of aggregates was also evaluated in this paper. The importance of aggregates in achieving environmental objectives are often overlooked when contrasted to the more intuitive assessments associated with the removals of forest and wildlife habitat. A careful analysis of the less visible, but equally important, environmental uses of aggregate is important in order to balance the scale and intensity of environmental effects and to determine the net environmental value of the resource in the context of other landscape resources. This paper presents a comprehensive list of the ecosystem services provided by the use of aggregates. This is illustrated in a matrix that details the nature of the aggregate, use and
the environmental benefit accrued to catalogue the ecosystem services affected by the subject 31 licences, initial impacts, rehabilitation targets and net impacts to environmental value over a specified time frame. The ecosystem services analyzed were examined at the level of primary services, that is, what the aggregate was used for, rather than secondary services enabled (i.e., buildings, roads, etc.). The matrix was broken down into two categories: Processes, in which the products of aggregate extraction are used and Spatial, where the extraction itself contributes ecosystem services as a consequence of the ultimate rehabilitation of extraction sites and when the aggregates are used for the creation of fixed structures.
(60119329_mnr_ final_dec 19 2009.docx) - ix -
Under the Processes heading the majority of the ecosystem services were categorized as
regulating. This can be explained by the fact that the practices/procedures that are used by Human Land Use Change; Water Quality Treatment; Removal of Anthropogenic Pollutants; Uses in Mines; Landfills and Waste Disposals; and Maintenance of Biodiversity are used to regulate ecosystem processes. The majority of the ecosystem services provided by under the Spatial headings were cultural.
The bulk of the negative effects of aggregates on eco-services fall under either regulating (likely due to the associated bi-products of aggregate processing) and preserving services (likely due to the permanent human impact that buildings, roads, dams, etc. have on the developed landscape). Of the 31 licences analysed, it was concluded that the sites were largely agricultural and environmental features were almost entirely preserved indicating that the legislation, with respect to natural environment, is having an effect on the outcomes. A small amount of good quality habitat was affected due to quarrying. If habitat was affected, on balance it was replaced through rehabilitation efforts. Across the sample of licences, the most significant losses were agricultural land, balanced between prime agricultural lands (Classes 1, 2 and 3 soils) and other agricultural lands.

(60119329_mnr_ final_dec 19 2009.docx)
Table of Contents Statement of Qualifications and Limitations Letter of Transmittal Distribution List Glossary Executive Summary
p a g e
1.1 Objectives of the Study ................................................................................................. 1
1.2 Scope of the Study ....................................................................................................... 2
1.2.1 Economic Analysis .................................................................................. 4
1.2.2 Case Studies ........................................................................................... 4
1.2.3 Social Value............................................................................................. 5
1.2.4 Environmental Value ............................................................................... 5
1.3 Study Methodology ....................................................................................................... 6
1.3.1 Economic Analysis .................................................................................. 6 1.3.1.1 Upstream – Production Tonnage ............................................................................ 7 1.3.1.2 Upstream – Production Value ................................................................................. 8 1.3.1.3 Upstream – Sector Economic Outputs and CPCA Geographic Area
Economic Outputs ................................................................................................... 9 1.3.1.4 Downstream – Sector Flow ................................................................................... 10 1.3.1.5 Downstream - Sector Contributions ...................................................................... 12 1.3.1.6 Downstream – Economic Outputs......................................................................... 12
1.3.2 Case Studies ......................................................................................... 13
1.3.3 Social Value........................................................................................... 13 1.3.3.1 Overview ............................................................................................................... 13 1.3.3.2 Telephone Survey – Public Attitude Research...................................................... 13 1.3.3.3 Content Analyses .................................................................................................. 15
1.3.4 Environmental Value ............................................................................. 16 1.3.4.1 Environmental Uses of Aggregates....................................................................... 16 1.3.4.2 Environmental Impacts of Aggregate Extraction ................................................... 17 1.3.4.3 Limitations of Current Aggregate and Ecosystem Service Valuation
Research ............................................................................................................... 18
2.1 Economic Analysis – Upstream and Downstream Value ............................................. 19
2.1.1 Upstream Value ..................................................................................... 19 2.1.1.1 Overall Aggregate Production ............................................................................... 19 2.1.1.2 New Production Tonnages and Value................................................................... 20 2.1.1.3 Economic Outputs of New Production .................................................................. 23 2.1.1.4 Economic Outputs of new Production by CPCA Geographic Area ....................... 27

(60119329_mnr_ final_dec 19 2009.docx)
2.1.2 Downstream Value ................................................................................ 29 2.1.2.1 Downstream Flows ................................................................................................ 29 2.1.2.2 Economic Outputs of Downstream Aggregate Consumption ................................ 32
2.2 Case Studies .............................................................................................................. 37
2.2.1.1 Spadina Subway Extension .................................................................................. 43 2.2.1.2 Niagara Tunnel Project ......................................................................................... 45 2.2.1.3 Woodstock General Hospital ................................................................................. 47 2.2.1.4 North Bay Regional Health Centre ........................................................................ 49 2.2.1.5 Wolfe Island Wind Project ..................................................................................... 51
2.3 Social Value ................................................................................................................ 53
2.3.1 Perceived Direct Experience (PDE) ....................................................... 53 2.3.1.1 Assessment of Perceived Direct Experience (PDE) ............................................. 53 2.3.1.2 Subjectivity in Perceived Direct Experience (PDE) ............................................... 54
2.3.2 Community-Well Being .......................................................................... 65
2.3.3 Knowledge of the Aggregate Industry .................................................... 67
2.3.4 Benefits ................................................................................................. 70
2.3.5 Costs ..................................................................................................... 73 2.3.5.1 Results of the Telephone Survey .......................................................................... 73 2.3.5.2 Results of the Content Analyses of MNR and OMB Data ..................................... 75 2.3.5.3 Results from the NEC Case Files ......................................................................... 77
2.3.6 PDE Influence on Social Values of Aggregates ..................................... 78 2.3.6.1 Respondents that Live near a Pit or Quarry .......................................................... 78 2.3.6.2 Respondents that Live near an Aggregate Truck Transportation Route ............... 78 2.3.6.3 Respondents that do not live near a Pit or Quarry ................................................ 78 2.3.6.4 Respondents that do not live near an Aggregate Truck Transportation
Route ..................................................................................................................... 78
2.3.7 Geographical Variation in Social Values of Aggregates ........................ 79 2.3.7.1 Area 1 – Southwest ............................................................................................... 79 2.3.7.2 Area 2 – Peninsula ................................................................................................ 79 2.3.7.3 Area 3 - West Central ............................................................................................ 79 2.3.7.4 Area 4 – GTA ........................................................................................................ 79 2.3.7.5 Area 5 - East Central ............................................................................................. 80 2.3.7.6 Area 6 – East ........................................................................................................ 80 2.3.7.7 Area 7 – Northeast ................................................................................................ 80 2.3.7.8 Area 8 - Northwest ................................................................................................ 81
2.4 Environmental Benefits ............................................................................................... 84
2.4.1 Use and Environmental Benefit of Aggregate Matrix ............................. 85
2.4.2 Processes .............................................................................................. 86 2.4.2.1 Landscape Restoration and/or Rehabilitation ....................................................... 86 2.4.2.2 Water Quality Treatment ....................................................................................... 88 2.4.2.3 Removal of Anthropogenic Pollutants ................................................................... 89 2.4.2.4 Use in Mine Sites .................................................................................................. 90 2.4.2.5 Landfills and Waste Disposal ................................................................................ 91 2.4.2.6 Maintenance of Biodiversity .................................................................................. 93

(60119329_mnr_ final_dec 19 2009.docx)
2.4.3 Spatial Benefits of Aggregate Extraction ............................................... 93 2.4.3.1 Construction .......................................................................................................... 93 2.4.3.2 Rehabilitation Uses Post-Quarry Operations ........................................................ 97
2.5 Environmental Impacts of Aggregate Extraction .......................................................... 98
2.6 Environmental Costs ................................................................................................. 103
2.6.1 Processes ............................................................................................ 103 2.6.1.1 Stormwater Control ............................................................................................. 103 2.6.1.2 Removal of Anthropogenic Pollutants ................................................................. 104
2.6.2 Spatial Costs of Aggregate Extraction ................................................. 104 2.6.2.1 Construction ........................................................................................................ 104 2.6.2.2 Agriculture ........................................................................................................... 106
3.1 State of the Aggregate Resource in Ontario .............................................................. 107
3.1.1 Economic Analysis – Upstream and Downstream Flows ..................... 107
3.1.2 Case Studies ....................................................................................... 109
3.1.3 Social Value......................................................................................... 109
3.1.4 Environmental Value ........................................................................... 111
3.1.5 The Value of Aggregates in Ontario .................................................... 112
3.2 Recommendations .................................................................................................... 113
3.2.1 Economic Analysis – Upstream and Downstream Flows ..................... 113
3.2.2 Case Studies ....................................................................................... 114
3.2.3 Social Value......................................................................................... 114
3.2.4 Environmental Value ........................................................................... 114
Figure 1-1 Canadian Portland Cement Association (CPCA) Geographic Areas ....................................... 3
Figure 1-2 Aggregate Upstream and Downstream Flows .......................................................................... 4
Figure 1-3 Economic Analysis – Overview of Methodology ....................................................................... 6
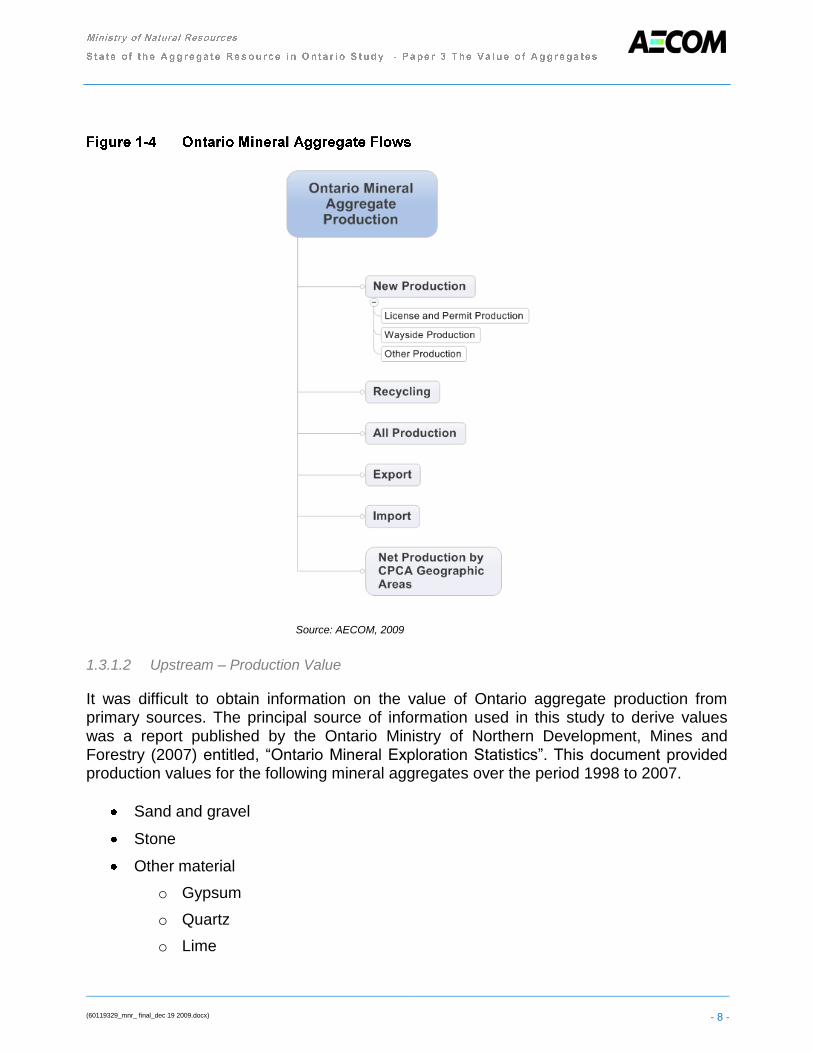
Figure 1-4 Ontario Mineral Aggregate Flows ............................................................................................. 8
Figure 1-5 Upstream Economic Output Model ......................................................................................... 10
Figure 1-6 Grouped Downstream Sectors ............................................................................................... 11
Figure 1-7 Downstream Economic Outputs ............................................................................................. 12
Figure 2-1 Overall Aggregate Production, 1998-2007 ............................................................................. 19
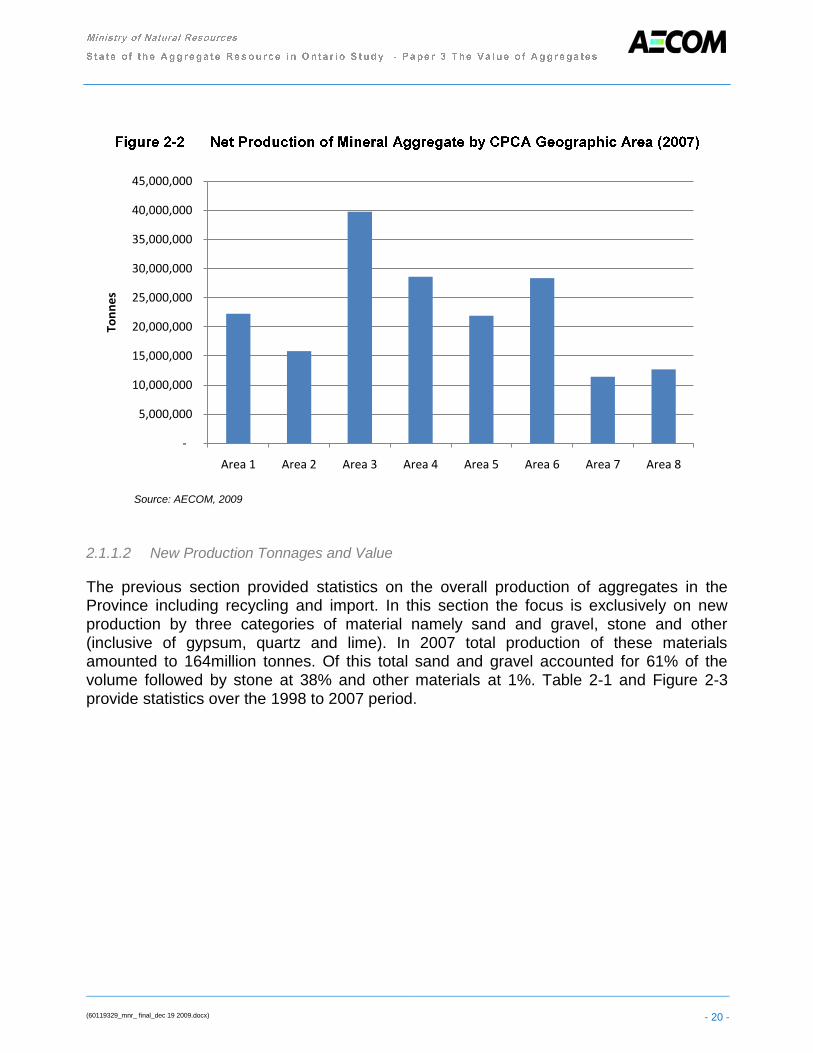
Figure 2-2 Net Production of Mineral Aggregate by CPCA Geographic Area (2007) .............................. 20
Figure 2-3 New Aggregate Production by Material Category (1998 - 2007) ........................................... 21
Figure 2-5 Upstream Economic Outputs - GDP, Labour Income and Gross Output (2007) ................... 24
Figure 2-6 Upstream Tax Outputs (2007) ................................................................................................ 25
Figure 2-7 Allocation of Aggregate Production Value by Material (2007) ................................................ 32

(60119329_mnr_ final_dec 19 2009.docx)
Figure 2-8 FTE Job Outputs to Aggregates Consumption in Downstream Industry Categories ............. 33
Figure 2-9 Economic Outputs of Aggregate Consumption in Downstream Industry Categories ............. 34
Figure 2-10 Jobs Created by Downstream Industry Categories ................................................................ 35
Figure 2-11 Economic Outputs from Downstream Industry Categories .................................................... 36
Figure 2-12 Contributions of Aggregate to Overall Economic Output of Downstream Industry
Sectors .................................................................................................................................... 37
Figure 2-13 25 Large Infrastructure Projects in Ontario............................................................................. 39
Figure 2-14 Five Case Studies in Ontario .................................................................................................. 42
Figure 2-15 Map of Spadina Subway Extension ........................................................................................ 43
Figure 2-16 Drill Used on Niagara Tunnel Project ..................................................................................... 45
Figure 2-17 New Woodstock General Hospital .......................................................................................... 47
Figure 2-18 North Bay Regional Health Center (Under Construction)....................................................... 49
Figure 2-19 Wolfe Island Wind Project in Spring ....................................................................................... 51
Figure 2-20 Comparison of Perceived and Actual Proximity to a Pit or Quarry ......................................... 55
Figure 2-21 Respondents‟ Perceived Distance to a Pit or Quarry - Area 1 ............................................... 57
Figure 2-22 Respondents‟ Perceived Distance to a Pit or Quarry - Area 2 ............................................... 58
Figure 2-23 Respondents‟ Perceived Distance to a Pit or Quarry - Area 3 ............................................... 59
Figure 2-24 Respondents‟ Perceived Distance to a Pit or Quarry - Area 4 ............................................... 60
Figure 2-25 Respondents‟ Perceived Distance to a Pit or Quarry - Area 5 ............................................... 61
Figure 2-26 Respondents‟ Perceived Distance to a Pit or Quarry - Area 6 ............................................... 62
Figure 2-27 Respondents‟ Perceived Distance to a Pit or Quarry - Area 7 ............................................... 63
Figure 2-28 Respondents‟ Perceived Distance to a Pit or Quarry - Area 8 ............................................... 64
Figure 2-29 Respondents‟ Community Values, by Major Theme .............................................................. 65
Figure 2-30 Respondents‟ Estimate of Tonnes of Aggregates Consumed Per Person, Per Year
in Ontario ................................................................................................................................ 68
Figure 2-31 Importance of Various Development and Infrastructure Projects ........................................... 70
Figure 2-32 Social Benefits of Aggregate Extraction ................................................................................. 71
Figure 2-33 Main Social Costs of Aggregate Extraction ............................................................................ 73
Figure 2-34 Ten most Frequent Public Comments Regarding Aggregate Applications or
Operations .............................................................................................................................. 76
Figure 2-36 Perceived Social Benefits of Aggregate Extraction by CPCA Geographic Area .................... 83
Figure 2-37 Relative area of natural heritage features before extraction .................................................. 99
Figure 2-38 Relative area of natural heritage features after extraction ................................................... 100
(60119329_mnr_ final_dec 19 2009.docx)
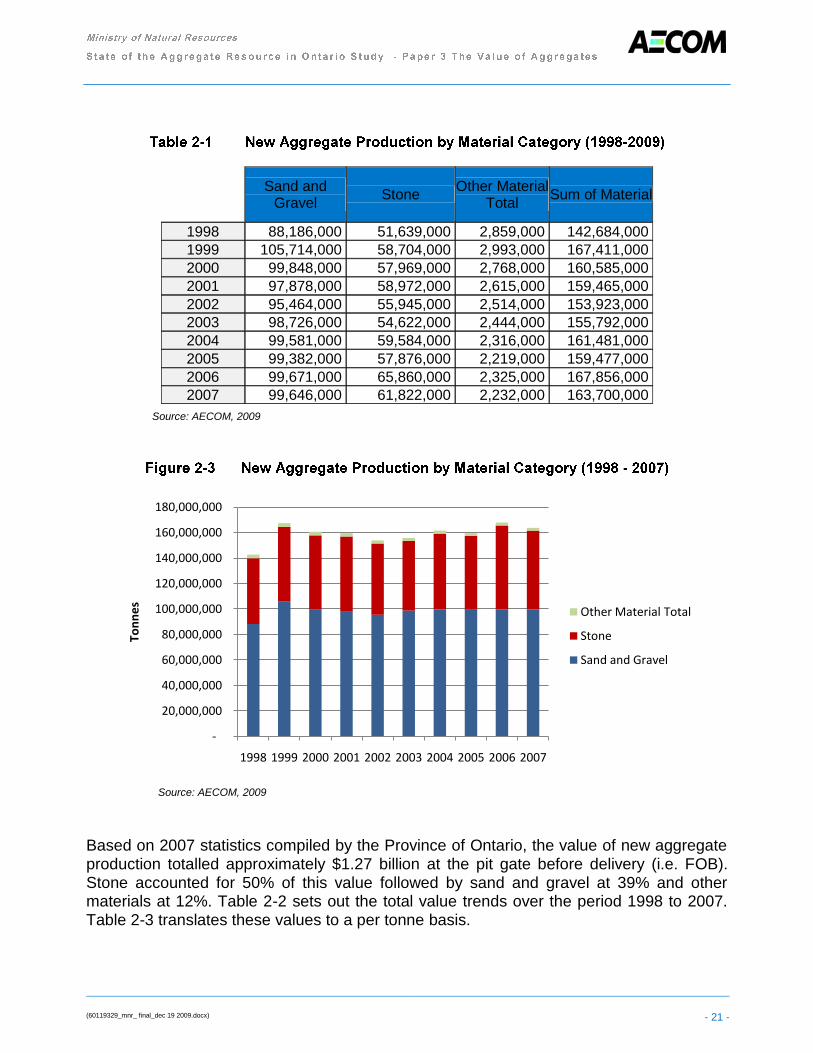
Table 2-1 New Aggregate Production by Material Category (1998-2009) ............................... 21
Table 2-2 Value of Ontario Aggregate Production (1998 - 2007) ............................................ 22
Table 2-3 Per Tonne Value of Aggregate Production (1998 - 2007) ....................................... 22
Table 2-4 Upstream Economic Outputs (2007) ...................................................................... 23
Table 2-5 Upstream Tax Outputs (2007) ................................................................................ 25
Table 2-6 Upstream Economic Outputs per Tonne (2007) ..................................................... 26
Table 2-7 Upstream Tax Outputs per Tonne (2007) ............................................................... 26
Table 2-8 Upstream GDP Outputs by CPCA Areas (2007) ..................................................... 27
Table 2-9 Upstream Labour Income Outputs by CPCA Areas (2007) ..................................... 28
Table 2-10 Upstream FTE Job Outputs by CPCA Areas (2007) ............................................... 28
Table 2-11 Upstream Gross Output by CPCA Areas (2007) ..................................................... 29
Table 2-12 Taxes ..................................................................................................................... 29
Table 2-13 GDP Apportionment of Aggregate by Downstream Industry Categories and
Sectors ................................................................................................................... 30
Table 2-14 Apportionment of Aggregate Production Value by Downstream Industry
Categories and Sectors .......................................................................................... 31
Table 2-15 Economic Outputs of Aggregate Consumption in Downstream Industry
Sectors ................................................................................................................... 33
Table 2-16 Economic Outputs of Downstream Industry Sectors ............................................... 35
Table 2-17 Top 25 Infrastructure Projects in the Province of Ontario 2005 - 2009 .................... 38
Table 2-19 Top 25 Infrastructure Projects in Province of Ontario by CPCA Geographic
Area ....................................................................................................................... 40
Table 2-20 Five Infrastructure Projects Selected for Case Study .............................................. 41
Table 2-21 Contact with the Aggregate Industry ....................................................................... 53
Table 2-23 Respondents‟ Community Values, Detailed Summary ............................................ 66
Table 2-24 Respondents‟ Perception of Aggregate Extraction Sites ......................................... 69
Table 2-25 Ranking of Modes to Transport Aggregates ........................................................... 69
Table 2-26 Main Social Benefits of Stone, Sand & Gravel Extraction ....................................... 72
Table 2-27 Social Costs of Stone, Sand & Gravel Extraction ................................................... 74
Table 2-28 Environmental Changes of Licenced Areas .......................................................... 101
Table 2-29 Licenced Area Classed under the Canada Land Inventory for Agricultural
Use ...................................................................................................................... 102
Table 2-30 Percentage of Licenced Area Classed under the Canada Land Inventory for
Agricultural Use .................................................................................................... 102
Table 3-1 Value of Aggregates as a Percentage of Total Project Value for the Selected
Case Studies ........................................................................................................ 109

(60119329_mnr_ final_dec 19 2009.docx)
A. Intellipulse Report and Telephone Questionnaire
B. Use and Environmental Benefit of Aggregate Matrix

(60119329_mnr_ final_dec 19 2009.docx) - 1 -
The focus of this paper is to determine the value of aggregates in the Province of Ontario. It is one of six papers commissioned by the Ministry of Natural resources to look at the state of aggregate resources in the province of Ontario. As a collective these six papers
are meant to significantly update and expand on the subject matter covered in the 1992 study, “Aggregate Resources of Southern Ontario - a State of the Resource Study” (Planning Initiatives, 1992). The terms of reference for the subject paper specified 3 areas of investigation.
Economic Value Social Value Environmental Value
The principal objectives to be addressed in the Economic Value section were five-fold:
1) Estimate the annual value added of aggregate to the Province of Ontario
2) Estimate the current value of some existing infrastructure recently built or revitalized within the province
3) Determine the employment generated by aggregate production and consumption
4) Determine the key end use industry sectors that consume aggregate and their overall economic value.
5) Determine the contribution value of aggregate to these end use industry sectors. In the Social Value section there were three primary objectives:
1) Determine how the public values the built environment
2) Understand the social cost if elements of the built environment were not present
3) Determine public attitudes with respect to aggregate extraction
The section addressing Environmental Values had two objectives:
1) Provide an overview of the environmental implications of aggregate extraction
2) Determine the environmental costs/impacts of aggregate extraction on the selected features of the natural environment in Ontario.

(60119329_mnr_ final_dec 19 2009.docx) - 2 -
The scope of this study is province-wide. It looks at aggregate production and consumption from a variety of perspectives to assess and draw conclusions on the value of this resource within the province. Where possible, portions of the analysis are presented in terms of the Canadian Portland Cement Association (CPCA) geographic regions (Figure 1-1). This articulation provides a sense of industry scale within different areas of the province. In the discussions that immediately follow, the scope of analysis is discussed is
for each of the study components.

Map Document: (N:\projects\0-aecom\112870\2009\Final\GISSpatial\MXDs\ReportMXDs\112870PortlandCementAreas.mxd)12/15/2009 -- 10:25:52 AM
Area 8Northwest
Area 7Northeast
Area 6EastArea 5
East Central
Area 1Southwest
Area 3West Central
Area 4GTA
Area 2Peninsula
UTM Zone 17N, NAD 83
1:6,500,000
Canadian Portland Cement Association
(CPCA)Geographic Areas
Figure 1-1
Basemapping from Ontario Ministry of Natural Resources
0 100 200 300 40050
Kilometers
Area 1 Area 2 Area 3 Area 4 Area 5 Area 6 Area 7 Area 8Southwest Peninsula West Central GTA East Central East Northeast Northwest
Essex Niagara Bruce Toronto Kawartha Lakes Prescott & Russell Nipissing AlgomaChatham-Kent Brant Grey Peel Peterborough Leeds & Grenville Parry Sound Thunderbay
Lambton Haldimand Simcoe York Haliburton Stormont, Dundas, Timiskaming KenoraElgin Norfolk Dufferin Durham Northumberland & Glenngary Cochrane Rainy River
Middlesex Hamilton Wellington Halton Hastings Frontenac Sudbury DistrictHuron Waterloo Prince Edward Greater Ottawa Greatter SudburyPerth Muskoka Lanark Manitoulin
Oxford RenfrewLennox & Addington
December 2009Project 60119329
This drawing has been prepared for the use of AECOM’s client and may not be relied upon by third parties, except as agreed byAECOM and its client, as required by law or for use bygovernmental reviewing agencies. AECOM accepts no responsibility, and denies any liability whatsoever, to any partythat modifies this drawing without AECOM’s express written consent.
(60119329_mnr_ final_dec 19 2009.docx) - 4 -
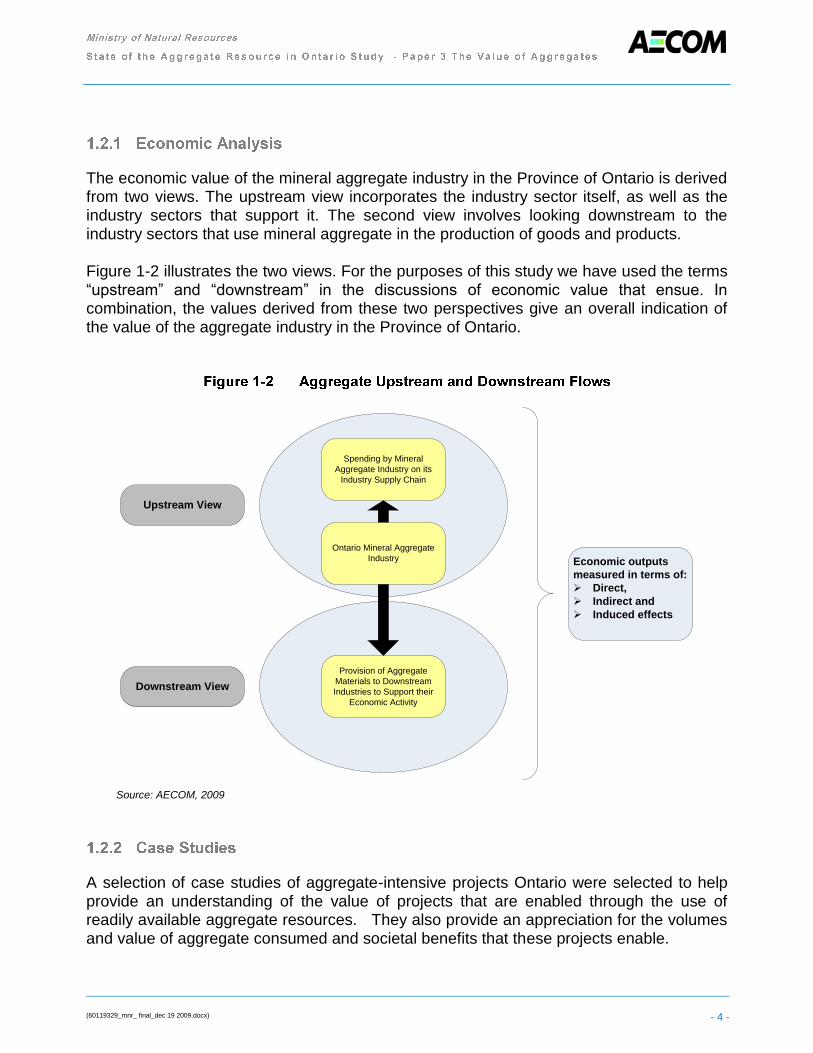
The economic value of the mineral aggregate industry in the Province of Ontario is derived from two views. The upstream view incorporates the industry sector itself, as well as the industry sectors that support it. The second view involves looking downstream to the industry sectors that use mineral aggregate in the production of goods and products. Figure 1-2 illustrates the two views. For the purposes of this study we have used the terms “upstream” and “downstream” in the discussions of economic value that ensue. In combination, the values derived from these two perspectives give an overall indication of the value of the aggregate industry in the Province of Ontario.
Ontario Mineral Aggregate
Industry
Spending by Mineral
Aggregate Industry on its
Industry Supply Chain
Provision of Aggregate
Materials to Downstream
Industries to Support their
Economic Activity
Economic outputs
measured in terms of:
Ø Direct,
Ø Indirect and
Ø Induced effects
Upstream View
Downstream View
Source: AECOM, 2009
A selection of case studies of aggregate-intensive projects Ontario were selected to help provide an understanding of the value of projects that are enabled through the use of readily available aggregate resources. They also provide an appreciation for the volumes and value of aggregate consumed and societal benefits that these projects enable.

(60119329_mnr_ final_dec 19 2009.docx) - 5 -
For the purposes of this study, social value is defined as the value (either positive, negative or neutral) that people assign to their environment (building or place), a product or a service. The purpose of assessing the social value associated with aggregates and aggregate extraction is to facilitate a better understanding of aggregates‟ role in society in terms of the level of importance and their costs and benefits. The social value component of this paper is presented according to three broad areas of interest. These are:
1. The Social Value of Public Places 2. The Social Costs of Not Having Available Resources for Infrastructure and Roads 3. The Social Costs of Aggregate Extraction in Ontario
This report attempts to present a comprehensive list of the ecosystem services provided by the use of aggregates, a matrix that details the nature of the aggregate, the use and the environmental benefit accrued will be provided, and a catalogue of the ecosystem services affected by the target licences, initial impacts, rehabilitation targets and net impacts to environmental value over a specified time frame. The context of this section will provide an overview of the environmental value of aggregates to the Province of Ontario through extraction and downstream use.
(60119329_mnr_ final_dec 19 2009.docx) - 6 -
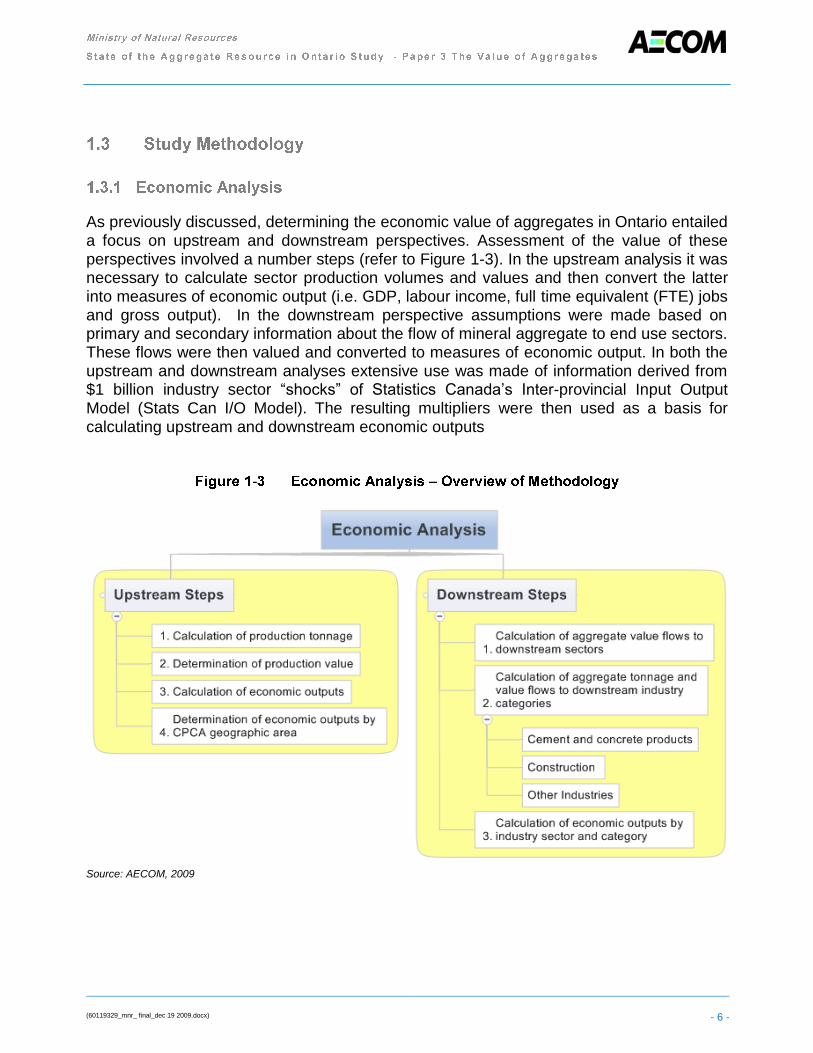
As previously discussed, determining the economic value of aggregates in Ontario entailed a focus on upstream and downstream perspectives. Assessment of the value of these perspectives involved a number steps (refer to Figure 1-3). In the upstream analysis it was necessary to calculate sector production volumes and values and then convert the latter
into measures of economic output (i.e. GDP, labour income, full time equivalent (FTE) jobs and gross output). In the downstream perspective assumptions were made based on primary and secondary information about the flow of mineral aggregate to end use sectors. These flows were then valued and converted to measures of economic output. In both the upstream and downstream analyses extensive use was made of information derived from $1 billion industry sector “shocks” of Statistics Canada‟s Inter-provincial Input Output Model (Stats Can I/O Model). The resulting multipliers were then used as a basis for calculating upstream and downstream economic outputs
Source: AECOM, 2009

(60119329_mnr_ final_dec 19 2009.docx) - 7 -
1.3.1.1 Upstream – Production Tonnage
The determination of mineral aggregate production in Ontario was derived by review and tabulation of information from the annual “Mineral Aggregates in Ontario” reports produced by The Ontario Aggregates Resources Corporation (1998 through 2007). In order to facilitate the analysis a model was developed to enable compilation and manipulation of the production information. The model configuration is illustrated in the figure that follows. It calculated production tonnages by CPCA geographic areas for the following four categories of mineral aggregate:
Sand and gravel;
Crushed stone;
Clay shale; and
Other.
The most recent figures (2007) were used in the subsequent analyses involving the calculation of upstream and downstream economic outputs.
(60119329_mnr_ final_dec 19 2009.docx) - 8 -
Source: AECOM, 2009
1.3.1.2 Upstream – Production Value
It was difficult to obtain information on the value of Ontario aggregate production from primary sources. The principal source of information used in this study to derive values was a report published by the Ontario Ministry of Northern Development, Mines and Forestry (2007) entitled, “Ontario Mineral Exploration Statistics”. This document provided production values for the following mineral aggregates over the period 1998 to 2007.
Sand and gravel
Stone
Other material
o Gypsum
o Quartz
o Lime

(60119329_mnr_ final_dec 19 2009.docx) - 9 -
The values derived from the Ontario Ministry of Northern Development, Mines and Forestry (2007) in conjunction with the tonnages calculated earlier created the platforms for determining upstream and downstream economic outputs.
1.3.1.3 Upstream – Sector Economic Outputs and CPCA Geographic Area Economic Outputs
The aggregate sector outputs were produced using the information from the previous two steps and the multipliers derived from sector shocks of the Stats Can I/O Model. A purpose built model was constructed in this step to perform the calculations. It displayed economic output information in terms of direct, indirect and induced effects for the four categories of economic output previously mentioned (i.e. GDP, labour income, FTE jobs and gross output). It also calculated tax implications according for federal, provincial and municipal regimes. The model also distributed the economic outputs across the eight CPCA geographic areas. The North American Industry Classification (NAIC) System sectors shocked by Statistics Canada to derive direct and indirect multipliers for the upstream calculations were:
212310 – Stone Mining and Quarrying
212320 – Sand, Gravel, Clay and Ceramic and Refractory Minerals Mining and Quarrying
21239A - Miscellaneous Non Metallic Mineral Mining and Quarrying
A fourth shock was also performed on personal expenditures in order to derive the information needed to calculate the induced effects generated by income spending. The model structure for this part of the analysis is illustrated in Figure 1-5.

(60119329_mnr_ final_dec 19 2009.docx) - 10 -
Source: AECOM 2009
1.3.1.4 Downstream – Sector Flow
The downstream sectors addressed in this study are listed below by NAIC number and name. For the purposes of this study it was assumed that the industry sectors listed more or less accounted for all aggregate consumption. It is recognized the other industry sectors may also consume aggregate but on an order of magnitude basis it was assumed that their consumption would be relatively minor.
2300A0 Residential Building Construction
2300B0 Non-residential Building Construction
2300C0 Transportation Engineering Construction
2300D0 Oil and Gas Engineering Construction
2300E0 Electric Power Engineering Construction
322 Paper Manufacturing
325 Chemical Manufacturing
324120 Asphalt Paving, Roofing Material
327310 Cement Manufacturing
3273A0 Concrete Product Manufacturing

(60119329_mnr_ final_dec 19 2009.docx) - 11 -
327320 Ready Mix Manufacturing
327100 Clay Product and Refractory Manufacturing
327200 Glass and Glass Product Manufacturing
327400 Lime and Gypsum Product Manufacturing
327900 Other Non-metallic Mineral Product Manufacturing
331 Primary Metal Manufacturing
The industry sectors were subsequently grouped into three categories for purposes of data tabulation and analysis. Figure 1-6 sets out the category groupings.
Source: AECOM, 2009
The Stats Can I/O model was shocked with a $1 billion output value for each of the highlighted industry sectors. The I/O commodity tables for each sector were then studied to determine the GDP value of sand and gravel, stone and other aggregates highlighted in the shock. Summing all the GDP values for aggregate across all the sectors yielded a total GDP value which in turn permitted an overall apportionment of aggregate by industry sector and aggregate category.
Cement and Concrete Products
• Cement
• Concrete
• Ready Mix
Other Products
• Asphalt
• Chemical
• Clay and Refractory
• Glass
• Paper
• Lime and Gypsum
• Paper
• Other Non Metallic
• Primary Metals
Construction
• Residential
• Non Residential
• Electrical Power
• Oil and Gas
• Transportation

(60119329_mnr_ final_dec 19 2009.docx) - 12 -
1.3.1.5 Downstream - Sector Contributions
Following on from the analysis and calculations in the preceding step the value flow of aggregate to the different downstream industry sectors was calculated. This calculation involved an apportionment of the mineral aggregate production value derived in the upstream analysis (refer to 1.3.1.2 - Upstream Production Value).
1.3.1.6 Downstream – Economic Outputs
The final part of the economics analysis entailed the calculation of downstream industry sector economic outputs. Direct indirect and induced multipliers derived from the sector shocks of the Stats Can I/O model were used, coupled with the value flow apportionments of aggregate material discussed above. As in previous steps a model was developed to help perform the calculations and manipulate the data. The model structure is set out in Figure 1-7. The end product was a determination of the percentage value of aggregate relative to the overall economic output of each industry sector.
Source: AECOM, 2009
(60119329_mnr_ final_dec 19 2009.docx) - 13 -
Appropriate case studies were identified by examining the list of 25 infrastructure projects in Ontario with the largest cost or value between 2005 and 2009. To be included in the list of projects considered for case studies, projects needed to be under construction in the identified period or have had achieved financial close. From this list of 25 projects, 5 case studies were selected for in-depth examination through qualitative assessment to find aggregate intensive projects, over a wide geographic area and that were inclusive of a range of project types. Once identified, project information was gathered through informal interviews with relevant Project Managers and other Project Contacts. These informal interviews sought to gain an understanding of the types of aggregate inputs used (or estimated for use) in these projects, their costs and sources. In some cases, not all the information was available. These data were used to calculate the economic impacts of each case study using the methodology identified in section 1.3.1.6.
1.3.3.1 Overview
In this area of the study, two main approaches were used to gather and collect data from the public to understand how Ontarians value the built environment and the social costs and benefits associated with aggregate extraction. The first approach was public attitude research, through the use of a telephone survey, that was administered by telephone to 1,420 Ontario residents. The second approach was a content analysis of recorded public comments related to aggregate extraction.
1.3.3.2 Telephone Survey – Public Attitude Research
The survey instrument was designed to gain an understanding of how the Ontario public view, understand and values aggregates as well as the perceived social costs and benefits of aggregate extraction. Since “aggregate” is not a widely used or particularly common-place term, “development and infrastructure projects” was used in the survey to represent aggregate-related uses and “sand, stone and gravel” was used to represent aggregates as a resource. Background information on the aggregate industry was given to each respondent as starting points for key sections throughout the survey. A copy of the survey instrument can be found in Appendix A. The questions for the telephone survey were grouped into 6 sections.

(60119329_mnr_ final_dec 19 2009.docx) - 14 -
Survey Section 1 - Perceived Engagement with Aggregate Industry
It was assumed that a respondents‟ perceived engagement with the aggregate industry might influence their level of social value placed on aggregate resources, and so these questions were phrased to provide a basis for cross-tabular analyses. To assess this, respondents were asked if they thought they lived near a pit or quarry, near an aggregate transportation route, or had someone in their household (including themselves) employed by the aggregate or a related industry, such as construction1. Survey Section 2 - Factors Contributing to Community Well-Being
Respondents were asked to describe the three things they thought were most important to the well-being of their community, and were also asked which of those three things, if any, were more or less important than development and infrastructure projects. The purpose of these questions was to understand the types of things that people value about their community, and also how they rank the relative importance of aggregate-related projects to their community‟s well-being. Survey Section 3 - Value of Development and Infrastructure Projects
In this section, respondents were asked to rank the importance of different types of development and infrastructure projects. These included maintaining or repairing existing highways or roads, building new airports, institutional buildings, energy facilities, new highways or roads, railways, residential buildings and industrial buildings. These questions were rotated at random to avoid bias in response patterns. The purpose of assessing how respondents value different types of major development and infrastructure projects was to allow the study team to forecast the impact of not having the resources available for these projects. Survey Section 4 - Knowledge of the Aggregate Industry
A subset of questions was posed to assess respondents‟ knowledge of the aggregate industry. These questions sought to gauge how familiar respondents were with average aggregate use in Ontario per person, generally where aggregates are extracted from, and the main modes of transportation used to move aggregates from their extraction sites to processing or end use locations. This subset of questions was used to assess how well respondents understood the aggregate industry.
1 It should be noted that few respondents (3%) stated that they or someone in their household was employed by the aggregate
or a related industry. Therefore, in the reminder of this report, perceived engagement with the aggregate industry only refers to perceived proximity to a pit, quarry, or aggregate transportation route.
(60119329_mnr_ final_dec 19 2009.docx) - 15 -
Survey Section 5 - Social Costs and Benefits of Aggregate Extraction
In Section 5, two separate questions were used to ask respondents what they thought were the three main social costs and benefits of aggregate extraction. Respondents were prompted to give up to three responses, but in many cases, less than three per question were given. It should be noted that respondents were not asked to weigh the relative costs against the benefits. Survey Section 6 - Demographic Information
Finally, the last section was used to collect general demographic information from each respondent. The type of information requested included the respondent‟s postal code, age, gender (by observation) and income. These demographic questions are standard survey protocol, and some of this information was used for cross-tabular analyses of the survey results in the Intellipulse report. The questions were optional and in some cases, respondents did not provide any information. Survey Implementation
AECOM designed the survey instrument and contracted an independent firm, Intellipulse, to design the survey sample, administer the survey by telephone and compile the raw data. A copy of the full report from Intellipulse can be found in Appendix A. Respondents were drawn from random sample of 1,420 Ontario Residents. A disproportional provincial sample allocation was developed in order to have a sufficient sample size in each of the eight CPCA geographic areas. Sample sizes in each of the eight areas ranged from 152 to 354 respondents. This sampling approach yielded a minimum accuracy level of +/- 8.1%, 19 out of 20 times, with an accuracy level of +/- 2.6%, 19 out of 20 times, for all of Ontario. A pretest was conducted under direct supervision from Intellipulse and AECOM to ensure quality control and ease of administration. The
average survey duration was 15 minutes.
1.3.3.3 Content Analyses
Two sets of content analyses were undertaken to collect, numerate and code the types of concerns the public associated with aggregate operations. These public concerns provided insight to the social costs of aggregate extraction, in Ontario. The data for the two set of content analyses were taken from MNR site licence applications and from Ontario Municipal Board (OMB) hearings.
(60119329_mnr_ final_dec 19 2009.docx) - 16 -
The MNR provided AECOM with public comments associated with the most recent 31 site licence applications in Ontario. In some cases, no public comments were received for some of these licences. In total, 14 licence applications had recorded public comments. All recorded public comments (e.g., petitions, letters or emails) were reviewed, numerated and coded among common themes. OMB hearing data were obtained by searching the OMB website for relevant aggregate-related case files from 2001 to 2009. A total of 76 OMB cases were reviewed, numerated and coded for common themes in public concerns. In addition, approximately 9 case files from the Niagara Escarpment Commission (NEC) were reviewed, though they were not numerated or coded. A more qualitative discussion of these records is provided in the following sections. It should be noted, however, that the public comments from the OMB, MNR and NEC data are not representative for the Ontario population, but represent a specific group of public stakeholders.
The focus of this initiative was to analyse the important environmental contributions of aggregate use in Ontario. This analysis is broken down into two sections: Environmental Uses of Aggregates and Environmental Impacts of Aggregate Extraction. The following explains the methodology for each section.
1.3.4.1 Environmental Uses of Aggregates
A literature review was undertaken, focussed on understanding how products of the aggregate industry in Ontario provide environmental value, and how aggregates are used in environmental processes such as water filtration, reduction in energy cost and emissions and the creation of wildlife habitat. The United Nations Millennium Ecosystem Assessment provides an approach to the analysis of ecosystem services that was demonstrated in Ontario’s Wealth, Canada’s Future: Appreciating the Value of the Greenbelt’s Eco-services (David Suzuki Foundation 2008). Interviews with experts in the
aggregate field were conducted (including the Ontario Sand and Gravel Association; Ontario Aggregate Resources Corporation; and the Ministry of Natural Resources) to fill gaps that were not found in written documents. A matrix of ecosystem services and aggregates versus the natural environment was developed based on this research. Analyses were limited to primary uses, i.e., the immediate products of extraction, and not derived benefits (secondary or indirect uses). For example, aggregates are used to build hospitals, but health care was not identified as an environmental value associated with aggregate extraction.
(60119329_mnr_ final_dec 19 2009.docx) - 17 -
1.3.4.2 Environmental Impacts of Aggregate Extraction
Aggregate resources are always located in association with other land uses that generally include agriculture and natural areas. In recognition that competition for these resources can create conflicts, the Aggregate Resources Act requires that a rehabilitation plan be identified that is implemented sequentially as extraction progresses. The intent of this section of the study was to examine the existing land uses within the last 31 approved licences, and compare these uses to those identified post extraction through the rehabilitation plans. Ecosystems services provided by the natural environment (outside of benefits provided by the aggregates themselves), provide an estimate of short term impact versus the long term impact following rehabilitation and an estimate of the net change. A catalogue of the ecosystem services affected by the target licences, initial impacts, rehabilitation targets and net impacts to environmental value over a specified time frame was developed as a baseline database against which the environmental benefits of aggregate use could be compared. The MNR provided the natural heritage reports and rehabilitation plans for the 31 most recent aggregate approvals. The net effects of these were determined by comparing site plans to the associated reporting, historical air photos and Natural Resources and Values Information System (NRVIS) layers in a GIS (Geographic Information System) environment. Method to determine Area Data:
Operational and Rehabilitation Plans, for each licence, were geo-referenced into GIS and Licence and Extraction Boundaries were then mapped
Boundaries were correlated with the report for each licence natural heritage and NRVIS layers to obtain area coverage of forest, wetlands, ANSI, lakes, etc. within the extraction and licenced areas
Rehabilitation areas were determined by the same process using the Rehabilitation Plans.
Agricultural areas were determined by obtaining the agricultural overview of Ontario from Agriculture and Agri-Food Canada and then processed via the same manner as noted above.
Once areas were quantified into area of impact, percent of landscape affected and percent change the nature of the environmental features affected by the licences was characterized. The valuation was limited to areas and qualitative description of the ecosystem services affected. The application of economic models to assign dollar values to the resources was outside of the scope of this report.
(60119329_mnr_ final_dec 19 2009.docx) - 18 -
1.3.4.3 Limitations of Current Aggregate and Ecosystem Service Valuation Research
Limitations in conducting Ontario‟s aggregate industry and ecosystem service valuation research include:
1) The availability of ecosystem services information
2) Application of eco-services does not reflect the magnitude of the services (either positive or negative)
3) The data varied by scale and classification which introduced errors into the analysis (e.g. „lake‟ was really „river‟; scale of soils mapping was much smaller than that of the mapping in the licences)
4) The NRVIS layers may have conflicted with licence natural areas due to the date of information acquired
Although these methodologies proved to be coarse, these initial steps to provide a framework for assessment of actual environmental effects of aggregate extractions as opposed to intuitive assumptions.

(60119329_mnr_ final_dec 19 2009.docx) - 19 -
2.1.1.1 Overall Aggregate Production
Based on the TOARC data the net tonnage of aggregate production in Ontario inclusive of new production, recycling and import of material was in the order of 181 million tonnes in 2007. Figure 2-1 illustrates the trend since 1998. The production peak for the period occurred in 2006 at 192 million tonnes.
Source: TOARC, 1998 - 2007
The distribution of net production by CPCA geographic areas (see Figure 1-1) is set out in Figure 8. Area 4 (GTA) and Area 3 (West Central) are the dominate production areas with annual tonnage in the order of 30million tonnes. These are respectively followed by Area 6 (East) and Area 1 (Southwest) with tonnages between 21 million and 25 million tonnes. Area 2 (Peninsula) and Area 5 (East Central) fall in the 15 million to 20 million tonne range while Areas 7 (Northeast) and 8 (Northwest) fall in a 9 million to 12 million tonne bracket.
150,000,000
155,000,000
160,000,000
165,000,000
170,000,000
175,000,000
180,000,000
185,000,000
190,000,000
195,000,000
1998 1999 2000 2001 2002 2003 2004 2005 2006 2007
Ton
ne
s
Sum of CPCAA
(60119329_mnr_ final_dec 19 2009.docx) - 20 -
Source: AECOM, 2009
2.1.1.2 New Production Tonnages and Value
The previous section provided statistics on the overall production of aggregates in the Province including recycling and import. In this section the focus is exclusively on new production by three categories of material namely sand and gravel, stone and other (inclusive of gypsum, quartz and lime). In 2007 total production of these materials amounted to 164million tonnes. Of this total sand and gravel accounted for 61% of the volume followed by stone at 38% and other materials at 1%. Table 2-1 and Figure 2-3
provide statistics over the 1998 to 2007 period.
-
5,000,000
10,000,000
15,000,000
20,000,000
25,000,000
30,000,000
35,000,000
40,000,000
45,000,000
Area 1 Area 2 Area 3 Area 4 Area 5 Area 6 Area 7 Area 8
Ton
ne
s
(60119329_mnr_ final_dec 19 2009.docx) - 21 -
Sand and
Gravel Stone
Other Material Total
Sum of Material
1998 88,186,000 51,639,000 2,859,000 142,684,000
1999 105,714,000 58,704,000 2,993,000 167,411,000
2000 99,848,000 57,969,000 2,768,000 160,585,000
2001 97,878,000 58,972,000 2,615,000 159,465,000
2002 95,464,000 55,945,000 2,514,000 153,923,000
2003 98,726,000 54,622,000 2,444,000 155,792,000
2004 99,581,000 59,584,000 2,316,000 161,481,000
2005 99,382,000 57,876,000 2,219,000 159,477,000
2006 99,671,000 65,860,000 2,325,000 167,856,000
2007 99,646,000 61,822,000 2,232,000 163,700,000
Source: AECOM, 2009
Source: AECOM, 2009
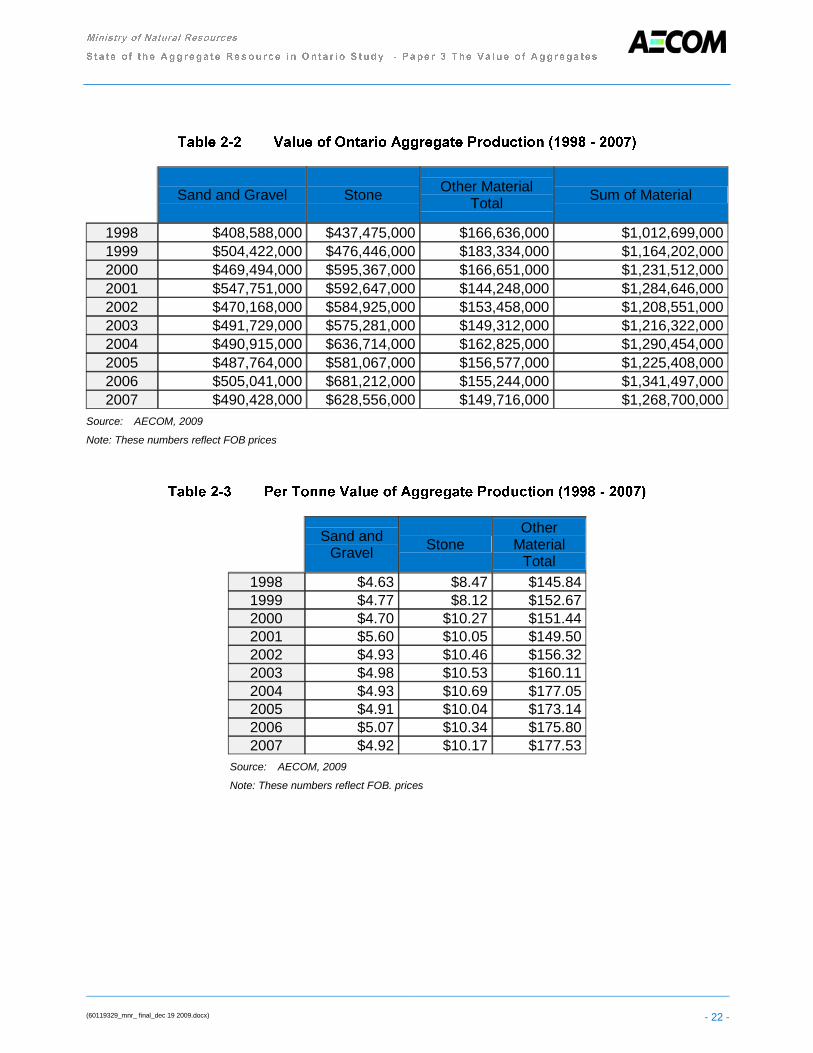
Based on 2007 statistics compiled by the Province of Ontario, the value of new aggregate production totalled approximately $1.27 billion at the pit gate before delivery (i.e. FOB). Stone accounted for 50% of this value followed by sand and gravel at 39% and other materials at 12%. Table 2-2 sets out the total value trends over the period 1998 to 2007. Table 2-3 translates these values to a per tonne basis.
-
20,000,000
40,000,000
60,000,000
80,000,000
100,000,000
120,000,000
140,000,000
160,000,000
180,000,000
1998 1999 2000 2001 2002 2003 2004 2005 2006 2007
Ton
ne
s
Other Material Total
Stone
Sand and Gravel
(60119329_mnr_ final_dec 19 2009.docx) - 22 -
Sand and Gravel Stone Other Material
Total Sum of Material
1998 $408,588,000 $437,475,000 $166,636,000 $1,012,699,000
1999 $504,422,000 $476,446,000 $183,334,000 $1,164,202,000
2000 $469,494,000 $595,367,000 $166,651,000 $1,231,512,000
2001 $547,751,000 $592,647,000 $144,248,000 $1,284,646,000
2002 $470,168,000 $584,925,000 $153,458,000 $1,208,551,000
2003 $491,729,000 $575,281,000 $149,312,000 $1,216,322,000
2004 $490,915,000 $636,714,000 $162,825,000 $1,290,454,000
2005 $487,764,000 $581,067,000 $156,577,000 $1,225,408,000
2006 $505,041,000 $681,212,000 $155,244,000 $1,341,497,000
2007 $490,428,000 $628,556,000 $149,716,000 $1,268,700,000
Source: AECOM, 2009
Note: These numbers reflect FOB prices
Sand and
Gravel Stone
Other Material
Total
1998 $4.63 $8.47 $145.84
1999 $4.77 $8.12 $152.67
2000 $4.70 $10.27 $151.44
2001 $5.60 $10.05 $149.50
2002 $4.93 $10.46 $156.32
2003 $4.98 $10.53 $160.11
2004 $4.93 $10.69 $177.05
2005 $4.91 $10.04 $173.14
2006 $5.07 $10.34 $175.80
2007 $4.92 $10.17 $177.53
Source: AECOM, 2009
Note: These numbers reflect FOB. prices

(60119329_mnr_ final_dec 19 2009.docx) - 23 -
2.1.1.3 Economic Outputs of New Production
The economic outputs of new production are highlighted in the following Tables 2-4, 2-5 and Figures 2-4 to 2-6. In 2007 the $1.27 billion of direct gross output generated by the sector created approximately $1.6 billion of total GDP, $ 827 million of total labour income, a total of 16,600 full time jobs and $ 2.9 billion in total gross output. For the same year the federal provincial and municipal taxes generated by the production respectively totalled $32 million, $45 million and $75,000. Tables 2-4 and 2-5 provide a view of the direct, indirect and induced outputs by material category for the total volume of production. Tables 2-6 and 2-7 convert these figures to a per tonne metric. The numbers generated in the ensuing tables are derived through the use of Statistics Canada‟s Inter-provincial Input /Output Model. This model is the preeminent model in Canada for the calculation of industry account information. It is very widely used and its results are accepted by a broad spectrum of users including the Bank of Canada, Conference Board of Canada and the finance departments of the Canadian Provinces and Territories. It is large and comprehensive model designed specifically to produce account information for industry and commodity groups across the country. The model has five main outputs: GDP, labour income, full time equivalent jobs, gross output and taxes. It should be noted that for taxes, the numbers do not include income tax or property tax. The actual tax categories accounted for are listed in the glossary.
Sand and Gravel Stone Other Material
Total Sum of Material
GDP
Direct $265,290,667 $368,639,294 $77,537,661 $711,467,622
Indirect $125,066,971 $138,892,019 $35,604,367 $299,563,358
Induced $281,260,493 $290,577,067 $61,576,079 $633,413,640
Total $671,618,131 $798,108,381 $174,718,107 $1,644,444,619
Labour Income
Direct $129,865,594 $128,586,844 $27,577,918 $286,030,356
Indirect $74,240,240 $82,279,866 $17,106,768 $173,626,875
Induced $163,042,190 $168,442,858 $35,694,664 $367,179,712
Total $367,148,025 $379,309,568 $80,379,350 $826,836,943
FTE Jobs
Direct 2,615 2,451 714 5,780
Indirect 1,358 1,446 339 3,142
Induced 3,388 3,500 742 7,630
Total 7,361 7,397 1,794 16,552
Gross Output
Direct $490,428,000 $628,556,000 $149,716,000 $1,268,700,000
Indirect $199,228,038 $270,481,475 $53,982,499 $523,692,012
Induced $468,765,380 $484,292,933 $102,626,336 $1,055,684,650
Total $1,158,421,418 $1,383,330,408 $306,324,836 $2,848,076,662
Source: AECOM, 2009

(60119329_mnr_ final_dec 19 2009.docx) - 24 -
It is noted that there is sometimes confusion surrounding the terms GDP and Gross Output. Gross Output is the value of sales generated by the producing sector before subtracting the value of intermediate goods used up in production. By contrast GDP is a net measure. It is the value of production in an industry sector after the preceding
subtraction has taken place. GDP is the common measure of value add.
Source: AECOM, 2009
Source: AECOM, 2009
-
2,000
4,000
6,000
8,000
10,000
12,000
14,000
16,000
18,000
Sand & Gravel Stone Other Total
FTE
Job
s
FTE Jobs Induced
FTE Jobs Indirect
FTE Jobs Direct
$-
$200,000,000
$400,000,000
$600,000,000
$800,000,000
$1,000,000,000
$1,200,000,000
$1,400,000,000
GDP Labour Income Gross Output
Other
Stone
Sand & Gravel
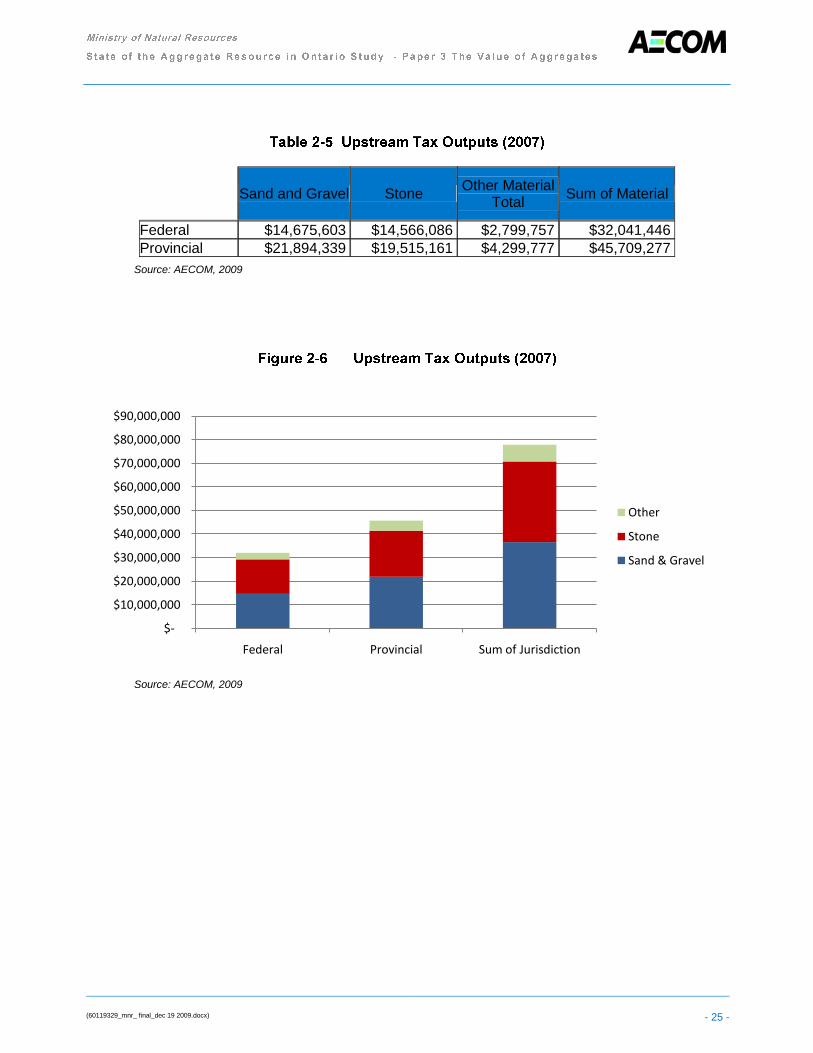
(60119329_mnr_ final_dec 19 2009.docx) - 25 -
Sand and Gravel Stone Other Material
Total Sum of Material
Federal $14,675,603 $14,566,086 $2,799,757 $32,041,446
Provincial $21,894,339 $19,515,161 $4,299,777 $45,709,277
Source: AECOM, 2009
Source: AECOM, 2009
$-
$10,000,000
$20,000,000
$30,000,000
$40,000,000
$50,000,000
$60,000,000
$70,000,000
$80,000,000
$90,000,000
Federal Provincial Sum of Jurisdiction
Other
Stone
Sand & Gravel

(60119329_mnr_ final_dec 19 2009.docx) - 26 -
Sand and
Gravel Stone
Other Material
Total
GDP
Direct $2.66 $5.96 $91.94
Indirect $1.26 $2.25 $42.22
Induced $2.82 $4.70 $73.02
Total $6.74 $12.91 $207.18
Labour Income
Direct $1.30 $2.08 $32.70
Indirect $0.75 $1.33 $20.29
Induced $1.64 $2.72 $42.33
Total $3.68 $6.14 $95.31
FTE Jobs
Direct 0.00003 0.00004 0.00085
Indirect 0.00001 0.00002 0.00040
Induced 0.00003 0.00006 0.00088
Total 0.00007 0.00012 0.00213
Gross Output
Direct $4.92 $10.17 $177.53
Indirect $2.00 $4.38 $64.01
Induced $4.70 $7.83 $121.69
Total $11.63 $22.38 $363.24
Source: AECOM, 2009
Sand and
Gravel Stone
Other Material
Total
Federal $0.15 $0.24 $3.32
Provincial $0.22 $0.32 $5.10
Source: AECOM, 2009
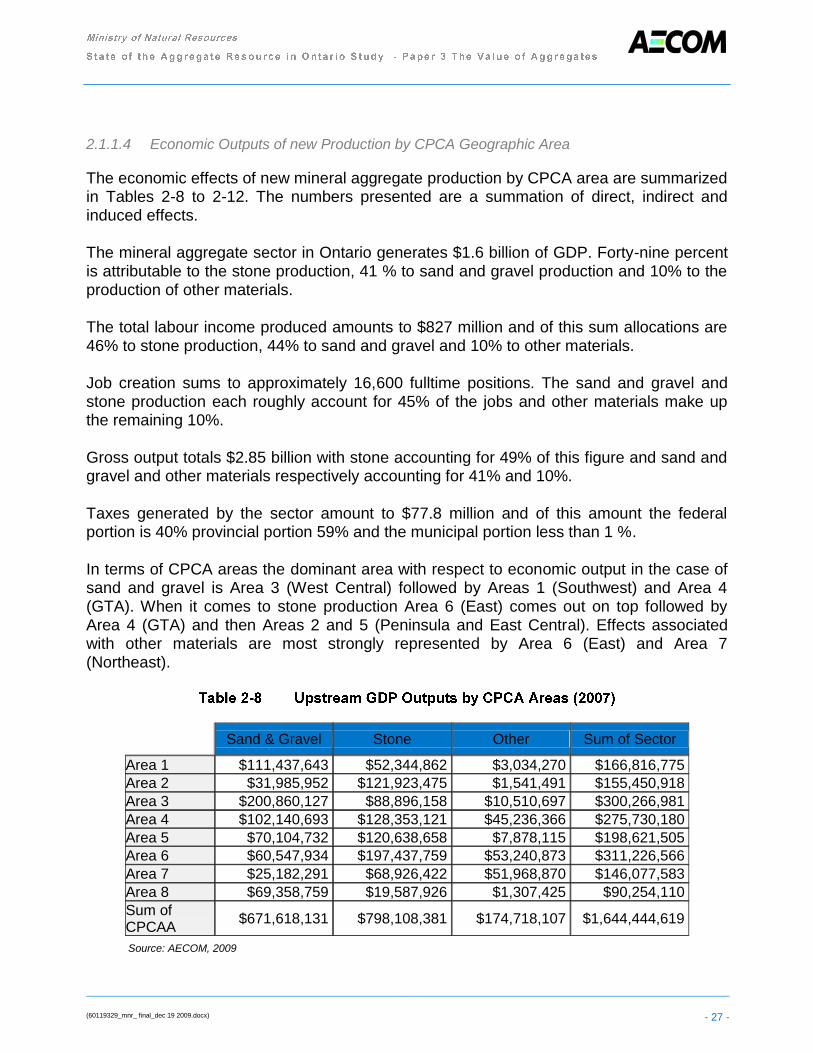
(60119329_mnr_ final_dec 19 2009.docx) - 27 -
2.1.1.4 Economic Outputs of new Production by CPCA Geographic Area
The economic effects of new mineral aggregate production by CPCA area are summarized in Tables 2-8 to 2-12. The numbers presented are a summation of direct, indirect and induced effects. The mineral aggregate sector in Ontario generates $1.6 billion of GDP. Forty-nine percent is attributable to the stone production, 41 % to sand and gravel production and 10% to the production of other materials. The total labour income produced amounts to $827 million and of this sum allocations are 46% to stone production, 44% to sand and gravel and 10% to other materials. Job creation sums to approximately 16,600 fulltime positions. The sand and gravel and stone production each roughly account for 45% of the jobs and other materials make up the remaining 10%. Gross output totals $2.85 billion with stone accounting for 49% of this figure and sand and gravel and other materials respectively accounting for 41% and 10%. Taxes generated by the sector amount to $77.8 million and of this amount the federal portion is 40% provincial portion 59% and the municipal portion less than 1 %. In terms of CPCA areas the dominant area with respect to economic output in the case of sand and gravel is Area 3 (West Central) followed by Areas 1 (Southwest) and Area 4 (GTA). When it comes to stone production Area 6 (East) comes out on top followed by Area 4 (GTA) and then Areas 2 and 5 (Peninsula and East Central). Effects associated with other materials are most strongly represented by Area 6 (East) and Area 7 (Northeast).
Sand & Gravel Stone Other Sum of Sector
Area 1 $111,437,643 $52,344,862 $3,034,270 $166,816,775
Area 2 $31,985,952 $121,923,475 $1,541,491 $155,450,918
Area 3 $200,860,127 $88,896,158 $10,510,697 $300,266,981
Area 4 $102,140,693 $128,353,121 $45,236,366 $275,730,180
Area 5 $70,104,732 $120,638,658 $7,878,115 $198,621,505
Area 6 $60,547,934 $197,437,759 $53,240,873 $311,226,566
Area 7 $25,182,291 $68,926,422 $51,968,870 $146,077,583
Area 8 $69,358,759 $19,587,926 $1,307,425 $90,254,110
Sum of CPCAA
$671,618,131 $798,108,381 $174,718,107 $1,644,444,619
Source: AECOM, 2009
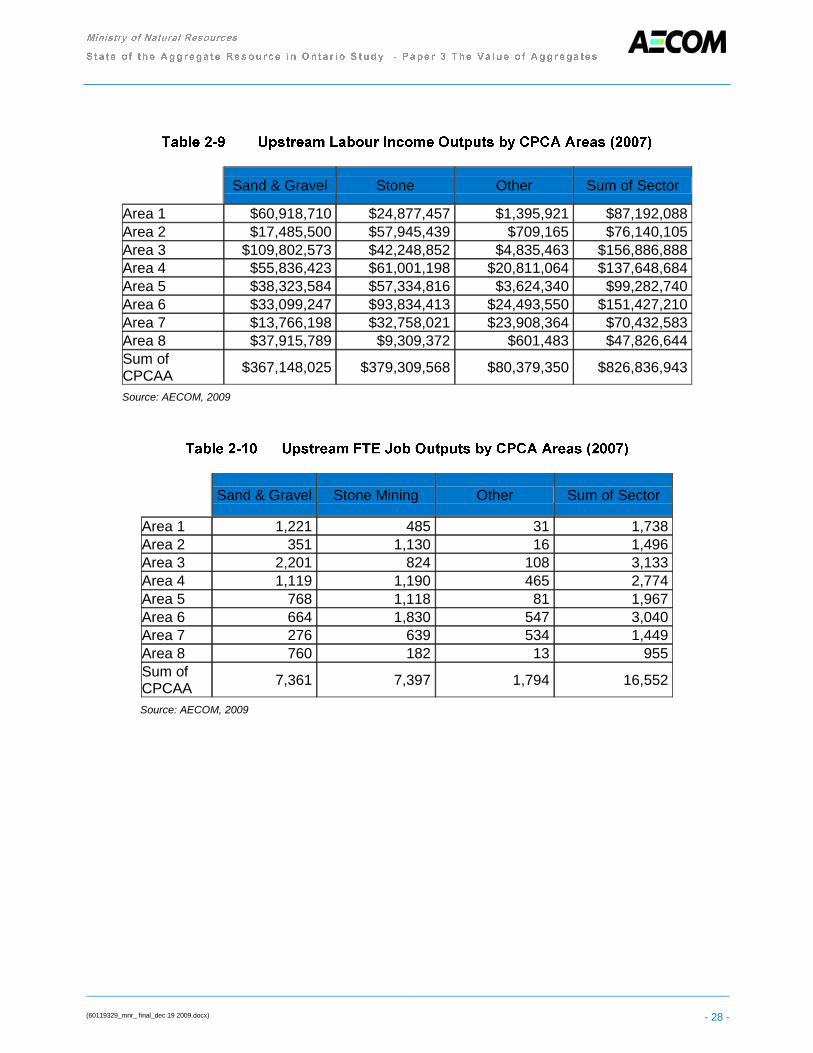
(60119329_mnr_ final_dec 19 2009.docx) - 28 -
Sand & Gravel Stone Other Sum of Sector
Area 1 $60,918,710 $24,877,457 $1,395,921 $87,192,088
Area 2 $17,485,500 $57,945,439 $709,165 $76,140,105
Area 3 $109,802,573 $42,248,852 $4,835,463 $156,886,888
Area 4 $55,836,423 $61,001,198 $20,811,064 $137,648,684
Area 5 $38,323,584 $57,334,816 $3,624,340 $99,282,740
Area 6 $33,099,247 $93,834,413 $24,493,550 $151,427,210
Area 7 $13,766,198 $32,758,021 $23,908,364 $70,432,583
Area 8 $37,915,789 $9,309,372 $601,483 $47,826,644
Sum of CPCAA
$367,148,025 $379,309,568 $80,379,350 $826,836,943
Source: AECOM, 2009
Sand & Gravel Stone Mining Other Sum of Sector
Area 1 1,221 485 31 1,738
Area 2 351 1,130 16 1,496
Area 3 2,201 824 108 3,133
Area 4 1,119 1,190 465 2,774
Area 5 768 1,118 81 1,967
Area 6 664 1,830 547 3,040
Area 7 276 639 534 1,449
Area 8 760 182 13 955
Sum of CPCAA
7,361 7,397 1,794 16,552
Source: AECOM, 2009

(60119329_mnr_ final_dec 19 2009.docx) - 29 -
Sand & Gravel Stone Mining Other Sum of Sector
Area 1 $192,210,047 $90,727,325 $5,319,840 $288,257,212
Area 2 $55,170,059 $211,325,247 $2,702,622 $269,197,928
Area 3 $346,447,873 $154,080,274 $18,427,898 $518,956,045
Area 4 $176,174,468 $222,469,504 $79,310,740 $477,954,711
Area 5 $120,918,152 $209,098,322 $13,812,320 $343,828,794
Area 6 $104,434,381 $342,211,237 $93,344,656 $539,990,274
Area 7 $43,434,958 $119,467,503 $91,114,515 $254,016,976
Area 8 $119,631,481 $33,950,995 $2,292,246 $155,874,722
Sum of CPCAA
$1,158,421,418 $1,383,330,408 $306,324,836 $2,848,076,662
Source: AECOM, 2009
Federal Provincial Municipal Sum of
Jurisdiction
Area 1 $3,438,992 $4,987,396 $7,901 $8,434,289
Area 2 $2,948,826 $4,061,903 $6,899 $7,017,629
Area 3 $6,179,868 $8,980,251 $14,216 $15,174,335
Area 4 $5,299,317 $7,581,443 $12,473 $12,893,232
Area 5 $3,859,856 $5,429,079 $8,997 $9,297,931
Area 6 $5,779,584 $8,111,775 $13,722 $13,905,080
Area 7 $2,640,992 $3,785,244 $6,382 $6,432,618
Area 8 $1,894,011 $2,772,188 $4,334 $4,670,533
Sum of CPCAA
$32,041,446 $45,709,277 $74,924 $77,825,648
Source: AECOM, 2009
2.1.2.1 Downstream Flows
The calculation of downstream flows in this study was largely accomplished via the use of the commodity tables associated with the Stats Can I/O model. As different sectors were shocked with a $1 billion gross output value, the commodity tables chronicled the GDP contributions for aggregate resources required to underpin this figure. These contributions were summed for all of the sectors and then an apportionment was calculated for each sector. Table 2-13 presents the apportionment summary.

(60119329_mnr_ final_dec 19 2009.docx) - 30 -
Cement and Concrete
Cement 1.54%
Ready Mix 12.26%
Concrete 7.44%
Sum of Cement and Concrete
21.24%
Other Products
Asphalt 6.95%
Chemical 0.39%
Clay 0.95%
Glass 2.25%
Lime & Gypsum 1.02%
Paper 5.38%
Other Non Metallic 3.81%
Primary Metal 1.20%
Sum of Other 21.93%
Construction
Residential 20.13%
Non Residential 10.50%
Electrical 1.14%
Oil & Gas 0.13%
Transportation 24.92%
Sum of Construction
56.82%
Total 100.00%
Source: AECOM, 2009
The construction category accounts for the majority of aggregate consumption at approximately 57%. Cement and concrete consume another 21% and other products consume the remaining 22%. There is a close tie between construction and cement and
concrete products as well asphalt and clay and lime and gypsum products. When the latter are amalgamated, their total apportionment approaches 87% of aggregate consumed. The allocation of the 2007 aggregate production value (i.e. $1.27 billion) across the industry categories and sectors is displayed in Table 2-14 and Figure 2-7. Construction consumes $720 million of the production, cement and concrete consume $270 million and other products consume $278 million.

(60119329_mnr_ final_dec 19 2009.docx) - 31 -
Cement and Concrete
Cement $19,544,755
Ready Mix $155,558,342
Concrete $94,413,684
Sum of Cement and Concrete
$269,516,781
Other Products
Asphalt $88,143,433
Chemical $4,917,498
Clay $12,007,653
Glass $28,515,950
Lime & Gypsum $12,958,056
Paper $68,263,741
Other Non Metallic $48,298,380
Primary Metal $15,173,032
Sum of Other $278,277,742
Construction
Residential $255,352,170
Non Residential $133,253,813
Electrical $14,423,517
Oil & Gas $1,665,955
Transportation $316,210,023
Sum of Construction $720,905,477
Total $1,268,700,000
Source: AECOM, 2009

(60119329_mnr_ final_dec 19 2009.docx) - 32 -
Source: AECOM, 2009
2.1.2.2 Economic Outputs of Downstream Aggregate Consumption
The economic output of aggregate consumption in the downstream sectors is summarized in Table 2-15 and Figures 2-8 and 2-9. The total GDP contribution is $1.6 billion. The labour income generated is $941 million and approximately 18,300 jobs are created. Total gross output approaches $3.2 billion.
$490,428,000 (39%)
$628,556,000 (49%)
$149,716,000 (12%)
Sand & Gravel
Stone
Other Material Total

(60119329_mnr_ final_dec 19 2009.docx) - 33 -
Cement and
Concrete Total
Other Products Total
Construction Total
Sum of Downstream
Sectors
GDP
Direct $113,055,245 $102,930,564 $299,729,046 $515,714,855
Indirect $89,325,239 $80,570,147 $198,694,387 $368,589,773
Induced $148,335,542 $128,434,896 $444,083,944 $720,854,382
Total $350,716,026 $311,935,607 $942,507,377 $1,605,159,010
Labour Income
Direct $63,629,202 $50,484,688 $190,819,132 $304,933,022
Indirect $44,015,379 $42,718,332 $131,445,036 $218,178,747
Induced $85,981,077 $74,445,884 $257,408,408 $417,835,369
Total $193,625,657 $167,648,905 $579,672,576 $940,947,138
FTE Jobs
Direct 1,403 833 3,369 5,605
Indirect 828 825 2,351 4,004
Induced 1,787 1,548 5,351 8,686
Total 4,019 3,205 11,071 18,295
Gross Output
Direct $269,516,781 $278,277,742 $720,905,477 $1,268,700,000
Indirect $170,927,656 $129,690,897 $414,181,359 $714,799,912
Induced $247,225,006 $214,057,383 $740,137,221 $1,201,419,610
Total $687,669,443 $622,026,022 $1,875,224,057 $3,184,919,521
Source: AECOM, 2009
Source: AECOM, 2009
-
2,000
4,000
6,000
8,000
10,000
12,000
Cement and Concrete
Construction Other Products
FTE
Job
s
Induced
Indirect
Direct

(60119329_mnr_ final_dec 19 2009.docx) - 34 -
Source: AECOM, 2009
Aggregate Enabled Industries
The Provincial GDP contribution of the entire cement and concrete, other aggregate products and construction industry sectors addressed in this report exceeds $22 billion. These industries account for labour income of $12.7 billion and they create 246,000 jobs. The total gross output of these sectors sums to $44.7 billion. In terms of job creation other aggregate sector products lead the way with 111,000 jobs (45% of total) followed by construction with 88,000 jobs (36% of total) and then cement and concrete products with 46,000 jobs (19% of total). Table 2-16 presents the economic outputs of the downstream industry sectors. Figures 2-10 and 2-11 illustrate the dimensions of these outputs.
$-
$500,000,000
$1,000,000,000
$1,500,000,000
$2,000,000,000
$2,500,000,000
$3,000,000,000
$3,500,000,000
GDP Labour Income Gross Output
Other Products
Construction
Cement & Concrete

(60119329_mnr_ final_dec 19 2009.docx) - 35 -
Cement and
Concrete Total Other Products
Total Construction Total
Sum of Downstream
Sectors
GDP
Direct $1,341,300,000 $3,576,800,000 $2,235,500,000 $7,153,600,000
Indirect $1,118,507,540 $2,530,784,187 $1,512,281,071 $5,161,572,799
Induced $1,730,926,857 $4,512,195,921 $3,528,240,137 $9,771,362,914
Total $4,190,734,397 $10,619,780,108 $7,276,021,208 $22,086,535,713
Labour Income
Direct $711,086,351 $1,906,677,346 $1,552,449,232 $4,170,212,928
Indirect $545,017,841 $1,367,746,519 $1,007,934,650 $2,920,699,010
Induced $1,003,312,846 $2,615,445,079 $2,045,105,857 $5,663,863,782
Total $2,259,417,038 $5,889,868,945 $4,605,489,738 $12,754,775,721
FTE Jobs
Direct 15,071 31,480 27,532 74,083
Indirect 10,301 25,558 18,047 53,905
Induced 20,858 54,373 42,516 117,747
Total 46,230 111,410 88,095 245,735
Gross Output
Direct $3,298,840,344 $9,910,959,746 $5,441,094,146 $18,650,894,236
Indirect $2,128,824,815 $4,536,135,041 $3,118,473,766 $9,783,433,621
Induced $2,884,867,627 $7,520,299,245 $5,880,378,890 $16,285,545,762
Total $8,312,532,785 $21,967,394,032 $14,439,946,802 $44,719,873,619
Source: AECOM, 2009
Source: AECOM, 2009
-
20,000
40,000
60,000
80,000
100,000
120,000
140,000
Direct Indirect Induced
Other Products
Construction
Cement and Concrete
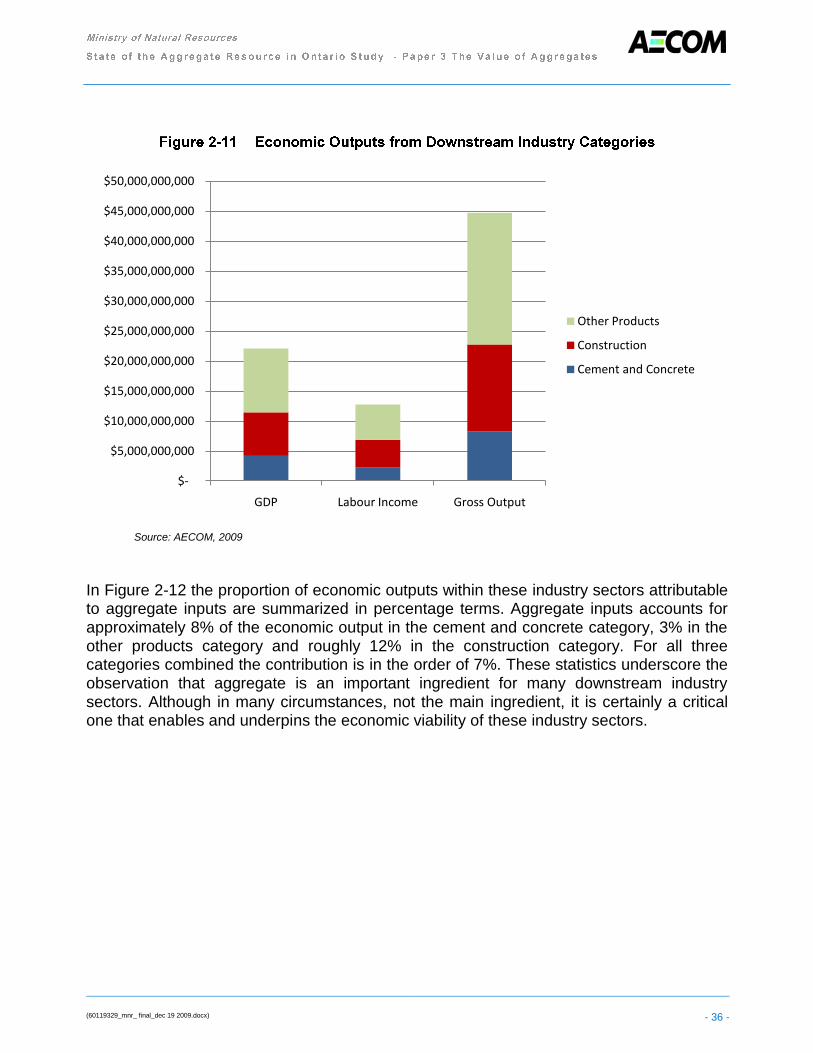
(60119329_mnr_ final_dec 19 2009.docx) - 36 -
Source: AECOM, 2009
In Figure 2-12 the proportion of economic outputs within these industry sectors attributable to aggregate inputs are summarized in percentage terms. Aggregate inputs accounts for approximately 8% of the economic output in the cement and concrete category, 3% in the other products category and roughly 12% in the construction category. For all three categories combined the contribution is in the order of 7%. These statistics underscore the observation that aggregate is an important ingredient for many downstream industry
sectors. Although in many circumstances, not the main ingredient, it is certainly a critical one that enables and underpins the economic viability of these industry sectors.
$-
$5,000,000,000
$10,000,000,000
$15,000,000,000
$20,000,000,000
$25,000,000,000
$30,000,000,000
$35,000,000,000
$40,000,000,000
$45,000,000,000
$50,000,000,000
GDP Labour Income Gross Output
Other Products
Construction
Cement and Concrete

(60119329_mnr_ final_dec 19 2009.docx) - 37 -
Source: AECOM, 2009
For a more in depth analysis, a short list of infrastructure projects was derived to select five case studies. This list was comprised of the 25 infrastructure projects in the Province of Ontario with the largest cost or value between 2005 and 2009. To be included in the list of projects considered for case studies, projects needed to be under construction in the identified period or have had achieved financial close. Table 2-17 describes the shortlist of 25 case studies and the following map indicates where they were located in the province. These are illustrated on Figure 2-13.
8%
13%
3%
Cement and Concrete
Construction
Other Products

(60119329_mnr_ final_dec 19 2009.docx) - 38 -
Project Project Type Location Value Portland Cement Region
1. Bruce A Nuclear Generating Station Restart
Energy Kincardine $5,250,000,000 3
2. Pier F at Lester B. Pearson International Airport
Transportation/Public Transit
Toronto $4,500,000,000 4
3. Spadina Subway Extension
Transportation/Public Transit
Toronto $2,630,000,000 4
4. Niagara Tunnel Project Energy Niagara Falls $985,000,000 2
5. Portlands Energy Centre Energy Toronto $730,000,000 4
6. Woodstock General Hospital
Hospitals/Health Care Woodstock $685,000,000 1
7. Greenfield Energy Energy Sarnia $675,000,000 1
8. New Data Centre Project Public Buildings/Government Offices
West of Toronto $650,000,000 4
9. Bruce to Milton Power Line
Energy Toronto $600,000,000 4
10. Toronto Power Line Energy Toronto $600,000,000 4
11. North Bay Regional Health Centre
Hospitals/Health Care North Bay $552,000,000 7
12. William Osler Health Centre
Hospitals/Health Care Brampton, Etobicoke, Georgetown
$550,000,000 4
13. Wolfe Island Wind Project Energy Wolfe Island $450,000,000 5
14. Sault Area Hospital Hospitals/Health Care Sault Ste. Marie $408,000,000 8
15. Durham Consolidated Courthouse
Justice Oshawa $334,000,000 4
16. Union Station Signaling Contract
Transportation/Public Transit
Toronto $300,000,000 4
17. Highway 401 Expansion Transportation/Public Transit
Greater Toronto Area
$285,000,000 4
18. Melancthon II Wind Farm Energy Shelburne $265,000,000 3
19. Henderson General Hospital Redevelopment
Hospitals/Health Care Hamilton $259,200,000 2
20. Art Gallery of Ontario Social Toronto $254,000,000 4
21. Bluewater Health Hospitals/Health Care Sarnia $214,000,000 1
22. London Health Sciences Centre North Toronto
Hospitals/Health Care London $212,000,000 1
23. Royal Ontario Museum Social Toronto $211,000,000 4
24. Peterborough Regional Health Centre
Hospitals/Health Care Peterborough $197,000,000 5
25. Hospital Montfort Hospitals/Health Care Ottawa $177,400,000 6
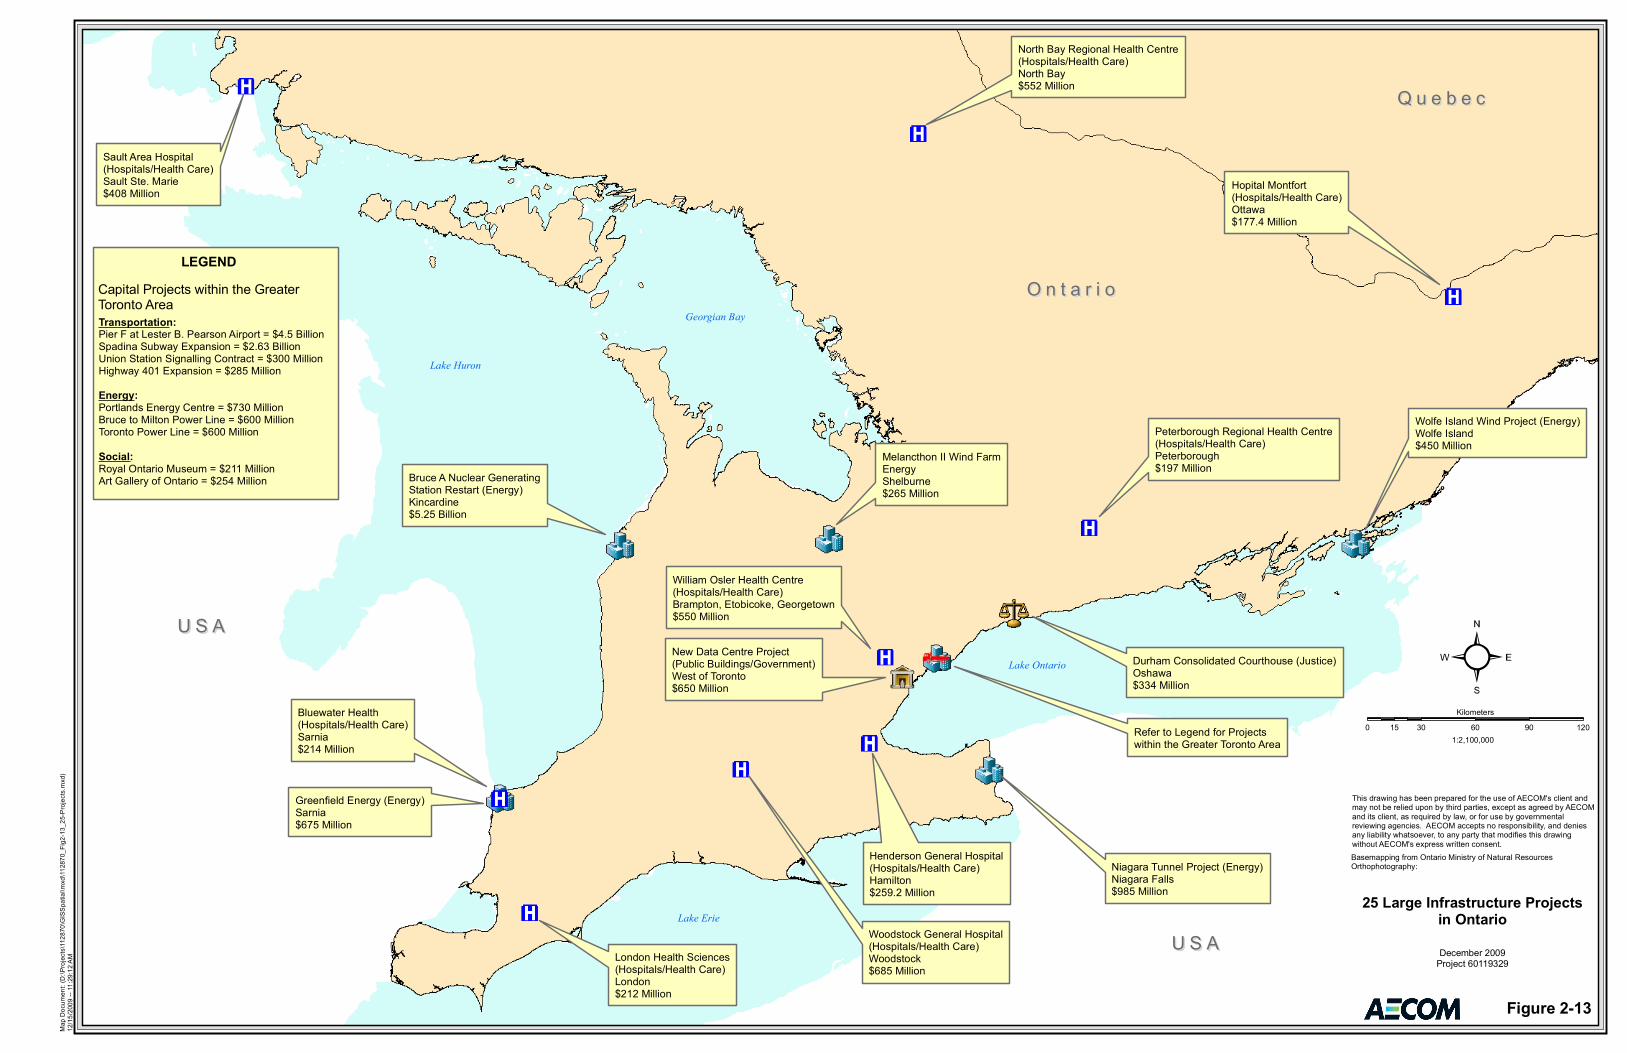
1:2,100,000
Map D
ocum
ent: (
D:\P
rojec
ts\11
2870
\GIS
Spati
al\mx
d\112
870_
Fig2-1
3_25
-Proj
ects.
mxd)
12/15
/2009
-- 11
:29:12
AM
25 Large Infrastructure Projectsin OntarioDecember 2009
Project 60119329
Basemapping from Ontario Ministry of Natural ResourcesOrthophotography:
0 30 60 90 12015Kilometers
This drawing has been prepared for the use of AECOM's client andmay not be relied upon by third parties, except as agreed by AECOMand its client, as required by law, or for use by governmentalreviewing agencies. AECOM accepts no responsibility, and deniesany liability whatsoever, to any party that modifies this drawingwithout AECOM's express written consent.
Sault Area Hospital(Hospitals/Health Care)Sault Ste. Marie$408 Million
North Bay Regional Health Centre(Hospitals/Health Care)North Bay$552 Million
Hopital Montfort(Hospitals/Health Care)Ottawa$177.4 Million
Wolfe Island Wind Project (Energy)Wolfe Island$450 Million
Peterborough Regional Health Centre(Hospitals/Health Care)Peterborough$197 Million
Durham Consolidated Courthouse (Justice)Oshawa$334 Million
Melancthon II Wind FarmEnergyShelburne$265 Million
Bruce A Nuclear GeneratingStation Restart (Energy)Kincardine$5.25 Billion
Niagara Tunnel Project (Energy)Niagara Falls$985 Million
London Health Sciences(Hospitals/Health Care)London$212 Million
Bluewater Health(Hospitals/Health Care)Sarnia$214 Million
Greenfield Energy (Energy)Sarnia$675 Million
Henderson General Hospital(Hospitals/Health Care)Hamilton$259.2 Million
William Osler Health Centre(Hospitals/Health Care)Brampton, Etobicoke, Georgetown$550 Million
Woodstock General Hospital(Hospitals/Health Care)Woodstock$685 Million
New Data Centre Project(Public Buildings/Government)West of Toronto$650 Million
Refer to Legend for Projectswithin the Greater Toronto Area
Capital Projects within the GreaterToronto AreaTransportation:Pier F at Lester B. Pearson Airport = $4.5 BillionSpadina Subway Expansion = $2.63 BillionUnion Station Signalling Contract = $300 MillionHighway 401 Expansion = $285 MillionEnergy:Portlands Energy Centre = $730 MillionBruce to Milton Power Line = $600 MillionToronto Power Line = $600 MillionSocial:Royal Ontario Museum = $211 MillionArt Gallery of Ontario = $254 Million
LEGEND
Lake Huron
Lake Erie
Lake Ontario
Georgian Bay
U S AU S A
U S AU S A
O n t a r i oO n t a r i o
Q u e b e cQ u e b e c
Figure 2-13
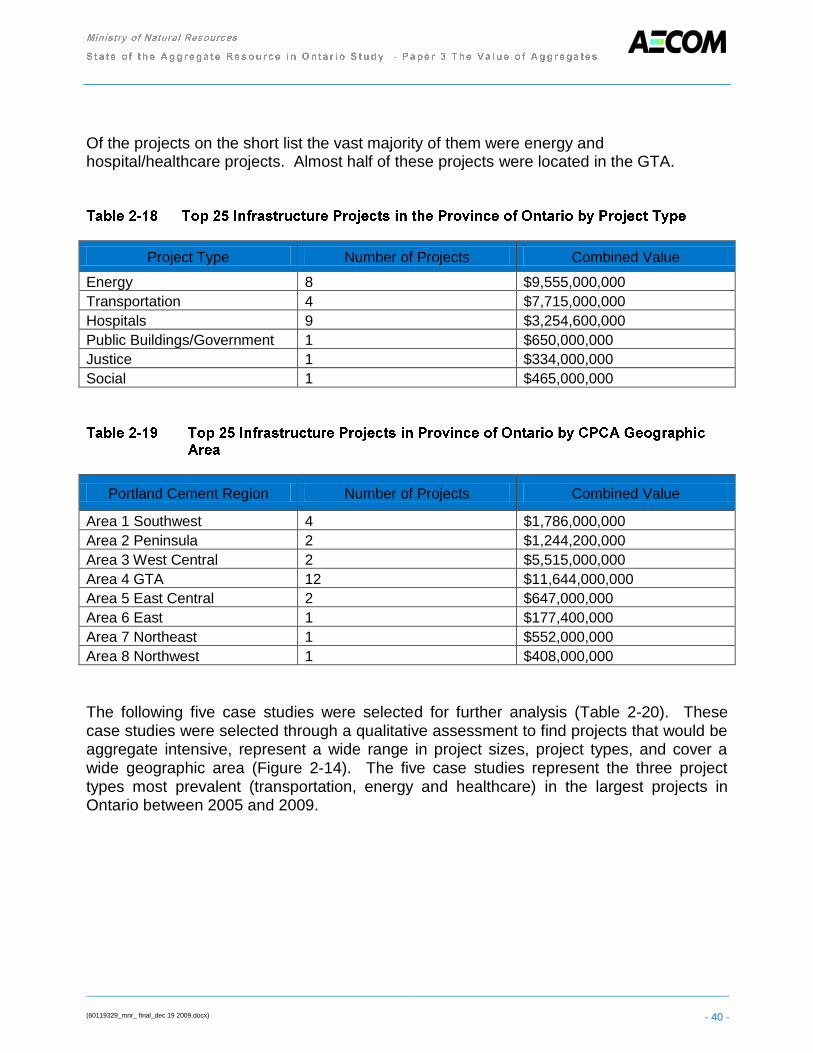
(60119329_mnr_ final_dec 19 2009.docx) - 40 -
Of the projects on the short list the vast majority of them were energy and hospital/healthcare projects. Almost half of these projects were located in the GTA.
Project Type Number of Projects Combined Value
Energy 8 $9,555,000,000
Transportation 4 $7,715,000,000
Hospitals 9 $3,254,600,000
Public Buildings/Government 1 $650,000,000
Justice 1 $334,000,000
Social 1 $465,000,000
Portland Cement Region Number of Projects Combined Value
Area 1 Southwest 4 $1,786,000,000
Area 2 Peninsula 2 $1,244,200,000
Area 3 West Central 2 $5,515,000,000
Area 4 GTA 12 $11,644,000,000
Area 5 East Central 2 $647,000,000
Area 6 East 1 $177,400,000
Area 7 Northeast 1 $552,000,000
Area 8 Northwest 1 $408,000,000
The following five case studies were selected for further analysis (Table 2-20). These case studies were selected through a qualitative assessment to find projects that would be aggregate intensive, represent a wide range in project sizes, project types, and cover a wide geographic area (Figure 2-14). The five case studies represent the three project types most prevalent (transportation, energy and healthcare) in the largest projects in Ontario between 2005 and 2009.

(60119329_mnr_ final_dec 19 2009.docx) - 41 -
Project Project Type Location Project Value
Portland
Cement
Region
Tonnes of
Aggregate
Used
Spadina Subway
Extension
Transportation/Public
Transit
Toronto $2,630,000,000 4 982,573
Niagara Tunnel
Project
Energy Niagara Falls $985,000,000 2 632,000
Woodstock
General Hospital
Hospitals/Health
Care
Woodstock $685,000,000 1 93,540
North Bay
Regional Health
Centre
Hospitals/Health
Care
North Bay $552,000,000 7 136,188
Wolfe Island
Wind Project
Energy Wolfe Island $450,000,000 5 88,329

Lake Huron
Lake Erie
Lake Ontario
Georgian Bay
U S AU S A
U S AU S A
O n t a r i oO n t a r i o
Q u e b e cQ u e b e c
North Bay Regional Health CentreNorth Bay, Ontario$552 Million
1:2,100,000
Map D
ocum
ent: (
D:\P
rojec
ts\11
2870
\GIS
Spati
al\mx
d\112
870_
Fig2-1
4_5-P
rojec
ts.mx
d)12
/15/20
09 --
11:30
:30 AM
5 Case StudiesIn OntarioDecember 2009
Project 60119329
Basemapping from Ontario Ministry of Natural ResourcesOrthophotography:
0 30 60 90 12015Kilometers
North Bay Regional Health CentreNorth Bay, Ontario$552 Million
Woodstock General HospitalWoodstock, Ontario$685 Million
North Bay Regional Health CentreNorth Bay, Ontario$552 Million
North Bay Regional Health CentreNorth Bay, Ontario$552 Million
North Bay Regional Health CentreNorth Bay, Ontario$552 Million
Wolfe Island Wind ProjectWolfe Island, Ontario$450 Million
Niagara Tunnel ProjectNiagara Falls, Ontario$985 Million
North Bay Regional Health CentreNorth Bay, Ontario$552 Million
Spadina Subway ExtensionToronto, Ontario$2.63 Billion
Figure 2-14
This drawing has been prepared for the use of AECOM's client andmay not be relied upon by third parties, except as agreed by AECOMand its client, as required by law, or for use by governmentalreviewing agencies. AECOM accepts no responsibility, and deniesany liability whatsoever, to any party that modifies this drawingwithout AECOM's express written consent.

(60119329_mnr_ final_dec 19 2009.docx) - 43 -
2.2.1.1 Spadina Subway Extension
Source: TTC, 2009
Project: Spadina Subway Extension Project Type: Transportation Project Location:
Toronto, Ontario – Portland Cement Area 4 GTA
Project Description:
Expansion of the Toronto Transit Commission (TTC) subway network into the Region of York.
The addition of 8.6 kilometres of new subway line to the existing Spadina subway line.
The creation of 6 new TTC stations. Size of Project: $2.63 billion Aggregates used:
980,000 tonnes of aggregate to be used
Economic Benefits:
Will support an average of 7,500 jobs a year in Ontario through the 6 years of construction, through direct, indirect and induced economic impacts.
91 of these jobs will be directly related to the economic value add

(60119329_mnr_ final_dec 19 2009.docx) - 44 -
from aggregates.
Will result in the creation of $2.2 billion of labour income throughout the project life.
$87 million of worker salaries will be directly related to the aggregate input to the project.
Will contribute $3.4 billion to the province of Ontario‟s gross domestic product.
The value added by the aggregates used in this project will be
worth $42 million to the province of Ontario, 1.22% of the total value created by the project.
Other Benefits: Project creates a major transit funnel between the Region of York, the City of Brampton, the City of Barrie, and Toronto.
Project will help reduce commute times.
Project will alleviate growth pressures on the Oakridge Moraine.
Project will spur sustainable growth in accordance with Ontario‟s Places to Grow legislation.
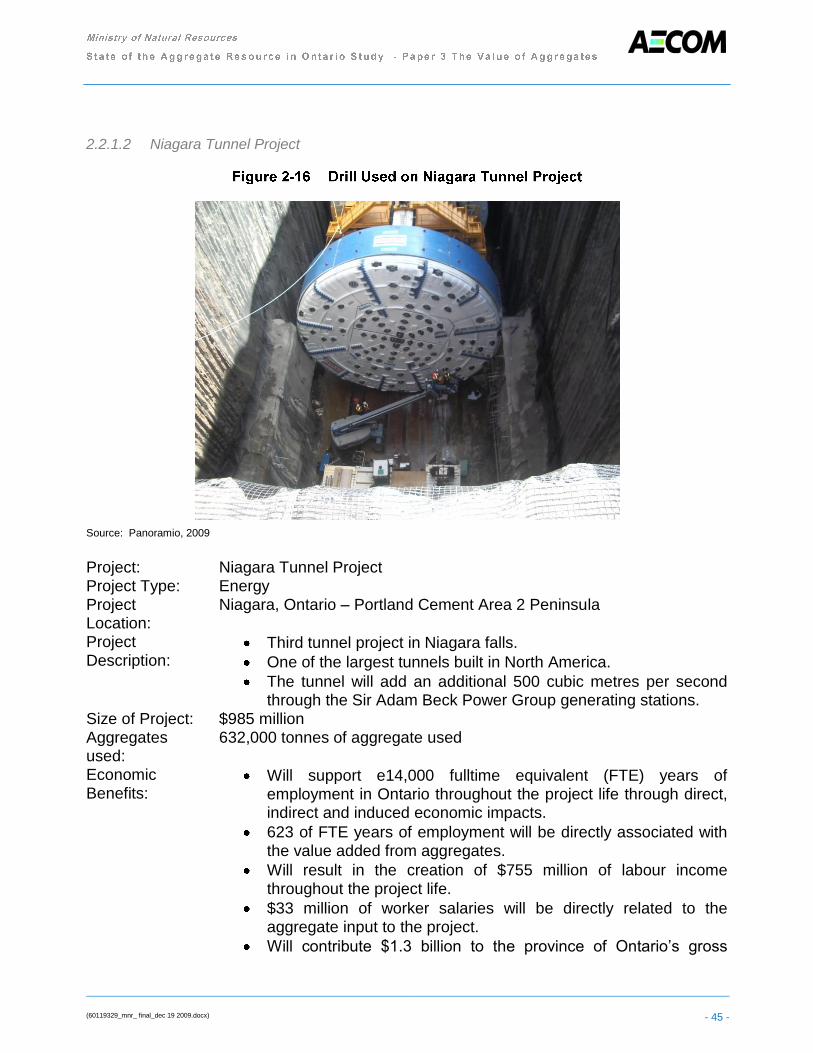
(60119329_mnr_ final_dec 19 2009.docx) - 45 -
2.2.1.2 Niagara Tunnel Project
Source: Panoramio, 2009
Project: Niagara Tunnel Project Project Type: Energy Project Location:
Niagara, Ontario – Portland Cement Area 2 Peninsula
Project Description:
Third tunnel project in Niagara falls.
One of the largest tunnels built in North America.
The tunnel will add an additional 500 cubic metres per second through the Sir Adam Beck Power Group generating stations.
Size of Project: $985 million Aggregates used:
632,000 tonnes of aggregate used
Economic Benefits:
Will support e14,000 fulltime equivalent (FTE) years of employment in Ontario throughout the project life through direct, indirect and induced economic impacts.
623 of FTE years of employment will be directly associated with the value added from aggregates.
Will result in the creation of $755 million of labour income throughout the project life.
$33 million of worker salaries will be directly related to the aggregate input to the project.
Will contribute $1.3 billion to the province of Ontario‟s gross

(60119329_mnr_ final_dec 19 2009.docx) - 46 -
domestic product.
The value added by the aggregates used in this project will be worth $59 million to the province of Ontario.
4.43% of the total value created by the project is related to the aggregate input.
Other Benefits: Project will produce an additional 580 megawatts of electricity.
This will increase the power produced by the Adam Beck Power Group by 28%.
The Tunnel Project will generate 1,600 Gigawatt hours of sustainable hydro-electricity annually.

(60119329_mnr_ final_dec 19 2009.docx) - 47 -
2.2.1.3 Woodstock General Hospital
Source: Delta Elevator, 2009
Project: Woodstock General Hospital Project Type: Hospital/Healthcare Project Location:
Woodstock, Ontario – Portland Cement Area 1 Southwest
Project Description:
New three story state-of-the-art replacement for the existing community hospital
Approximately 350,000 square foot building on a 25 acre greenfield site
New hospital will support a number of new regional healthcare programs
Size of Project: $685 million Aggregates used:
94,000 tonnes of aggregate used
Economic Benefits:
Will support an 14,000 fulltime equivalent (FTE) years of employment in Ontario throughout the project life through direct,

(60119329_mnr_ final_dec 19 2009.docx) - 48 -
indirect and induced economic impacts.
36 of FTE years of employment will be directly associated with the value added from aggregates.
Will result in the creation of $707 million of labour income throughout the project life.
$1.8 million of worker salaries will be directly related to the aggregate input to the project.
Will contribute $1.0 billion to the province of Ontario‟s gross
domestic product.
The value added by the aggregates used in this project will be worth $2.7 million to the province of Ontario.
0.26% of the total value created by the project is related to the aggregate input.
Other Benefits Creation of a 22-bed inpatient rehabilitation program.
Creation of 12 critical care beds, and 33 complex continuing care beds.
Development of a state-of-the-art diagnostic imaging capability.
Will have the ability to offer surgical services with 5 operating rooms.
Development of a new maternal/child/women‟s health unit with 14 beds, and 5 birthing rooms.
Creation of new mental health beds.

(60119329_mnr_ final_dec 19 2009.docx) - 49 -
2.2.1.4 North Bay Regional Health Centre
Source: Northeast Mental Health Center, 2009
Project: North Bay Regional Health Centre Project Type: Hospital/Healthcare Project Location:
North Bay, Ontario – Portland Cement Area 7 Northeast
Project Description:
New facilities for North Bay General Hospital and the Northeast Mental Health Centre.
The North Bay General Hospital will be housed in a new three-story building.
The Northeast Mental Health Center will be based in a village-like mental health centre.
Size of Project: $552 million Aggregates used:
136,000 tonnes of aggregate used
Economic Benefits:
Will support 11,000 fulltime equivalent (FTE) years of employment in Ontario throughout the project life through direct, indirect and induced economic impacts.
67 of FTE years of employment will be directly associated with the value added from aggregates.

(60119329_mnr_ final_dec 19 2009.docx) - 50 -
Will result in the creation of $570 million of labour income throughout the project life.
$3.4 million of worker salaries will be directly related to the aggregate input to the project.
Will contribute $839.8 million to the province of Ontario‟s gross domestic product.
The value added by the aggregates used in this project will be worth $5.1 million to the province of Ontario.
0.60% of the total value created by the project is related to the aggregate input.
Other Benefits: Accommodation of 57,000 emergency room patients per year through the creation of a larger emergency department with 32 treatment stretchers.
Capacity to treat 63,000 ambulatory care patients in a new ambulatory care centre.
Addition of 275 acute care beds.
Creation of 52 forensic psychiatry beds.
Creation of 61 specialized mental health beds.

(60119329_mnr_ final_dec 19 2009.docx) - 51 -
2.2.1.5 Wolfe Island Wind Project
Source: Wikipedia, 2009
Project: Wolfe Island Wind Farm Project Project Type: Energy Project Location:
County of Frontenac, Ontario – Portland Cement Area 5 East Central
Project Description:
Creation of a 197.8-megawatt wind plant on Wolfe Island
Size of Project: $450 million Aggregates used:
88,000 tonnes of aggregate used
Economic Benefits:
Will support 6,400 fulltime equivalent (FTE) years of employment in Ontario throughout the project life through direct, indirect and induced economic impacts.
671 of FTE years of employment will be directly associated with

(60119329_mnr_ final_dec 19 2009.docx) - 52 -
the value added from aggregates.
Will result in the creation of $345 million of labour income throughout the project life.
$3.5 million of worker salaries will be directly related to the aggregate input of the project.
Will contribute $605.1 million to the province of Ontario‟s gross domestic product.
The value added by the aggregates used in this project will be
worth $3.9 million to the province of Ontario.
0.64% of the total value created by the project is related to the aggregate input.
Other Benefits Development of Canada‟s second largest wind project.
Increased the Township of Frontenac Island‟s green energy resources.
Forecast to generate 594 Gigawatt hours of renewable energy annually.
Royalties, taxes, and amenities agreement for the host community.

(60119329_mnr_ final_dec 19 2009.docx) - 53 -
This section summarizes the results of the social value component of this study, including the Public Attitude Research (telephone survey) and the content analyses. The results of the Public Attitude Research are presented in the subsequent sections and the results of the content analyses are presented in the final subsection, 2.2.5 – Costs.
2.3.1.1 Assessment of Perceived Direct Experience (PDE)
It was hypothesized that the social value of aggregates and aggregate extraction may differ depending upon whether people have direct experience with the aggregate industry. To this end, the telephone survey sought to establish respondents‟ perceived direct experience with a pit or quarry and whether a member of their household was employed by the aggregate or a related industry (for example, construction). Respondents were asked if they lived near a pit or quarry, and also if they lived near an aggregate transportation route. As seen in Table 2-21, one-third of the respondents (33%) identified themselves as living near a pit or quarry, and one-quarter (25%) indicated that they live near a transportation route.
Pit or Quarry Near Their
Home
Home Near Transportation
Route
% N % N
Yes 33 (473) 25 (355)
No 61 (860) 67 (945)
Don't know 6 (88) 8 (120)
n 100 (1420) 100 (1420)
Note: Percentages may not sum to 100% due to rounding Source: Intellipulse, 2009
Similarly, respondents were also asked if they or someone else in their household was employed by the aggregate or a related industry. As can be seen in Table 2-22, very few respondents were, or had someone in their household, employed by the aggregate industry or related industries such as road or building construction. Those who responded affirmatively were asked how that person was employed. The types of occupations that were identified included: working at a pit or quarry and employment in the mining, construction and transportation industries.

(60119329_mnr_ final_dec 19 2009.docx) - 54 -
% n
Employed in the Industry:
Yes 3 (41)
No 97 (1375)
n 100 (1417)
Yes - In what way:
Construction - general 18 (8)
Road construction 17 (7)
Gravel/pit quarry 16 (7)
Home construction/ contractor
11 (5)
Heavy equipment operator/ crush stone
9 (4)
Business owner 8 (3)
Miner/aggregate company 5 (2)
Mechanic 3 (1)
Truck driver 3 (1)
Other 23 (9)
Don‟t know/refused 4 (2)
Total # of respondents (41) Note: Percentages may sum to more than 100% as more than one response was accepted. Source: Intellipulse, 2009
On the basis of these responses, those that answered “yes” to these two questions were considered to have a Perceived Direct Experience (PDE) with the aggregate industry. That
is, those respondents that answered “yes” in Tables 2-21 or 2-22 are stated to have a PDE with the aggregate industry. However, because so few respondents stated that there was a relationship of employment with the aggregate industry, only physical proximity to a pit, quarry, or aggregate transportation route were used to group respondents according to PDE and used in analyses.
2.3.1.2 Subjectivity in Perceived Direct Experience (PDE)
It was also thought that a person‟s PDE with the aggregate industry would be largely subjective, in that some people would state that they live in close proximity to a pit or quarry and do not, and conversely, others would state that they do not live near a pit or quarry, but in fact do. In order to test whether or not respondents had a PDE, respondent‟s location (determined by their postal code and if that was not available, their Forward Sortation Area (FSA)) was cross referenced against actual locations of pits or

(60119329_mnr_ final_dec 19 2009.docx) - 55 -
quarries, as obtained in a data file from the MNR (2009)2. These data were used to compare individual estimates of proximity to a pit or quarry3 to the actual distances of the individual‟s location to an existing pit or quarry, as defined by the MNR (2009) data file. Figure 2-18 summarizes this comparison.
0
100
200
300
400
500
600
0 5 10 15 20 25 30
Num
ber o
f Res
pons
es
Distance (km)
NO
YES
Source: AECOM, 2009 based on MNR, 2009
Figure 2-18 depicts two groups of respondents: those that said they do live near a pit or quarry and those that said that they do not live near a pit or quarry. Visually, though it appears that as distance from a pit or quarry increases, more respondents are likely to say that they do not live near a pit or quarry, there is no statistically significant difference between the actual distances these two groups of respondents. Respondents that replied “yes”, statistically, do not actually live closer to a pit or quarry than those respondents that replied “no”. These results confirmed that the perceived distance to a pit or quarry is
2 It should be noted that the data file of existing pits or quarries was not 100% complete, though the MNR gave a rough estimate
of 85% completion and accuracy for that data file. 3 Note that only “Yes” or “No” responses were used and “I don’t know” was not considered for this part of the analysis.
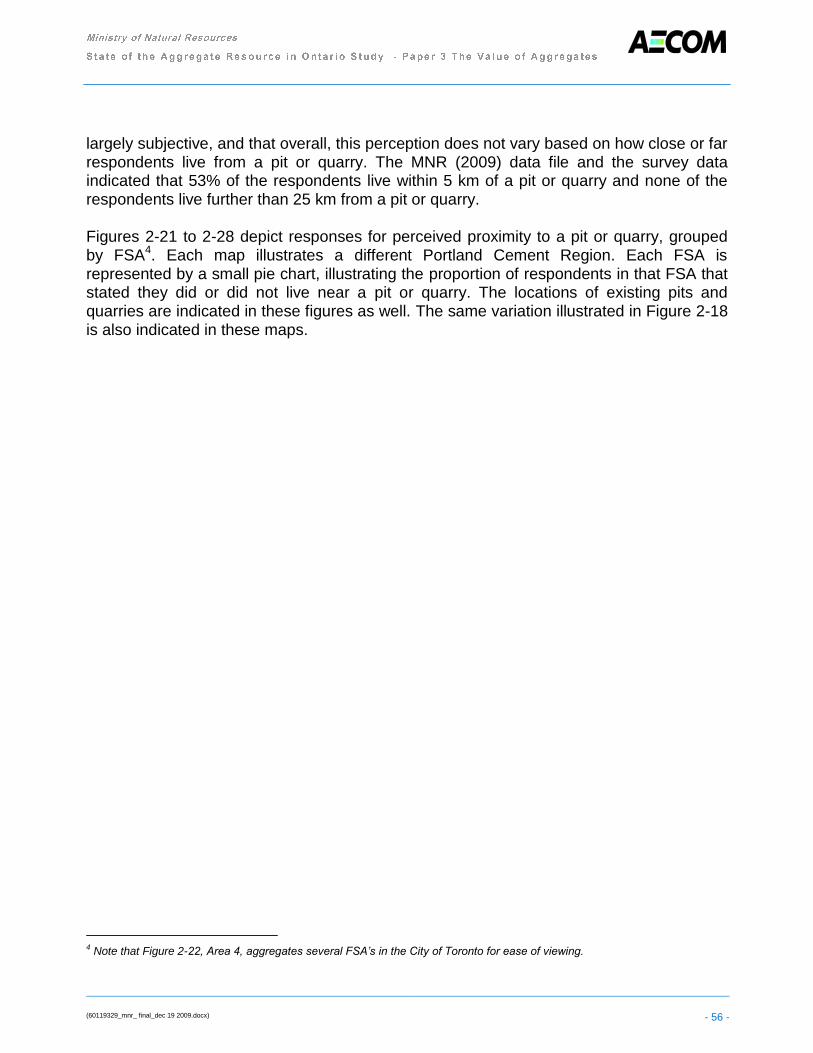
(60119329_mnr_ final_dec 19 2009.docx) - 56 -
largely subjective, and that overall, this perception does not vary based on how close or far respondents live from a pit or quarry. The MNR (2009) data file and the survey data indicated that 53% of the respondents live within 5 km of a pit or quarry and none of the respondents live further than 25 km from a pit or quarry. Figures 2-21 to 2-28 depict responses for perceived proximity to a pit or quarry, grouped by FSA4. Each map illustrates a different Portland Cement Region. Each FSA is represented by a small pie chart, illustrating the proportion of respondents in that FSA that stated they did or did not live near a pit or quarry. The locations of existing pits and quarries are indicated in these figures as well. The same variation illustrated in Figure 2-18 is also indicated in these maps.
4 Note that Figure 2-22, Area 4, aggregates several FSA’s in the City of Toronto for ease of viewing.

UTM Zone 17N, NAD 83Lake Erie
Lake Huron
Lake Ontario
E s s e xE s s e x
1:1,000,000
Quarry/PitCPCA Geographic AreaMunicipal Division
Map
Doc
umen
t: (N
:\pro
ject
s\0-
aeco
m\1
1287
0\20
09\F
inal
\GIS
Spa
tial\M
XD
s\R
epor
tMX
Ds\
1128
70R
espo
nse1
_Are
a1.m
xd)
12/1
5/20
09 --
11:
21:0
8 A
M December 2009Project 60119329
Grouped by FSA Location
This drawing has been prepared for the use of AECOM’s client and may not be relied upon by third parties, except as agreed byAECOM and its client, as required by law or for use bygovernmental reviewing agencies. AECOM accepts no responsibility, and denies any liability whatsoever, to any partythat modifies this drawing without AECOM’s express written consent.
Basemapping from Ontario Ministry of Natural Resources
0 10 20 30 405
Kilometers
Area 8Northwest
Area 7Northeast
Area 6East
Area 5East Central
Area 1Southwest
Area 3West Central
Area 4GTAArea 2
Peninsula
YesNo
1
5
11

UTM Zone 17N, NAD 83
Lake Erie
Lake Ontario
N i a g a r aN i a g a r a
O x f o r dO x f o r d
B r a n tB r a n t
H a l d i m a n d - N o r f o l kH a l d i m a n d - N o r f o l k
W a t e r l o oW a t e r l o o
H a l t o nH a l t o n
H a m i l t o n - W e n t w o r t hH a m i l t o n - W e n t w o r t h
E l g i nE l g i n
W e l l i n g t o nW e l l i n g t o n
P e e lP e e l
P e r t hP e r t h
P e r t hP e r t h
M e t r o p o l i t a n T o r o n t oM e t r o p o l i t a n T o r o n t o
1:500,000
Quarry/PitPortland Cement Geographic AreasMunicipal Division
Map
Doc
umen
t: (N
:\pro
ject
s\0-
aeco
m\1
1287
0\20
09\F
inal
\GIS
Spa
tial\M
XD
s\R
epor
tMX
Ds\
1128
70R
espo
nse1
_Are
a2.m
xd)
12/1
5/20
09 --
10:
45:2
2 A
M
Grouped by FSA Location
Basemapping from Ontario Ministry of Natural Resources
0 5 10 15 202.5
Kilometers
Area 8Northwest
Area 7Northeast
Area 6East
Area 5East Central
Area 1Southwest
Area 3West Central
Area 4GTAArea 2
Peninsula
YesNo
1
4
9
December 2009Project 60119329
This drawing has been prepared for the use of AECOM’s client and may not be relied upon by third parties, except as agreed byAECOM and its client, as required by law or for use bygovernmental reviewing agencies. AECOM accepts no responsibility, and denies any liability whatsoever, to any partythat modifies this drawing without AECOM’s express written consent.

UTM Zone 17N, NAD 83
Lake Ontario
G r e yG r e y
B r u c eB r u c e
S i m c o eS i m c o e
H u r o nH u r o n
M u s k o k aM u s k o k a
P e r t hP e r t h
Y o r kY o r k
H a l i b u r t o nH a l i b u r t o n
D u r h a mD u r h a m
P e e lP e e lW e l l i n g t o nW e l l i n g t o n
K a w a r t h a L a k e sK a w a r t h a L a k e s
D u f f e r i nD u f f e r i n
O x f o r dO x f o r d
W a t e r l o oW a t e r l o o
H a l t o nH a l t o n
P a r r y S o u n dP a r r y S o u n d
B r a n tB r a n t
P e t e r b o r o u g hP e t e r b o r o u g h
M i d d l e s e xM i d d l e s e xN i a g a r aN i a g a r a
H a m i l t o n - W e n t w o r t hH a m i l t o n - W e n t w o r t h
L a m b t o nL a m b t o n
M e t r o p o l i t a n T o r o n t oM e t r o p o l i t a n T o r o n t o
N o r t h u m b e r l a n dN o r t h u m b e r l a n d
N i p i s s i n gN i p i s s i n g
H a l d i m a n d - N o r f o l kH a l d i m a n d - N o r f o l k
1:1,000,000
Quarry/PitCPCA Geographic AreaMunicipal Division
Map
Doc
umen
t: (N
:\pro
ject
s\0-
aeco
m\1
1287
0\20
09\F
inal
\GIS
Spa
tial\M
XD
s\R
epor
tMX
Ds\
1128
70R
espo
nse1
_Are
a3.m
xd)
12/1
5/20
09 --
10:
47:4
0 A
M
Grouped by FSA Location
Basemapping from Ontario Ministry of Natural Resources
0 10 20 30 405
Kilometers
Area 8Northwest
Area 7Northeast
Area 6East
Area 5East Central
Area 1Southwest
Area 3West Central
Area 4GTAArea 2
Peninsula
YesNo
1
8
18
December 2009Project 60119329
This drawing has been prepared for the use of AECOM’s client and may not be relied upon by third parties, except as agreed byAECOM and its client, as required by law or for use bygovernmental reviewing agencies. AECOM accepts no responsibility, and denies any liability whatsoever, to any partythat modifies this drawing without AECOM’s express written consent.

UTM Zone 17N, NAD 83
Lake Ontario
Y o r kY o r k
D u r h a mD u r h a m
P e e lP e e l
S i m c o eS i m c o e
D u f f e r i nD u f f e r i n
H a l t o nH a l t o n
K a w a r t h a L a k e sK a w a r t h a L a k e s
G r e yG r e y
W e l l i n g t o nW e l l i n g t o n
P e t e r b o r o u g hP e t e r b o r o u g h
H a m i l t o n - W e n t w o r t hH a m i l t o n - W e n t w o r t h
M e t r o p o l i t a n T o r o n t oM e t r o p o l i t a n T o r o n t o
N o r t h u m b e r l a n dN o r t h u m b e r l a n d
B r a n tB r a n t
1:500,000
Quarry/PitCPCA Geographic AreaMunicipal Division
Map
Doc
umen
t: (N
:\pro
ject
s\0-
aeco
m\1
1287
0\20
09\F
inal
\GIS
Spa
tial\M
XD
s\R
epor
tMX
Ds\
1128
70R
espo
nse1
_Are
a4.m
xd)
11/0
5/20
09 --
8:3
9:22
AM
Grouped by FSA Location
Basemapping from Ontario Ministry of Natural Resources
0 5 10 15 202.5
Kilometers
Area 8Northwest
Area 7Northeast
Area 6East
Area 5East Central
Area 1Southwest
Area 3West Central
Area 4GTAArea 2
Peninsula
YesNo
1
6
30
December 2009Project 60119329
This drawing has been prepared for the use of AECOM’s client and may not be relied upon by third parties, except as agreed byAECOM and its client, as required by law or for use bygovernmental reviewing agencies. AECOM accepts no responsibility, and denies any liability whatsoever, to any partythat modifies this drawing without AECOM’s express written consent.

UTM Zone 17N, NAD 83
Lake Ontario
H a s t i n g sH a s t i n g s
S i m c o eS i m c o e
M u s k o k aM u s k o k a
R e n f r e wR e n f r e w
L a n a r kL a n a r kH a l i b u r t o nH a l i b u r t o n
F r o n t e n a cF r o n t e n a c
Y o r kY o r k
D u r h a mD u r h a m
P e t e r b o r o u g hP e t e r b o r o u g h
P e e lP e e l
P a r r y S o u n dP a r r y S o u n d
K a w a r t h a L a k e sK a w a r t h a L a k e s
N i p i s s i n gN i p i s s i n g
H a l t o nH a l t o n
L e n n o x & A d d i n g t o nL e n n o x & A d d i n g t o n
N o r t h u m b e r l a n dN o r t h u m b e r l a n d
L e e d s & G r e n v i l l eL e e d s & G r e n v i l l e
O t t a w a - C a r l t o nO t t a w a - C a r l t o n
P r i n c e E d w a r dP r i n c e E d w a r dD u f f e r i nD u f f e r i n
M e t r o p o l i t a n T o r o n t oM e t r o p o l i t a n T o r o n t oW e l l i n g t o nW e l l i n g t o n
H a m i l t o n - W e n t w o r t hH a m i l t o n - W e n t w o r t h
W e l l i n g t o nW e l l i n g t o n
N i a g a r aN i a g a r a
1:1,000,000
Quarry/PitCPCA Geographic AreaMunicipal Division
Map
Doc
umen
t: (N
:\pro
ject
s\0-
aeco
m\1
1287
0\20
09\F
inal
\GIS
Spa
tial\M
XD
s\R
epor
tMX
Ds\
1128
70R
espo
nse1
_Are
a5.m
xd)
12/1
5/20
09 --
10:
58:0
8 A
M
Grouped by FSA Location
Basemapping from Ontario Ministry of Natural Resources
0 10 20 30 405
Kilometers
Area 8Northwest
Area 7Northeast
Area 6East
Area 5East Central
Area 1Southwest
Area 3West Central
Area 4GTAArea 2
Peninsula
YesNo
1
6
12
December 2009Project 60119329
This drawing has been prepared for the use of AECOM’s client and may not be relied upon by third parties, except as agreed byAECOM and its client, as required by law or for use bygovernmental reviewing agencies. AECOM accepts no responsibility, and denies any liability whatsoever, to any partythat modifies this drawing without AECOM’s express written consent.

UTM Zone 17N, NAD 83
R e n f r e wR e n f r e w
H a s t i n g sH a s t i n g s
N i p i s s i n gN i p i s s i n g
L a n a r kL a n a r k
F r o n t e n a cF r o n t e n a c
P e t e r b o r o u g hP e t e r b o r o u g h
H a l i b u r t o nH a l i b u r t o n
L e e d s & G r e n v i l l eL e e d s & G r e n v i l l e
L e n n o x & A d d i n g t o nL e n n o x & A d d i n g t o n
N o r t h u m b e r l a n dN o r t h u m b e r l a n d
S t o r m o n t D u n d a s & G l e n g a r r yS t o r m o n t D u n d a s & G l e n g a r r y
P r e s c o t t & R u s s e l lP r e s c o t t & R u s s e l l
P r i n c e E d w a r dP r i n c e E d w a r d
O t t a w a - C a r l t o nO t t a w a - C a r l t o n
K a w a r t h a L a k e sK a w a r t h a L a k e s
D u r h a mD u r h a m
1:1,000,000
Quarry/PitCPCA Geographic AreaMunicipal Division
Map
Doc
umen
t: (N
:\pro
ject
s\0-
aeco
m\1
1287
0\20
09\F
inal
\GIS
Spa
tial\M
XD
s\R
epor
tMX
Ds\
1128
70R
espo
nse1
_Are
a6.m
xd)
12/1
5/20
09 --
11:
03:1
4 A
M
Grouped by FSA Location
Basemapping from Ontario Ministry of Natural Resources
0 10 20 30 405
Kilometers
Area 8Northwest
Area 7Northeast
Area 6East
Area 5East Central
Area 1Southwest
Area 3West Central
Area 4GTAArea 2
Peninsula
YesNo
1
3
7
December 2009Project 60119329
This drawing has been prepared for the use of AECOM’s client and may not be relied upon by third parties, except as agreed byAECOM and its client, as required by law or for use bygovernmental reviewing agencies. AECOM accepts no responsibility, and denies any liability whatsoever, to any partythat modifies this drawing without AECOM’s express written consent.
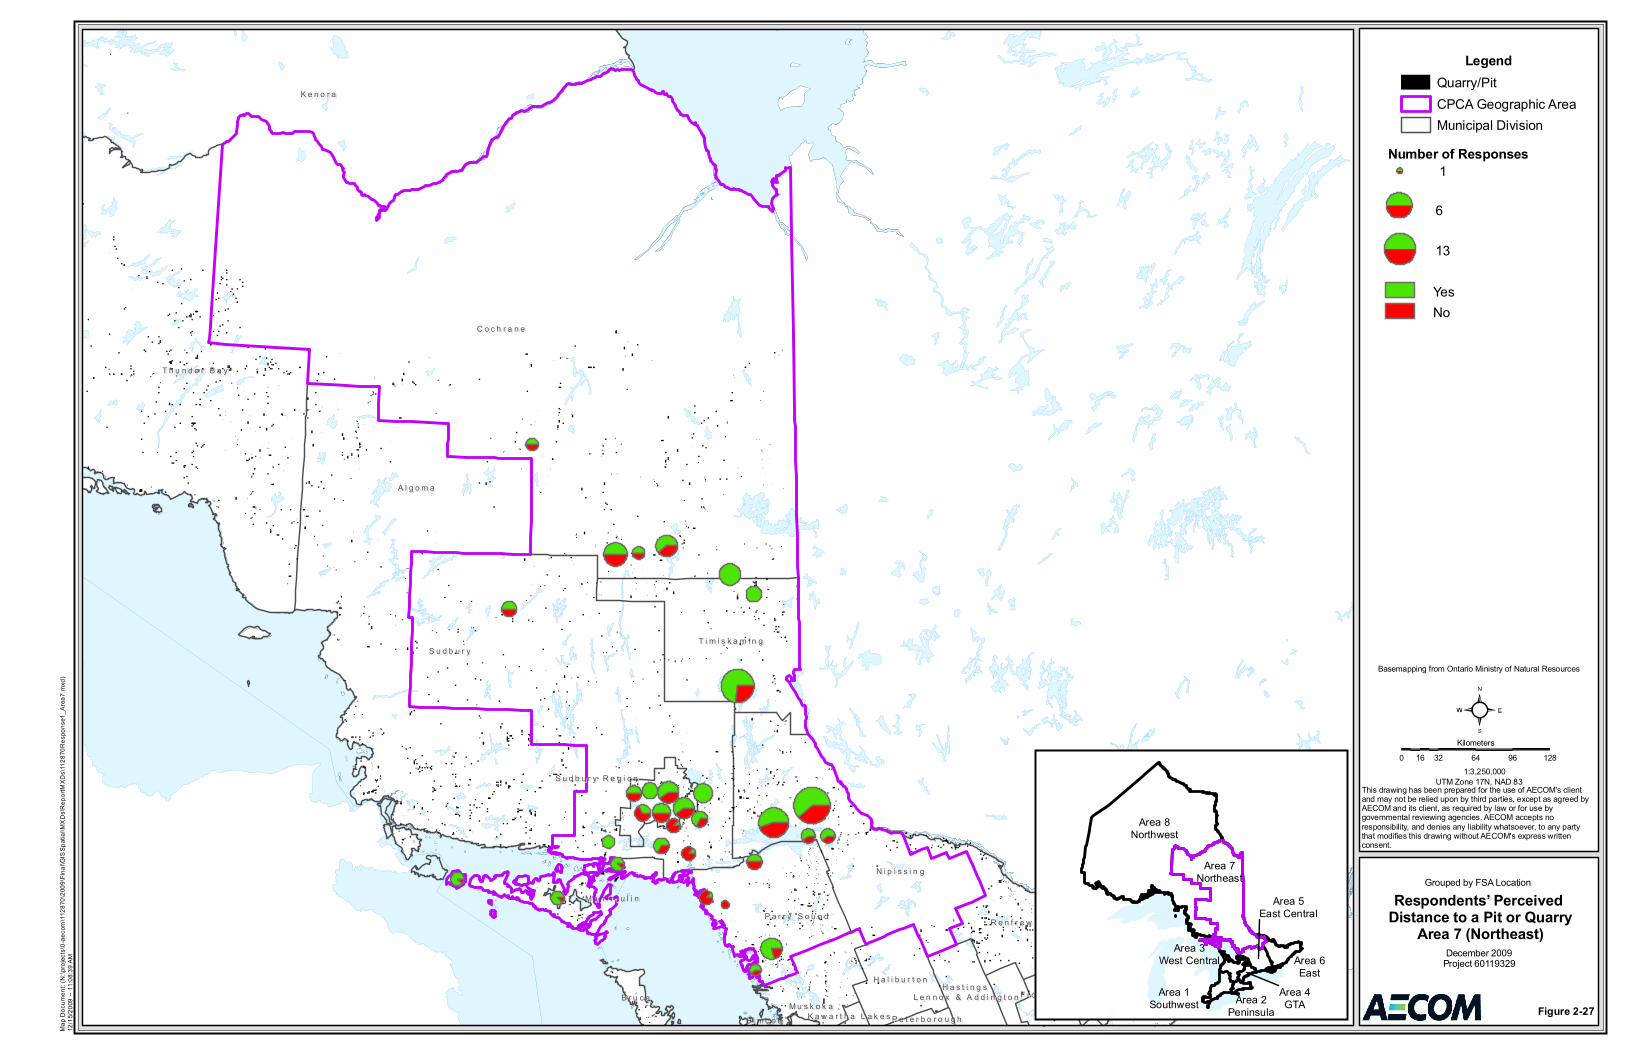
UTM Zone 17N, NAD 83
C o c h r a n eC o c h r a n e
A l g o m aA l g o m a
K e n o r aK e n o r a
S u d b u r yS u d b u r y
T h u n d e r B a yT h u n d e r B a y
N i p i s s i n gN i p i s s i n g
T i m i s k a m i n gT i m i s k a m i n g
R e n f r e wR e n f r e wP a r r y S o u n dP a r r y S o u n d
M u s k o k aM u s k o k a
L a n a r kL a n a r kH a l i b u r t o nH a l i b u r t o nH a s t i n g sH a s t i n g s
M a n i t o u l i nM a n i t o u l i n
F r o n t e n a cF r o n t e n a c
O t t a w a - C a r l t o nO t t a w a - C a r l t o n
B r u c eB r u c e
S u d b u r y R e g i o nS u d b u r y R e g i o n
S t o r m o n t D u n d a s & G l e n g a r r yS t o r m o n t D u n d a s & G l e n g a r r y
P r e s c o t t & R u s s e l lP r e s c o t t & R u s s e l l
L e e d s & G r e n v i l l eL e e d s & G r e n v i l l eL e n n o x & A d d i n g t o nL e n n o x & A d d i n g t o n
P e t e r b o r o u g hP e t e r b o r o u g hK a w a r t h a L a k e sK a w a r t h a L a k e sS i m c o eS i m c o e
1:3,250,000
Quarry/PitCPCA Geographic AreaMunicipal Division
Map
Doc
umen
t: (N
:\pro
ject
s\0-
aeco
m\1
1287
0\20
09\F
inal
\GIS
Spa
tial\M
XD
s\R
epor
tMX
Ds\
1128
70R
espo
nse1
_Are
a7.m
xd)
12/1
5/20
09 --
11:
08:3
9 A
M
Grouped by FSA Location
Basemapping from Ontario Ministry of Natural Resources
0 32 64 96 12816
Kilometers
Area 8Northwest
Area 7Northeast
Area 6East
Area 5East Central
Area 1Southwest
Area 3West Central
Area 4GTAArea 2
Peninsula
YesNo
1
6
13
December 2009Project 60119329
This drawing has been prepared for the use of AECOM’s client and may not be relied upon by third parties, except as agreed byAECOM and its client, as required by law or for use bygovernmental reviewing agencies. AECOM accepts no responsibility, and denies any liability whatsoever, to any partythat modifies this drawing without AECOM’s express written consent.
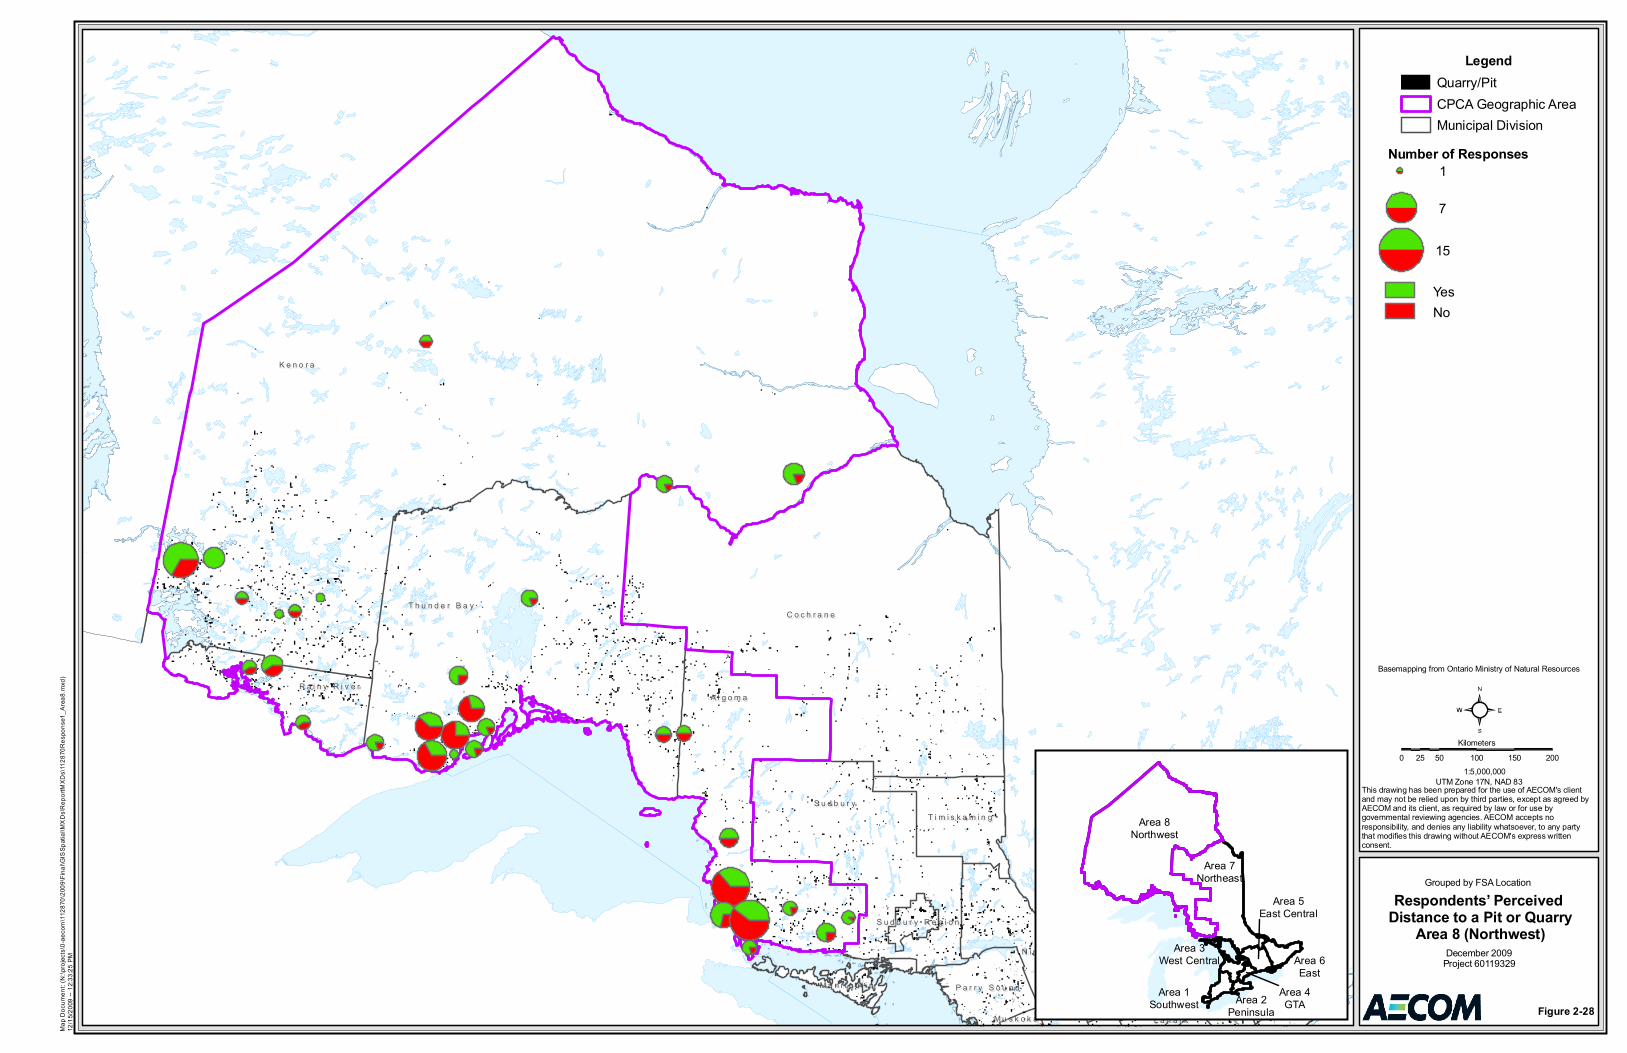
UTM Zone 17N, NAD 83
K e n o r aK e n o r a
C o c h r a n eC o c h r a n eT h u n d e r B a yT h u n d e r B a y
A l g o m aA l g o m a
S u d b u r yS u d b u r y
N i p i s s i n gN i p i s s i n g
R a i n y R i v e rR a i n y R i v e r
T i m i s k a m i n gT i m i s k a m i n g
R e n f r e wR e n f r e wP a r r y S o u n dP a r r y S o u n dM a n i t o u l i nM a n i t o u l i n
S u d b u r y R e g i o nS u d b u r y R e g i o n
O t t a w a - C a r l t o nO t t a w a - C a r l t o nH a l i b u r t o nH a l i b u r t o nM u s k o k aM u s k o k a
P r e s c o t t & R u s s e l lP r e s c o t t & R u s s e l l
L a n a r kL a n a r k
1:5,000,000
Quarry/PitCPCA Geographic AreaMunicipal Division
Map
Doc
umen
t: (N
:\pro
ject
s\0-
aeco
m\1
1287
0\20
09\F
inal
\GIS
Spa
tial\M
XD
s\R
epor
tMX
Ds\
1128
70R
espo
nse1
_Are
a8.m
xd)
12/1
5/20
09 --
12:
33:2
5 P
M
Grouped by FSA Location
Basemapping from Ontario Ministry of Natural Resources
0 50 100 150 20025
Kilometers
Area 8Northwest
Area 7Northeast
Area 6East
Area 5East Central
Area 1Southwest
Area 3West Central
Area 4GTAArea 2
Peninsula
YesNo
1
7
15
December 2009Project 60119329
This drawing has been prepared for the use of AECOM’s client and may not be relied upon by third parties, except as agreed byAECOM and its client, as required by law or for use bygovernmental reviewing agencies. AECOM accepts no responsibility, and denies any liability whatsoever, to any partythat modifies this drawing without AECOM’s express written consent.

(60119329_mnr_ final_dec 19 2009.docx) - 65 -
In order to understand the Ontario public‟s social values, respondents were asked to list the three most important things that they value about their community. A range of answers were given and grouped according to five overall themes. Figure 2-27 displays the proportion of responses, by major theme, and Table 2-23 summarizes the detailed types of responses and their proportions, by major theme.
Note: Percentages sum to more then 100%, since up to three responses were accepted
Source: Intellipulse, 2009
Natural / Environmental
Municipal Infrastructure /
Services
Social Human Other
0
10
20
30
40
50
60
70
80
Pe
rce
nta
ge o
f R
esp
on
ses
(%)

(60119329_mnr_ final_dec 19 2009.docx) - 66 -
% N
Municipal Infrastructure/Services Aspects:
73
Parks/trails 19 (264)
Cleanliness/up keep of community 10 (141)
Municipal services-garbage, social services, taxes, library etc.
8 (111)
Water quality/clean water 7 (93)
Recreational/community center 7 (101)
Infrastructure/highways/roads 6 (90)
Public/transportation 6 (83)
Education/access to schools 5 (75)
Good healthcare/services/EMS, doctors etc.
5 (69)
Nature/Environment Aspects: 41
Green space/trees/wildlife 20 (290)
Clean/fresh air/no pollution 14 (197)
Accessibility to lakes 7 (95)
Social Aspects: 39
Quite neighbourhood/privacy 16 (229)
Community/friendly neighbours 13 (185)
Sense of community/ involvement/ multiculturalism/diversity
6 (86)
Family/family oriented community 4 (63)
Human Aspects: 23
Public safety/personal security 14 (198)
Access to local amenities/ shopping/ entertainment
13 (178)
Small town/village feel 5 (76)
Location-proximity to work/city/others 3 (43)
Job/employment 2 (35)
Other:
Road safety/noise/no heavy trucks 1 (15)
Other 11 (143)
Don‟t know/refused 4 (51)
None/No other issues 1 (55)
Total # of respondents (1420) Note: Percentages sum to more than 100% as more than one response was accepted. Source: Intellipulse, 2009

(60119329_mnr_ final_dec 19 2009.docx) - 67 -
These responses indicate the most important community attributes that are “top-of-mind” to respondents were municipal and infrastructure services including parks and trails (19%), cleanliness of the community (10%) and municipal services (8%). Respondents were asked to rank the relative importance of development and infrastructure projects, including highways, railways, energy facilities and airports as well as residential, commercial and industrial buildings, against the three values previously stated as important to their community‟s well-being. Respondents were asked which of their stated values were more or less important than development and infrastructure projects. It should be noted that some respondents had already stated values related to development an infrastructure projects. The results indicate that:
30% of respondents said that none of their previously stated values were more important that development and infrastructure projects, or that development and infrastructure projects were ranked above the three most important things that affect their community well-being.
72%5 of the respondents said development and infrastructure projects were less important than all of their previously stated values, or that development and infrastructure project were ranked least important of the things that affect their community well-being. This indicates that for this 72% of respondents, development and infrastructure projects are not as important as other things with perceived social benefits (such as cleanliness of their community, clean air, or proximity to the workplace).
In summary, respondents did not consider development and infrastructure projects highly among the things that they value about their community and the things that contribute to their community‟s well-being.
As demonstrated by the economic analysis, the aggregate industry is one of many important industries to the Ontario Province; however it was hypothesized that it may not be one that the Ontario public is very familiar with. To test this hypothesis, respondents were asked several questions about the industry (i.e., the amount of aggregates use in the province, where aggregates are extracted from and how they are transported). The results indicate that there is a relationship between Ontarians social values of aggregates and their familiarity with the aggregate industry. While this study did not investigate the nature of this relationship in detail, the study results shed light onto the public‟s general knowledge of this industry.
5 Note that percentages sum to more than 100%, since some respondents may have said “none” to both questions.
(60119329_mnr_ final_dec 19 2009.docx) - 68 -
According to the Ontario Stone Sand and Gravel Association (OSSGA, 2009) Ontarians consumed, on average, 14 tonnes of aggregates per person per year. Figure 2-29 demonstrates that only 14% of respondents could accurately estimate the amount of aggregate consumed by Ontarians. Most other respondents either could not provide an estimate at all (21%), or severely overestimated (18%) or underestimated (18%) the amount of aggregates consumed by Ontarians.
Source: Intellipulse, 2009
Respondents were also asked where they thought aggregates were being extracted in Ontario (i.e. the general location of pits or quarries). Table 2-24 summarizes these responses.
Don't know21%
1 - 518%
6 - 1019%
11 - 1514%
16 - 2010%
More than 2018%

(60119329_mnr_ final_dec 19 2009.docx) - 69 -
% n
Within 25 km of where you live
49 (698)
Within 100 km of where you live
38 (535)
In Northern Ontario 30 (423)
In Southern Ontario 22 (318)
Outside of Ontario 13 (186)
Don't know/not sure 8 (107)
Total # of respondents (1420) Note: Percentages sum to more than 100% as more than one response was accepted. Source: Intellipulse, 2009
These results indicate that nearly 50% of the respondents thought that pits are located within 25 km of where they live, while MNR (2009) data indicates that all of the respondents (100%) do in fact live within 25 km of an aggregate pit or quarry. Finally, respondents were asked to rank three modes of transportation used to transport aggregate resources, in order of frequency of use. These were sea, rail and road transport. Table 2-25 summarizes these responses.
Transport type:
Rank: % n
Truck
1 75 (1060)
2 13 (181)
3 13 (178)
Rail
1 18 (263)
2 58 (817)
3 24 (341)
Sea or Lake
1 7 (97)
2 30 (422)
3 63 (901)
Total (1420)
Note: Percentages may not sum to 100% due to rounding. 1 is the most commonly used transportation mode, 3 the least. Source: Intellipulse, 2009

(60119329_mnr_ final_dec 19 2009.docx) - 70 -
These results indicate that most respondents are aware that truck transport is most frequently used to transport aggregates. In summary, it can be concluded that respondents are not very familiar with the aggregate industry. Although their awareness of transport methods is largely accurate, their knowledge of the locations of pits and quarries and the amounts of aggregates used per person, per year is much less accurate.
The social benefits of aggregate resources were also investigated. As previously mentioned, 72% of respondents considered development and infrastructure projects as being less important than other important things or attributes that contribute to their community‟s well-being. However, when asked to rate the importance of various types of development and infrastructure projects, some were considered more important than others. These responses are summarized in Figure 2-31.
Source: Intellipulse, 2009
0 20 40 60 80 100
Airports In ON
Industrial Buildings
Residential Buildings
Railways
New Highways or Roads
Energy Facilities
Institutional Buildings
Maintain or Repair Highways and …
Very Important
Somewhat Important
Not Sure
Not Very Important
Not at All Important
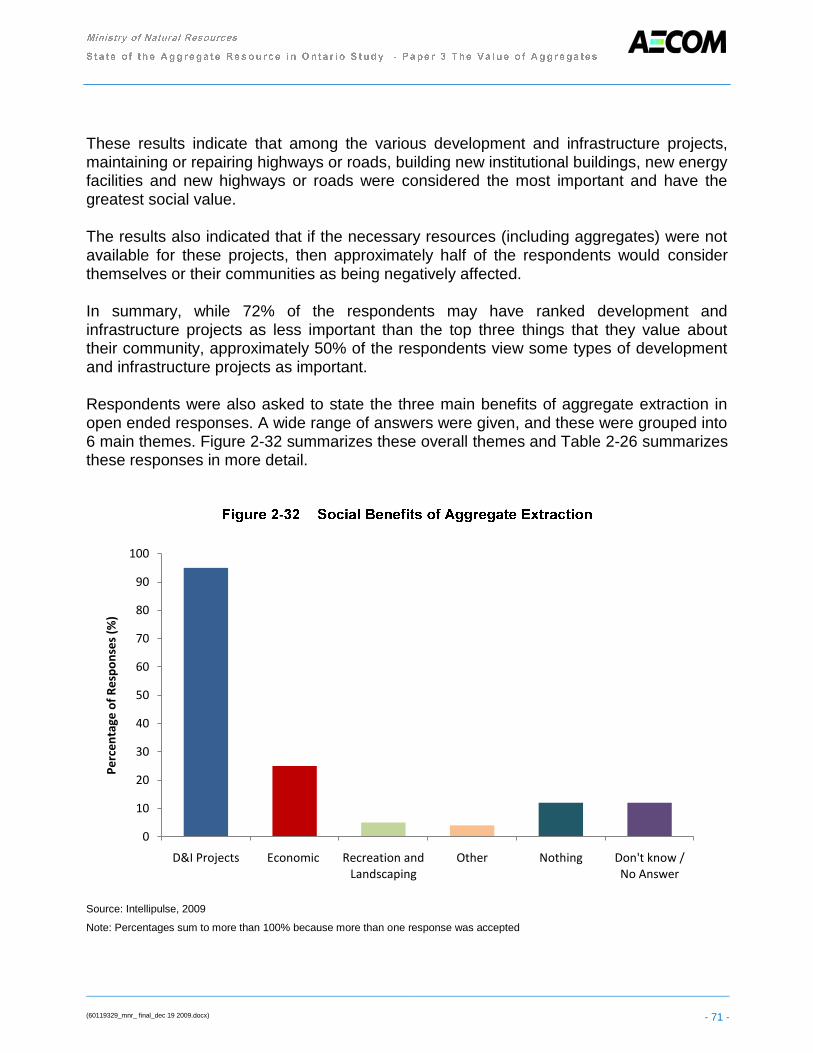
(60119329_mnr_ final_dec 19 2009.docx) - 71 -
These results indicate that among the various development and infrastructure projects, maintaining or repairing highways or roads, building new institutional buildings, new energy facilities and new highways or roads were considered the most important and have the greatest social value. The results also indicated that if the necessary resources (including aggregates) were not available for these projects, then approximately half of the respondents would consider themselves or their communities as being negatively affected.
In summary, while 72% of the respondents may have ranked development and infrastructure projects as less important than the top three things that they value about their community, approximately 50% of the respondents view some types of development and infrastructure projects as important. Respondents were also asked to state the three main benefits of aggregate extraction in open ended responses. A wide range of answers were given, and these were grouped into 6 main themes. Figure 2-32 summarizes these overall themes and Table 2-26 summarizes these responses in more detail.
Source: Intellipulse, 2009
Note: Percentages sum to more than 100% because more than one response was accepted
0
10
20
30
40
50
60
70
80
90
100
D&I Projects Economic Recreation and Landscaping
Other Nothing Don't know / No Answer
Pe
rce
nta
ge o
f R
esp
on
ses
(%)

(60119329_mnr_ final_dec 19 2009.docx) - 72 -
% n
Infrastructure & Development Projects: 95
Provision of materials/construction of buildings/homes 36 (513)
Improve infrastructure/better roads/highways/railway 35 (498)
Availability of materials/local 9 (129)
Use of raw materials/natural resources 7 (93)
Need it/necessary 4 (61)
Cheap materials/resources 2 (32)
Improve/development of the community 2 (23)
Economic Benefits: 25
Job creation/employment 18 (250)
Economic development 5 (66)
Industrial growth/support the local/regional industry 2 (23)
Recreation/Landscaping Projects: 5
Landscaping/beaches 3 (38)
Can create lakes/drainage 2 (23)
Other 4 (60)
Other - Negative: 12
None 8 (109)
Negative impact 4 (58)
Don’t know/refused 12 (168)
Total # or respondents (1420) Note: Percentages sum to more than 100% as more than one response was accepted. 0% indicates less than 0.5%. Source: Intellipulse, 2009
Table 2-26 indicates that 95% of the respondents view the value of aggregates in relation to its uses in development and infrastructure projects. These respondents view it as necessary for construction and infrastructure improvements. 25% of the respondents
stated that aggregate extraction had related economic benefits, such as job creation and input to economic development and 12% of the respondents stated that there were no positive or social benefits of aggregate extraction In summary, the respondents view many types of development and infrastructure projects as important to them, and they view the main benefits of aggregate extraction in relation to these development and infrastructure projects and in relation to the economic impacts of the industry.

(60119329_mnr_ final_dec 19 2009.docx) - 73 -
The views of Ontarians regarding the social costs of aggregates were determined from the telephone questionnaire and also through content analyses of public comments related to aggregate sites and licence applications. These results are presented here separately.
2.3.5.1 Results of the Telephone Survey
Respondents were a asked to state the three main costs of aggregate extraction in open
ended responses. A wide range of answers were given, and these were grouped into 6 main themes. Figure 2-33 summarizes these overall themes and Table 2-27 summarizes these responses in more detail.
Note: Percentages sum to more than 100% since more than one response was accepted
Source: Intellipulse, 2009
0
10
20
30
40
50
60
Environmental Effects
Nuisance Effects Human Effects Nothing Other Don't know / No Answer
Pe
rce
nta
ge o
f R
esp
on
ses
(%)

(60119329_mnr_ final_dec 19 2009.docx) - 74 -
% n
Environmental Effect: 56
Holes/pits/left behind/no rehabilitation 13 (181)
Water tables are exposed/contaminate water 9 (130)
Destruction of the natural environment 9 (126)
Disruption of wild life/animal habitat 7 (105)
Eroding of earth/digging up land 6 (87)
Blasting/destroying non-renewable resources 4 (63)
Destroys agricultural/topsoil 3 (49)
Removal of trees/forestry/greenery 3 (42)
Disruption of the ecosystem 2 (31)
Changes the climate/global warming 0 (7)
Nuisance Effect: 50
Dust/sand/dirt 11 (158)
Noise from trucks/machinery 11 (157)
Heavy/trucks/damages the road 8 (116)
Disruption of scenery/an eye sore 8 (114)
Trucks create traffic on the road 5 (64)
Damages the surrounding communities/ residential areas
5 (68)
Trucks throw stones/gravel damaging other vehicles 2 (30)
Human Effect: 16
Pollution/poor air quality affecting human health 13 (179)
Health risks for workers/residents 3 (48)
Nothing/none 7 (104)
Other 6 (87)
Don’t know/refused 16 (230)
Total # of respondents (1420) Note: Percentages sum to more than 100% as more than one response was accepted. O% indicates less than .5%. Source: Intellipulse, 2009
These results indicate that 56% of the respondents said that environmental effects were the main social cost of aggregate extraction. This includes a lack of site rehabilitation, water contamination and a destruction of habitat. Half (50%) of the respondents stated nuisance effects as a social cost of aggregate extraction, including dust and noise nuisance effects and 7% of the respondents said that there were no social costs of aggregate extraction.

(60119329_mnr_ final_dec 19 2009.docx) - 75 -
2.3.5.2 Results of the Content Analyses of MNR and OMB Data
Public comments from MNR site licence applications and from OMB hearings (2001-2009) were reviewed and coded according to common themes. For the former, the most recent 31 site licence applications were provided to AECOM by the MNR and public comments were reviewed from these 31 files. Of those 31, 14 site licences contained public comments. All comments were reviewed and coded according to major recurrent themes. Members of the public expressed numerous concerns regarding the development and operation of proposed pits and quarries. The OMB hearing data were retrieved from the OMB website, under a general search for “aggregate”. Records were screened for relevance, yielding 76 records. Each of these were coded and numerated using the same major themes as the MNR site licence applications. In some cases, new themes were created as the types of public comments differed slightly between the MNR and the OMB data. The top three concerns for the OMB hearing data were in relation to groundwater contamination, water resources contamination and traffic/truck volume. Figure 2-32 summarizes the results of the content analyses, for the OMB and MNR data. It should be noted that only the top 10 most frequent results are noted in this figure.

(60119329_mnr_ final_dec 19 2009.docx) - 76 -
Source: AECOM, 2009
There is a wide range of types of public complaints regarding aggregate operations and licence applications. These indicate the types of social costs associated with aggregate extraction. From a combination of the MNR and OMB data, it is clear that the three most frequently reported public complaints are regarding noise pollution, truck traffic and volume and air pollution and dust.
The MNR site licence applications also detailed proposed or actual resolutions to the public complaints. For many of the proposed development projects, the proponents held meetings in order to address the public concerns. Issues were addressed and communicated thorough letters and telephone calls between the proponent and members of the public. Comments were also addressed through letters, describing mitigation measures that will be put in place in order to minimize the social and environmental impacts. In some cases, attempts were made to address public concerns through a
0
20
40
60
80
100
120
140
160
180
Nu
mb
er
of
Co
nce
rns
OMB Hearings 2001-2009
MNR Applications
(60119329_mnr_ final_dec 19 2009.docx) - 77 -
reduction of the licenced area and creation of a greater buffer area between the licenced pit/quarry and the residential development, removing a haul road through an Environmentally Sensitive Area (ESA) and inclusion of additional noise monitoring of dust deposition around the perimeter of the Environmentally Sensitive Areas (ESA). In many cases, public concerns and proposed monitoring measures were implemented to the site plans of the proposed quarry developments and mitigation measures were included as well.
2.3.5.3 Results from the NEC Case Files
The Niagara Escarpment Commission (NEC) provided AECOM with a sample of case files, which included public comments, letters, and summaries for cases related to aggregate operations, dating back to 2001. The files were reviewed in order to understand key and recurring themes. This is not a representative sample of all of the aggregate licence applications on the Niagara Escarpment, but rather a sample of approximately 9 cases. Therefore, conclusions about the public comments from the NEC case files cannot be drawn from this small sample. However, they do highlight some (but not all) of the recurrent themes. These were:
Environmental - relating to the use and enjoyment of the local area and the intrinsic value of nature and the surrounding environment.
Economic – relating to impacts on economic opportunities
Social – relating to noise, nuisance and community character issues. A small proportion of the comments were related to the benefits of aggregate extraction in the Niagara Escarpment. These were grouped into two themes, which were:
Social Benefits - relating to infrastructure and access to services
Economic Benefits - relating to employment and expenditures
The majority of the comments received in support of a new quarry operation or expansion were made by local business owners or affiliates whose business would be positively affected. Overall, from these nine case files, the concerns with negative impacts were much more common than the comments that documented potential positive benefits.
(60119329_mnr_ final_dec 19 2009.docx) - 78 -
Perceived Direct Experience (PDE) was one of the variables used in cross-tabular analyses. Respondents who reported that they live near a pit or quarry or near a truck transportation route formulated groups of respondents that were stated to have a PDE with the aggregate industry. Those respondents that stated they or someone in their household was employed by the aggregate or a related industry were not included as a group of respondents with a PDE since the number of respondents in this category was too low to conduct any statistical analyses. Cross tabular analyses were run for all groups with a PDE for every question in the telephone survey. This section summarizes all of the statistically significant results, by PDE.
2.3.6.1 Respondents that Live near a Pit or Quarry
Less likely to name parks and trails as important things they value about their community (14%).
More likely to say they live within 25km of a pit or quarry (76%).
More likely to rank truck transportation higher as a mode of aggregate transportation (82%).
More likely to name nuisance effects as a social cost of aggregate extraction (61%).
2.3.6.2 Respondents that Live near an Aggregate Truck Transportation Route
More likely to say they live within 25km of a pit or quarry (72%).
More likely to rank truck transportation higher as the main mode of aggregate transportation (82%).
More likely to state economic aspects as a social benefit of aggregate extraction (33%).
2.3.6.3 Respondents that do not live near a Pit or Quarry
More likely to highly rank rail transportation higher as a mode of aggregate transportation (21%).
2.3.6.4 Respondents that do not live near an Aggregate Truck Transportation Route
More likely to highly rank rail transportation higher as a mode of aggregate transportation (21%).
(60119329_mnr_ final_dec 19 2009.docx) - 79 -
In summary, respondents that live near a pit or quarry were more likely to name nuisance effects as a social cost of aggregate extraction. However, respondents that live near an aggregate truck transportation route were more likely to state that the economic aspects of aggregate extraction as a social benefit.
The samples for the telephone survey were drawn from the eight Portland Cement Regions of Ontario (Figure 1-1). Table 2-29 summarizes the sample sizes within each of the eight regions. The sample yielded overall results with an accuracy of +/- 2.6%, 19 out of 20 times, for all of Ontario. Geographical location was another grouping used in cross tabular analysis for each question of the survey. This section presents all statistically significant difference, by CPCA geographic area.
2.3.7.1 Area 1 – Southwest
More likely to name parks/trails as important aspects of their community (22%).
More likely to rank sea transport first in terms of modes of aggregate transportation used (13%).
2.3.7.2 Area 2 – Peninsula
More likely to state that pits and quarries are located within 25 km of where they live (71%).
2.3.7.3 Area 3 - West Central
More likely to state that pits are quarries are located within 25 km of where they live (73%).
More likely to rank truck transport highest in terms of modes of aggregate transportation used (86%).
More likely to state nuisance effects as a social cost of extraction (69%).
2.3.7.4 Area 4 – GTA
More likely to name parks/trails as important aspects of their community (22%).
More likely to rate building new institutional buildings as high in importance (47%).
More likely to state that pits and quarries are located in Northern Ontario (36%).
(60119329_mnr_ final_dec 19 2009.docx) - 80 -
More likely to rank rail transport higher in terms of modes of aggregate transportation used (25%).
Less likely to say they live near a pit or quarry (18%).
Least likely to state that pits and quarries are located within 25 km of where they live (30%).
2.3.7.5 Area 5 - East Central
More likely to say they live near a pit or quarry (58%).
More likely to state that pits and quarries are located within 25 km of where they live (65%).
More likely to rank truck transport higher in terms of modes of aggregate transportation used (87%).
Less likely to name parks/trails as important aspects of their community (7%).
2.3.7.6 Area 6 – East
More likely to state that pits and quarries are located within 25 km of where they live (64%).
More likely to state that D&I Projects and improvements to infrastructure are a benefit of aggregate extraction (45%).
2.3.7.7 Area 7 – Northeast
More likely to say they live near a pit or quarry (58%).
More likely to rate building new highways or roads as high in importance (47%).
More likely to rate building new residential buildings as high in importance (17%).
More likely to rate building new airports as high in importance (16%).
More likely to state that pits are quarries are located within 25 km of where they live (68%).
More likely to state that pits are quarries are located in Northern Ontario (34%).
More likely to state that D&I Projects and improvements to infrastructure are a benefit of aggregate extraction (40%).
(60119329_mnr_ final_dec 19 2009.docx) - 81 -
2.3.7.8 Area 8 - Northwest
More likely to say that nature/environmental aspects are more important that D&I projects (13%).
More likely to rate building new highways or roads as high in importance (51%).
More likely to rate building new residential buildings as high in importance (18%).
More likely to rate building new industrial buildings as high in importance (34%).
More likely to rate building new airports as high in importance (18%).
More likely to state that pits and quarries are located within 25 km of where they live (65%).
More likely to state that pits and quarries are located in Northern Ontario (40%).
More likely to state that there are no social costs of extraction (20%).
Less likely to name parks/trails as important aspects of their community (5%).
Two of the more critical questions of the survey addressed the social costs and benefits of aggregate extraction. These results were tabulated by geographic area and are illustrated in Figures 2-35 and 2-36. Those responses with significant differences are noted with an asterisk. Based on the findings from the geographical variation study we can infer from the results that respondents who live in an urban such as Area 4 – GTA, rate parks and trails as an important aspect of their community. Also, respondents from Area 4 - GTA highlighted new institutional buildings as important. Based on these responses we can infer that respondents do not rate development and infrastructure projects, with the exception of institutional buildings, as high importance. Respondents from Area 3 – West Central are more likely to link social costs such as nuisance effects with aggregate extraction. Respondents who live in the far northeast and northwest areas of the Portland Cement Regions such as Area 7 and 8 are most likely to name development and infrastructure projects as a benefit of aggregate extraction. It is interesting to note that residents in the Northwest, Area 8, are more likely to say there are no social costs of aggregate extraction.

Map Document: (N:\projects\0-aecom\112870\2009\Final\GISSpatial\MXDs\ReportMXDs\112870PerceivedSocialCost.mxd)12/15/2009 -- 10:23:19 AM
Area 8Northwest
Area 7Northeast
Area 6EastArea 5
East Central
Area 1Southwest
Area 3West Central
Area 4GTA
Area 2Peninsula
UTM Zone 17N, NAD 83
1:6,500,000
Perceived Scocial Costsof Aggregate Extraction
by CPCA Geographic Area
Legend
Nuisance EffectHuman EffectEnvironmentalNo Social CostOther
CPCA Geographic Areas
Figure 2-35
Basemapping from Ontario Ministry of Natural Resources
0 100 200 300 40050
Kilometers
Statistically Significant
December 2009Project 60119329
This drawing has been prepared for the use of AECOM’s client and may not be relied upon by third parties, except as agreed byAECOM and its client, as required by law or for use bygovernmental reviewing agencies. AECOM accepts no responsibility, and denies any liability whatsoever, to any partythat modifies this drawing without AECOM’s express written consent.

Map Document: (N:\projects\0-aecom\112870\2009\Final\GISSpatial\MXDs\ReportMXDs\112870PerceivedSocialBenifit.mxd)11/05/2009 -- 9:58:27 AM
Area 8Northwest
Area 7Northeast
Area 6EastArea 5
East Central
Area 1Southwest
Area 3West Central
Area 4GTA
Area 2Peninsula
UTM Zone 17N, NAD 83
1:6,500,000
Perceived Scocial Benefitsof Aggregate Extraction
by CPCA Geographic AreaDecember 2009
Project 60119329
Legend
Infastructure & DevelopmentEconomicRecreational/LandscapeNo Social BenefitOther
CPCA Geographic Areas
Figure 2-36
This drawing has been prepared for the use of AECOM’s client and may not be relied upon by third parties, except as agreed byAECOM and its client, as required by law or for use bygovernmental reviewing agencies. AECOM accepts no responsibility, and denies any liability whatsoever, to any partythat modifies this drawing without AECOM’s express written consent.
Basemapping from Ontario Ministry of Natural Resources
0 100 200 300 40050
Kilometers
Statistically Significant
(60119329_mnr_ final_dec 19 2009.docx) - 84 -
An ecosystem is a dynamic complex of plant, animal and microorganism communities and the nonliving environment interacting as one functional unit providing services necessary for life (MA, 2005). Ecosystem services are benefits that people obtain from ecosystems and, which is categorized into four types by the Millennium Ecosystem Assessment (MA, 2005). These include:
Provisioning Services o Products obtained from ecosystems (e.g. food and fuel)
Regulating Services o Benefits obtained from regulation of ecosystems processes (e.g. water
purification)
Cultural Services o Nonmaterial benefits from ecosystem (e.g. recreation and ecotourism)
Supporting Services o Services necessary for the production of all other ecosystem services (e.g.
soil formation, nutrient cycling) These ecosystem services are constantly changing due to climate, disturbance regimes and time (age of the ecosystem). Human disturbance has the greatest capacity for creating change to an ecosystem and its services in the shortest amount of time. Human modification of the environment can result in changes to the availability and efficiency of ecosystem services which will create an impact to human health and welfare and natural ecosystems. Identification of ecosystem services provides a tool that provides language to aid our understanding of these complex systems, facilitates management actions to maintain them, and provides an opportunity to apply economic models to evaluate these services in order to better quantify their importance to social and economic systems. The mining of aggregates often results in major alterations to the landscape. While extraction activities creates change to the ecosystem services provided by the overlying land uses, the aggregates themselves can be used in processes that create ecosystem value, and rehabilitation plans may ultimately replace the services removed. For example, a licence that initially provided services associated with forest and agriculture may transition through meadow and transform into services associated with lakes and meadows as a result of the identified rehabilitation plan. Since we do not directly pay for ecosystem services it is difficult to assign a dollar value for their loss. We tend to take their benefits for granted. In the past 50 years humans have changed the Earth‟s ecosystems more rapidly and extensively than in any other period in human history (MA, 2005). This is a result of increased population which leads to more development which requires more resources and therefore more change to the landscape. There are indications that we no longer have the natural resources to replace forests, once thought to be renewable due to the effects of acid rain leaching essential nutrients from the
(60119329_mnr_ final_dec 19 2009.docx) - 85 -
soil. Statistics Canada (2009c) has shown an average population increase of 1.1% in Ontario from 2004 to 2008 which correlates with the consumption of more and more aggregates (Stats Can, 2009c). The Ontario Aggregate Resources Act (ARA) and Regulation 244/97, defines aggregates as gravel, sand, clay, earth, shale, stone, limestone, dolostone, sandstone, marble, granite, rock or other prescribed material (ARA, 1990). Aggregates constitute the largest, by tonnage, nonfuel mineral commodities currently inventoried in North America (Poulin et al., 1994). They are used to build and maintain our houses, offices, roads, schools and
hospitals; provide a firm foundation for railways, used to construct factories, warehouses and shops and can protect us against flooding (BGS, 2008). Aggregate production is one of the most important mining industries in the world; annual worldwide aggregate production totals about 16.5 billion tonnes, or more than $70 billion (Langer et al., 2004). Aggregates are necessary in today‟s society because they are used
to build and maintain a variety of urban, suburban and rural infrastructures such as buildings, roadways, water storage, filtration and delivery systems, wastewater collection and treatment systems (BGS, 2008; Langer et al., 2004).
In the province of Ontario, the demand for aggregate is ever increasing due to the affluent construction industry which requires more and more aggregate for production. In 2007 Ontario produced approximately 181 million tonnes of stone, sand and gravel (including recycling), with a large proportion of this going to construction (TOARC, 2009). The construction of a new road can consume over 15,000 tonnes of aggregate per kilometre for a local two-lane highway, and up to 48,000 tonnes for each kilometre of a six-lane asphalt freeway, not to mention the tonnage of aggregate used to rehabilitate and maintain Ontario‟s current provincial highway network (Environmental Commissioner of Ontario, 2002-2003). The Ontario Sand, Stone and Gravel Association (2009) predict that the consumption of aggregate in Ontario will total approximately 4 billion tonnes in the next 25 years.
Aggregates directly provide some of the supporting, provisioning, regulating and cultural services that directly affect people. The following sections provide a breakdown of the contribution of products of aggregate extraction to create ecosystem services.
Aggregates are used for a wide range of purposes. For the purposes of this paper, the identification of the ecosystem services provided by the rock, stone, gravel, etc. was confined to the first order or primary uses. The rehabilitation of a pit or quarry to a golf course was identified as a primary spatial benefit, but the health and recreation benefits (secondary or indirect benefits) associated with the use of the golf course could not be attributed to the aggregate extraction directly.
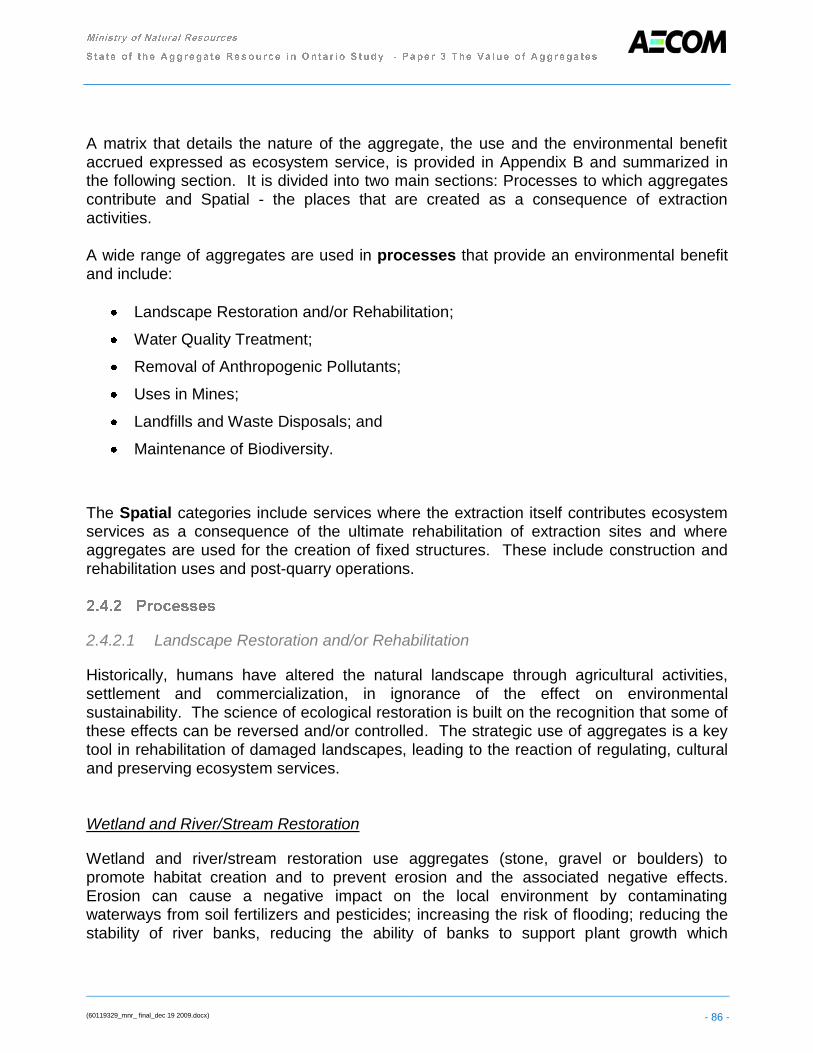
(60119329_mnr_ final_dec 19 2009.docx) - 86 -
A matrix that details the nature of the aggregate, the use and the environmental benefit accrued expressed as ecosystem service, is provided in Appendix B and summarized in the following section. It is divided into two main sections: Processes to which aggregates contribute and Spatial - the places that are created as a consequence of extraction activities. A wide range of aggregates are used in processes that provide an environmental benefit and include:
Landscape Restoration and/or Rehabilitation;
Water Quality Treatment;
Removal of Anthropogenic Pollutants;
Uses in Mines;
Landfills and Waste Disposals; and
Maintenance of Biodiversity.
The Spatial categories include services where the extraction itself contributes ecosystem services as a consequence of the ultimate rehabilitation of extraction sites and where aggregates are used for the creation of fixed structures. These include construction and rehabilitation uses and post-quarry operations.
2.4.2.1 Landscape Restoration and/or Rehabilitation
Historically, humans have altered the natural landscape through agricultural activities,
settlement and commercialization, in ignorance of the effect on environmental sustainability. The science of ecological restoration is built on the recognition that some of these effects can be reversed and/or controlled. The strategic use of aggregates is a key tool in rehabilitation of damaged landscapes, leading to the reaction of regulating, cultural and preserving ecosystem services. Wetland and River/Stream Restoration
Wetland and river/stream restoration use aggregates (stone, gravel or boulders) to promote habitat creation and to prevent erosion and the associated negative effects. Erosion can cause a negative impact on the local environment by contaminating waterways from soil fertilizers and pesticides; increasing the risk of flooding; reducing the stability of river banks, reducing the ability of banks to support plant growth which

(60119329_mnr_ final_dec 19 2009.docx) - 87 -
decreases biodiversity; and increases the loss of nutrients, soil organic matter and soil biota. Boulders, rocks and stone can be used for restoring diminished habitat for a variety of smaller creatures, such as crayfish, invertebrates and a variety of fish. Animals take advantage of holes and crevices within these aggregates as shelter from predators while providing more habitat niches leading to increased biodiversity. In addition, habitat connectivity can be promoted by using aggregates for building wildlife overpasses, underpasses and other connectivity structures to help maintain corridors for animals from one natural area to another. In addition to enhancements for wildlife, both terrestrial and aquatic, enhancement of human recreation and tourism facilities (e.g. paths and arenas) often occur in association with landscape restoration. These benefits are important aesthetically and improve connectivity among neighbourhoods. Ecosystem services identified include: Regulating Services
Water quality
Water quantity
Natural Hazard Control
Cultural Services
Aesthetics
Recreation and Tourism
Preserving Services
Biodiversity
Connectivity
Agricultural Land (soil aggregate stability)
Aggregates are used in agricultural practices through the incorporation of different types of material into the soils to change the structure and water holding capacity. Sand is essential for good drainage and clay holds water, nutrients and minerals in the soil; both necessary for good crop production. Soils can serve as a filter to prevent pollutants from contaminating groundwater (Hairston et al. 2001). In turn crop production leads to many
supporting ecosystem services. Ecosystem services identified include: Supporting Services
Soil formation
Nutrient Cycling
Water Cycling
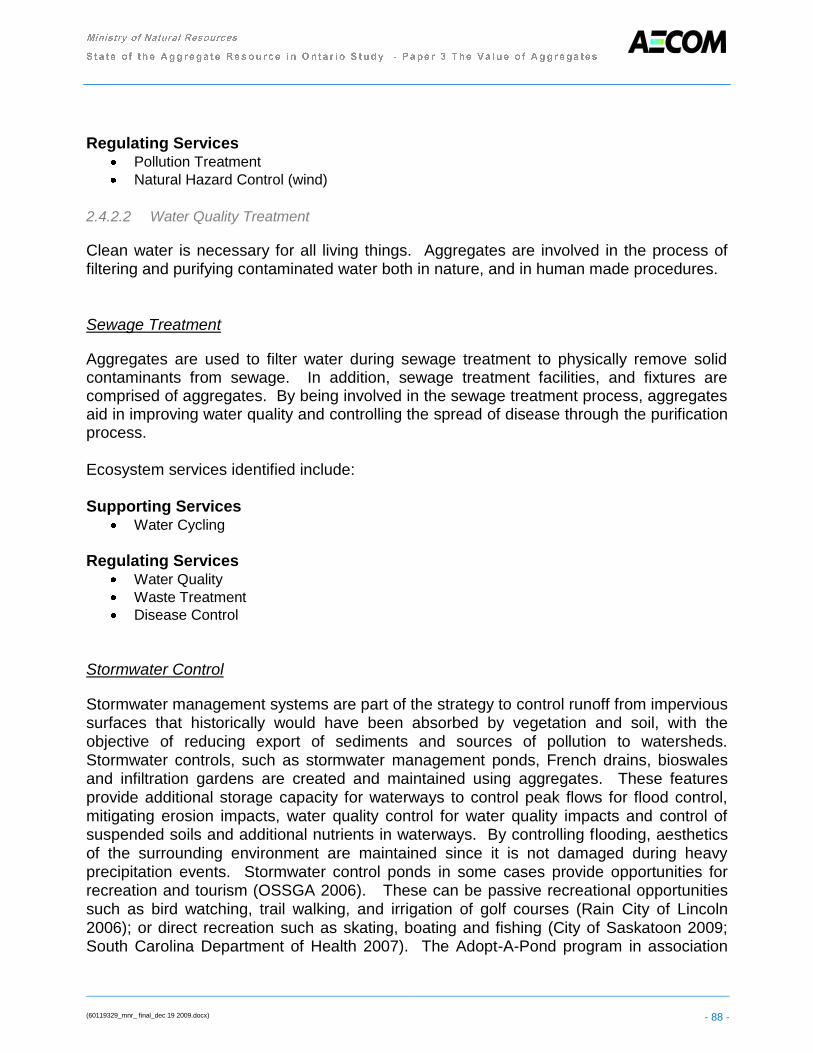
(60119329_mnr_ final_dec 19 2009.docx) - 88 -
Regulating Services Pollution Treatment
Natural Hazard Control (wind)
2.4.2.2 Water Quality Treatment
Clean water is necessary for all living things. Aggregates are involved in the process of filtering and purifying contaminated water both in nature, and in human made procedures.
Sewage Treatment
Aggregates are used to filter water during sewage treatment to physically remove solid contaminants from sewage. In addition, sewage treatment facilities, and fixtures are comprised of aggregates. By being involved in the sewage treatment process, aggregates aid in improving water quality and controlling the spread of disease through the purification process. Ecosystem services identified include: Supporting Services
Water Cycling
Regulating Services
Water Quality
Waste Treatment
Disease Control
Stormwater Control
Stormwater management systems are part of the strategy to control runoff from impervious surfaces that historically would have been absorbed by vegetation and soil, with the objective of reducing export of sediments and sources of pollution to watersheds. Stormwater controls, such as stormwater management ponds, French drains, bioswales and infiltration gardens are created and maintained using aggregates. These features provide additional storage capacity for waterways to control peak flows for flood control, mitigating erosion impacts, water quality control for water quality impacts and control of suspended soils and additional nutrients in waterways. By controlling flooding, aesthetics of the surrounding environment are maintained since it is not damaged during heavy precipitation events. Stormwater control ponds in some cases provide opportunities for recreation and tourism (OSSGA 2006). These can be passive recreational opportunities such as bird watching, trail walking, and irrigation of golf courses (Rain City of Lincoln 2006); or direct recreation such as skating, boating and fishing (City of Saskatoon 2009; South Carolina Department of Health 2007). The Adopt-A-Pond program in association

(60119329_mnr_ final_dec 19 2009.docx) - 89 -
with the Toronto Zoo, has established many stormwater control ponds in the GTA including the large stormwater control pond in Millikin Park, Scarborough located at Steels Avenue and McCowan Road, which is used for fishing and non-motorized boating in the summers as well as the trail systems year round (Toronto Zoo 2009). Ecosystem services identified include: Supporting Services
Nutrient Cycling
Water Cycling
Regulating Services
Water Quality
Water Quantity
Pest Control (-)
Natural Hazard Control
Cultural Services
Aesthetics (both +/-)
Sense of place
Recreation and Tourism
2.4.2.3 Removal of Anthropogenic Pollutants
Some aggregates can be used to remove certain environmental pollutants; reducing the amount of stress that humans put on the environment. The most prevalent aggregate used for chemical pollutant removal is limestone because of its reactive nature with acidic contaminants. Flue Gas Desulfurization
Limestone or lime is used for removing sulfur dioxide produced from exhaust flue gases caused by burning coal or oil, thereby cleaning the air and reducing associated pollution. This process reduces the amount of sulfur dioxide in the natural environment (air and water) contributing a variety of regulating ecosystem services (Schnelle & Brown, 2001). Ecosystem services identified include: Supporting Services
Nutrient Cycling
Regulating Services
Air Quality
Climate Regulation
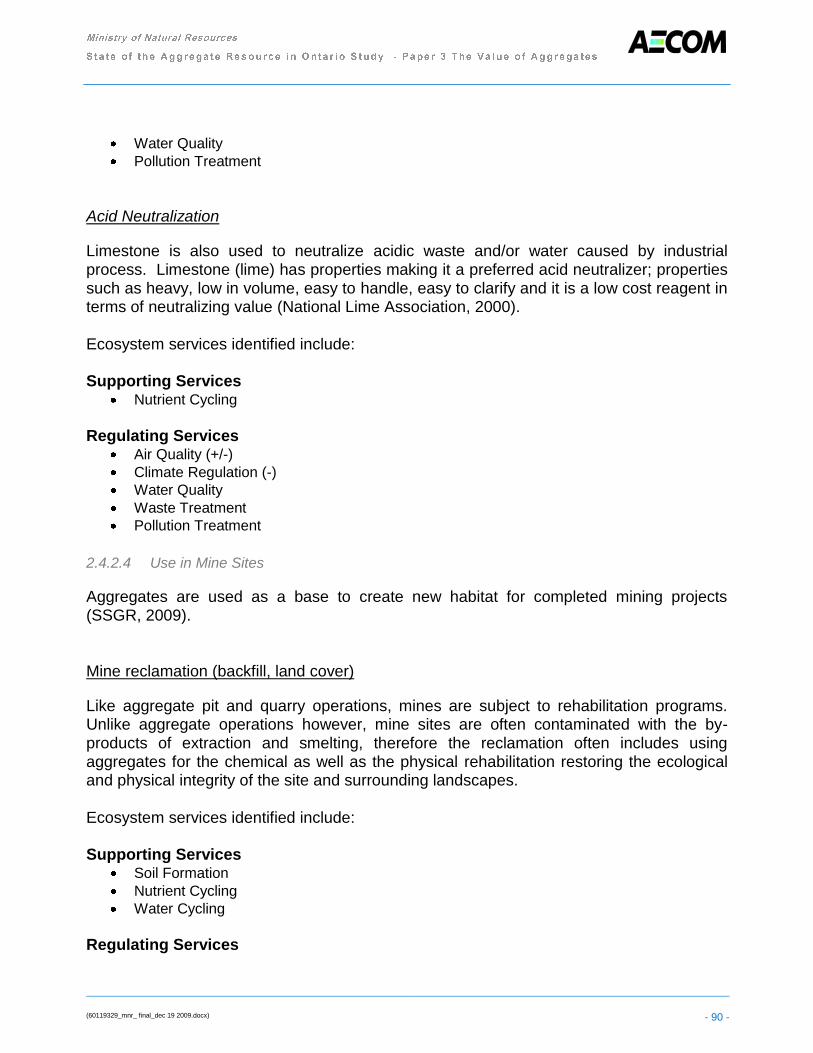
(60119329_mnr_ final_dec 19 2009.docx) - 90 -
Water Quality
Pollution Treatment
Acid Neutralization
Limestone is also used to neutralize acidic waste and/or water caused by industrial process. Limestone (lime) has properties making it a preferred acid neutralizer; properties such as heavy, low in volume, easy to handle, easy to clarify and it is a low cost reagent in terms of neutralizing value (National Lime Association, 2000). Ecosystem services identified include: Supporting Services
Nutrient Cycling
Regulating Services
Air Quality (+/-)
Climate Regulation (-)
Water Quality
Waste Treatment
Pollution Treatment
2.4.2.4 Use in Mine Sites
Aggregates are used as a base to create new habitat for completed mining projects (SSGR, 2009). Mine reclamation (backfill, land cover)
Like aggregate pit and quarry operations, mines are subject to rehabilitation programs. Unlike aggregate operations however, mine sites are often contaminated with the by-products of extraction and smelting, therefore the reclamation often includes using aggregates for the chemical as well as the physical rehabilitation restoring the ecological and physical integrity of the site and surrounding landscapes. Ecosystem services identified include: Supporting Services
Soil Formation
Nutrient Cycling
Water Cycling
Regulating Services

(60119329_mnr_ final_dec 19 2009.docx) - 91 -
Water Quality
Water Quantity
Natural Hazard Control
Cultural Services
Recreation and Tourism
Coal Mine Dusting to Prevent Explosions
Due to limestone‟s chemical composition it can be used to prevent explosions during the coal mining process. If an explosion occurs the limestone dust mixes with the coal dust inhibiting flame propagation by acting as a thermal inhibitor (Man & Teacoach, 2009). Ecosystem services identified include: Cultural Services
Health and Safety
2.4.2.5 Landfills and Waste Disposal
It is important to localize anthropogenic waste so the impact to the environment is contained in a smaller area. Leachate from landfills can contain a variety of contaminats such as toxic metals, organics, high concentrations of ammonia, and pathogenic microorganisms. The leachate collection layer is comprised of washed drain gravel or crushed glass cullet and is used to drain leachate into holding tanks for treatment (NIST, 1997). Like leachate collection, aggregates are used in a similar manner to collect gas and reduce its movement throughout and out of the landfill site. Gas is collected by way of gravel filled trenches which allow upward movement of gas, which is collected and later burned off (NIST, 1997).
Aggregates, namely clay, sand and crushed stone, are used to cover landfills preventing leachate formation. Depending on the strategy for long term management of the site, landfills are covered with clay to decrease the amount of precipitation entering the site and becoming contaminated, or in some cases, covered with sands to allow infiltration which compresses the refuse and increases the life span of the landfill (e.g., Keele Valley Landfill, City of Vaughan). In this case, the leachate from the landfill must be collected and treated, a process which also relies on aggregates as part of the process. Limestone aggregate is used in the treatment of leachate to neutralize its acidity, helping to promote water and air quality. Ecosystem services identified include:

(60119329_mnr_ final_dec 19 2009.docx) - 92 -
For Leachate Collection
Supporting Services Water Cycling
Regulating Services
Water Quality
Pollution Treatment
Disease Control
For Gas Collection
Provisioning Services Fuel/Energy
Regulating Services Air Quality
Climate Regulation
Pollution Treatment
For Cover and Protection
Regulating Services Water Quality
Disease Control
Natural Hazard Control
Cultural Services Health and Safety
For Leachate pH Adjustment
Regulating Services Air Quality
Water Quality

(60119329_mnr_ final_dec 19 2009.docx) - 93 -
2.4.2.6 Maintenance of Biodiversity
Provision of artificial disturbance regimes
Human activities have created waves of landscape scale disturbances, but never before have natural disturbance regimes been as controlled due to suppression of fire, control of flooding, and construction that resists the effects of severe wind. Since the 1950s the landscape of Ontario has been recovering from widespread deforestation and shifting toward extensive urbanization and away from agriculture as more and more farmers move
to the cities. As landscapes stabilize and disturbance regimes (fire, wind) are controlled, habitats that are created by disturbance are declining. Grassland species are among the rarest in the landscape, and those associated with intermediate disturbance regimes, such as species that are disturbance dependant (Golden-winged Warbler; Prairie Cinquefoil; Olympia Marblewing). Aggregate production provides a controlled activity that can target the sequential restoration of habitats for disturbance-dependant species with the goal of maintaining native biodiversity. Ecosystem services identified include: Preserving Services
Biodiversity
Connectivity
What we do not yet know
2.4.3.1 Construction
Construction provides a direct benefit to society as it creates human infrastructure. The majority of the ecosystem services provided for direct construction (e.g. buildings, roads, etc) are cultural services, since they provide a direct influence on society and economic returns. The purpose of some of the built infrastructure directly benefits the environment (i.e. incinerators and recycling facilities). Dams decrease erosion and associated negative impacts, aid in the use of water supply for sustainable energy by controlling flow; provide recreational uses by way of increasing flow of river for associated activities (e.g. white water sports); and allow access to created lakes and hydraulic power. Other general benefits of construction include: roads and bridges that increase the availability of goods transported; shorelines/navigation channels prevent erosion and deterioration of the natural habitat; and during construction aggregates can prevent contamination of runoff into local water ways by redirecting flow.

(60119329_mnr_ final_dec 19 2009.docx) - 94 -
Ecosystem services identified include: Road and Highway maintenance and repair
Cultural Services Social Relations
Commerce
Recreation and Tourism
Road and Highway new construction
Cultural Services Social Relations
Commerce
Recreation and Tourism
Preserving Services Biodiversity (-)
Connectivity (-)
Houses
Cultural Services Cultural Diversity
Spiritual and religious values, Inspiration
Education
Aesthetics
Social Relations
Sense of Place
Cultural Heritage
Recreation and Tourism
Institutional Buildings
Cultural Services Cultural Diversity
Spiritual and religious values, Inspiration
Education
Aesthetics
Social Relations
Sense of Place
Cultural Heritage
Commerce
Recreation and Tourism
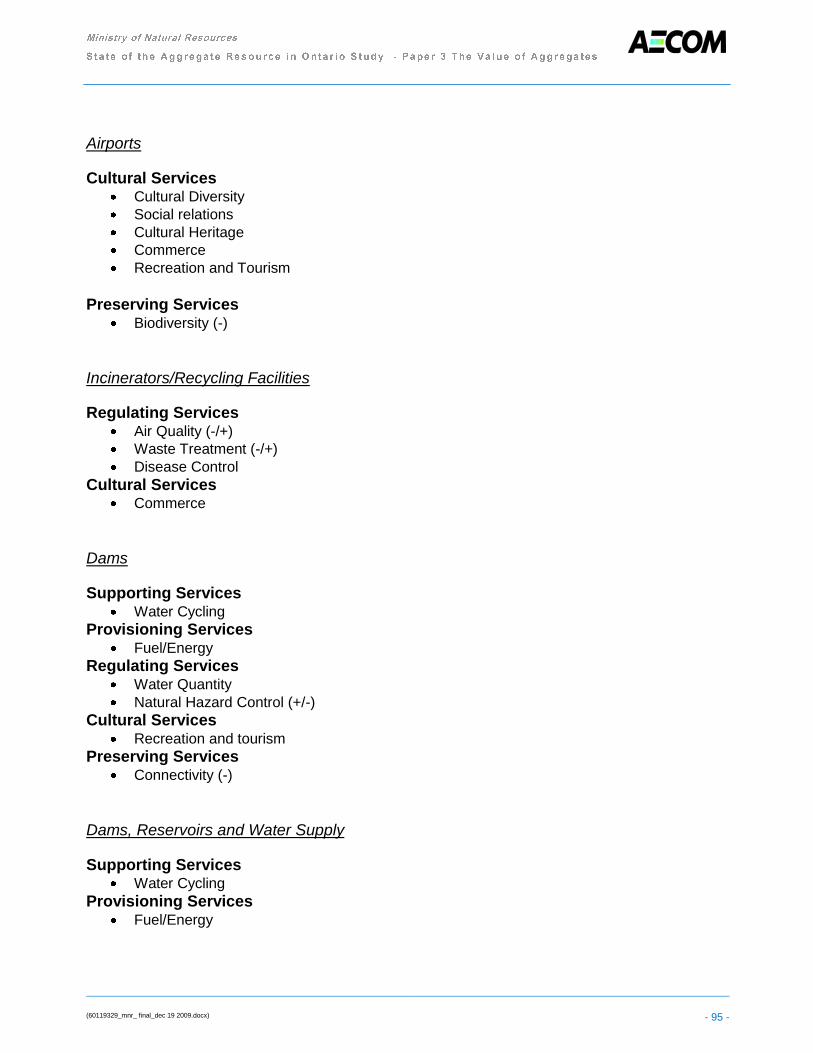
(60119329_mnr_ final_dec 19 2009.docx) - 95 -
Airports
Cultural Services Cultural Diversity
Social relations
Cultural Heritage
Commerce
Recreation and Tourism
Preserving Services Biodiversity (-)
Incinerators/Recycling Facilities
Regulating Services Air Quality (-/+)
Waste Treatment (-/+)
Disease Control
Cultural Services Commerce
Dams
Supporting Services Water Cycling
Provisioning Services Fuel/Energy
Regulating Services Water Quantity
Natural Hazard Control (+/-)
Cultural Services Recreation and tourism
Preserving Services Connectivity (-)
Dams, Reservoirs and Water Supply
Supporting Services Water Cycling
Provisioning Services Fuel/Energy
(60119329_mnr_ final_dec 19 2009.docx) - 96 -
Regulating Services Water Quantity
Natural Hazard Control (+/-)
Cultural Services Recreation and Tourism
Preserving Services Biodiversity (+/-)
Connectivity (-)
Roadways/Bridges
Cultural Services Social Relations
Commerce
Recreation and Tourism
Preserving Services Biodiversity (-)
Connectivity (-)
Shorelines/Navigation Channels
Regulating Services Natural Hazard Control
Construction Site (exits and runoff control)
Regulating Services Water Quality
Water Quantity
Natural Hazard Control

(60119329_mnr_ final_dec 19 2009.docx) - 97 -
2.4.3.2 Rehabilitation Uses Post-Quarry Operations
The Aggregates Resources Act requires that the quarries be restored to appropriate end uses that range from restoration of natural habitat (terrestrial, aquatic) through provision of sites for recreation, education, agriculture and/or residential/commercial/industrial development. The 31 MNR aggregate site licences were examined and the following services were provided by the existing conditions (before extraction) and rehabilitation (subsequent to extraction) plans: Licences - Existing conditions
Supporting Services Soil Formation
Photosynthesis
Primary Production
Nutrient Cycling
Water Cycling
Provisioning Services Food
Genetic Resources
Regulating Services Air Quality
Climate Regulation
Water Quality
Water Quantity
Pollination
Cultural Services Depend on the site (Spiritual and religious values inspiration, aesthetics, cultural heritage)
Preserving Services Biodiversity
Rehabilitation- subsequent to extraction
Supporting Services Soil Formation
Photosynthesis
Primary Production
Nutrient Cycling
Water Cycling
Provisioning Services Food
Genetic Resources
Regulating Services Air Quality
(60119329_mnr_ final_dec 19 2009.docx) - 98 -
Climate Regulation
Water Quality
Water Quantity
Pollination
Cultural Services Depend on the site (Spiritual and religious values inspiration, aesthetics, cultural heritage)
Preserving Services Biodiversity
Post Rehabilitation Uses
As conveyed above aggregates provide various ecosystems services; moreover the sites in which they were mined also provide eco-services subsequent to the completion of the rehabilitation phase. Aggregate extraction sites can be rehabilitated to productive land uses such as:
Arboreta
Earth Science Study Sites
Gardens (e.g., Royal Botanical Gardens in Burlington, ON)
Development: residential, commercial, industrial
Parks
Resorts
Golf courses
Landfills
Zoos
Lakes and beaches
Wildlife habitat: alvars; wetlands, especially fens due to unique groundwater conditions
Section 1.3.4 provides the methodology that was used to calculate the area of existing land uses on the most recent 31 approved aggregate licences based on the associated natural heritage reporting and comparison to relevant GIS data layers. The long term outcomes anticipated as a result of the progressive implementation of rehabilitation plans were calculated in order to compare the nature and magnitude of the change. Ecosystem services associated with pre and post extraction activities were assigned qualitatively. Assignment of dollar values to the services was beyond the scope of this project. On average 69% of the licenced area was extracted for aggregates, while the remaining 31% was protected as watercourses, ANSIs, significant woodlands and significant wetlands and buffers to the site and/or features. The licenced area corresponds to the
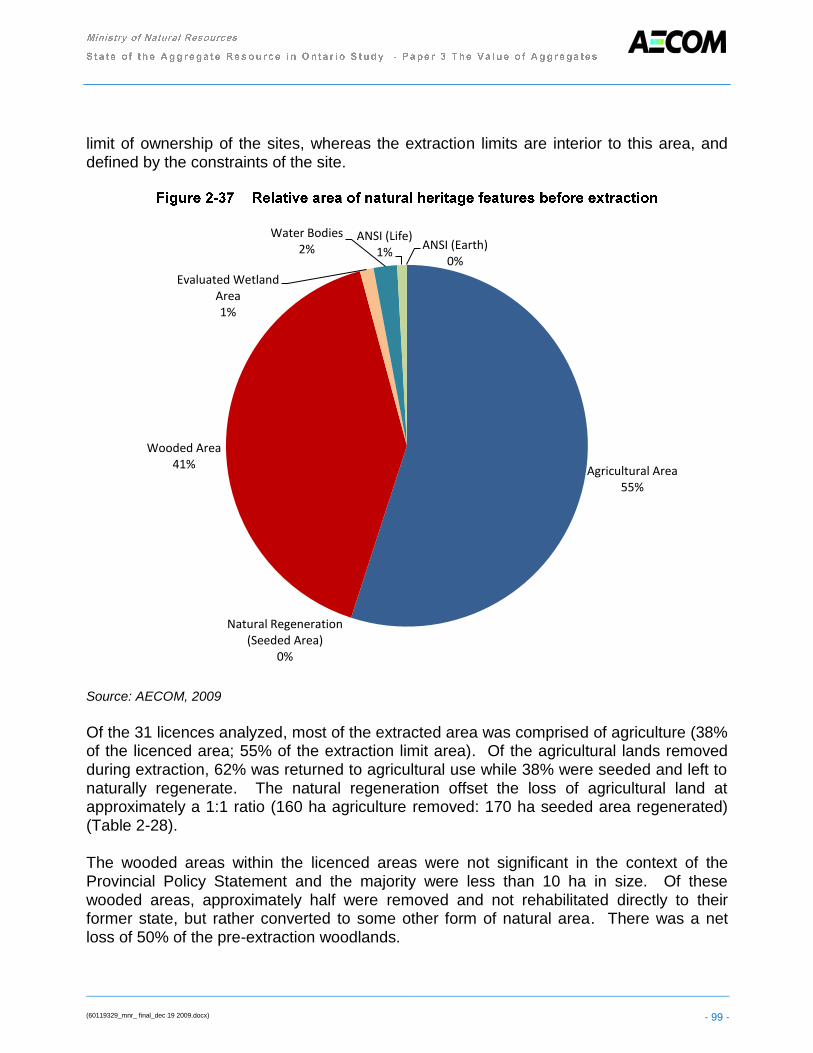
(60119329_mnr_ final_dec 19 2009.docx) - 99 -
limit of ownership of the sites, whereas the extraction limits are interior to this area, and defined by the constraints of the site.
Source: AECOM, 2009
Of the 31 licences analyzed, most of the extracted area was comprised of agriculture (38% of the licenced area; 55% of the extraction limit area). Of the agricultural lands removed during extraction, 62% was returned to agricultural use while 38% were seeded and left to naturally regenerate. The natural regeneration offset the loss of agricultural land at approximately a 1:1 ratio (160 ha agriculture removed: 170 ha seeded area regenerated) (Table 2-28). The wooded areas within the licenced areas were not significant in the context of the Provincial Policy Statement and the majority were less than 10 ha in size. Of these wooded areas, approximately half were removed and not rehabilitated directly to their former state, but rather converted to some other form of natural area. There was a net loss of 50% of the pre-extraction woodlands.
Agricultural Area55%
Natural Regeneration (Seeded Area)
0%
Wooded Area41%
Evaluated Wetland Area1%
Water Bodies2%
ANSI (Life)1%
ANSI (Earth)0%
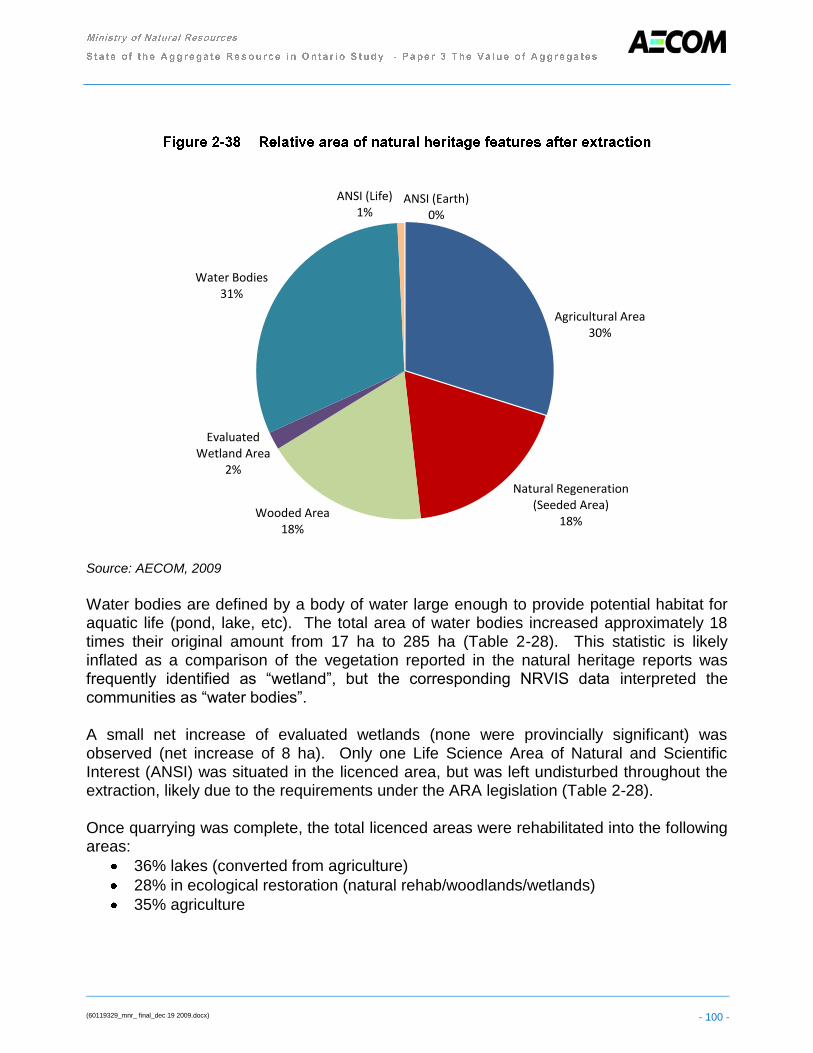
(60119329_mnr_ final_dec 19 2009.docx) - 100 -
Source: AECOM, 2009
Water bodies are defined by a body of water large enough to provide potential habitat for aquatic life (pond, lake, etc). The total area of water bodies increased approximately 18 times their original amount from 17 ha to 285 ha (Table 2-28). This statistic is likely inflated as a comparison of the vegetation reported in the natural heritage reports was frequently identified as “wetland”, but the corresponding NRVIS data interpreted the communities as “water bodies”. A small net increase of evaluated wetlands (none were provincially significant) was observed (net increase of 8 ha). Only one Life Science Area of Natural and Scientific Interest (ANSI) was situated in the licenced area, but was left undisturbed throughout the extraction, likely due to the requirements under the ARA legislation (Table 2-28). Once quarrying was complete, the total licenced areas were rehabilitated into the following areas:
36% lakes (converted from agriculture)
28% in ecological restoration (natural rehab/woodlands/wetlands)
35% agriculture
Agricultural Area30%
Natural Regeneration (Seeded Area)
18%Wooded Area
18%
Evaluated Wetland Area
2%
Water Bodies31%
ANSI (Life)1%
ANSI (Earth)0%

(60119329_mnr_ final_dec 19 2009.docx) - 101 -
The following discrepancies were observed during the analysis of the 31 licenced areas:
Some licences leave slopes un-rehabilitated
Two licences do not account for rehabilitation areas on drawings or natural heritage
reports
NRVIS data variable (lakes = wetlands for many licences)
Errors in GIS measurements but not significant at this scale
Extraction Limits Before Interim
Condition
Rehabilitation
Condition
Net
Change
Licence Boundary Area 1170 - - -
Extraction Limit Area 811 - - -
Agricultural Area 446 0 277 -169
Natural Regeneration
(Seeded Area) 0 0 170 170
Wooded Area 331 125 42 -164
Evaluated Wetland Area 10 9 9 8
Water Bodies 17 14 288 285
ANSI (Life) 7 7 0 0
ANSI (Earth) 0 0 0 0
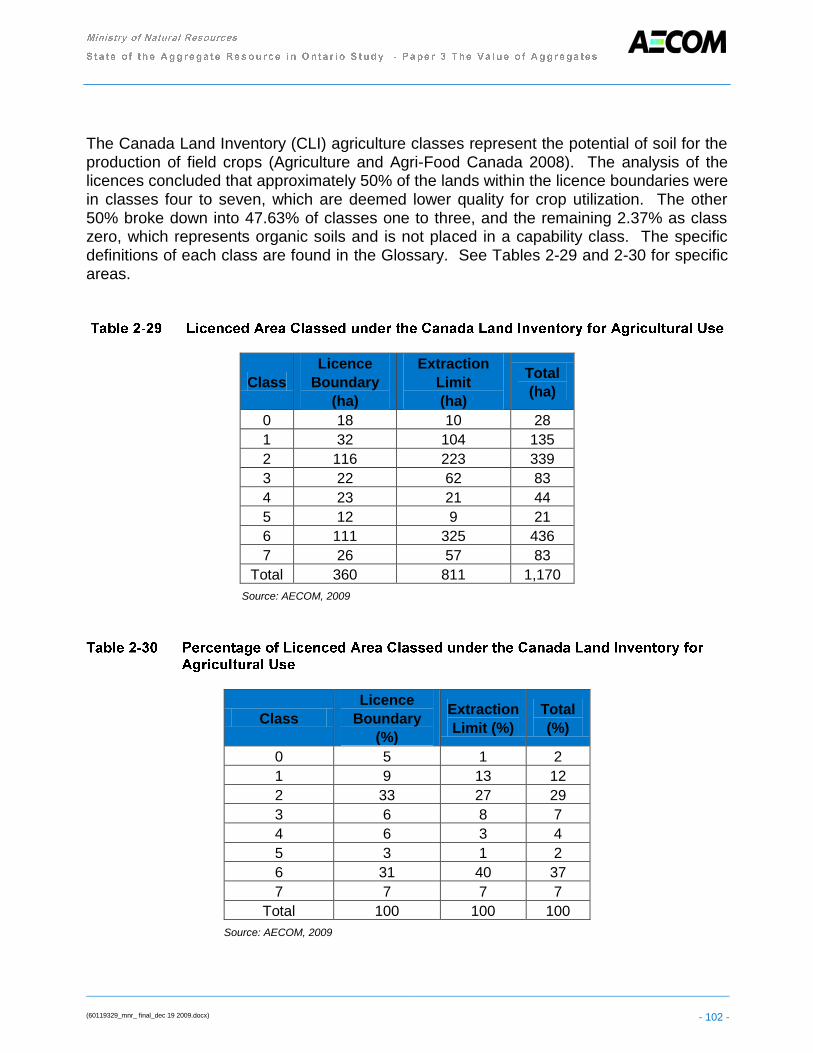
(60119329_mnr_ final_dec 19 2009.docx) - 102 -
The Canada Land Inventory (CLI) agriculture classes represent the potential of soil for the production of field crops (Agriculture and Agri-Food Canada 2008). The analysis of the licences concluded that approximately 50% of the lands within the licence boundaries were in classes four to seven, which are deemed lower quality for crop utilization. The other 50% broke down into 47.63% of classes one to three, and the remaining 2.37% as class zero, which represents organic soils and is not placed in a capability class. The specific definitions of each class are found in the Glossary. See Tables 2-29 and 2-30 for specific areas.
Class
Licence
Boundary
(ha)
Extraction
Limit
(ha)
Total
(ha)
0 18 10 28
1 32 104 135
2 116 223 339
3 22 62 83
4 23 21 44
5 12 9 21
6 111 325 436
7 26 57 83
Total 360 811 1,170
Source: AECOM, 2009
Class
Licence
Boundary
(%)
Extraction
Limit (%)
Total
(%)
0 5 1 2
1 9 13 12
2 33 27 29
3 6 8 7
4 6 3 4
5 3 1 2
6 31 40 37
7 7 7 7
Total 100 100 100
Source: AECOM, 2009

(60119329_mnr_ final_dec 19 2009.docx) - 103 -
By definition, ecosystem services analysis is designed to evaluate the benefits accrued from natural heritage features and functions. However,”values” are highly subjective, and ecosystems are highly connected and non-judgemental. Therefore, while it is possible to list the environmental benefits enjoyed as a result of ecosystem services and their associated societal and economic benefits, there are also equal and opposite effects that can be interpreted as costs, at least in some circles.
It should be recognized that natural heritage provides a cohort of services that do and do not benefit human ecosystems. Reductions in some of these services can create a negative impact on human ecosystems (e.g. erosion, water quality, carbon storage), while increases can create positive impacts. The following highlights some of the primary ecosystem services that are negatively affected by the use of aggregate for human development and activity. Extraction of limestones and dolostones triggers a release of carbon dioxide upon exposure to the atmosphere and precipitation. Carbon dioxide is one of the principle greenhouse gases that has been identified as a contributor to global change, including warming effects.
2.6.1.1 Stormwater Control
Contrary to the benefits provided by stormwater control ponds some become breeding grounds for mosquitoes and other pests. Mosquitoes may carry West Nile Virus that has affected not only humans but some bird cohorts (Science Daily, 2009). It should be noted that an increase in human pests will correlate to a foraging benefit for other organisms therefore the service is not all negative. These ponds can be developed to create a pleasing atmosphere but some are ill maintained and may become contaminated, aesthetically unpleasant, or they may represent a safety threat.
Regulating Services
o Pest Control (-)
Cultural Services
o Aesthetics (both +/-)
o Health and Safety

(60119329_mnr_ final_dec 19 2009.docx) - 104 -
2.6.1.2 Removal of Anthropogenic Pollutants
Some aggregates can be used to remove certain environmental pollutants but at the same time can create bi-products that are not environmentally friendly. The most prevalent aggregate for chemical pollutant removal is limestone because of its reactive nature with acidic contaminants. Acid Neutralization
Although limestone stone is often used to remove acidic properties from water or leachate the process of limestone acid neutralization produces carbon dioxide (a greenhouse gas) as a bi-product and this contributes to climate change. Regulating Services
Air Quality (+/-)
Climate Regulation (-)
2.6.2.1 Construction
The structures created with aggregates do not in themselves provide ecosystem impacts until they are located and/or managed in a manner that provides consequences. To credit aggregates with these “costs” is to speculate about secondary or indirect effects. However, as the structures with obvious benefits have been listed above, it is reasonable to discuss the possible downside of investing in these structures without an analysis of the ecosystem services that may be affected. Although humans find roads an indispensible necessity for today‟s society, the indiscriminate construction of new roads, highways, dams or bridges, made possible by relatively inexpensive aggregates, can cause negative effects to the surrounding environment. New roadways may dissect natural areas into fragments decreasing the amount of connectivity and total area of a habitat thereby creating a negative impact to biodiversity. Edges are generally good habitat for invasive and non-native species where they outcompete native species, many of which have more specialized habitat requirements. Bisecting habitats with new roads is likely one of the most significant impacts created on natural areas often affecting significant species within an area because the habitat no longer suits their needs. Dams, although beneficial on a variety of fronts from energy production to irrigation planning and food production, also create significant negative impacts. The barrier effect alone to the migration of fish accounts for the loss of whole populations for example, the
(60119329_mnr_ final_dec 19 2009.docx) - 105 -
American Eel (Environment Canada, 2009; MacGregor, 2009). This disturbance of the natural flow regimes also can create changes to spawning and nursery habitat through changes in water depths and temperature. Pulse events (sudden release of excess water) can dislodge eggs and fry as well as in-stream food sources. This concern is expressed in the research by the Ontario Water Resources into Best Management Practices for management of Sturgeon in streams where there are hydro installations within the range of this fish due to the implications of the Endangered Species Act. Sturgeon is only one of a long list of aquatic species that could be affected. Airports decrease the biodiversity of the neighbourhood in which they are situated due to the complete change in landscape for the airport to be safe from an operations perspective (e.g. no trees, no birds or mammals to be present in aircraft area; many chemicals are present due to maintenance of vehicles and aircrafts, de-icing and anti-icing procedures, etc.). The airport campus becomes a biodiversity “black hole”. Although incinerators and recycling facilities aid in reducing waste that ends up in landfills, the processes they use emit bi-products that can have negative effects on the environment (e.g. carbon dioxide, sulfur dioxide, heavy metals, etc.) if scrubbers and other methods to control emissions are not implemented or well maintained. Road and Highway new construction
Preserving Services Biodiversity (-)
Connectivity (-)
Airports
Preserving Services Biodiversity (-)
Incinerators/Recycling Facilities
Regulating Services Air Quality (-/+)
Waste Treatment (-/+)
Dams, Reservoirs and Water Supply
Regulating Services Natural Hazard Control (+/-)
Preserving Services Connectivity (-)

(60119329_mnr_ final_dec 19 2009.docx) - 106 -
Dams, Reservoirs and Water Supply
Regulating Services Natural Hazard Control (+/-)
Preserving Services
Biodiversity (+/-)
Connectivity (-)
2.6.2.2 Agriculture
The analysis of the 31 most recent licence approvals indicates that agricultural land composed over half of the excavated area (446 ha total; 55%). Of that, almost half (48%) was Prime Agricultural land. The rehabilitation plans anticipate that 277 ha will be returned to production (38%), however the capability of that land is not classified. One of the measureable costs of aggregate extraction appears to be the loss of agricultural land that does not discriminate between Prime and non-prime areas. There was a concern that the losses of agricultural land would be underevaluated if the resources currently forested were not included in the loss. In this study, the loss in forested area is offset by the regenerating areas. The occurrence of forest proves to be a better land use for soil conservation than agricultural uses.

(60119329_mnr_ final_dec 19 2009.docx) - 107 -
This study sought to understand a range of economic impacts of aggregates, both in the
upstream and downstream flows. In 2007, aggregate production in the Province of Ontario inclusive of recycling and export was in the order of 181,000,000 tonnes and new production totalled almost 164,000,000 tonnes. The primary areas of new production were CPCA geographic areas 4 and 3, the GTA and West Central respectively. The economic value of this production was approximately $1.3 billion. The aggregate industry generates both upstream and downstream effects in the provincial economy. The upstream effects include spending by the aggregate industry on its industry supply chain and the industry itself. In 2007, taking into account direct, indirect and induced effects the sector generates approximately:
$1.6 billion of GDP
$827 million of labour income
17,000 fulltime jobs
$2.9 billion of gross output
$78 million in taxes
In terms of material, stone and sand and gravel production are each responsible for approximately 45% of the economic outputs generated by the aggregate sector. Other materials are responsible for about 10% of the economic outputs. CPCA geographic Areas 3, 4 and 6 collectively account for approximately 54% of the economic outputs of the
aggregate sector in the Province. The downstream economic effects include economic impacts in sectors that purchase goods and services from a subject sector where initial production spending took place. The 2007 aggregate production volumes were tracked downstream to 16 end use sectors. These sectors were subsequently grouped into three categories:
Cement and Concrete
Other Products
Construction
(60119329_mnr_ final_dec 19 2009.docx) - 108 -
Approximately 21% of the provincial aggregate production by value flows to industries in the cement and concrete category and 57% to various forms of construction. The remaining 22% is destined for a suite of industry sectors in the other products category. The economic output attributable to aggregate production in the downstream sectors is:
$1.6 billion of GDP
$940 million of labour income
18,300 fulltime jobs
$3.2 billion of gross output In terms of industry categories, the majority of the value add (GDP) falls to construction (59%), The cement and concrete category accounts for 22% and the other products category 19%. The downstream industry categories and sectors referred to in this study generate the following economic outputs.
$22 billion of GDP
$13 billion of labour income
245,000 fulltime jobs
$44.7 billion of gross output In terms of the industry categories themselves, the contribution of aggregates to the overall economic outputs are roughly:
Cement and concrete 8%
Other products 3%
Construction 13%
For all the categories combined, the contribution of aggregates to total economic output is in the order of 7%. This paper concluded that aggregate plays an important role in the Ontario economy. Although it is a low price commodity, its use is in a very high volume. It is a 1.3 billion industry that through direct, indirect and induced means creates approximately 16,000 jobs in the provincial economy. Aggregate moves to a wide variety of end users and it is an essential ingredient in the industry sectors associated with construction and manufacturing. Although it is not the dominate input in most sectors in terms of value, it is nevertheless an essential input and one for which there is no obvious substitute at the present time.

(60119329_mnr_ final_dec 19 2009.docx) - 109 -
Through the assessment of the value of aggregates in 5 case studies selected from Ontario‟s major infrastructure projects we can conclude that the value of aggregates in infrastructure projects is a relatively small component of the total project. The following table indicates the value of aggregates as a percentage of the total project value for the selected case studies.
Project Aggregate /
Project
Spadina Subway
Extension
1.22%
Niagara Tunnel Project 4.43%
Woodstock General
Hospital
0.26%
North Bay Regional
Health Centre
0.60%
Wolfe Island Wind
Project
0.64%
For each of the 5 case studies examined, all of the projects had a readily available local source of aggregate to be used in the project. Our assessment of case studies found aggregates to be an enabler of major infrastructure projects. Although the value of aggregates is a relatively small component of project value, it is a product that does not have many readily available substitutes and without aggregates available it is unclear how these major projects would proceed.
The social costs and benefits of aggregate extraction were assessed through the telephone survey results, the content analyses of the OMB and MNR data, and also through the qualitative assessment of the case files from the NEC. From the telephone survey the following conclusions were made for the following areas of interest. In terms of knowledge of the aggregate industry, there was no significant difference of actual distance to a pit or quarry between the two groups of respondents (those that said they do and those that said they do not live near a pit or quarry). The base knowledge seems to be varied and it can be concluded that respondents are not very familiar with the aggregate industry. This lack of familiarity indicates that the aggregate industry is not top

(60119329_mnr_ final_dec 19 2009.docx) - 110 -
of mind for a statistically significant representation of the Ontario population and there are opportunities to build awareness and education amongst the public. From the perspective of community well-being, respondents in general do not rank development and infrastructure projects highly among the other things that they value about their community and the things that contribute to their community‟s well-being. However, over half of the respondents did rank that certain types of development and infrastructure projects such as road and highway repair and maintenance, building new institutional buildings, new energy facilities and new highways and roads as “Somewhat Important” or “Very Important.” Based on further questions to assess the benefits of aggregates, it was found that these specific projects, maintaining or repairing highways or roads, building new institutional buildings, energy facilities and new highways or roads were valuable to respondents and offered the greatest level of benefit. Respondents noted that the main benefits of these projects are the positive economic impacts associated with the aggregate industry such as job creation. This information shows that when respondents from the survey were asked to compare the attributes to their community that were valuable to them against infrastructure and development projects the data was not consistent. This leads us to conclude that respondents did not seem willing to trade the most important things that their value about their community for development and infrastructure projects. The survey instrument focused several questions on assessing the social costs associated with the aggregate industry. Respondents perceived the main costs were the environmental effects such as lack of site rehabilitation, water contamination, and a destruction of habitat. Nuisance effects were also rated fairly high amongst respondents. As a result of the Content Analyses from a combination of the MNR, OMB and NEC data, there was a wide range of types of public complaints regarding aggregate operations and licence applications. From an analysis of the MNR and OMB data, it is clear that the three most frequently reported public complaints are regarding noise pollution, truck traffic and
volume and air pollution and dust. Likewise, the themes found in the NEC data were reflective of both the MNR and OMB data. Respondents who reported that they live near a pit or quarry or near a truck transportation route formulated groups of respondents that were stated to have a Perceived Direct Experience (PDE). In our cross tabular analysis on whether a PDE has an influence on
the Social Value of aggregates, we were able to infer the main costs and benefits from this group of respondents. Respondents that live near a pit or quarry were more likely to name nuisance effects as a social cost of aggregate extraction. However, respondents that live near an aggregate truck transportation route were more likely to state that the economic aspects of aggregate extraction as a social benefit.

(60119329_mnr_ final_dec 19 2009.docx) - 111 -
Based on the findings from the geographical variation study, we can conclude that respondents who live in an urban area such as Area 4 - GTA rate parks and trails as an important aspect of their community. Also, respondents from Area 4 - GTA highlighted new institutional buildings as important. Based on these responses we can infer that respondents do not rate development and infrastructure projects, with the exception of institutional buildings, as high importance. Respondents living in Area 7 and 8 overwhelmingly rated development and infrastructure projects as high importance and were more likely to state that there were no social costs of extraction. We can infer from this information that respondents living further away from urban centers recognize the benefits from aggregate extraction and are less likely to name parks and trails as important aspects of their community. Finally, the only geographical area to link social costs such as nuisance effects with regards to aggregate extraction were respondents from Area 3 – West Central. When comparing the different approach to data collection we can make varied inferences. For example, From the Content Analysis findings it can be concluded that while the main concerns of aggregate extraction are nuisance effects, it should be noted that this comes from a sample that represents a vocal minority who are directly affected by the aggregates industry. However, when surveying a more statistical significant representation of the Ontario population, environmental impacts emerge as the main costs to aggregate extraction.
This analysis qualitatively identified both the positive and negative aspects of ecosystem services provided by aggregates and their extraction. Reductions in some of these services can create a negative impact on human ecosystems (e.g. erosion, water quality, carbon storage), while increases can create positive impacts. Further analysis could identify trade-offs, and the ability to maximize net benefits. The analyzed eco-services provided by aggregates were all of the first order. Secondary benefits and costs exist but they are very difficult to define and opinions on how they should be quantified vary. The environmental aggregates value matrix was broken down into the two categories of Processes in which the products of aggregate extraction are used and Spatial, where the extraction itself contributes ecosystem services as a consequence of the ultimate rehabilitation of extraction sites and the aggregates are used for the creation of fixed structures. Under the Processes heading the majority of the
ecosystem services were categorized as “regulating”, in that they control processes that create an environmental benefit. This can be explained by the fact that the practices/procedures that are used by Landscape Rehabilitation; Water Quality Treatment; Removal of Anthropogenic Pollutants; Uses in Mines; Landfills and Waste Disposals; and Maintenance of Biodiversity are used to regulate ecosystem processes. The majority of the ecosystem services provided under the Spatial headings were cultural. The reason for

(60119329_mnr_ final_dec 19 2009.docx) - 112 -
this is two-fold: the use of aggregate as the main source of building materials, and the rehabilitation of sites for culturally important functions that lead to secondary benefits. Aggregates have a large influence on human culture because it provides structures that reflect societal values. The bulk of the negative effects of aggregates on eco-services fall to either regulating (likely due to the associated bi-products of aggregate processing) and/or preserving services (likely due to the permanent human impact that buildings, roads, dams, etc have on the developed landscape). The 31 analysed licences were those of the most recent approvals, and it was established that these licences were subject to the most restrictive environmental controls. The fact that these sites were largely agricultural and environmental features were almost entirely preserved indicates that the legislation with respect to natural environment is having an effect on the outcomes. A small amount of good quality habitat was affected due to quarrying, and if it was affected, rehabilitation efforts usually replaced it. The same perhaps cannot be said for the preservation of agricultural land, which the PPS also seeks to protect. Via this analysis, half of the agricultural resources are transformed. Within the licenced boundaries 50% of the lands extracted were of lower quality soils for crop utilization (agricultural classes four to seven, according to the CLI). However, 48% of the agricultural lands were of the classes one to three, which are good to high quality soils for crop utilization: Prime Agricultural Lands. Agricultural land is important for producing a wide range of products including food (nutrition), and energy and its consumption, for alternative purposes, particularly in the case of high quality land needs to be carefully considered. The net shift in land use via the aggregate extraction process was from terrestrial to lake habitats, with a 50% net reduction in agricultural lands.
This paper concludes that aggregate demand in the province of Ontario will continue to escalate and that this demand will be spurred on three fronts:
by a growing population and concomitant need for new infrastructure and buildings
the need to maintain existing infrastructure and buildings
growth in the manufacturing economy and ongoing need for aggregate inputs
The key areas of demand for aggregate are in southern Ontario particularly around built-up areas. To-date, aggregate has been sourced in close proximity to these areas, keeping transportation costs and distances minimal. However, going forward as local sources are used up and development pressures expand in southern Ontario, there will be pressures to bring aggregate from further afield this will have cost implications. The industry should

(60119329_mnr_ final_dec 19 2009.docx) - 113 -
optimize recycling to help offset the demand for new aggregate materials and balance the cost of supply. Aggregate is not an inexhaustible commodity in southern Ontario and it needs to be responsibly husbanded. The vast majority of people are not significantly affected by aggregate extraction however people in close proximity to extraction areas and living along haul routes are. In addition, if transportation distances increase as resources are extracted further from their final destinations, a larger number of people will be affected by the transportation of aggregate resources. At the moment there is no readily apparent substitute for aggregate it is an essential input for many parts of the Provincial economy. Therefore, it is imperative that efforts be sought to maximise the associated benefits and minimise costs.
This economic analysis required the use of some assumptions to manage data gaps in available aggregate flow and pricing information. There is a need for better cooperation and transparency of data between the Ministry and the Industry. It is recommended that the Ministry, Industry Groups, and individual producers work together in a way to communicate primary data so that the flow of material may be better monitored, while still protecting confidentiality and proprietary information. To effectively manage this resource it is essential that strong data banks be constructed and maintained. Some areas for future economic study include:
Understanding the flow of aggregates to end users and the actual value of materials flowing need to be part of a future data assembly and management process;
Understanding the supply cost implications of bringing aggregate from further afield;
Understanding the implications (sensitivities) of raised aggregate costs to end users;
End user surveys to collect primary information on significance of aggregate to construction and production processes;
A quantitative analysis of the environmental costs and benefits of aggregate;
Lifecycle cost analysis of pits and quarries from inception through after use; and
Understanding the cost implications of using more recycled material and aggregate substitutes.

(60119329_mnr_ final_dec 19 2009.docx) - 114 -
In order to better understand the role and impact of aggregates to major infrastructure projects, we recommend that future case studies be undertaken to look at the indirect use of aggregates on major infrastructure projects. We also recommend that MNR periodically surveys large infrastructure projects to understand quantities of aggregate used on a project, sources of aggregate and value of aggregate used.
After our study, it is clear that there is some conflict between the cost and benefits society places on the aggregate industry. It is fairly clear that most of the respondents in our survey placed value on the built environment that which comes from aggregates but when faced with the idea of aggregate extraction, respondents clearly associate a number of
social costs with this activity. However, respondents also recognize the positive economic impact that aggregate extraction and the use of aggregate materials has on job creation. Based on this assessment it is our recommendation to conduct a more in-depth analysis to determine the net benefits or net costs specifically associated with aggregate extraction. In furthering our Content Analysis, we recommend a more direct analysis of community groups that are directly affected by aggregate operations including residents that live on or near major haul routes and residents that live near a pit or quarry. As seen in our assessment many of these residents raised their concerns to such bodies as the OMB, MNR and NEC but in order to obtain more in-depth information we would recommend a continuation of interviews and focus groups. It would be beneficial to do more in-depth cross-tabular analysis with the existing telephone survey data, to locate case studies of major pits and quarries (or also the 31 recent MNR site licence applications) in Ontario and test if proximity to these sites affects respondents‟ views on the social costs and benefits of aggregates. It is also necessary to gauge the level of benefits and costs experienced by aggregate operators. Again, interviews with the businesses that are operating and applying for aggregate licences as well as business that are indirectly connected to the industry will help to determine some of the net benefits and costs.
The environmental value section of this study has highlighted a number of important environmental contributions of aggregate use however the relative contribution to values and costs are speculative. The quantification of these contributions is outside of the scope of this study, however undertaking the application of economic models to designate dollar values would improve not only the magnitude of contributions from the various features
(60119329_mnr_ final_dec 19 2009.docx) - 115 -
and functions, but would also provide a tool to better correlate the natural environment values with societal and economic factors. The environmental cost of transportation increases the negative impact on the environment and should be studied further to understand how to reduce this cost and to deal with the paradox that the constant, predictable need for aggregates conflicts with the community‟s desire that mining operations are conducted far from its boundaries (Poulin et
al. 1994).
There is a further need to research changes in the landscape due to extraction and rehabilitation of aggregates, which in turn change species composition in the area, and how that affects the ecosystem. The valuation of aggregate use and the environment would likely benefit from a cradle to grave analysis, which would not only analyze primary uses, but also secondary, transportation impacts, mining impacts, etc. Studies on the affect of quarrying on the soil overburden should be conducted to determine the impact of extraction on the soil quality of the site to assess if it does or does not result in less fertile land after rehabilitation.

(60119329_mnr_ final_dec 19 2009.docx) - 116 -
AMM Magazine – Municipal Leader, Summer 2006. Industry, Economic Development and Mines - A primer on the aggregate mining industry. Available online at: http://www.amm.mb.ca/PDF/Magazine/Summer2006/aggregate.pdf Last Accessed November 4, 2009.
Agriculture and Agri-Food Canada, 2008. Overview of Classification Methodology for Determining Land Capability for Agriculture.
Available online at: http://sis.agr.gc.ca/cansis/nsdb/cli/classdesc.html Last accessed: October 18, 2009.
British Geological Survey (BGS), 2008.
Quarrying and the environment. Available online at: http://www.bgs.ac.uk/mendips/aggregates/environment/intro.html Last accessed: October 29, 2009.
Brown Gibbons Lang & Company Investment Bankers, 2006.
Construction Materials – Industry Trends and M&A Outlook, April 2006. Chicago: BGLCO.
Brown, T.J, McEvoy, F., and Mankelow, J. with Ward, J., Bloomfield, S., Goussarova, T., Shah, N. and Souron, L., 2008.
The need for indigenous aggregates production in England. Nottingham: British Geological Survey Open Report.
City of Lincoln, 2006. Rain to Recreation: Watershed Management. Available online at: http://lincoln.ne.gov/ city/pworks/watrshed/educate/rain2rec/ Last Accessed December 14, 2009. City of Saskatoon, 2009.
Recreational Use of Storm Water Ponds. Available online at: http://www.saskatoon.ca/DEPARTMENTS/Community%20Services/Communitydevelopment/Pages/RecreationalUseofStormWaterPonds.aspx Last Accessed December 14, 2009.

(60119329_mnr_ final_dec 19 2009.docx) - 117 -
Costanza, R., R. d'Arge, R. de Groot, S. Farber, M. Grasso, B. Hannon, K. Limburg, S. Naeem, R.V. O'Neill, J. Paruelo, R. G. Raskin, P. Sutton, M. van den Belt. 1997.
The value of the world's ecosystem services and natural capital. Nature, 387(6230):255.
David Suzuki Foundation, 2008.
Ontario‟s Wealth, Canada‟s Future: Appreciating the Value of the Greenbelt‟s Eco-services. Available online at: http://www.davidsuzuki.org/files/Conservation/DSF-Greenbelt-web.pdf Last Accessed October 21, 2009.
Delta Elevator, 2009. http://www.delta-elevator.com/newhosp51.jpg Eco-Issues, 2009.
Preserving Natural Areas, or Extracting Aggregates Wherever They Lay? Available Online at: http://www.ecoissues.ca/wiki//index.php?title=Preserving_natural_areas,_or_Extracting_aggregates_wherever_they_lay%3F Last Accessed November 3, 2009.
Environment Canada, 2009.
The American Eel of the St. Lawrence: A Species in Decline for the Past 40 Years. Available Online at: http://www.ec.gc.ca/default.asp?lang=En&n=EEB1B2FF-1 Last Accessed on: November 3, 2009.
Government of Ontario, 2007.
Aggregates Resources Act; Ontario Regulation 244/97. Available online at: http://www.e-laws.gov.on.ca/html/regs/english/elaws_regs_970244_e.htm Last Accessed October 29, 2009.
Government of Ontario, 1990.
Aggregate Resources Act, R.S.O. 1990, Chapter A.8. Available Online at: http://www.e-laws.gov.on.ca/html/statutes/english/elaws_statutes_90a08_e.htm Accessed on November 4, 2009.
Government of Ontario, 1990. Aggregate Resources Act – Ontario Regulation 244/97. Available Online at: http://www.e-laws.gov.on.ca/html/regs/english/elaws_regs_970244_e.htm Accessed on November 4, 2009.
Gravel Watch, 2003.
Rehabilitating Ontario's Aggregate Pits & Quarries – Who Will Pay for It? Available Online at: http://www.gravelwatch.org/orig-gw/gravelwatch/ebr-review/eco-applic-review.htm Last Accessed November 3, 2009.

(60119329_mnr_ final_dec 19 2009.docx) - 118 -
Gunn, A., Bate, R., Jackson, N.C., Ward, J., Marker, B.R., Brown, T.J., and Highley, D.E, 2008.
Managing Aggregate Supply In England – A review of the current system and future options. Nottingham: British Geological Survey
Hanson Heidelberg Cement Group, 2008.
Aggregate Materials Outlook – A look ahead at supply issues and the forces driving them. California Pavement Preservation Conference, April, 2008. Available online at: http://www.techtransfer.berkeley.edu/pavementpres08downloads/PP08Carter.pdf Last Accessed November 4, 2009.
Hariston, J., L. Stribling, and J. Beck. 2001.
Understanding soils and how they affect water quality. Alabama Cooperative Extension System. Available online at: http://www.aces.edu/waterquality/articles/0139001/0139001.pdf Last Accessed November 3, 2009.
Highley, D.E., Chapman, G.R., and Bonel, K.A., 2004.
The Economic Importance of Minerals to the UK. Nottingham, British Geological Survey. Commissioned Report.
Intellipulse, 2009.
Social Value of the Aggregate Industry to the Ontario Public. Prepared for AECOM. Invest In Ontario, 2009.
Ontario‟s North – Industry Sectors – Mining Equipment and Services. Available online at: http://www.investinontario.com/north/industry_mining.asp?gonorth=y Last Accessed November 3, 2009.
John Emery Geotechnical Engineering Limited, 1992.
Mineral Aggregates Conservation, Reuse and Recycling. Toronto: Geotechnical Engineering Limited.
Klara, R. and P. Karel, 2006.
Spontaneous vegetation succession in disused gravel-sand pits: Role of local site and landscape factors. Journal of Vegetation Science, 17: 583-590.
Kohler, Susan, 2006.
California Non-Fuel Minerals, Summer 2006. Sacramento: California Geological Survey.
Kohler, Susan, 2006. Aggregate Availability in California. Sacramento: California Geological Survey.

(60119329_mnr_ final_dec 19 2009.docx) - 119 -
Langer, W. and M. Tucker, 2003. Specification aggregate quarry expansion – A case study demonstrating sustainable management of natural aggregate resources. United States Geological Survey.
Langer, W., L. Drew and J. Sachs. 2004.
Aggregate and the Environment. American Geological Institute. Alexandria, Virginia Laura Consulting and ECO, 2006.
Towards a Long-Term Aggregate Strategy for Ontario, Summary Report. Toronto: Aggregate Round Table
MacGregor, R., 2009.
American Eel (Anguilla rostrata): Managing Majestic Manna. The Skink Volume 2, Winter 2009/2010 (Newsletter of the Land Between Collaborative).
Man, C., and K. Teacoach, 2009. How does limestone rock dust prevent coal dust explosions in coal mines? National
Institute for Occupational Safety and Health. Available online at: http://www.cdc.gov/niosh/mining/pubs/pdfs/hdlrd.pdf Last accessed: November 2, 2009.
Matos, G. and Wagner, L., 1998.
Consumption of Materials in the United States, 1900-1995. Annual Review of Energy Environment, 23: 107-122.
Meikle, J., and Dickson, M., 2006.
Editorial: Understanding the social and economic value of construction. Building Research and Information, 34 (3): 191-196.
Miller, G., 2003.
Environmental Commissioner of Ontario 2002-2003 Annual Report. Thinking Beyond the Near and Now. Available online at: http://www.eco.on.ca/eng/uploads/eng_pdfs/ar2002.pdf Last accessed: October 29, 2009.
Ministry of Natural Resources (MNR). 2009. Aggregate Site Authorized (AGGAUTH) [computer file]. Ontario: Land Information Ontario.
National Lime Association, 2000.
Using Lime for Acid Neutralization. Available Online at: http://www.lime.org/ACIDNEUTfinal.pdf Last Accessed: November 3, 2009.
(60119329_mnr_ final_dec 19 2009.docx) - 120 -
Naydowski, C., 1999. The Contribution of Minerals in the Paper Value Creating Chain. Oftringen: OMYA Pluss-Staufer AG.
NIST MEP Environmental Program, 1997. Case History Use of Glass Aggregate in Construction Projects. Available online at: http://www.p2pays.org/ref/13/12454.pdf Last Accessed: October 29, 2009. Northeast Mental Health Center, 2009.
http://www.nemhc.on.ca/new-face-of-nemhc-f.aspx Ontario Aggregate Resources Corporation, 2009.
Preliminary Mineral Aggregates in Ontario, Production Statistics 2008. Available online at: http://www.toarc.com/publications_statistics.asp Last accessed: October 29, 2009.
Ontario Aggregate Resources Corporation, 2003.
Mineral Aggregates in Ontario Statistical Update 2003. Available online at: http://www.toarc.com/pdf/stats_2003.pdf Last Accessed October 26, 2009.
Ontario Ministry of Natural Resources, 2009.
Aggregates Main Page. Available online at: http://www.mnr.gov.on.ca/en/Business/Aggregates/ Last Accessed November 3, 2009.
Ontario Ministry of Natural Resources, 2009.
The Aggregate Resource Program. Available online at: http://www.mnr.gov.on.ca/en/Business/Aggregates/2ColumnSubPage/STEL02_167019.html Last Accessed November 3, 2009.
Ontario Ministry of Natural Resources, 2009.
The Economic Importance of Aggregates. Available online at: http://www.mnr.gov.on.ca/en/Business/Aggregates/2ColumnSubPage/STEL02_167056.html Last Accessed November 3, 2009.
Ontario Ministry of Natural Resources, 2009. The Social Importance of Aggregates. Available online at: http://www.mnr.gov.on.ca/en/Business/Aggregates/2ColumnSubPage/STEL02_167057.html Last Accessed November 3, 2009.
Ontario Ministry of Natural Resources, 2009.
The Environmental Uses of Aggregates. Available online at: http://www.mnr.gov.on.ca/en/Business/Aggregates/2ColumnSubPage/201707.html Last Accessed November 3, 2009.
(60119329_mnr_ final_dec 19 2009.docx) - 121 -
Ontario Ministry of Northern Development, Mines and Forestry, 2007. Ontario Mineral and Exploration Statistics 2007. Available online at: http://www.mndm.gov.on.ca/mines/ogs/ims/investment/publications/minstats/minstats.pdf Last Accessed November 3, 2009.
Ontario Ministry of Northern Development, Mines and Forestry, 2009.
Industrial Minerals – Industrial Mineral Mineralization, Exploration and Mining in Ontario, March, 2009. Available online at: http://www.mndm.gov.on.ca/mines/ogs/resgeol/rfe/commodity/industmin.pdf Last Accessed November 3, 2009.
Ontario Ministry of Natural Resources and John Emery Geotechnical Engineering Limited, 2008.
Mineral Aggregate Recycling and Reuse Study: 2008 Pavement Rehabilitation and Preservation Workshop. Available online at: http://www.ogra.org/lib/db2file.asp?fileid=22369. Last Accessed November 3, 2009.
Ontario Stone, Sand and Gravel Association (OSSGA), 2006.
Importance of Aggregate Available online at: http://www.apao.com/Downloads/publicationsPFDs/Importance%20of%20AggregatesOSSGA0606.pdf Last accessed: October 29, 2009.
Ontario Stone, Sand and Gravel Association (OSSGA), 2009. Essential Materials for building. Available online at: http://www.apao.com/
Last Accessed November 3, 2009. Planning 4 Minerals, 2009.
Economics – What are Aggregates Used for? Nottingham: British Geological Society. Available online at: http://www.bgs.ac.uk/planning4minerals/Economics_15.htm Last Accessed on: November 4, 2009.
Planning 4 Minerals, 2009.
Economics – What is the supply and demand of aggregates in Britain? Nottingham: British Geological Society. Available online at: http://www.bgs.ac.uk/planning4minerals/Economics_5.htm Last Accessed on: May 26, 2009.
Planning 4 Minerals, 2009.
Economics – Consumption. Nottingham: British Geological Society. Available online at: http://www.bgs.ac.uk/planning4minerals/Economics_6.htm Last Accessed on: May 26, 2009.

(60119329_mnr_ final_dec 19 2009.docx) - 122 -
Planning 4 Minerals, 2009. Economics – Trade. Nottingham: British Geological Society. Available online at: http://www.bgs.ac.uk/planning4minerals/Economics_7.htm Last Accessed on: May 26, 2009.
Planning 4 Minerals, 2009.
Economics – Introduction. Nottingham: British Geological Society. Available online at: http://www.bgs.ac.uk/planning4minerals/Economics_1.htm Last Accessed on: May 26, 2009.
Planning 4 Minerals, 2009.
Economics – What are Aggregates Used for? Nottingham: British Geological Society. Available online at: http://www.bgs.ac.uk/planning4minerals/Economics_16.htm Last Accessed on: November 4, 2009.
Planning 4 Minerals, 2009.
Economics – Employment. Nottingham: British Geological Society. Available online at: http://www.bgs.ac.uk/planning4minerals/Economics_2.htm Last Accessed on: May 26, 2009.
Planning 4 Minerals, 2009.
Economics – Economic instruments. Nottingham: British Geological Society. Available online at: http://www.bgs.ac.uk/planning4minerals/Economics_3.htm Last Accessed on: May 26, 2009.
Planning 4 Minerals, 2009.
Economics – Structure of the industry. Nottingham: British Geological Society. Available online at: http://www.bgs.ac.uk/planning4minerals/Economics_4.htm Last Accessed on: May 26, 2009.
Planning 4 Minerals, 2009.
Economics – What are the regional aggregate supply issues? Nottingham: British Geological Society. Available online at: http://www.bgs.ac.uk/planning4minerals/Economics_10.htm Last Accessed on: May 26, 2009.
Planning 4 Minerals, 2009.
Economics – Extent of permitted reserves. Nottingham: British Geological Society. Available online at: http://www.bgs.ac.uk/planning4minerals/Economics_11.htm Last Accessed on: May 26, 2009.
(60119329_mnr_ final_dec 19 2009.docx) - 123 -
Planning 4 Minerals, 2009. Economics – Landbanks. Nottingham: British Geological Society. Available online at: http://www.bgs.ac.uk/planning4minerals/Economics_12.htm Last Accessed on: May 26, 2009.
Planning 4 Minerals, 2009.
Economics – What is the significance of quarrying to the local economy? Nottingham: British Geological Society. Available online at: http://www.bgs.ac.uk/planning4minerals/Economics_13.htm Last Accessed on: May 26, 2009.
Planning 4 Minerals, 2009.
Economics – Maximising the local economic benefits of aggregates production. Nottingham: British Geological Society. Available online at: http://www.bgs.ac.uk/planning4minerals/Economics_14.htm Last Accessed on: May 26, 2009.
Planning 4 Minerals, 2009.
Economics – What are the transportation cost issues? Nottingham: British Geological Society. Available online at: http://www.bgs.ac.uk/planning4minerals/Economics_8.htm Last Accessed on: May 26, 2009.
Planning 4 Minerals, 2009.
Economics – Environmental Considerations? Nottingham: British Geological Society. Available online at: http://www.bgs.ac.uk/planning4minerals/Economics_9.htm Last Accessed on: May 26, 2009.
Planning Initiatives Ltd. and Associates, 1992.
Aggregate Resources of Southern Ontario – A State of the Resource Study. Ontario: Ministry of Natural Resources, 1993.
Poulin, R., R.C. Pakalnis, and K. Sinding. 1994.
Aggregate resources: Production and environmental constraints. Environmental Geology: 23, 221-227.
Panorimo, 2009. http://www.panoramio.com/photo/14100769 Province of Manitoba, 2009.
Manitoba Science, Technology, Energy and Mines – Mineral Resources Division: Mining Task Force. Available online at: http://gove.mb.ca/stem/mrd/mtf/mintaskforce-a.html Last Accessed May 26, 2009.
(60119329_mnr_ final_dec 19 2009.docx) - 124 -
Rakshvir, M., and S. Barai. 2006. Studies on recycled aggregates-based concrete. Waste Management and Research. 24, 225-233.
Renew Canada, 2007.
The Top 100 – Canada‟s Biggest Infrastructure Projects, February 2007. Winnipeg: We Communications Inc.
Richards, J., and D. Peel. 2003.
The application of sustainable development principles to the Alberta aggregates resource sector. Exploration and Mining Geology. 12, 79-95.
Roe, E. and M. van Eeten. 2002.
Reconciling ecosystem rehabilitation and service reliability mandates in large technical systems: Findings and implications of three Major US ecosystem Management initiatives for managing human-dominated aquatic-terrestrial ecosystems. Ecosystems, 5: 509-528.
Schnelle, K., and C. Brown, 2001.
Air Pollution Control Techonology Fact Sheet. EPA-CICA Fact Sheet. Available online at: http://www.epa.gov/ttn/catc/dir1/ffdg.pdf Last Accessed October 29, 2009.
Science Daily, 2009.
Diversity of Birds Buffer Against West Nile Virus. Available online at: http://www.sciencedaily.com/releases/2009/02/090220191318.htm. Last Accessed on: November 3, 2009.
South Carolina Department of Health and Environmental Control, 2007.
State of the Knowledge Report: Stormwater Ponds in the Coastal Zone. Available
online at: http://www.scdhec.gov/environment/ocrm/science/ Last Accessed December 14, 2009.
Statistics Canada, 1991.
Statistics Canada‟s Input-Output Model: General Description, Critical Analysis of Partially Closed Version and Alternative Solutions #52-E. Ottawa: Statistics Canada.
Statistics Canada, 2005. Provincial Input-Output Multipliers. Prepared by: Industry Accounts Division / System of National Accounts. Released November 6, 2008.

(60119329_mnr_ final_dec 19 2009.docx) - 125 -
Statistics Canada, 2009a. Table 379-0025 - Gross domestic product (GDP) at basic prices, by North American Industry Classification System (NAICS) and province, annual (dollars), CANSIM (database). Available online at: http://cansim2.statcan.gc.ca/cgi-win/cnsmcgi.exe?Lang=E&CNSM-Fi=CII/CII_1-eng.htm Last accessed July 22, 2009.
Statistics Canada, 2009b. Table 384-0001 - Gross domestic product (GDP), income-based, provincial economic accounts, annual (dollars), CANSIM (database). Available online at: http://cansim2.statcan.gc.ca/cgi-win/cnsmcgi.exe?Lang=E&CNSM-Fi=CII/CII_1-eng.htm Last accessed July 21, 2009.
Statistics Canada, 2009c.
Components of population growth, by province and territory (Quebec, Ontario, Manitoba, Saskatchewan). Available online at: http://www12.statcan.ca/English/census01/products/standard/popdwell/Table-UR-D.cfm?T=1&PR=35&SR=26&S=1&O=A Last accessed August 20, 2009.
Stone, Sand and Gravel: The Hole Story, 2009.
If Not Where then Here – Keeping It Close to Home, 2009. Available online at: http://www.theholestory.ca/inhtw.php Last Accessed November 3, 2009.
Stone, Sand and Gravel, 2009.
Shaping Landscapes for Tomorrow. Available online at: http://www.nssga.org/sustainability/pdfs/Shaping_Landscapes_For_Tomorrow.pdf Last Accessed November 3, 2009.
The Ontario Aggregate Resources Corporation, 1998.
Mineral Aggregates in Ontario – Production Statistics and Review, 1998. Burlington: The Ontario Aggregate Resources Corporation.
The Ontario Aggregate Resources Corporation, 1999.
Mineral Aggregates in Ontario – Production Statistics, 1999. Burlington: The Ontario Aggregate Resources Corporation.
The Ontario Aggregate Resources Corporation, 2000.
Mineral Aggregates in Ontario – Production Statistics, 2000. Burlington: The Ontario Aggregate Resources Corporation.
The Ontario Aggregate Resources Corporation, 2001.
Mineral Aggregates in Ontario – Production Statistics, 2001. Burlington: The Ontario Aggregate Resources Corporation.

(60119329_mnr_ final_dec 19 2009.docx) - 126 -
The Ontario Aggregate Resources Corporation, 2002. Mineral Aggregates in Ontario – Production Statistics, 2002. Burlington: The Ontario Aggregate Resources Corporation.
The Ontario Aggregate Resources Corporation, 2003. Mineral Aggregates in Ontario – Production Statistics, 2003. Burlington: The Ontario Aggregate Resources Corporation.
The Ontario Aggregate Resources Corporation, 2004. Mineral Aggregates in Ontario – Production Statistics, 2004. Burlington: The Ontario Aggregate Resources Corporation.
The Ontario Aggregate Resources Corporation, 2005. Mineral Aggregates in Ontario – Production Statistics, 2005. Burlington: The Ontario Aggregate Resources Corporation.
The Ontario Aggregate Resources Corporation, 2006.
Mineral Aggregates in Ontario – Production Statistics, 2006. Burlington: The Ontario Aggregate Resources Corporation.
The Ontario Aggregate Resources Corporation, 2007.
Mineral Aggregates in Ontario – Production Statistics, 2007. Burlington: The Ontario Aggregate Resources Corporation.
The Ontario Aggregate Resources Corporation, 2009. http://www.toarc.com/. Toronto Environmental Alliance, 2008.
Dig Conservation, Not Holes – A report on the GTA‟s Thirst for Gravel and How to Quench it. Available online at: http://www.torontoenvironment.org/gravel Last Accessed November 3, 2009.
Toronto Transit Commission (TTC) 2009.
http://www3.ttc.ca/About_the_TTC/Projects_and_initiatives/Spadina_subway_extension/index.jsp
Toronto Zoo, 2009. Adopt-a-Pond: Stormwater Retention and Urban Runoff Treatment Ponds. Available online at: http://www.torontozoo.com/AdoptAPond/healthywater sheds.asp?opx=3 Last Accessed December 14, 3009.
(60119329_mnr_ final_dec 19 2009.docx) - 127 -
Walker, Celeste, 2003-2009. Cambridge Now: Green Party‟s Elizabeth May Urges Tighter Ontario Government Regulations On Aggregate Industry. Available Online at: http://www.cambridgenow.ca/npps/story.cfm?nppage=989 Last Accessed November 3, 2009.
Wikipedia, 2009. http://en.wikipedia.org/wiki/File:Wolfe_island_wind_farm_ls_09.JPG

112870_MNR_App Title Pgs_Final.Docx
Ministry of Natural Resources
Social Value of the Aggregate Industry
To the Ontario Public
August 2009
Prepared for: AECOM

TABLE OF CONTENTS
1 RESEARCH OVERVIEW AND KEY FINDINGS ............................................................ 1
1.1 RESEARCH OBJECTIVES ..................................................................................................... 1 1.2 STUDY AREAS AND APPROACH.......................................................................................... 2 1.3 KEY FINDINGS .................................................................................................................. 2
2 ENGAGEMENT WITH THE AGGREGATES INDUSTRY .......................................... 55
3 COMMUNITY WELL-BEING .......................................................................................... 77
3.1 WHAT PEOPLE VALUE ABOUT THEIR COMMUNITY .......................................................... 77 3.2 RELATIVE IMPORTANCE OF THEIR VALUES ...................................................................... 99
4 DEVELOPMENT AND INFRASTRUCTURE PROJECT NEEDS ........................... 1313
4.1 CONTRIBUTION OF PROJECTS TO COMMUNITY WELL-BEING ........................................ 1313 4.2 KNOWLEDGE ABOUT THE AGGREGATE INDUSTRY ....................................................... 1515
5 SOCIAL COSTS AND BENEFITS OF AGGREGATE EXTRACTION ................... 1919
5.1 SOCIAL COSTS ............................................................................................................ 1919 5.2 SOCIAL BENEFITS ........................................................................................................ 2020
6 TECHNICAL APPENDIX ............................................................................................. 2323
6.1 SURVEY OVERVIEW .................................................................................................... 2323 6.2 RESPONDENT PROFILE ................................................................................................. 2323 6.3 QUESTIONNAIRE.......................................................................................................... 2525 6.4 PORTLAND CEMENT GEOGRAPHIC AREAS ................................................................... 3030 6.5 QUALITY ASSURANCE ................................................................................................. 3131 6.6 RECORD OF CALL ........................................................................................................ 3434


AECOM – MNR VALUE OF AGGREGATES STUDY 1
1 RESEARCH OVERVIEW AND KEY FINDINGS
1.1 RESEARCH OBJECTIVES
AECOM was contracted by the Ministry of Natural Resources (MNR) to
examine the Value of Aggregates, as part of a larger body of work entitled,
the State of the Aggregate Resources in Ontario Study (SAROS). The Value of
Aggregates Study examined the social, economic, and ecological values of
aggregates (i.e. stone, sand and gravel) in Ontario. AECOM retained
IntelliPulse Inc. to undertake a public opinion survey on the social values
associated with the aggregate industry. In Ontario, aggregates are used to
repair and maintain the current infrastructure and as the province‟s
population increases; to expand current and build new infrastructure and
development projects. It was anticipated that Ontarians would have various
opinions regarding the social costs and benefits related to the aggregate
industry and that the public‟s knowledge of the aggregate industry could vary
widely.
The overall purpose of this study was to determine the social value placed by
the public on the aggregate component of Ontario‟s development and
infrastructure needs and to gain some understanding of the public‟s
knowledge of the aggregate industry. The specific objectives of this study
were to gather data regarding:
The relative importance of development and infrastructure projects to
things the public value about their community that contribute to
quality of life;
The importance assigned to various types of new development and
infrastructure projects in relation to their community‟s well-being;
Knowledge of the Ontario aggregate industry; and
Public opinion regarding the social costs and benefits of aggregate
extraction.
IntelliPulse is pleased to present the results of this survey of social values of
the aggregate industry among the Ontario public. The following sections
provide the frequency responses to each question. Crosstabular analysis was
undertaken to examine whether there are significant differences by three
categories. The first, Geography, defines respondents by their location
within one of the eight Portland Cement Association Geographic Areas (see
Appendix 6.4 for figure). The second, Demographic Characteristics,
defines respondents by their stated age as grouped into one of 6 age
categories and by their gender, as identified by the interviewer. The third,
Perceived Direct Experiences (PDE), defines respondents by the
perceived geographical proximity of a stone, sand or gravel pit or quarry to
their home or a perceived geographical proximity of their home to a stone,
sand or gravel transportation route. Significant differences are noted in the
text.

AECOM – MNR VALUE OF AGGREGATES STUDY 2
1.2 STUDY AREAS AND APPROACH
In order to fulfill these research objectives a questionnaire was developed by
AECOM for telephone administration, a copy of which is included in the
Technical Appendix Section 6.3. IntelliPulse Inc. developed a sample design
within the eight Portland Cement Regions to achieve a target level of
confidence in the information collected.
The findings provided in this report are based on a random sample of Ontario
residents. A total of 1420 interviews were conducted. A sample of this size
yields results that are accurate within +2.6%, 19 out of 20 times.
A disproportional provincial sample allocation was developed in order to have
a sufficient sample size in each of the eight Portland Cement Association
geographic areas to examine whether there are significant differences in
responses by area. A minimum of 150 interviews were allocated per area to
achieve a minimum accuracy level of +8.1%, 19 out of 20 times. The
geographic area samples were weighted to ensure proportional
representation for reporting the total Ontario results. The weighting
procedure is presented in the Technical Appendix. The following table
summarizes the geographic area sample sizes and their respective confidence
intervals.
Table 1.2 Ontario Sample Allocation
Sample Confidence Interval,
Geographic Area Actual Weighted +19 / 20 times
Area 1 – Southwest 153 161 8.1
Area 2 - Peninsula 153 136 8.1
Area 3 - West Central 153 154 8.1
Area 4 - GTA 354 651 5.3
Area 5 - East Central 151 57 8.1
Area 6 - East 152 169 8.1
Area 7 - Northeast 154 51 8.1
Area 8 - Northwest 150 41 8.1
Ontario Total 1,420 1,420 2.6
The telephone survey was administered by The Logit Group Inc. (Toronto,
Ontario) under the direct supervision of IntelliPulse Inc. and AECOM. A pre-
test was conducted on July 28, 2009. Interviewing dates were July 28 to
August 6, 2009. The survey‟s average duration was 15 minutes.
1.3 KEY FINDINGS
Contact with the industry
A core group of respondents reported some perceived direct
experience with various aspect of the aggregate industry. One-third
of the respondents (33%) claimed to live near a stone, sand and

AECOM – MNR VALUE OF AGGREGATES STUDY 3
gravel pit or quarry, and one-quarter (25%) claimed to live near a
stone, sand and gravel transportation route. Three percent (3%)
reported that they themselves or someone in their household was
employed in the aggregate or an associated industry (i.e. road or
building construction).
Values attributed to their community
A variety of things were valued in the respondents‟ community that
contribute to their quality of life. When asked to name up to three
things, the most frequently reported were those related to municipal
infrastructure/services (73%) including parks and trails, and
cleanliness and up-keep of the community.
Respondents were asked to rate the importance of development and
infrastructure projects relative to other valued things in their
community that contribute to quality of life:
30% of respondents indicated that there are no other things in
their communities that were more important than development
and infrastructure projects. 29% stated that nature and the
environment were more important. 21% name social aspects of
their community and 20% name municipal characteristics as
being more important. 17% name the human aspects (i.e. public
safety/personal security, small town/village feel).
72% of respondents stated that development and infrastructure
projects were less important than the three things they value
about their community. The remaining 28% of respondents stated
that natural/environmental aspects, municipal infrastructure and
services aspects and social aspects were less important than
infrastructure and development projects.
Contributors to Community Well-being
Respondents were asked about the importance of eight types of
development and infrastructure projects in respect to their
contribution to community well-being. Of these, the highest rated in
importance was maintaining or repairing existing highways or roads
(60% “very important”).
Fewer than half rated the remaining projects as “very important”.
However, more than half the respondents rated building new
institutional buildings (68% “very” and “somewhat” important), new
energy facilities (57%) and new highways or roads (51%) as
important.
Fewer than half the respondents stated it is important to build new
railways (40%), new residential buildings (34%), and new industrial
buildings (34%).
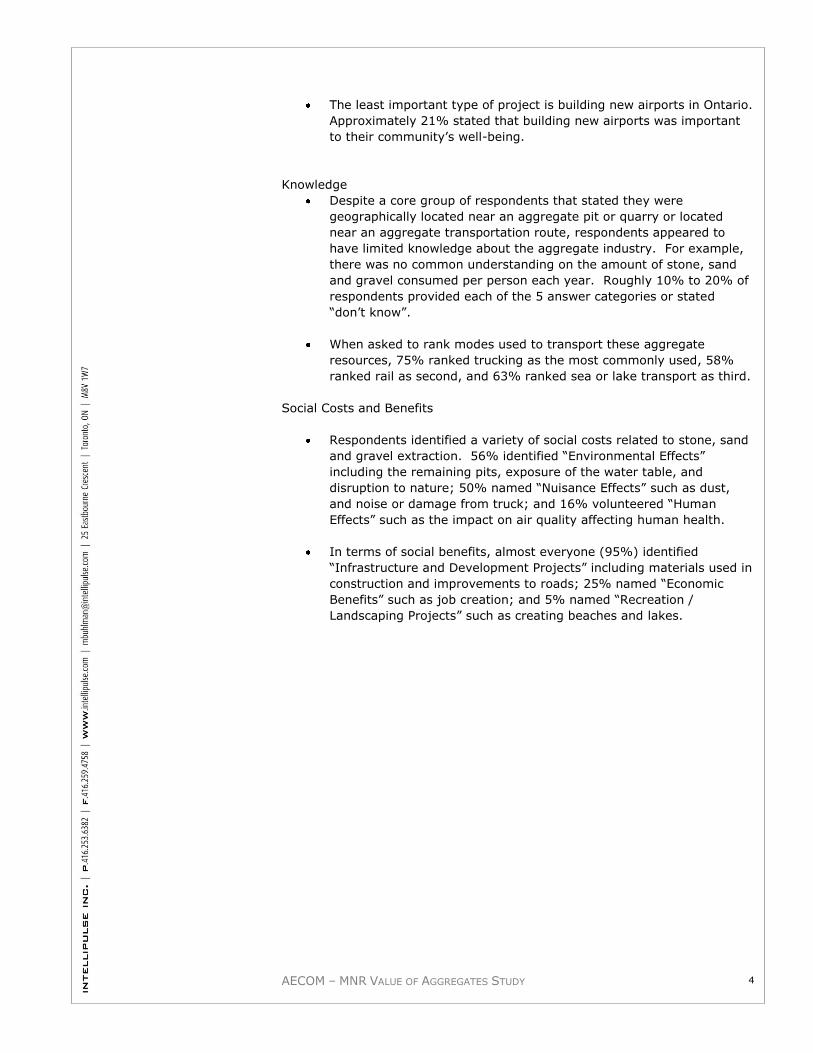
AECOM – MNR VALUE OF AGGREGATES STUDY 4
The least important type of project is building new airports in Ontario.
Approximately 21% stated that building new airports was important
to their community‟s well-being.
Knowledge
Despite a core group of respondents that stated they were
geographically located near an aggregate pit or quarry or located
near an aggregate transportation route, respondents appeared to
have limited knowledge about the aggregate industry. For example,
there was no common understanding on the amount of stone, sand
and gravel consumed per person each year. Roughly 10% to 20% of
respondents provided each of the 5 answer categories or stated
“don‟t know”.
When asked to rank modes used to transport these aggregate
resources, 75% ranked trucking as the most commonly used, 58%
ranked rail as second, and 63% ranked sea or lake transport as third.
Social Costs and Benefits
Respondents identified a variety of social costs related to stone, sand
and gravel extraction. 56% identified “Environmental Effects”
including the remaining pits, exposure of the water table, and
disruption to nature; 50% named “Nuisance Effects” such as dust,
and noise or damage from truck; and 16% volunteered “Human
Effects” such as the impact on air quality affecting human health.
In terms of social benefits, almost everyone (95%) identified
“Infrastructure and Development Projects” including materials used in
construction and improvements to roads; 25% named “Economic
Benefits” such as job creation; and 5% named “Recreation /
Landscaping Projects” such as creating beaches and lakes.

AECOM – MNR VALUE OF AGGREGATES STUDY 5
2 ENGAGEMENT WITH THE AGGREGATES INDUSTRY
At the outset of the survey, respondents were asked whether they reside
near a stone, sand and gravel quarry or a transportation route, and whether
they or anyone in their household is employed in the aggregate or related
industry (such as construction). These questions helped to set a potential for
Perceived Direct Experiences (PDE) with the aggregate industry that may
have an influence on respondents‟ answer to other questions.
As can be seen in Table 2-1, one-third of the respondents (33%) claimed to
live near a stone, sand and gravel pit or quarry, and one-quarter (25%)
claimed to live near a stone, sand and gravel transportation route.
Table 2-1: Contact with the Aggregate
Industry
Pit or Quarry Near Their
Home
Home Near Transportation
Route
% N % N
Yes 33 (473) 25 (355)
No 61 (860) 67 (945)
Don't know 6 (88) 8 (120)
n 100 (1420) 100 (1420)
Note: Percentages may not sum to 100% due to rounding. Q1, 2
As is to be expected, there was a relationship between these two industry
contact questions. Half of the respondents (53%) who lived near a quarry
also claimed to live near a transportation route; one-in-ten respondents
(11%) who stated they do not live near a quarry claimed to live near a stone,
sand and gravel transportation route. In total, 24% of all respondents
claimed to live near a quarry or a transportation route. PDE refers to
residents that either said that they lived near a pit or quarry or near to a
transportation route.
In terms of statistically significant differences by respondent characteristics:
GEOGRAPHY
Respondents in Areas 5 East Central (58%) and 7 Northeast (58%)
were more like to say they live near a pit or quarry, and Area 4 GTA
(18%) respondents are least likely.
DEMOGRAPHIC CHARACTERISTICS
Men (37%) and older respondents (45 to 54 years of age, 38%) were
more likely to say they lived near a quarry or pit. Men (29%) and
older respondents (55 to 64 years of age, 30%) were more likely to
say they lived near a stone, sand and gravel transportation route.

AECOM – MNR VALUE OF AGGREGATES STUDY 6
As can be seen in Table 2-2, very few respondents were themselves or have
someone in their household employed by the aggregate industry or related
industries such as road or building construction. Those who were employed
in the industry were asked “In what way is that person employed in the
aggregate industry?” The types of occupations are listed in the second
portion of Table 2-2. A variety of occupations are named, although each
category has few respondents.
Table 2-2: Way in Which a Household
Member is Employed in the Aggregate
Industry
% n
Employed in the Industry:
Yes 3 (41)
No 97 (1375)
n 100 (1417)
Yes - In what way:
Construction - general 18 (8)
Road construction 17 (7)
Gravel/pit quarry 16 (7)
Home construction/ contractor 11 (5)
Heavy equipment operator/ crush stone
9 (4)
Business owner 8 (3)
Miner/aggregate company 5 (2)
Mechanic 3 (1)
Truck driver 3 (1)
Other 23 (9)
Don‟t know/refused 4 (2)
Total # of respondents (41)
Note: Percentages for q4 sum to more than 100% as more than one response was accepted. Base: Household member works in the industry in Q3. Q3, 4
There are too few respondents who themselves or a household member is
employed in the aggregate industry to examine responses by geographic area
or demographic characteristics. Due to the low number of respondents in this
category, these respondents were not considered as part of the PDE
characteristics.

AECOM – MNR VALUE OF AGGREGATES STUDY 7
3 COMMUNITY WELL-BEING
3.1 WHAT PEOPLE VALUE ABOUT THEIR COMMUNITY
Prior to a discussion about the value of aggregates to Ontario the survey
asked, “There are many things that people value about their community that
contribute to their quality of life. In your opinion, what are some of the
things that you value?”
A variety of volunteered responses were obtained, and for simplicity they
have been grouped into four main categories. As can be seen in Table 3.1
(next page), a number of values were identified, summarized as follows:
Municipal Infrastructure/Services Aspects - Almost three-quarters of
the respondents (73%) valued various aspects of living in their
municipality. The most frequent mentions were parks/trails (19%)
and the cleanliness and up-keep of their community (10%). Notably,
6% mentioned infrastructure projects including highways and roads.
The remaining values are named by fewer than 10% of respondents
each.
Natural/Environmental Aspects - Four-in-ten respondents (41%)
mentioned green space/trees/wildlife (20%), clean, fresh air/no
pollution (14%) or access to lakes (7%).
Social Aspects - One-third of the respondents (39%) also volunteered
a social characteristic contributing to quality of life. The most
frequent mentions were quiet neighbourhood (16%) and community /
friendly neighbours (13%).
Human Aspects - One-third of the respondents (37%) mentioned a
human aspect that they value, including public or personal security
(14%) and access to amenities (13%).
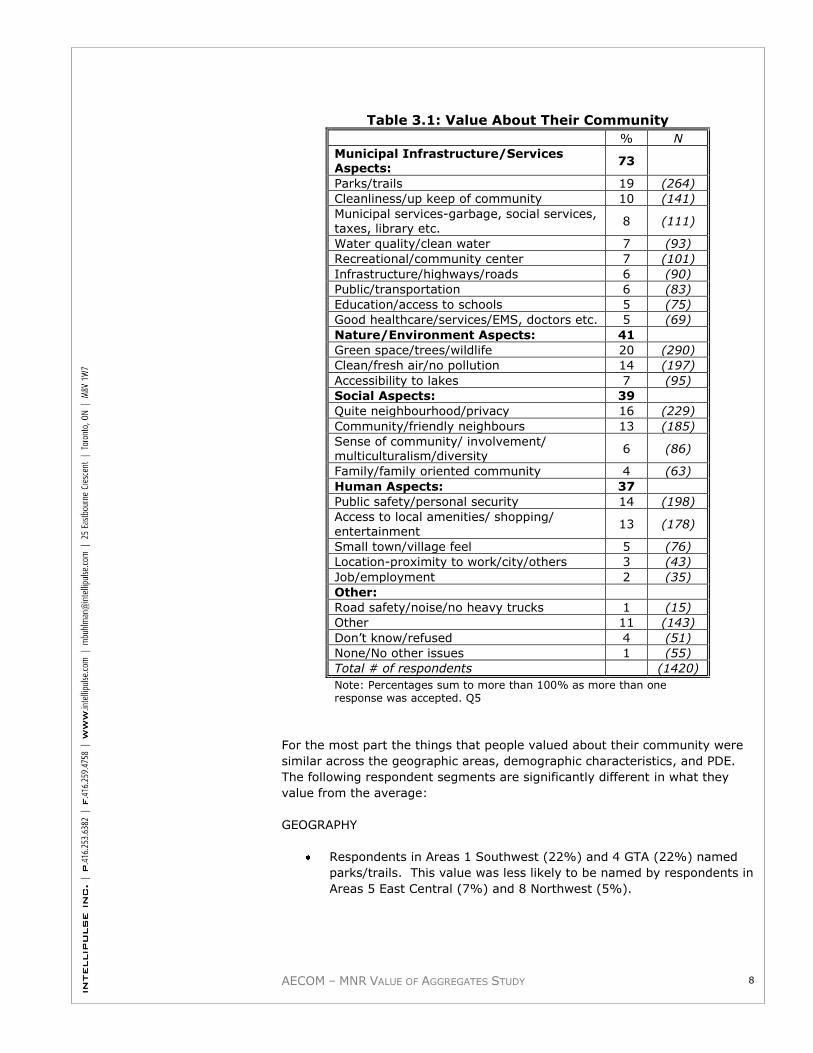
AECOM – MNR VALUE OF AGGREGATES STUDY 8
Table 3.1: Value About Their Community
% N
Municipal Infrastructure/Services Aspects:
73
Parks/trails 19 (264)
Cleanliness/up keep of community 10 (141)
Municipal services-garbage, social services,
taxes, library etc. 8 (111)
Water quality/clean water 7 (93)
Recreational/community center 7 (101)
Infrastructure/highways/roads 6 (90)
Public/transportation 6 (83)
Education/access to schools 5 (75)
Good healthcare/services/EMS, doctors etc. 5 (69)
Nature/Environment Aspects: 41
Green space/trees/wildlife 20 (290)
Clean/fresh air/no pollution 14 (197)
Accessibility to lakes 7 (95)
Social Aspects: 39
Quite neighbourhood/privacy 16 (229)
Community/friendly neighbours 13 (185)
Sense of community/ involvement/ multiculturalism/diversity
6 (86)
Family/family oriented community 4 (63)
Human Aspects: 37
Public safety/personal security 14 (198)
Access to local amenities/ shopping/
entertainment 13 (178)
Small town/village feel 5 (76)
Location-proximity to work/city/others 3 (43)
Job/employment 2 (35)
Other:
Road safety/noise/no heavy trucks 1 (15)
Other 11 (143)
Don‟t know/refused 4 (51)
None/No other issues 1 (55)
Total # of respondents (1420)
Note: Percentages sum to more than 100% as more than one response was accepted. Q5
For the most part the things that people valued about their community were
similar across the geographic areas, demographic characteristics, and PDE.
The following respondent segments are significantly different in what they
value from the average:
GEOGRAPHY
Respondents in Areas 1 Southwest (22%) and 4 GTA (22%) named
parks/trails. This value was less likely to be named by respondents in
Areas 5 East Central (7%) and 8 Northwest (5%).

AECOM – MNR VALUE OF AGGREGATES STUDY 9
Green space was more likely to be named by respondents in Area 8
Northeast (30%) and least likely in Area 7 Northeast (14%).
Respondents in Area 8 Northeast were more likely to name Nature
Environment Aspects (52%).
DEMOGRAPHIC CHARACTERISTICS
Older respondents (65 years of age or older, 16%) were more likely
to name clean/fresh air/no pollution, and overall were more likely to
name Natural Environment Aspects (44%). Respondents under 25
years of age were more likely to state “no other”.
Women (22%) and younger respondents (25 to 34 years of age,
34%) were more likely to name parks/trails.
PDE
Parks and trails were less likely to be named by respondents who
claimed live near a quarry or pit (14%).
3.2 RELATIVE IMPORTANCE OF THEIR VALUES
To gauge the relative importance of the things valued about their community,
respondents were asked which of the things they named was more important
and which was less important than development and infrastructure projects
that happen in their community.
Table 3.2-1 (next page) presents the things respondents valued more than
development or infrastructure projects. By way of a summary:
Notably, 30% of respondents considered Municipal Infrastructure /
Services Aspects to be most important to their community well-being
– more important than any other aspect.
Of the remaining respondents, 21% stated that Nature and
Environment was more important than development or infrastructure
projects.
Approximately 19% of respondents named Social Aspects of their
community. Slightly fewer (17%) name the Human Aspects that they
value most.
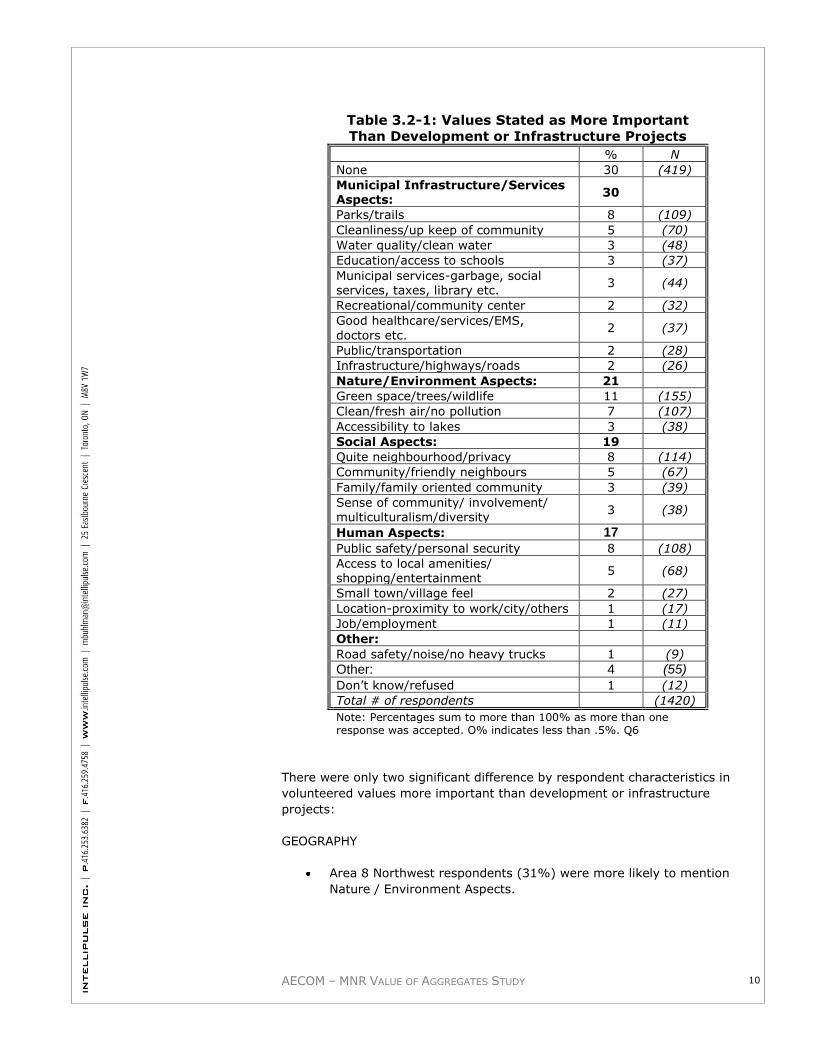
AECOM – MNR VALUE OF AGGREGATES STUDY 10
Table 3.2-1: Values Stated as More Important
Than Development or Infrastructure Projects
% N
None 30 (419)
Municipal Infrastructure/Services Aspects:
30
Parks/trails 8 (109)
Cleanliness/up keep of community 5 (70)
Water quality/clean water 3 (48)
Education/access to schools 3 (37)
Municipal services-garbage, social services, taxes, library etc.
3 (44)
Recreational/community center 2 (32)
Good healthcare/services/EMS,
doctors etc. 2 (37)
Public/transportation 2 (28)
Infrastructure/highways/roads 2 (26)
Nature/Environment Aspects: 21
Green space/trees/wildlife 11 (155)
Clean/fresh air/no pollution 7 (107)
Accessibility to lakes 3 (38)
Social Aspects: 19
Quite neighbourhood/privacy 8 (114)
Community/friendly neighbours 5 (67)
Family/family oriented community 3 (39)
Sense of community/ involvement/ multiculturalism/diversity
3 (38)
Human Aspects: 17
Public safety/personal security 8 (108)
Access to local amenities/ shopping/entertainment
5 (68)
Small town/village feel 2 (27)
Location-proximity to work/city/others 1 (17)
Job/employment 1 (11)
Other:
Road safety/noise/no heavy trucks 1 (9)
Other: 4 (55)
Don‟t know/refused 1 (12)
Total # of respondents (1420)
Note: Percentages sum to more than 100% as more than one response was accepted. O% indicates less than .5%. Q6
There were only two significant difference by respondent characteristics in
volunteered values more important than development or infrastructure
projects:
GEOGRAPHY
Area 8 Northwest respondents (31%) were more likely to mention
Nature / Environment Aspects.

AECOM – MNR VALUE OF AGGREGATES STUDY 11
DEMOGRAPHIC CHARACTERISTICS
Women (18%) were more likely to name Human Aspects.
The findings in Table 3.2-2 summarize the values stated as less important
than development or infrastructure. 72% of respondents stated that
development and infrastructure projects were less important than the things
they stated contribute to their community well-being. 11% or fewer stated
that Municipal Infrastructure/Services, Nature / Environment, Social, or
Human aspects were less important that development or infrastructure
projects.
Table 3.2-2: Values Stated as Less Important Than
Development or Infrastructure Projects
% n
None 72 (1020)
Municipal Infrastructure/Services Aspects:
11
Parks/trails 3 (41)
Cleanliness/up keep of community 2 (22)
Infrastructure/highways/roads 2 (22)
Municipal services-garbage, social services,
taxes, library etc. 1 (20)
Public/transportation 1 (12)
Water quality/clean water 1 (11)
Recreational/community center 1 (18)
Education/access to schools 0 (6)
Good healthcare/services/EMS, doctors etc. 0 (5)
Social Aspects: 6
Quite neighbourhood/privacy 2 (38)
Community/friendly neighbours 2 (32)
Sense of community/ involvement/
multiculturalism/ diversity 1 (15)
Family/family oriented community 1 (7)
Human Aspects: 5
Access to local amenities/ shopping/
entertainment 3 (40)
Small town/village feel 1 (20)
Public safety/personal security 1 (17)
Job/employment 0 (6)
Location-proximity to work/city/others 0 (6)
Nature/Environment Aspects: 4
Green space/trees/wildlife 2 (35)
Accessibility to lakes 1 (20)
Clean/fresh air/no pollution 1 (13)
Other:
Road safety/noise/no heavy trucks 0 (1)
Other 1 (26)
Don‟t know/refused 1 (9)
Total # of respondents (1420)
Note: Percentages sum to more than 100% as more than one response was accepted. O% indicates less than .5%. Q7

AECOM – MNR VALUE OF AGGREGATES STUDY 12
There were no significant differences in each response category by
geographic area, demographic characteristics, or PDE either on their own or
grouped, other than the response “none”:
DEMOGRAPHIC CHARACTERISTICS
Older respondents (65 years of age or older) were more likely to say
“none” (i.e. that development and infrastructure projects were less
important than the other things they value about their community
well-being) (78%).

AECOM – MNR VALUE OF AGGREGATES STUDY 13
4 DEVELOPMENT AND INFRASTRUCTURE PROJECT
NEEDS
4.1 CONTRIBUTION OF PROJECTS TO COMMUNITY WELL-BEING
Respondents were asked to rate the importance of some types of
development and infrastructure projects with respect to their contribution to
their community‟s well-being. There were clear demarcations as to which
types of projects the public believed to be more and less important to
community well-being By way of summarizing the findings in Figure 4.1:
The most important type of project was maintaining or repairing
existing highways or roads. Not only did 88% of the respondents
state that this type of project was important, but 60% stated it was
“very important”.
Approximately 68% of respondents stated that building new
institutional buildings (such as schools or hospitals) was important,
with 41% stating “very important”.
Approximately half of the respondents stated that building new
energy facilities (57%) and new highways or roads (51%) was
important. Notably, almost as many volunteered that they were “not
sure” how important these projects were or stated they were
“somewhat” important.
Fewer than half the respondents (40%) stated it is important to build
new railways.
There was little agreement among respondents about the importance
new railways given the similar proportions of respondents distributed
across all answer categories.
One-third of respondents stated that building new residential
buildings (34%) and new industrial buildings (such as factories or
repair shops) (34%) was important.

AECOM – MNR VALUE OF AGGREGATES STUDY 14
Figure 4.1: Importance of Various Development and
Infrastructure Projects
(% of respondents)
9
16
12
21
27
32
41
60
12
18
22
19
24
25
27
28
23
30
22
22
24
16
9
25
20
20
16
14
9
9
3
30
24
16
22
13
9
7
1
23
Airports in Ontario
Industrial buildings
Residential buildings
Railways
Highways or roads
Energy facilities
Institutional buildings
Maintain, repair
highways or roads
Very important Somewhat important Not sureNot very important Not at all important
A higher proportion of respondents stated building new residential
buildings (36%) and new industrial buildings (44%) were not
important.
The least important type of project was building new airports in
Ontario. Less than one-quarter (21%) stated it was important to
their community‟s well-being while 55% stated it is not important.
There are several project types where segments of respondents are more
likely than the average to state that a development or infrastructure project
is important:
GEOGRAPHY
Building new institutional buildings – was rated higher in importance
among respondents in Area 4 GTA (47%).
Building new highways or road – was rated higher in importance in
Areas 7 Northeast (47%) and 8 Northwest (51%).
Building new residential buildings – was rated higher in importance in
Areas 7 Northeast (17%) and 8 Northwest (18%).
AECOM – MNR VALUE OF AGGREGATES STUDY 15
Building new industrial buildings – was rated higher in importance in
Area 8 Northwest (34%).
Building new airports – was rated higher in importance in Areas 7
Northeast (16%) and 8 Northwest (18%).
DEMOGRAPHIC CHARACTERISTICS
Maintaining or repairing existing highways or roads – was rated
higher in importance by older respondents (65 years of age or older,
68% “very important”).
Building new energy facilities – was rated higher in importance by
men (36%).
Building new highways or road – was rated higher in importance by
men (30%).
Building new railways - was rated higher in importance by older
respondents (65 years of age or older, 31%).
Building new industrial buildings – was rated higher in importance by
men (19%), and respondents who are older (55 years of age or older,
21%).
4.2 KNOWLEDGE ABOUT THE AGGREGATE INDUSTRY
Several questions were asked to gauge the public‟s knowledge about the
aggregate industry. First, respondents were asked “If you have to guess how
many tonnes of stone, sand and gravel do you think are consumed per
person each year?”
As can be seen in Figure 4.2, the range of responses was similar across most
of the answer categories. It should be noted that according to the Ontario
Stone, Sand and Gravel Association (OSSGA, 2009) the average Ontarian
uses 14 tonnes of aggregate per year.

AECOM – MNR VALUE OF AGGREGATES STUDY 16
Figure 4.2: Amount of Stone, Sand and Gravel
Consumed per Person Each Year
(% of respondents)
Don't
know
21%
16-20
tonnes
10%
More
than 20
18%
1-5
tonnes
18%
6-10
tonnes
19% 11-15
tonnes
14%
Moreover, there were no significant differences by geographic area, PDE, and
by almost all demographic characteristics. The one exception is based on
gender:
DEMOGRAPHIC CHARACTERISTICS
Men (22%) were more likely than women (14%) to state each person
consumes more than 20 tonnes each year and hence overestimate
the amounts of aggregates used.
These findings suggest that respondents did not understand the amount of
aggregates consumer per person each year.
Respondents were then asked “Where do you think the pits and quarries used
to extract stone, sand and gravel resources are located?” As can be seen in
Table 4.2-1, approximately 50% of the respondents stated that the pits and
quarries were located within 25 km of where they live. 38% state within 100
km, 30% in Northern Ontario, and 22% in Southern Ontario.
Table 4.2-1: Location of Pits & Quarried to
Extract Stone, Sand and Gravel
% n
Within 25 km of where you live 49 (698)
Within 100 km of where you live
38 (535)
In Northern Ontario 30 (423)
In Southern Ontario 22 (318)
Outside of Ontario 13 (186)
Don't know/not sure 8 (107)
Total # of respondents (1420)
Note: Percentages sum to more than 100% as more than one response was accepted. Q17
AECOM – MNR VALUE OF AGGREGATES STUDY 17
In terms of significant differences in responses by respondent characteristics:
GEOGRAPHY
Respondents in Areas 3 West Central (73%), 2 Peninsula (71%), 7
Northeast (68%), 8 Northwest (65%), 5 East Central (65%), and 6
East (64%) were more likely to state within 25 km of where they live.
Area 4 GTA (30%) was least likely to provide this response.
Northern Ontario was more likely to be named in Areas 8 Northwest
(40%), 4 GTA (36%) and 7 Northeast (34%).
DEMOGRAPHIC CHARACTERISTICS
Men (52%) and older respondents (45 years of age or more, 59%),
were more likely to state within 25 km of where they live.
Northern Ontario was more likely to be named by women (33%).
Women (11%) and respondents with a household income of less than
$20,000 (19%) were more likely to state “don‟t know”.
PDE
Respondents who claimed to have a pit or quarry where they lived
(76%) or had a transportation route near them (72%) were more
likely to say they live within 25 km of a pit or quarry.
Respondents were asked then to rank order three modes of transporting
stone, sand and gravel resources from the pits and quarries to where they
are needed. Table 4.2-2 presents the ranking distribution for each mode.
Findings indicate that:
Three-quarters of the respondents (75%) mentioned truck as the
most commonly used form of transportation.
Rail was the second most commonly used transportation mode with
over half giving it a 2 ranking (58%).
The least commonly used mode was sea or lake transport, although
one-third rate it first or second (37%).

AECOM – MNR VALUE OF AGGREGATES STUDY 18
Table 4.2-2: Ranking of Modes to
Transport Aggregates
% n
Transport type: Rank:
Truck 1 75 (1060)
2 13 (181)
3 13 (178)
Rail 1 18 (263)
2 58 (817)
3 24 (341)
Sea or Lake 1 7 (97)
2 30 (422)
3 63 (901)
Total (1420)
Note: Percentages may not sum to 100% due to rounding. 1 is the most commonly used transportation mode, 3 the least. Q18
In terms of significant differences in answers by respondent characteristics:
GEOGRAPHY
Truck transport was more likely to be ranked higher in Areas 5 East
Central (87%) and 3 West Central (86% provide a 1 ranking).
Rail transport received a higher ranking than the average by Area 4
GTA respondents (25%).
Sea or lake transport was ranking higher among respondents in Area
1 Southwest (13% rate it as first).
DEMOGRAPHIC CHARACTERISTICS
Truck transport was more likely to be ranked higher by older
respondents (65 years of age or older, 80%).
Rail transport received a higher ranking than the average among
younger respondents (under 25 years of age, 35% rate it as first),
and women (21%).
PDE
Truck transport was more likely to be ranked higher by those who
said they lived near a pit or quarry (82%) or transportation route
(82%).
Rail transport received a higher ranking than the average by those
who said they did not live near a pit or quarry (21%) or a
transportation route (21%).

AECOM – MNR VALUE OF AGGREGATES STUDY 19
5 SOCIAL COSTS AND BENEFITS OF AGGREGATE
EXTRACTION
5.1 SOCIAL COSTS
Respondents were asked to identify what they considered to be the most
adverse or negative effects of stone, sand and gravel extraction. As can be
seen in Table 5.1, respondents identified a variety of negative effects, with
fewer than 15% volunteering each response category. The highest single
response was “don‟t know” (16%). When responses were grouped, 56%
mentioned Environmental Effect, and 50% named Nuisance Effect.
Table 5.1: Social Costs of Stone, Sand & Gravel Extraction
% n
Environmental Effect: 56
Holes/pits/left behind/no rehabilitation 13 (181)
Water tables are exposed/contaminate water 9 (130)
Destruction of the natural environment 9 (126)
Disruption of wild life/animal habitat 7 (105)
Eroding of earth/digging up land 6 (87)
Blasting/destroying non-renewable resources 4 (63)
Destroys agricultural/topsoil 3 (49)
Removal of trees/forestry/greenery 3 (42)
Disruption of the ecosystem 2 (31)
Changes the climate/global warming 0 (7)
Nuisance Effect: 50
Dust/sand/dirt 11 (158)
Noise from trucks/machinery 11 (157)
Heavy/trucks/damages the road 8 (116)
Disruption of scenery/an eye sore 8 (114)
Trucks create traffic on the road 5 (64)
Damages the surrounding communities/ residential areas 5 (68)
Trucks throw stones/gravel damaging other vehicles 2 (30)
Human Effect: 16
Pollution/poor air quality affecting human health 13 (179)
Health risks for workers/residents 3 (48)
Nothing/none 7 (104)
Other 6 (87)
Don’t know/refused 16 (230)
Total # of respondents (1420)
Note: Percentages sum to more than 100% as more than one response was accepted. O% indicates less than .5%. Q19

AECOM – MNR VALUE OF AGGREGATES STUDY 20
There were differences in responses to the grouped categories by respondent
characteristics:
GEOGRAPHY
Area 8 Northeast was more likely to state “nothing” (20%).
Area 3 West Central was more likely to name Nuisance Effect (69%).
DEMOGRAPHIC CHARACTERISTICS
Younger respondents (under 25 years of age, 27%) and women
(19%) were more likely to name Human Effects.
Men (64%) and those 45 to 54 years of age (65%) were more likely
to name Environmental Effects.
Seniors 65 or more were more likely to state “nothing) (14%).
PDE
Respondents who claimed to live near a stone, sand and gravel pit
were more likely to name Nuisance Effect (61%).
5.2 SOCIAL BENEFITS
Respondents were asked to identify what they considered to be the main
benefits or positive effects of stone, sand and gravel extraction. As can be
seen in Table 5.2 (next page), over two-third of the respondents identified
the provision of materials for construction of buildings and homes (36%) and
improving the provinces infrastructure including road, highways and railways
(35%). Almost 2-in-10 named job creation and employment (18%). Less
than 10% named each of the remaining positive effects. Overall, 95%
named some element of Infrastructure and Development Projects.
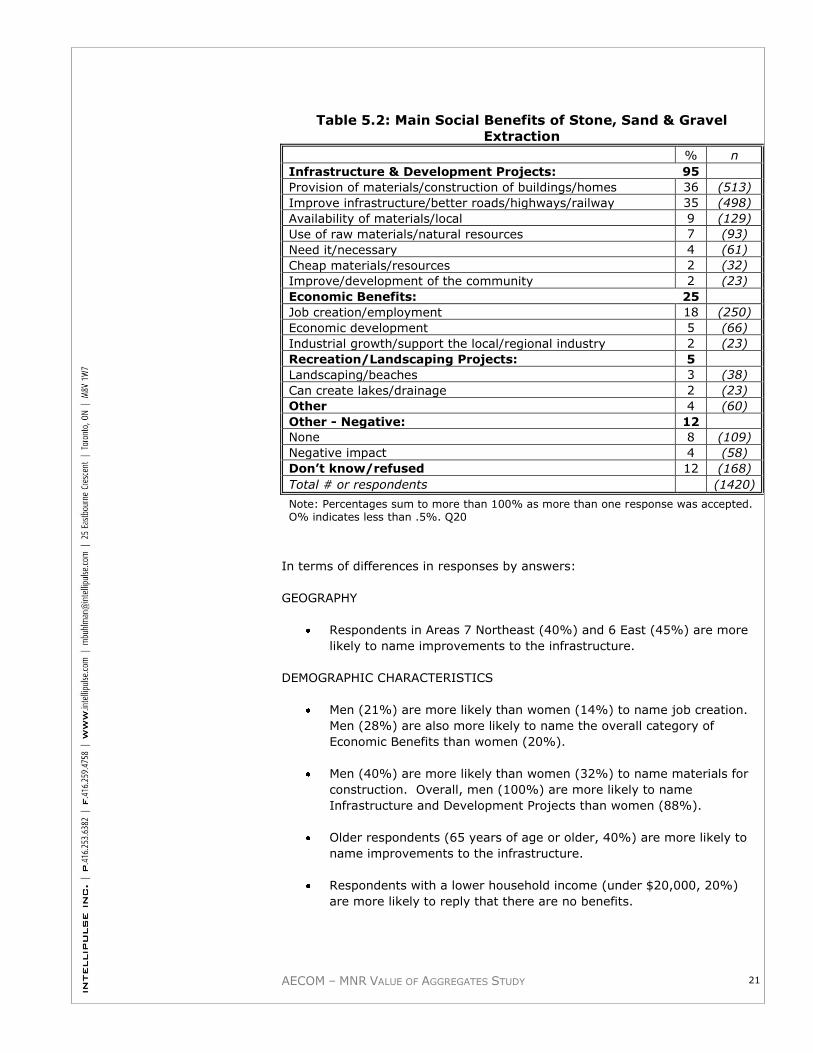
AECOM – MNR VALUE OF AGGREGATES STUDY 21
Table 5.2: Main Social Benefits of Stone, Sand & Gravel
Extraction
% n
Infrastructure & Development Projects: 95
Provision of materials/construction of buildings/homes 36 (513)
Improve infrastructure/better roads/highways/railway 35 (498)
Availability of materials/local 9 (129)
Use of raw materials/natural resources 7 (93)
Need it/necessary 4 (61)
Cheap materials/resources 2 (32)
Improve/development of the community 2 (23)
Economic Benefits: 25
Job creation/employment 18 (250)
Economic development 5 (66)
Industrial growth/support the local/regional industry 2 (23)
Recreation/Landscaping Projects: 5
Landscaping/beaches 3 (38)
Can create lakes/drainage 2 (23)
Other 4 (60)
Other - Negative: 12
None 8 (109)
Negative impact 4 (58)
Don’t know/refused 12 (168)
Total # or respondents (1420)
Note: Percentages sum to more than 100% as more than one response was accepted. O% indicates less than .5%. Q20
In terms of differences in responses by answers:
GEOGRAPHY
Respondents in Areas 7 Northeast (40%) and 6 East (45%) are more
likely to name improvements to the infrastructure.
DEMOGRAPHIC CHARACTERISTICS
Men (21%) are more likely than women (14%) to name job creation.
Men (28%) are also more likely to name the overall category of
Economic Benefits than women (20%).
Men (40%) are more likely than women (32%) to name materials for
construction. Overall, men (100%) are more likely to name
Infrastructure and Development Projects than women (88%).
Older respondents (65 years of age or older, 40%) are more likely to
name improvements to the infrastructure.
Respondents with a lower household income (under $20,000, 20%)
are more likely to reply that there are no benefits.

AECOM – MNR VALUE OF AGGREGATES STUDY 22
PDE
Respondents who claimed to live near a stone, sand and gravel
transportation route were more likely to name Economic Benefits
(33%).

AECOM – MNR VALUE OF AGGREGATES STUDY 23
6 TECHNICAL APPENDIX
6.1 SURVEY OVERVIEW
The survey was undertaken by telephone among a random sample of
residents in Ontario who are 18 years of age and older; the sample was split
between men and women. Interviews were conducted from July 28 to August
6, 2009, and the average length was 15 minutes.
For this study IntelliPulse established a sample requirement such that each of
the 8 Portland Cement Association Geographic Areas had a minimum
confidence interval of +8.1%, 19 times out of 20. This resulted in a
disproportional sample allocation by area as presented in Table 6.1. The
confidence interval for the area samples of approximately 150 interviews is
+8.1%, Area 4 GTA is +5.3%, and the weighted Ontario sample is +2.6%.
Table 6.1: Sample Allocation by Area
Population Count
% of Population
Proportional Sample
Allocation Interviews Weight
Area 1 - SouthWest 1,374,304 0.113 161 153 1.0517
Area 2 - Peninsula 1,164,891 0.096 136 153 0.8914
Area 3 - West Central 1,312,946 0.108 154 153 1.0047
Area 4 - GTA 5,555,912 0.458 651 354 1.8376
Area 5 - East Central 486,189 0.040 57 151 0.3770
Area 6 - East 1,447,655 0.119 169 152 1.1151
Area 7 - Northeast 433,783 0.036 51 154 0.3298
Area 8 - Northwest 352,507 0.029 41 150 0.2751
Grand Total 12,128,187 1 1,420 1,420
6.2 RESPONDENT PROFILE
At the conclusion of the survey respondents were assured of confidentiality
and asked several questions about their personal and family characteristics.
As is evident throughout this report, these characteristics were important in
the analysis of the study results.

AECOM – MNR VALUE OF AGGREGATES STUDY 24
As can be seen in Table 6.2:
A mix of age groups is represented in the sample. The smallest
cohorts are under 25 years of age and 25 to 34.
The largest single household income category is $100,000 or more.
By the nature of the sample selection, respondents are split by
gender.
Table 6.2: Demographic Profile of Respondents
% n
Age
Under 25 years of age 6 (83)
25 - 34 12 (173)
35 - 44 18 (253)
45 - 54 24 (332)
55 - 64 20 (283)
65 years of age or older 20 (280)
Total 100 (1404)
Total household
income
Under $20,000 8 (83)
$20,000 - $39,999 13 (132)
$40,000 - $59,999 18 (178)
$60,000 - $79,999 17 (167)
$80,000 - $99,999 13 (129)
$100,000 or more 30 (298)
Total 100 (987)
Gender
Male 50 (708)
Female 50 (712)
Total 100 (1420)
Note: Percentages may not sum to 100% due to rounding. Q21-23

AECOM – MNR VALUE OF AGGREGATES STUDY 25
6.3 QUESTIONNAIRE
Part 1 – Introductory Script and Participant Information
Hello, I‟m of IntelliPulse Research, a national survey research firm. We‟re talking to people
today on behalf of the Ontario Ministry of Natural Resources about resources like stone, sand and gravel in
Ontario and how the management of these resources may affect you and your community. We are not
selling anything, and your responses are confidential to IntelliPulse. This survey should take less than 15
minutes of your time.
A. Are you 18 years of age or older and an Ontario resident?
Yes (SKIP TO C) ............... 1 No .................................. 2 WATCH FOR GENDER QUOTAS 50/50
B. IF NO ASK: May I please speak to someone in the household who is?
Yes REPEAT INTRODUCTION ....................................................................................... 1
No, not available, ASK; What would be a good time to call back? RECORD ....................... 2 Date: ____________ Time: _______
IF NECESSARY: This survey is registered with the Marketing Research and Intelligence Association who can
confirm that it is a legitimate market research survey. Their number is 1-800-xxxxx and the identification Number of the study is .
C. Have I reached you at your home telephone number, that is (READ TELEPHONE NUMBER)?
No (THANK AND TERMINATE, RECORD INCIDENCE) ................................ 1 Yes (CONTINUE) 2
1. Is there a stone, sand and gravel pit or quarry near where you live?
Yes ..........................................................1
No ...........................................................2
Don‟t know / Not sure (volunteered) ............3
2. Do you live near a stone, sand and gravel transportation route?
Yes ..........................................................1
No ...........................................................2
Don‟t know / Not sure (volunteered) ............3
3. Are you or someone in your household, employed by the aggregate industry (that is a company which
extracts stone, sand or gravel) or related-industries such as road or building construction?
Yes (CONTINUE)..........................................................1
No (SKIP TO Q5) ...........................................................2
Don‟t know / Not sure (volunteered) (SKIP TO Q5)............3
4. In what way is that person employed in the aggregate industry?
_____________________________________________________________________________

AECOM – MNR VALUE OF AGGREGATES STUDY 26
Part 2 – Community Well-Being
Thank you. Now I‟m going to ask your some questions about the things that you value in your community.
5. There are many things that people value about their communities that contribute to their quality of life.
In your opinion, what are some of the things that you value? (Accept up to three responses) And what
else do you value? And what else?
a) b) c)
Thank you for your ideas. This survey is trying to understand how the people of Ontario value stone, sand
and gravel resources in the context of community well-being. These resources are used for development
and infrastructure projects such as highways, railways, energy facilities and airports, as well as residential,
industrial, and commercial buildings.
6. Now thinking back to the things that you value about your community, which you previously stated
[remind participant of responses from Q5], which of those, if any, are more important than
development or infrastructure projects that happen in your community? SELECT ALL THAT
APPLY…ACCEPT UP TO 3 MENTIONS
None (Volunteered) 1
a)
b) c)
7. Which of those values you named, if any, are less important than development or infrastructure
projects that happen in your community? SELECT ALL THAT APPLY…DO NOT READ THOSE SELECTED IN
Q6
None (Volunteered) 1
a) b) c)
Part 3 – Social Attitudes towards Different Types of Development and Infrastructure Projects
Next, I am going to name some types of development and infrastructure projects, and I‟d like you to rate
their importance in relation to your community‟s well-being. Using a scale of 1 to 5, a score of 5 is very
important, and 1 is not at all important. ROTATE Q8 – 15 REPEAT SCALE FOR EVERY OTHER QUESTION
8. Building new highways or roads
Not at all important ........................1
Not very important .........................2
Not sure (Volunteered) ...................3
Somewhat important ......................4
Very important ..............................5
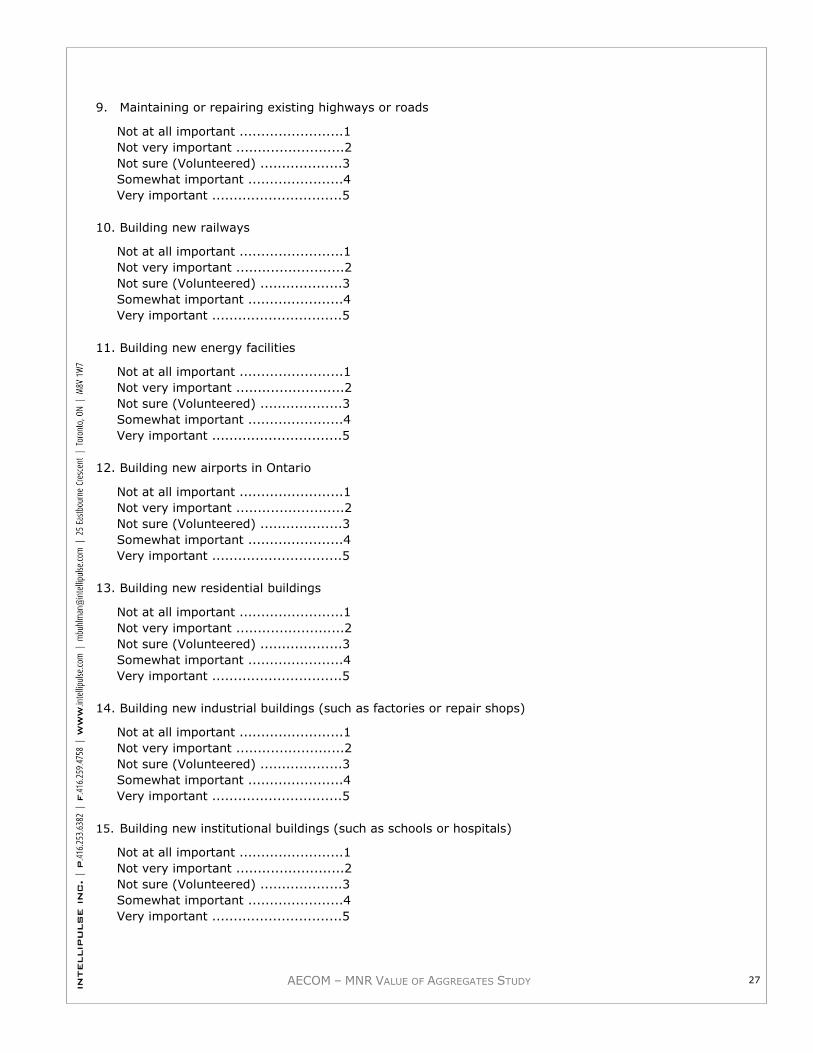
AECOM – MNR VALUE OF AGGREGATES STUDY 27
9. Maintaining or repairing existing highways or roads
Not at all important ........................1
Not very important .........................2
Not sure (Volunteered) ...................3
Somewhat important ......................4
Very important ..............................5
10. Building new railways
Not at all important ........................1
Not very important .........................2
Not sure (Volunteered) ...................3
Somewhat important ......................4
Very important ..............................5
11. Building new energy facilities
Not at all important ........................1
Not very important .........................2
Not sure (Volunteered) ...................3
Somewhat important ......................4
Very important ..............................5
12. Building new airports in Ontario
Not at all important ........................1
Not very important .........................2
Not sure (Volunteered) ...................3
Somewhat important ......................4
Very important ..............................5
13. Building new residential buildings
Not at all important ........................1
Not very important .........................2
Not sure (Volunteered) ...................3
Somewhat important ......................4
Very important ..............................5
14. Building new industrial buildings (such as factories or repair shops)
Not at all important ........................1
Not very important .........................2
Not sure (Volunteered) ...................3
Somewhat important ......................4
Very important ..............................5
15. Building new institutional buildings (such as schools or hospitals)
Not at all important ........................1
Not very important .........................2
Not sure (Volunteered) ...................3
Somewhat important ......................4
Very important ..............................5

AECOM – MNR VALUE OF AGGREGATES STUDY 28
Part 4 – Respondent Knowledge about Inputs into Infrastructure
Projects
Thank you for your answers. There are many requirements for these types of development and
infrastructure projects to occur. These include skilled labour, raw materials, and public demand.
16. In Ontario, if you had to guess how many tonnes of stone, sand and gravel do you think are consumed per
person, each year? READ RESPONSE CODES
1-5 tonnes per person .......................1
6-10 tonners per person ....................2
11-15 tonnes per person ...................3
16-20 tonnes per person ...................4
More than 20 tonnes per person .........5
Don‟t know (Volunteered)…………………….6
17. Where do you think the pits and quarries used to extract stone, sand and gravel resources are located? Please
state all that apply. READ RESPONSE CODES. IF NEEDED: Extraction refers to removing the stone, sand or
gravel out of the earth.
Within 25 km of where you live.............1
Within 100 km of where you live……….....2
In Northern Ontario ............................3
In Southern Ontario ............................4
Outside of Ontario................................5
Don‟t know/not sure (volunteered).........6
18. Stone, sand and gravel resources need to be transported from the pits and quarries where they are extracted,
to where they are needed. Please rank the following modes used to transport these resources where 1 is the
most commonly used mode of transportation and 3 is the least commonly used. READ ALL THREE … Which
one is the most commonly used? Which one is second most common? Last leaves (READ LAST ONE) as the
least commonly used.
Mode Ranking (response)
A. Rail Transport
B. Sea or Lake Transport
C. Truck Transport
Part 5 – Social Costs and Benefits of Aggregate Extraction
19. What do you think are the most adverse or negative effects of stone, sand and gravel extraction? These
can be at a local or regional scale. ACCEPT UP TO 3 RESPONSES. Is there another adverse or negative
effect? Any other effect?
a)
b)
c)

AECOM – MNR VALUE OF AGGREGATES STUDY 29
20. What do you think are the main benefits or positive effects of stone, sand and gravel extraction? These
can be at a local or regional scale. ACCEPT UP TO 3 RESPONSES. Is there another benefit or positive
effect? Any other effect?
a)
b)
c)
Part 6 – Respondent Information
Thank you for your answers. Now I am going to ask you some demographic questions to help our analysis.
Your responses will be grouped with those of other respondents. Please be assured your responses are
confidential to IntelliPulse only.
21. What is your age please? Are you …?
Under 25 years of age ....................... 1
25 - 34 ............................................ 2
35 - 44 ........................................... 3
45 - 54 ........................................... 4
55 - 64 ............................................ 5
65 years of age or older .................... 6
22. What is your total household income, before taxes from all sources for all members of your household?
Is it …
Under $20,000 ................................ 1
$20,000 - $39,999 ........................... 2
$40,000 - $59,999 ........................... 3
$60,000 - $79,999 ........................... 4
$80,000 - $99,999 ........................... 5
$100,000 or more ............................ 6
23. Gender (By Observation)
Male ............................................... 1
Female ........................................... 2
24. What is your postal code?
a)
25. Date of interview (RECORD)
a)
Thank you for your time today. Your answers are important to the future planning of resources in Ontario.
Do you have any questions or comments?
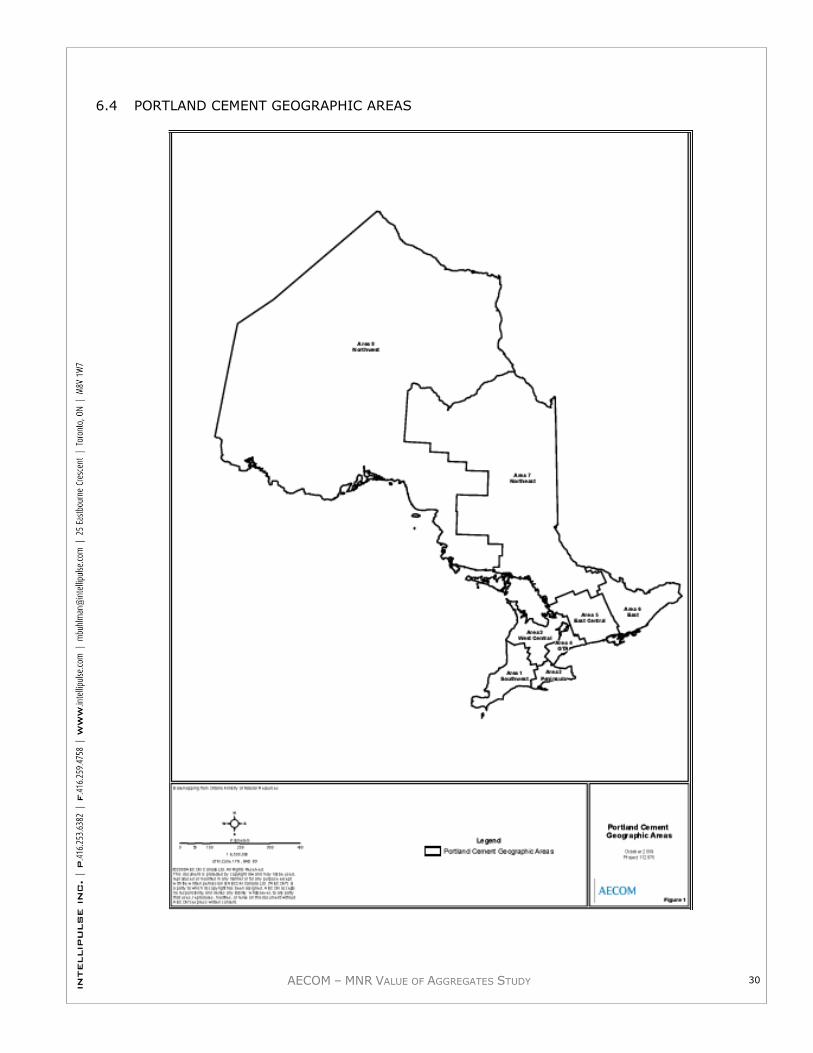
AECOM – MNR VALUE OF AGGREGATES STUDY 30
6.4 PORTLAND CEMENT GEOGRAPHIC AREAS

AECOM – MNR VALUE OF AGGREGATES STUDY 31
6.5 QUALITY ASSURANCE
The procedures used for this social values study are standard procedures
used in public affairs and sociological research. They conform to the
Marketing Research and Intelligence Association standards (MRIA). As part
of the standards, the survey was registered with the MRIA; the project leader
(Ms. Margaret Buhlman) and the Field Director (Mr. Sam Pisani) are members
of the Marketing Research and Intelligence Association and abide by its
standards for conducting the research (www.mria-arim.ca).
The sampling and drawing of telephone numbers was undertaken by The
Logit Group. The Logit Group imported the sample into the CATI
programming that contained the questionnaire. The Logit Group then
undertook all CATI programming of the questionnaire, interviewing, coding,
and production of the SPSS data file.
The backbone of the research infrastructure at The Logit Group is a fully
monitored 70 station CATI facility located in Toronto, Ontario. It is equipped
with the state-of-the-art Voxco Interviewing CATI platform. Voxco‟s CATI
platform integrates sample management, quota and call-back management,
interviewing and real-time on-screen monitoring. As well, the set-up allows
for interviewers to be directly monitored by supervisors at all times.
Remote monitoring is a standard feature of the quality assurance protocols
employed for this study, allowing clients (i.e., AECOM) direct access to both
on-going interviews, as well as supervisors for constant feedback. Ms.
Margaret Buhlman (IntelliPulse Inc.) monitored each interviewer on the first
night. AECOM monitored the survey on the same evening.
Several management procedures were taken to ensure quality. These
included:
Interviewers - Only experienced interviewers who were fully fluent in
English were assigned to the study.
Briefing - Prior to „live‟ interviewing the interviewers were trained and
briefed by the Logit Group supervisor. The session included a question-by-question review, role-playing, and the opportunity to ask questions. Interviewers who were new to the project after this time undertook the interviewer training.
Ensuring Response Rates – Based on experience with a wide range of
public attitude research surveys, there is a general downward trend in response rates. Consequently, constant attention was placed on methods to ensure the highest response rates possible. Extensive interviewer training was used to help to reduce refusal rates and increase response rates, including teaching interviewers the necessary, although often overlooked “soft skills” needed to engage respondents at the outset of the interview.
As well, multiple call attempts were made to records, and spread across
different days and times, to ensure the highest possible “connect rate” on

AECOM – MNR VALUE OF AGGREGATES STUDY 32
randomly selected records. Requests by respondents for appointments or
call-backs at more convenient times were respected. All our contact
records made provision for follow-up calls and appointments with
respondents. Response rates are presented in Technical Appendix 6.5.
Ensuring the quality of CATI screens –The correct and accurate
programming of a questionnaire into CATI is one of the first, and one of
the most fundamental aspects of overall quality management – ensuring
that all questions are programmed accurately, including streaming and
skip patterns, valid ranges and fields, and correct interviewer instructions
are presented. All programming was undertaken by The Logit Group‟s
lead programmer.
To ensure the highest quality level possible, the following steps were
undertaken:
The programmed CATI questionnaire was tested first by the
programmer, and then independently by the Project Manager and a
senior supervisor to ensure that the questionnaire logic and answer
choices are correct.
Next, a CATI simulation was performed, whereby randomly generated
“dummy data” was written to a test file. The data processing
department also checked for inconsistencies in base totals and logic
within the test data file itself.
Interviewing – The Ontario Ministry of Natural Resources was identified as the sponsor of the survey. The time frame for the survey was kept long (July 28 to August 8, 2009) in order to make the best use of the sample and to retain a small cadre of interviewers.
Quality of data accuracy - On-site supervision was provided on a regular
basis. One supervisor was on duty for every 10 interviewers. Supervisory
staff monitored 30% of all contacts, using a DEES-based voice and data-
monitoring unit (exceeding MIRA‟s 10% requirement). The unit combined
standard audio monitoring of the interview with remote monitoring of
CATI workstation screen. In this way, supervisors did not only hear
responses, they also ensured that they had been correctly recorded.
In addition to the monitoring, a further 15% of all completed interviews
were validated via a call-back methodology. Respondents were randomly
selected from the pool of recently completed interviews. Selected
respondents were contacted within 24 hours of the original interview and
the survey restarted at a random point. If no inconsistencies were
encountered, the validation consisted of only a few questions. If unusual
changes were noted, the interview would have been re-conducted in its
entirety or removed from the dataset.
The available audio-based monitoring system allowed AECOM, regardless
of location, to remotely monitor the study in progress.
To ensure the highest level of data accuracy, a “confirmation-based”
procedure to its CATI platform was utilized. This meant that after

AECOM – MNR VALUE OF AGGREGATES STUDY 33
entering a response during an interview, interviewers saw a “Response
Confirmation Screen” that quickly ensured that they recorded the
appropriate response. This screen was not read to the respondent, but
rather it was used as an internal phone room check to ensure that any
mis-keyed responses by interviewers were caught quickly, without
impeding the actual flow of the interview at all.
Open-end coding - Code lists and verbatim responses were provided to
IntelliPulse for review and modification. The code list/verbatim processes were as follows.
- undertaking a preliminary coding of the responses based on 50% of
the completed questionnaires.
- Supplying code lists (Word) and verbatims (Excel) to IntelliPulse electronically.
- review of the code list and the verbatims for each question, and highlighting changes and additions so that The Logit Group could use the changes as a guide to complete the coding.
- Once code lists were revised by IntelliPulse, code lists and all coding
were revised to reflect any applicable revisions. Any additional codes after the approval list were provided to IntelliPulse for acceptance.
Sample Weighting –It is standard survey research procedure when
dealing with a disproportional sample selection, where some areas are over-represented in the sample, and others are under-represented to
have a sufficient sample size for area analysis, to weight the data into
their proportion proportions for reporting results for the entire area. Technical Appendix 6.1 provides a detailed description of the sample selection by Geographic Area and the weighting procedures.
SPSS data file - Fully documented data file in labelled SPSS format was
sent electronically to IntelliPulse. SPSS was used to produce the
frequencies for the tables. All questions were crosstabulated against the demographic questions, and by area. The chi-square statistic and correlation statistics (Person‟s r, and Gamma) were used to determine whether there is a correlation between survey responses and demographic questions. Significant differences are noted in the report.
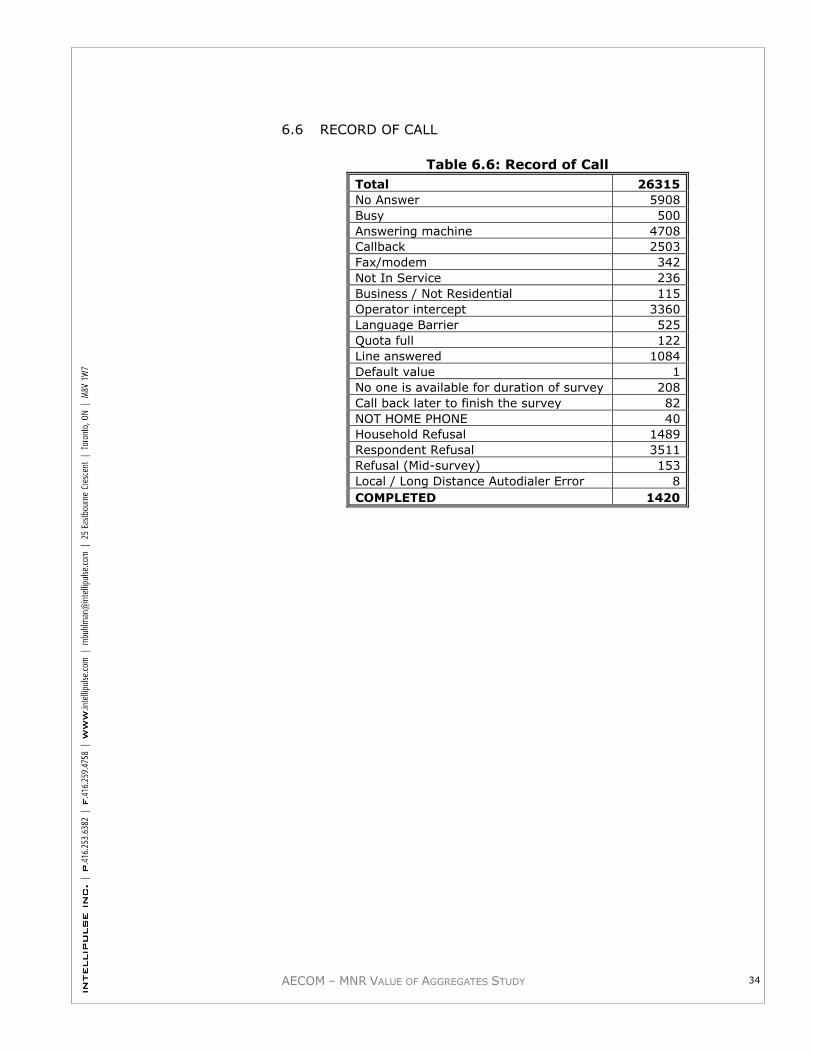
AECOM – MNR VALUE OF AGGREGATES STUDY 34
6.6 RECORD OF CALL
Table 6.6: Record of Call
Total 26315
No Answer 5908
Busy 500
Answering machine 4708
Callback 2503
Fax/modem 342
Not In Service 236
Business / Not Residential 115
Operator intercept 3360
Language Barrier 525
Quota full 122
Line answered 1084
Default value 1
No one is available for duration of survey 208
Call back later to finish the survey 82
NOT HOME PHONE 40
Household Refusal 1489
Respondent Refusal 3511
Refusal (Mid-survey) 153
Local / Long Distance Autodialer Error 8
COMPLETED 1420

112870_MNR_App Title Pgs_Final.Docx
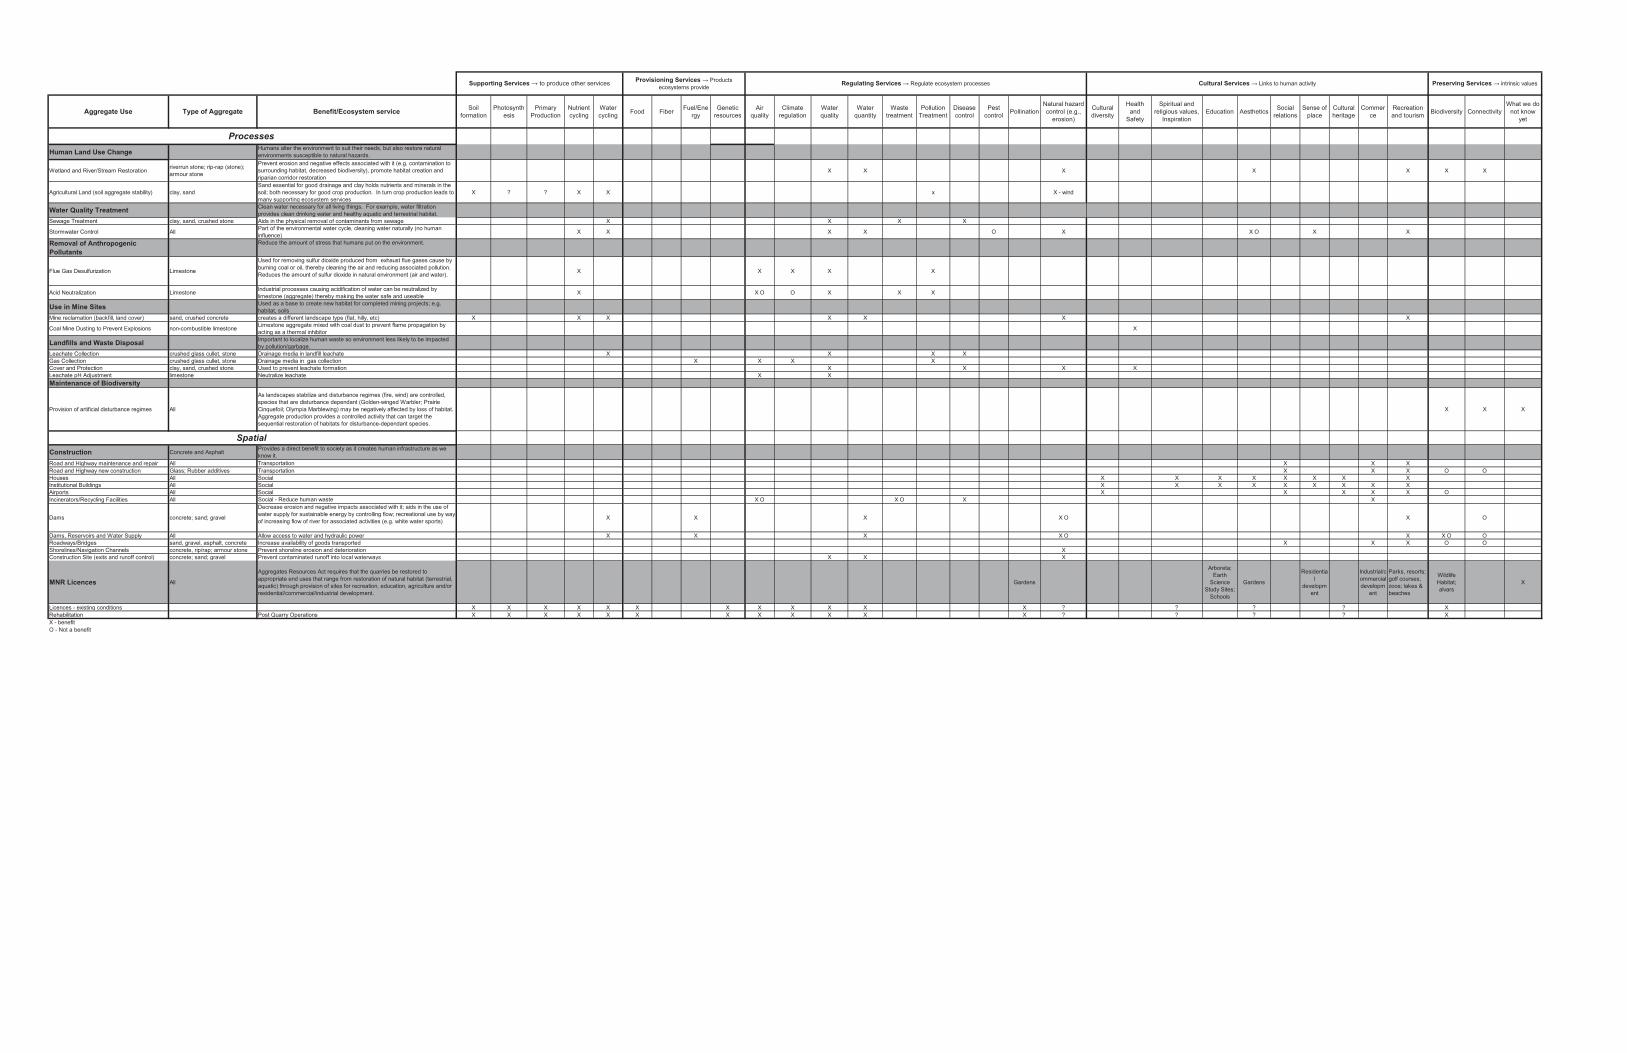
Aggregate Use Type of Aggregate Benefit/Ecosystem service Soil formation
Photosynthesis
Primary Production
Nutrient cycling
Water cycling Food Fiber Fuel/Ene
rgyGenetic
resources Air
quality Climate
regulation Water quality
Water quantity
Waste treatment
Pollution Treatment
Disease control
Pest control Pollination
Natural hazard control (e.g.,
erosion)
Cultural diversity
Health and
Safety
Spiritual and religious values,
Inspiration Education Aesthetics Social
relations Sense of
place Cultural heritage
Commerce
Recreation and tourism Biodiversity Connectivity
What we do not know
yet
Human Land Use Change Humans alter the environment to suit their needs, but also restore natural environments susceptible to natural hazards.
Wetland and River/Stream Restoration riverrun stone; rip-rap (stone); armour stone
Prevent erosion and negative effects associated with it (e.g. contamination to surrounding habitat, decreased biodiversity), promote habitat creation and riparian corridor restoration
X X X X X X X
Agricultural Land (soil aggregate stability) clay, sandSand essential for good drainage and clay holds nutrients and minerals in the soil; both necessary for good crop production. In turn crop production leads to many supporting ecosystem services
X ? ? X X x X - wind
Water Quality Treatment Clean water necessary for all living things. For example, water filtration provides clean drinking water and healthy aquatic and terrestrial habitat.
Sewage Treatment clay, sand, crushed stone Aids in the physical removal of contaminants from sewage X X X X
Stormwater Control All Part of the environmental water cycle, cleaning water naturally (no human influence) X X X X O X X O X X
Removal of Anthropogenic Pollutants
Reduce the amount of stress that humans put on the environment.
Flue Gas Desulfurization Limestone
Used for removing sulfur dioxide produced from exhaust flue gases cause by burning coal or oil, thereby cleaning the air and reducing associated pollution. Reduces the amount of sulfur dioxide in natural environment (air and water). X X X X X
Acid Neutralization Limestone Industrial processes causing acidification of water can be neutralized by limestone (aggregate) thereby making the water safe and useable X X O O X X X
Use in Mine Sites Used as a base to create new habitat for completed mining projects; e.g. habitat, soils
Mine reclamation (backfill, land cover) sand, crushed concrete creates a different landscape type (flat, hilly, etc) X X X X X X X
Coal Mine Dusting to Prevent Explosions non-combustible limestone Limestone aggregate mixed with coal dust to prevent flame propagation by acting as a thermal inhibitor X
Landfills and Waste Disposal Important to localize human waste so environment less likely to be impacted by pollution/garbage.
Leachate Collection crushed glass cullet, stone Drainage media in landfill leachate X X X XGas Collection crushed glass cullet, stone Drainage media in gas collection X X X XCover and Protection clay, sand, crushed stone Used to prevent leachate formation X X X XLeachate pH Adjustment limestone Neutralize leachate X XMaintenance of Biodiversity
Provision of artificial disturbance regimes All
As landscapes stabilize and disturbance regimes (fire, wind) are controlled, species that are disturbance dependant (Golden-winged Warbler; Prairie Cinquefoil; Olympia Marblewing) may be negatively affected by loss of habitat. Aggregate production provides a controlled activity that can target the sequential restoration of habitats for disturbance-dependant species.
X X X
Construction Concrete and Asphalt Provides a direct benefit to society as it creates human infrastructure as we know it.
Road and Highway maintenance and repair All Transportation X X XRoad and Highway new construction Glass; Rubber additives Transportation X X X O OHouses All Social X X X X X X X XInstitutional Buildings All Social X X X X X X X X XAirports All Social X X X X X OIncinerators/Recycling Facilities All Social - Reduce human waste X O X O X X
Dams concrete; sand; gravel
Decrease erosion and negative impacts associated with it; aids in the use of water supply for sustainable energy by controlling flow; recreational use by way of increasing flow of river for associated activities (e.g. white water sports) X X X X O X O
Dams, Reservoirs and Water Supply All Allow access to water and hydraulic power X X X X O X X O ORoadways/Bridges sand, gravel, asphalt, concrete Increase availability of goods transported X X X O OShorelines/Navigation Channels concrete, rip/rap; armour stone Prevent shoreline erosion and deterioration XConstruction Site (exits and runoff control) concrete; sand; gravel Prevent contaminated runoff into local waterways X X X
MNR Licences All
Aggregates Resources Act requires that the quarries be restored to appropriate end uses that range from restoration of natural habitat (terrestrial, aquatic) through provision of sites for recreation, education, agriculture and/or residential/commercial/industrial development.
Gardens
Arboreta; Earth
Science Study Sites;
Schools
Gardens
Residential
development
Industrial/commercial developm
ent
Parks, resorts; golf courses; zoos; lakes & beaches
Wildlife Habitat; alvars
X
Licences - existing conditions X X X X X X X X X X X X ? ? ? ? XRehabilitation Post Quarry Operations X X X X X X X X X X X X ? ? ? ? XX - benefitO - Not a benefit
Processes
Spatial
Preserving Services → intrinsic valuesSupporting Services → to produce other services Provisioning Services → Products ecosystems provide
Regulating Services → Regulate ecosystem processes Cultural Services → Links to human activity