Ministry of Finance and Planninggrss-mof.org/wp-content/uploads/2017/12/Q4-Quarterly-Report... ·...
14
[1] Republic of South Sudan Ministry of Finance and Planning Q 4 2016/17 Fiscal Report December, 2017
Transcript of Ministry of Finance and Planninggrss-mof.org/wp-content/uploads/2017/12/Q4-Quarterly-Report... ·...

[1]
Republic of South Sudan
Ministry of Finance and Planning
Q 4 2016/17 Fiscal Report
December, 2017

[2]
Table of Contents EXECUTIVE SUMMARY ............................................................................................................. 3 FISCAL SUMMARY .................................................................................................................... 4 REVENUE SUMMARY ................................................................................................................ 6 EXPENDITURE OVERVIEW ......................................................................................................... 9 DONOR OVERVIEW ................................................................................................................ 11 FINANCING OVERVIEW ........................................................................................................... 13 DEBT OVERVIEW .................................................................................................................... 14
[3]
EXECUTIVE SUMMARY
The aggregate revenue was SSP 13,905 million in the fourth quarter, with oil contributing
SSP 5,089 million, while non-oil revenues amount to SSP 8,816 million. This is equivalent to
85% of the FY 2016/2017 annual budget in Q4 alone. Over the entire year, 231% of budget
was raised.
Gross oil revenue was SSP 30,308 million in Q4, and overall performance in dollar terms was
above forecast due to the higher-than-expected price. However, little reached the budget
due to the need to refinance, as well as the pressures of Nilepet and Addax – just SSP 4,039
million before new oil advance borrowings.
Net oil revenue was equivalent to 70% of the annual budget. This performance was largely
due to continued weakening of the pound against the US dollar. Nilepet and Addax received
substantial payment for oil subsidies amounting to SSP 7,650 million or 1275% of their total
annual budget over the twelve months to June 2017.
Non-oil revenue raised more than estimated in the budget owing to improvement in
fees/charges on the Financial Act (174% of annual budget). In dollar terms, non-oil
performance rose in sharply in Q4 relative to the preceding seven quarter trend, primarily
due to one-off windfalls associated with resource industries.
Expenditure from government sources was 96% of budget, totalling SSP 32,216 million.
However, while chapter performance in salaries was high due to allowances over
expenditures, primarily in the salaries were left with at least three months in arrears at the
end of the year, due to competing pressures including central ministry goods and services
and poor financing. Capital, transfers and peace expenditures were well below budget.
Net financing was negative SSP 3,586 million, against poor Treasury Bill performance relative
to budget and poor oil advance inflows relative to expectations in the budget. Donor
projects underperformed, although reporting challenges meant there was no definitive
picture at the end of the year.

[4]
FISCAL SUMMARY
Q4 2016/17 FINAL
1: Fiscal summary Budget, SSP m
YTD Execution, SSP m
Q4, SSP m
% of budget executed YTD
% of annual budget executed, latest quarter
Gross Oil Revenue 46,833 81,144 30,308 173% 65%
Nilepet and Addax 1,512 19,274 7,650 1275% 506% Other deductions 0 47 0 Revenues to Sudan (TFA and PTT)
37,623 42,587 17,553 113% 47%
Transfers to producing communities and states
461 35 16 8% 3%
Oil production costs 0 124 0
Net oil revenue 7,238 19,076 5,089 264% 70%
Non-Oil Revenue to GRSS central gov't
9,256 16,074 8,816 174% 95%
Total GRSS revenue 16,494 35,150 13,905 213% 84%
Donor Grants 2,041 510 52 25% 3%
GRSS Expenditures '-- '--- '----- '-------------- '--------- General Fund Wages and Salaries 14,358 13,539 4,431 94% 31% Use of Goods and Services 5,106 12,523 4,270 245% 84% Capital Expenditure 1,588 1,889 1,012 119% 64% Other Expenditure 38 384 160 1010% 420% Transfers and Grants 6,311 3,623 1,139 57% 18%
General Fund Total 27,401 31,958 11,013 117% 40%
ARCISS implementation payments
4,500 100 21 2% 0%
Contingency Fund 1,333 54 0 4% 0% Interest and bank charges 155 74 16 48% 10%
GRSS expenditure total 33,389 32,186 11,049 96% 33%
On-budget donor activity '- '-- '--- '---- '----- Grant 2,041 510 52 25% 3% Loan 2,644 144 30 5% 1% Total grants and loans (on budget)
4,685 654 82 14% 2%
Total expenditure 38,074 32,840 11,132
Overall balance -19,539 2,820 2,826 Unfunded budget/ Actual reporting gap
-15,770 -765 2,588
Net Financing (excl. deposit changes and Sudan)
3,769 -3,586 -238 -95% -6%
BOSS 0 2,792 0 BOSS Recap. 0 0 0
[5]
FISCAL SUMMARY
Q4 2016/17 FINAL
1: Fiscal summary Budget, SSP m
YTD Execution, SSP m
Q4, SSP m
% of budget executed YTD
% of annual budget executed, latest quarter
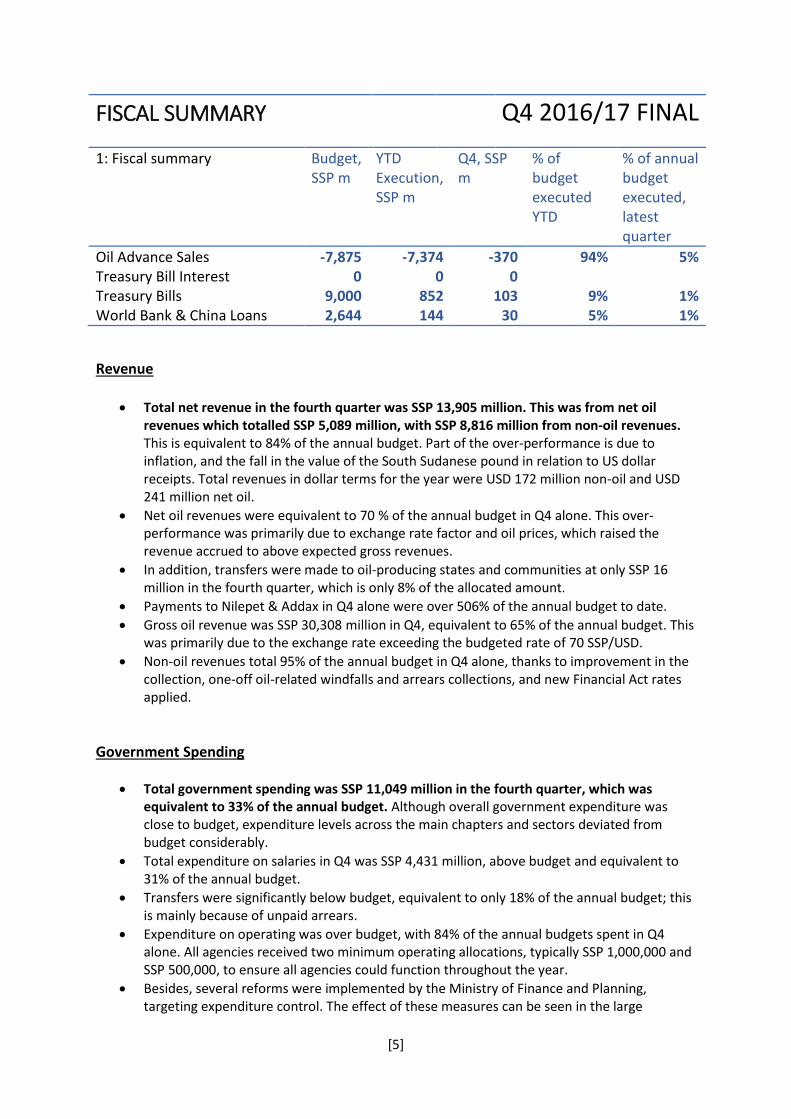
Oil Advance Sales -7,875 -7,374 -370 94% 5% Treasury Bill Interest 0 0 0 Treasury Bills 9,000 852 103 9% 1% World Bank & China Loans 2,644 144 30 5% 1%
Revenue
Total net revenue in the fourth quarter was SSP 13,905 million. This was from net oil revenues which totalled SSP 5,089 million, with SSP 8,816 million from non-oil revenues. This is equivalent to 84% of the annual budget. Part of the over-performance is due to inflation, and the fall in the value of the South Sudanese pound in relation to US dollar receipts. Total revenues in dollar terms for the year were USD 172 million non-oil and USD 241 million net oil.
Net oil revenues were equivalent to 70 % of the annual budget in Q4 alone. This over-performance was primarily due to exchange rate factor and oil prices, which raised the revenue accrued to above expected gross revenues.
In addition, transfers were made to oil-producing states and communities at only SSP 16 million in the fourth quarter, which is only 8% of the allocated amount.
Payments to Nilepet & Addax in Q4 alone were over 506% of the annual budget to date.
Gross oil revenue was SSP 30,308 million in Q4, equivalent to 65% of the annual budget. This was primarily due to the exchange rate exceeding the budgeted rate of 70 SSP/USD.
Non-oil revenues total 95% of the annual budget in Q4 alone, thanks to improvement in the collection, one-off oil-related windfalls and arrears collections, and new Financial Act rates applied.
Government Spending
Total government spending was SSP 11,049 million in the fourth quarter, which was equivalent to 33% of the annual budget. Although overall government expenditure was close to budget, expenditure levels across the main chapters and sectors deviated from budget considerably.
Total expenditure on salaries in Q4 was SSP 4,431 million, above budget and equivalent to 31% of the annual budget.
Transfers were significantly below budget, equivalent to only 18% of the annual budget; this is mainly because of unpaid arrears.
Expenditure on operating was over budget, with 84% of the annual budgets spent in Q4 alone. All agencies received two minimum operating allocations, typically SSP 1,000,000 and SSP 500,000, to ensure all agencies could function throughout the year.
Besides, several reforms were implemented by the Ministry of Finance and Planning, targeting expenditure control. The effect of these measures can be seen in the large

[6]
reduction in spending on capital and operating in later quarters, in particular by those agencies which overspent by the most in the first three quarters.
In the fourth quarter, spending on peace implementation was recorded at SSP 21 million and SSP 16 million for contingency.
Fiscal Deficit and Financing
The overall fiscal balance was SSP 2,820 million in surplus for the fourth quarter. Exchange rate changes not reflected, and lack of financing, were key contributors.
Thanks to fiscal reforms, according to BoSS figures, the government refrained from BoSS borrowing in the last quarter of the year.
Net financing for the fourth quarter of the year was SSP -238 million.
The Government repayment on oil advances was recorded at SSP -370 million in Q4. This means that on a net basis, there was lower new borrowing than repayments on oil advances. For the whole fiscal year, the pattern was similar.
REVENUE SUMMARY
Budget (SSP m)
Executed, year to date (SSP m)
Executed, Most recent quarter (SSP m)
Budget execution YTD, %
Budget execution, most recent quarter, %
Oil Revenue
Sudan 37,623 42,587 17,553 113% 47%
Nilepet and other ref. prods. 1,512 19,274 7,650 1275% 506%
Other* 0 47 0
Transfers to producing communities and states
461 35 16 8% 3%
Oil production costs 0 124 0
Net oil revenue 7,238 19,076 5,089 264% 70%
Trafigura repayments 7,875 15,037 4,081 191% 52%
GRSS (to bank) -637 4,039 1,008 -634% -158%
Direct expenses
Civil Aviation (Direct expense) 0 323 33
Commercial Bank Commission (Direct expense)
0 64 17
Customs (Direct expense) 0 362 0
Government shares - Co-op (Asset purchase)
0 282 72
Non-Oil Revenue
Personal Income (Private) 2,483 3,434 1,869 138% 75%
Advance Income Tax 0 281 78
Personal Income (Public) 0 655 183
Business Profits Tax 1,295 807 310 62% 24%

[7]
REVENUE SUMMARY
Budget (SSP m)
Executed, year to date (SSP m)
Executed, Most recent quarter (SSP m)
Budget execution YTD, %
Budget execution, most recent quarter, %
Sales 2,630 1,414 379 54% 14%
Customs Duties/Fees 1,170 953 228 81% 19%
Excise 0 465 147
Excise Tax 1,034 468 162 45% 16%
Unidentified remittance 0 6,555 5,091
Other non-Tax revenue 644 1,041 369 162% 57%
Miscellaneous/BoSS 0 0 0
Total non-oil revenue 9,256 16,074 8,816 174% 95%
Donor Grants 2,041 510 52 25% 3%
*not identified
Oil Revenues
The Government made direct payment of SSP 17,553 million for in-kind payments, TFA, Tariff and for transit payments combined to Sudan.
In addition, no transfers to oil producing states and communities were made in the fourth quarter of the fiscal year, and the total for the whole year was less than 10% of that budgeted.
Nile Pet and Addax took almost SSP 7,650 million in oil shipments and other refined product subsidies in Q4 alone. The annual expenditure on this item was 1275% of the budget.
Net oil revenues were SSP 5,089 million in the fourth quarter of the fiscal year. The annual execution was higher than envisaged, at 264% of budget.
The requirement to repay previous oil advances to Trafigura required SSP 4,081 million. This is also reflected in the financing.
A dollar terms summary of oil flows is found below. It shows substantial over performance on the gross and net revenue from oil, due to the higher-than-budget-forecast price. After Trafigura repayments and other deductions including Sudan and Nilepet refined oil deductions and USD grants to Nilepet, South Sudan took just 24% of the gross revenue, but could not refinance from oil advances. After net oil advances, GRSS received just 14% of Gross Oil revenues.
Non-oil revenues
Total identified non-oil revenue collections were SSP 9,519 million, which was SSP 102% of the total estimated non-oil revenue.
An additional SSP 5,091 million in non-oil revenues was accounted for by Treasury from unidentified remittances in Q4 alone, totalling SSP 6,555 million for the year.
All revenue categories came in meaningfully below budget, except other revenues and PIT. Of the major tax lines, sales tax underperformed the worst compared to budget.
Non-oil revenues increased in the fourth quarter of the fiscal year, due to implementation of measures in the 2016/17 Financial and Appropriation Acts and the continuing depreciation of the SSP. It should be noted that budget forecasts assumed these measures would be in

[8]
place from July. This could explain why those revenue categories with new measures may be over-performing compared to budget forecasts, for example sales tax.
Net oil revenues are at risk in real value, due to continued pressures from repaying advances and payments to Sudan.
OIL, USD
2: Oil dollar overview Budget (indicative, USD m)
Executed, year to date (USD m)
Executed, Most recent quarter (USD m)
Budget execution YTD, %
Budget execution, most recent quarter, %
Oil Revenue 662 1,009 299 152% 45%
Sudan (USD) 537 480 156 89% 29%
Nilepet in - kind (USD) 22 90 26 418% 121%
Nilepet Ref/Prod (USD) 0 31 12
Other Ref/Prod (USD) 0 84 28
GRSS central revenues from oil 104 241 45 232% 43%
GRSS (to bank) (USD) -9 56 9 -615% -98%
Trafigura repayments (USD) 113 184 36 164% 32%
Other (USD) 0 1 0
Oil related borrowing
Trafigura advances (USD) 0 82 32 See discussion above.

[9]
EXPENDITURE OVERVIEW
A: Summary of expenditure by sector
Budget, SSP m
YTD expenditure, SSP m
Latest quarter
expenditure, SSP m
% of budget
spent YTD
% of annual budget spent, latest
quarter
Accountability 3,427 4,627 1,692 135% 49%
Economic Functions 502 398 89 79% 18%
Education 1,406 960 365 68% 26%
Health 668 410 155 61% 23%
Infrastructure 634 386 214 61% 34%
Nat. Res. & Rural Devt 747 599 191 80% 26%
Public Administration 11,128 9,299 3,646 84% 33%
Rule of Law 3,760 3,661 1,197 97% 32%
Security 10,946 11,651 3,414 106% 31%
Social & Humanitarian Affairs
172 194 87 113% 51%
Grand Total 33,389 32,186 11,049 96% 33%
B: summary of expenditure by chapter and fund
'--- ---- '---- '----- '------
General Fund
Wages and Salaries 14,358 13,539 4,431 94% 31%
Use of Goods and Services 5,106 12,523 4,270 245% 84%
Capital Expenditure 1,588 1,889 1,012 119% 64%
Interest, grants, loans & donat.
38 384 160 1010% 420%
Transfers and Grants 6,311 3,623 1,139 57% 18%
ARCISS implementation payments
Wages and Salaries 0 27 0
Use of Goods and Services 4,500 73 21 2% 0%
Contingency Fund
Use of Goods and Services 1,333 54 0 4% 0%
Interest and debt payment
Use of Goods and Services 0 71 14
Interest, grants, loans & donat.
155 4 2 2% 1%
Grand Total 33,389 32,186 11,049 96% 33%

[10]
EXPENDITURE
Total government spending in the fourth quarter was SSP was SSP 11,049 million, which
was equal to 33% of the annual budget.
It should be noted that several reforms were implemented from August 2016, to better control budget execution. These include:
o Unpresented cheques being recalled and cancelled; o Introduction of a cash management committee; o Cheques being signed only when funds are available to prevent the accumulation of
new un presented cheques; and o Ministries are being paid equitable operating costs to cater for their expenses on
regular basis.
These reforms have contributed to better budget execution, most notably by preventing government expenditure taking place when resources are not available, which has previously led to accumulation of un presented cheques and arrears.
Total salary execution is SSP 13,539m, just 94% of the annual budget, due to lack of available resources against competing Government priorities.
In comparison, transfers are executed at only 57% of the allocated budget. This is due to a combination of arrears, crowding out from goods and services expenditures in a few central government agencies, delays in health and education extended to all government employees, eligibility considerations, and late introduction of the revised salary scales at the advent of the budget.
Capital expenditure was above-budget in the fourth quarter. However, this overall aggregate masks over-expenditure in some agencies and under expenditure in others.
Expenditure on operating was SSP 12,523 million for the year, which is 245% of budget.
SECTORAL EXPENDITURE
The dispersal of expenditure between agencies and sectors was very unequal in the year to date, and this trend continued in all four quarters.
Security, public administration and Accountability dominated the distribution at the expense of services delivery sectors. See annex.
Ministry of Education and Health sectors spent 68% and 61% of their annual budgets respectively.

[11]
DONOR OVERVIEW v: Donor table Budget
(SSP m)
Executed, year to date (SSP m)
Executed, Most recent quarter (SSP m)
Budget execution YTD, %
Budget execution, most recent quarter to date, %
Donor Revenue
Grant 2,041 510 52 25% 3%
Agriculture Development and Food Security Project
0 6 0
Emergency Food Crisis Response (World Bank)
189 6 0 3% 0%
Gender Equality and Economic Empowerment (ADB)
69 0 0 0% 0%
Good Governance & Capacity Building in NRM (ADB)
49 0 0 0% 0%
Institutional Support to PFM and Aid Coordination (AfDB)
175 0 0 0% 0%
Juba Power Distribution (AfDB) 1,021 0 0 0% 0%
Procurement Capacity Development (World Bank)
29 34 0 117% 0%
Resilience, Water & Sanitation (ADB) 92 0 0 0% 0%
South Sudan Rural Roads Project (SSRRP) (World Bank)
0 464 52
Strengthening the Capacity of Audit Chamber (World Bank)
3 0 0 0% 0%
TA for the Transport Sector (AfDB) 414 0 0 0% 0%
Loans 2,644 144 30 5% 1%
East Africa Regional Transport Project (World Bank)
280 15 0 5% 0%
Energy Sector Technical Assistance (World Bank)
88 2 0 2% 0%
Juba Airport (China EXIM) 0 0 0
Juba Women's and Children's Hospital (Kuwait Fund)
0 0 0
Local Governance and Service Delivery (World Bank)
1,813 39 0 2% 0%
Safety Net and Skills Development (World Bank)
183 27 0 15% 0%
Statistical Capacity Building (World Bank)
280 61 30 22% 11%
Total grants and loans (on budget) 4,685 654 82 14% 2%

[12]
DONOR FUNDING
South Sudan receives some development and humanitarian support in the form of loans and
grants. Some of this funding is implemented with the involvement of the government and
may use government financial systems. These projects are therefore appropriated in the
budget. Donors are requested to report their disbursements on a quarterly basis and these
are compared with the budgeted amount in donor Table above. However, lack of reporting
from several donors makes the aggregates incomplete.
On this quarter, donors reported disbursing a total of SSP 82 million, of which SSP 52 million
was grants and SSP 30 million was loans. Some projects continue to underperform, due to
the security situation and lack of reporting.

[13]
FINANCING OVERVIEW
w: Financing summary table Budget (SSP m)
Executed, year to date (SSP m)
Executed, Most recent quarter (SSP m)
Budget execution YTD, %
Budget execution, most recent quarter to date, %
Net Financing (excl. deposit changes and Sudan) 3,769 -3,586 -238 -95% -6%
BOSS 0 2,792 0
BOSS Recap. 0 0 0
Oil Advance Sales -7,875 -7,374 -370 94% 5%
Treasury Bills 9,000 852 103 9% 1%
World Bank & China Loans 2,644 144 30 5% 1%
New Borrowing 11,644 16,371 5,641 141% 48%
BOSS 0 2,890 0
BOSS Recap. 0 0 0
Oil Advance Sales 0 7,663 3,711
Treasury Bills 9,000 5,674 1,900 63% 21%
World Bank & China Loans 2,644 144 30 5% 1%
Repayments 7,875 19,957 5,878 253% 75%
BOSS 0 98 0
BOSS Recap. 0 0 0
Oil Advance Sales 7,875 15,037 4,081 191% 52%
Treasury Bills 0 4,822 1,797
World Bank & China Loans 0 0 0
Total financing was budgeted at SSP 3,769 million more payments in, than payments out.
Instead, according to BoSS and AidCo records, outflows exceeded inflows by SSP 3,586
million on a net basis.
Treasury bills did not meet their target of SSP 9,000 million on a gross basis; less than SSP 1
billion was raised.
Oil advances fell by SSP 7,374 million close to the estimate, and new advances were not
available to the extent required to replace existing ones.
The debt to Sudan was not recorded over the year. It is estimated that positive net
repayments are made, since the recorded USD value of payments was around USD 20
million greater than new obligations.

[14]
DEBT OVERVIEW End prev. FY (SSP m)
Change,most recent quarter (SSP m)
Change, YTD (SSP m)
Final debt
Total Debt, end of month 35,194 3,132 24,745 59,939
BOSS 14,790 0 2,792 17,582
BOSS Recap. 1,917 0 0 1,917
Oil Advance Sales 11,410 1,541 9,868 21,278
Treasury Bill Interest 0 0 0 0
Treasury Bills 1,759 103 852 2,611
World Bank & China Loans
5,318 1,489 11,233 16,551
Gains/losses on Stock value
Change,YTD (SSP m)
Change, later quarter
Exchange rate effect on debt stock
28,331 3,370
BOSS 0 0
BOSS Recap. 0 0
Oil Advance Sales 17,242 1,911
Sudan 0 0
Treasury Bill Interest 0 0
Treasury Bills 0 0
World Bank & China Loans
11,089 1,459
Reconciliation table YTD Latest quarter
Overall balance 2,820 2,826
Net Financing (excl. deposit changes and Sudan)
-3,586 -238
Decrease / (Increase) in Cash
n/a n/a
Other financing 656 n/a
Total Financing -3,586 -238
Unreconciled -765 2,588
Other financing is the estimated additional arrears to government employee pensions of
SSP656 million. The fiscal year unreconciled amount was SSP 765m, which could be due to
unreported changes in cash balances and changes not captured in the exchange rates on
either expenses or revenues.
Sudan debt is not included in the above. Estimated arrears were reduced this year in dollar
terms due to overpayment in terms of cargoes seized and cash transferred relative to the
accrual of PTT and TFA liabilities.
Large revaluation of external debt due to the falling pound accounts for the increase in the
value of debt in SSP.