MINISTRY OF EDUCATION LAGOS STATE FEDERAL REPUBLIC … · MINISTRY OF EDUCATION LAGOS STATE FEDERAL...
29
MINISTRY OF EDUCATION LAGOS STATE FEDERAL REPUBLIC OF NIGERIA ANNUAL SCHOOL CENSUS REPORT 2009 – 2010 JUNE 2010
Transcript of MINISTRY OF EDUCATION LAGOS STATE FEDERAL REPUBLIC … · MINISTRY OF EDUCATION LAGOS STATE FEDERAL...
MINISTRY OF EDUCATION LAGOS STATE
FEDERAL REPUBLIC OF NIGERIA
ANNUAL SCHOOL CENSUS REPORT 2009 – 2010
JUNE 2010
August 2010
LAGOS STATE SCHOOL CENSUS REPORT 2009-2010
Lagos State Ministry of Education

Lagos State School Census Report 2009-2010
i August 2010
Preface
Data is acknowledged as being essential for effective planning of our education sector. In past years the annual school census has been less successful, but the November 2009 census was carried out in a totally new way. The process started with the development of an appropriate questionnaire for the purpose of getting relevant and accurate data geared towards planning needs. The questionnaire used in the past was shortened and drastically changed to meet these needs. Census personnel were trained on the questionnaire and a new method of data collection was used: enumerators interviewed head teachers rather than leaving teachers to interpret the form for themselves.
The ministry received support from ESSPIN (Education Sector Support Programme in Nigeria) on capacity building of the different levels of officers that assisted in the data gathering and analysis. All records were broken this year as the data was ready by the end of April 2010, as opposed to previous years when data would be ready for use at the end of the year, i.e. too late to be used in planning the next school year.
This report captures the main features of the school census data, and is hereby presented for policy making and planning, and for use by researchers.
Deputy Governor of Lagos State
State Ministry of Education
August 2010
Lagos State School Census Report 2009-2010
ii August 2010
Executive summary
This summary presents some of the main findings of the Annual School Census Report. There was a very high response rate for the Lagos ASC, although for this year only public schools were included; there are plans to capture private schools in coming years. The overall response rate was 99.4%, meaning that virtually all schools were captured.
In terms of enrolments, the number of children in pre-primary school is roughly comparable to the number in primary 1, so it is likely that most children entering primary 1 at a public school will have had some pre-primary foundation. Pre-primary education is becoming more widely recognised as an important level of education, and Lagos State has achieved broad coverage, with only 25 primary schools not having a pre-primary section. Enrolments in primary classes increase as the level rises, which is contrary to usual trends of enrolments decreasing from class 1 to class 6, but in Lagos this may be due to interplay with the large number of private schools. Enrolments grow again at the junior secondary level with the highest number in junior secondary 2, and then drop off again at the senior secondary level. There is a very good gender balance at all levels of the schooling system, with more girls in the overall population, and more girls enrolled in public schools.
Some students are more challenged than others in completing a full cycle of education and in not having to repete years. Rather than increasing as the level increases, the number of children with special needs decreases sharply from 880 in primary 1 to only 159 in senior secondary 3 (in the same year, 2009-2010). Such children need additional support that they are not getting at present. In all but one class level there are more boys repeating than girls, despite the presence of more girls in the population.
In terms of teachers, the vast majority at all levels are qualified, including pre-primary teachers. Indeed there are few teachers without the requisite teaching qualification, and close to 90% of senior secondary school teachers have a degree. In addition, approximately one third of teachers have been for in-service training of some kind within the 12 months preceding the census. In terms of the numbers of teachers available, pupil-teacher ratios (PTRs) are essentially reasonable at all levels, being lowest at the senior secondary level and highest at the junior secondary level. At the primary level all but one LGEA has a PTR of less than 40 to 1, but it should be noted that there is variation across LGEAs, with some needing to reduce these ratios in the interest of achieving better quality educaiton.
Facilities are a weak area for the state, with very low proportions of classrooms across levels having sufficient seating for students (only 14% of junior secondary schools have enough seats), and unacceptably low numbers of good, fully usable blackboards. A significant minority of classrooms are unusable (8-9% depending on the level), and between 32% and 42% of classrooms are in need of major repairs, depending on the level. Around half of all Lagos public schools have no source of water at the school, and 53% of primary schools, 43% of junior secondary schools, and 37% of all senior secondary schools have no functioning toilet. Over all pupil-toilet ratios are bad across all LGEAs, however there is great variation with a range of 120 to 528 children per toilet at the junior secondary level. In general the report shows that there is great pressure on junior secondary schools, with concentrated investment and support needed at this level.
Lagos State School Census Report 2009-2010
iii August 2010
Table of contents
Preface i
Executive summary ii
List of tables iv
Ratios explained v
Abbreviations vi
1 Background 1
2 Schools 2
3 Students 3
4 Teachers 9
5 Facilities 14
Annex A Population projections 19
Lagos State School Census Report 2009-2010
iv August 2010
List of tables
Table 2.1 Number of schools 2 Table 2.2 Number of schools, teachers and enrolment 2 Table 2.3 Selective characteristics of schools 2 Table 3.1 Enrolment in pre-primary education by LGEA 3 Table 3.2 Enrolment in primary schools by class, sex and LGEA 4 Table 3.3 Primary school enrolment by sex, age group and LGEA 5 Table 3.4 Enrolment in junior secondary schools by class, sex and LGEA 5 Table 3.5 Junior secondary school enrolment by sex, age group and LGEA 6 Table 3.6 Enrolment in senior secondary schools by class, sex and LGEA 6 Table 3.7 Senior secondary school enrolment by sex and LGEA 7 Table 3.8 Enrolment of special needs children in primary schools 7 Table 3.9 Enrolment of special needs children in secondary schools 7 Table 3.10 Repeaters in primary schools by LGEA, class and sex 8 Table 3.11 Repeaters in secondary schools by LGEA, class and sex 8 Table 4.1 Number of pre-primary teachers by sex and LGEA 9 Table 4.2 Number of primary school teachers by sex and LGEA 9 Table 4.3 Pupil-teacher ratio by LGEA, primary schools 10 Table 4.4 Number of junior secondary school teachers by sex and LGEA 10 Table 4.5 Pupil-teacher ratio by LGEA, junior secondary schools 11 Table 4.6 Number of senior secondary school teachers by sex and LGEA 11 Table 4.7 Pupil-teacher ratio by LGEA, senior secondary schools 12 Table 4.8 Percentage of long-term absent teachers 12 Table 4.9 Percentage of teachers by highest level of education attained 12 Table 4.10 Percentage of teachers by source of salary 13 Table 4.11 Proportion of teachers who attended training seminar / workshop 13 Table 5.1 Number of classrooms by LGEA 14 Table 5.2 Pupil-classroom ratio by LGEA 14 Table 5.3 Selective characteristics of primary school facilities 14 Table 5.4 Selective characteristics of junior secondary school facilities 15 Table 5.5 Selective characteristics of senior secondary school facilities 16 Table 5.6 Main source of safe water in primary schools 16 Table 5.7 Main source of safe water in junior secondary schools 17 Table 5.8 Main source of safe water in senior secondary schools 17 Table 5.9 Toilets for pupils in primary schools 18 Table 5.10 Toilets for pupils in junior secondary schools 18 Table 5.11 Toilets for pupils in senior secondary schools 19 Table A.1 Population projections by LGEA, 2009 20
Lagos State School Census Report 2009-2010
v August 2010
Ratios explained
The definition of the pupil-teacher ratio (PTR):
The average number of pupils (students) per teacher at a specific level of education in a given school year.
- To measure the level of human resources input in terms of the number of teachers in relation to the size of the pupil population. The results can be compared with established national norms on the number of pupils per teacher.
Source: UNESCO Institute of Statistics, Education Indicators, Technical Guidelines, November 2009
Interpreting pupil-teacher ratios as presented in this report:
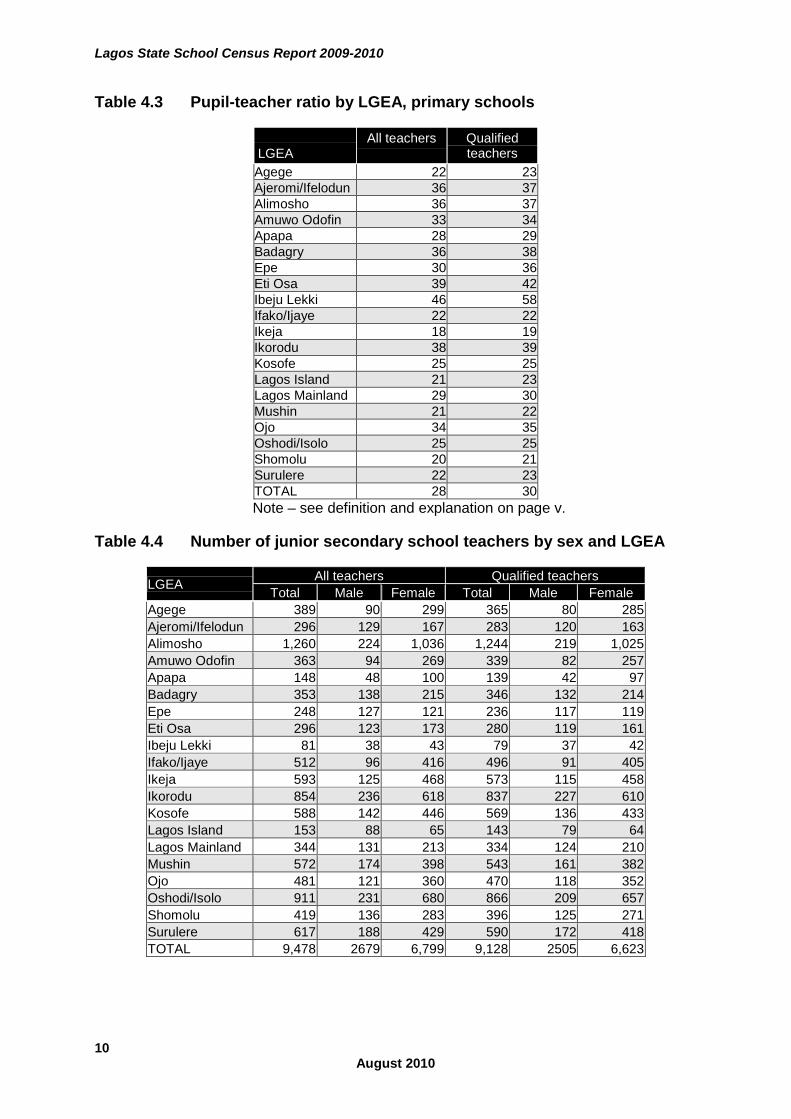
Tables 4.3, 4.5 and 4.7 in this report represent the ratio using a single number. For example, in table 4.3 where the number 22 appears under ‘All teachers’ for Agege LGEA, this means that there is an average of 22 pupils per teacher in that LGEA. Where the number 23 appears under ‘Qualified teachers’, this means that, excluding all unqualified teachers, there is an average of 23 pupils per teacher in the LGEA. When unqualified teachers are excluded, the pupil-teacher ratio becomes larger.
The definition and presentation of the pupil-classroom ratio
The definition of the pupil-classroom ratio is the same as for the PTR (above), with the ratio presented as a single number in table 5.2. This indicates that, for example, at the primary level in Agege, there is an average of 36 children for every classroom in use at the primary level.
The definition and presentation of the pupil-toilet ratio
Again, the definition of the pupil-toilet ratio is the same as for the PTR above, and is presented as a single number in the far right colomn of tables 5.9, 5.10 and 5.11. This single number indicates that, for example, at the primary level in Agege, there is an average of 157 children for every working toilet available.
Lagos State School Census Report 2009-2010
vi August 2010
Abbreviations
ASC Annual School Census
ECCE Early Childhood Care and Education
EMIS Education Management Information System
GER Gross Enrolment Rate
NER Net Enrolment Rate
SBMC School-Based Management Committee
SMOE State Ministry of Education
SUBEB State Universal Basic Education Board
Lagos State School Census Report 2009-2010
1 August 2010
1 Background
The Nigeria Educational Management Information System Policy, which was approved by the 54th National Council on Education meeting in Katsina in December 2007, envisaged the decentralisation of the system in 2009: “different states are now required to set up, staff and furnish education management information systems for their respective states”. The Policy document determines some coordination principles (in terms of organisation, operations and the transition period). These are further explained in the Implementation Guidelines for the NEMIS Policy that was disseminated in August 2009.
The National EMIS Committee, convened in August of 2009, approved the ASC Operational Manual, which is based on a census cycle that runs yearly from August to July. The Operational Manual includes guidance for every ASC phase and a timeline. Additionally the National EMIS Committee also approved a simplified ASC questionnaire (8 pages long for the public sector) and an even shorter form for private schools (4 pages long). It was approved that the Education Sector Support Programme in Nigeria (ESSPIN) would provide a new, simple and easy-to-use data entry software designed for the newly adopted questionnaires which would be made available to all states, and lastly, November 16th was selected as the start date for the week of data collection.
This national meeting was followed up by the Lagos State EMIS Committee meeting, during which the committee decided on major changes to the way that the Lagos census would be conducted, meaning a break with past methods. In 2009 trained enumerators were used to fill in the form while sitting with the school’s head teacher, who would supply all data needed. Field coordinators were trained to organise and oversee the work of enumerators, and ensure that forms were correctly and completely filled before being returned to the SMoE and SUBEB. Additionally, a Core EMIS Committee was instituted in the state, which was responsible for planning the census, meeting several times in the months leading up to the data collection, and members were also responsible for ensuring that enumerators and field coordinators fulfilled their duties.
Forms were returned to the SMoE and SUBEB in a fairly timely fashion. Data enterers were trained in both EMIS units, and after a delay in getting the IT infrastructure operational, data entry commenced and was completed in approximately one month. Data was cleaned and data analysts were trained; capacity of data enterers and analysts was raised with the support of ESSPIN, although there is still need for more such capacity building during the coming cycle. As a result of these efforts, state officers were able to accurately generate the tables in this report. The content of these tables were checked and double-checked to ensure accuracy.
This report presents an overview of Lagos’ public school system, with the intention that this information will be used in planning across the education sector, and will cut down on the need for ministries, departments and agencies collecting their own data. As the methods for conducting this census constitute a complete break with the past, this report should be viewed with confidence, and is presented with the pride of Lagos State.
Lagos State School Census Report 2009-2010
2 August 2010
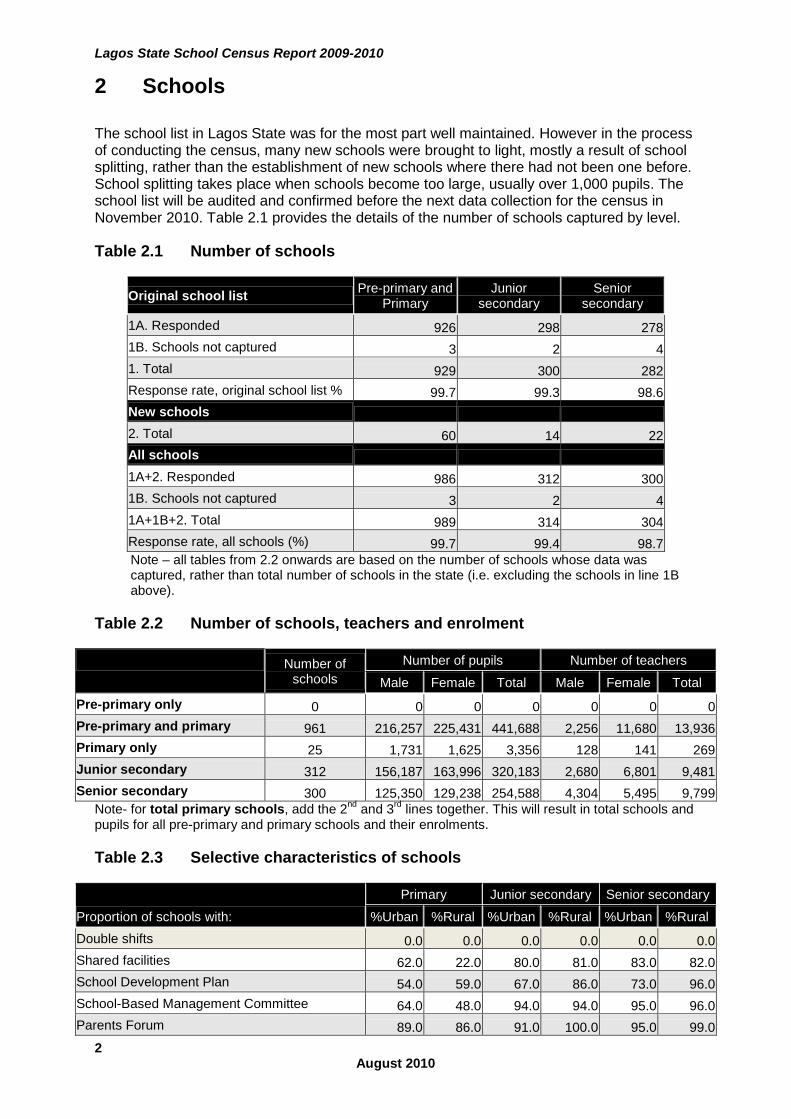
2 Schools
The school list in Lagos State was for the most part well maintained. However in the process of conducting the census, many new schools were brought to light, mostly a result of school splitting, rather than the establishment of new schools where there had not been one before. School splitting takes place when schools become too large, usually over 1,000 pupils. The school list will be audited and confirmed before the next data collection for the census in November 2010. Table 2.1 provides the details of the number of schools captured by level.
Table 2.1 Number of schools
Original school list Pre-primary and Primary
Junior secondary
Senior secondary
1A. Responded 926 298 278 1B. Schools not captured 3 2 4 1. Total 929 300 282 Response rate, original school list % 99.7 99.3 98.6 New schools 2. Total 60 14 22 All schools 1A+2. Responded 986 312 300 1B. Schools not captured 3 2 4 1A+1B+2. Total 989 314 304 Response rate, all schools (%) 99.7 99.4 98.7 Note – all tables from 2.2 onwards are based on the number of schools whose data was captured, rather than total number of schools in the state (i.e. excluding the schools in line 1B above).
Table 2.2 Number of schools, teachers and enrolment
Number of schools
Number of pupils Number of teachers
Male Female Total Male Female Total Pre-primary only 0 0 0 0 0 0 0 Pre-primary and primary 961 216,257 225,431 441,688 2,256 11,680 13,936 Primary only 25 1,731 1,625 3,356 128 141 269 Junior secondary 312 156,187 163,996 320,183 2,680 6,801 9,481 Senior secondary 300 125,350 129,238 254,588 4,304 5,495 9,799
Note- for total primary schools, add the 2nd and 3rd lines together. This will result in total schools and pupils for all pre-primary and primary schools and their enrolments.
Table 2.3 Selective characteristics of schools
Proportion of schools with:
Primary Junior secondary Senior secondary
%Urban %Rural %Urban %Rural %Urban %Rural Double shifts 0.0 0.0 0.0 0.0 0.0 0.0 Shared facilities 62.0 22.0 80.0 81.0 83.0 82.0 School Development Plan 54.0 59.0 67.0 86.0 73.0 96.0 School-Based Management Committee 64.0 48.0 94.0 94.0 95.0 96.0 Parents Forum 89.0 86.0 91.0 100.0 95.0 99.0
Lagos State School Census Report 2009-2010
3 August 2010
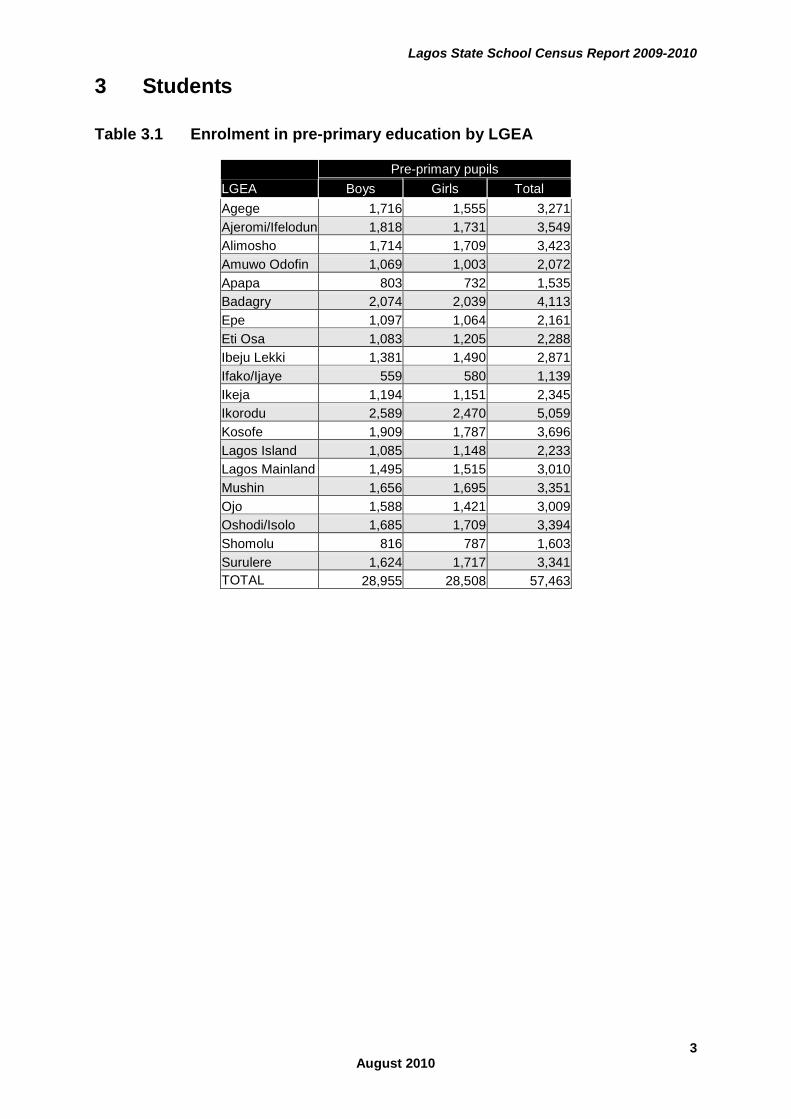
3 Students
Table 3.1 Enrolment in pre-primary education by LGEA
LGEA Pre-primary pupils
Boys Girls Total Agege 1,716 1,555 3,271 Ajeromi/Ifelodun 1,818 1,731 3,549 Alimosho 1,714 1,709 3,423 Amuwo Odofin 1,069 1,003 2,072 Apapa 803 732 1,535 Badagry 2,074 2,039 4,113 Epe 1,097 1,064 2,161 Eti Osa 1,083 1,205 2,288 Ibeju Lekki 1,381 1,490 2,871 Ifako/Ijaye 559 580 1,139 Ikeja 1,194 1,151 2,345 Ikorodu 2,589 2,470 5,059 Kosofe 1,909 1,787 3,696 Lagos Island 1,085 1,148 2,233 Lagos Mainland 1,495 1,515 3,010 Mushin 1,656 1,695 3,351 Ojo 1,588 1,421 3,009 Oshodi/Isolo 1,685 1,709 3,394 Shomolu 816 787 1,603 Surulere 1,624 1,717 3,341 TOTAL 28,955 28,508 57,463
Lagos State School Census Report 2009-2010
4 August 2010
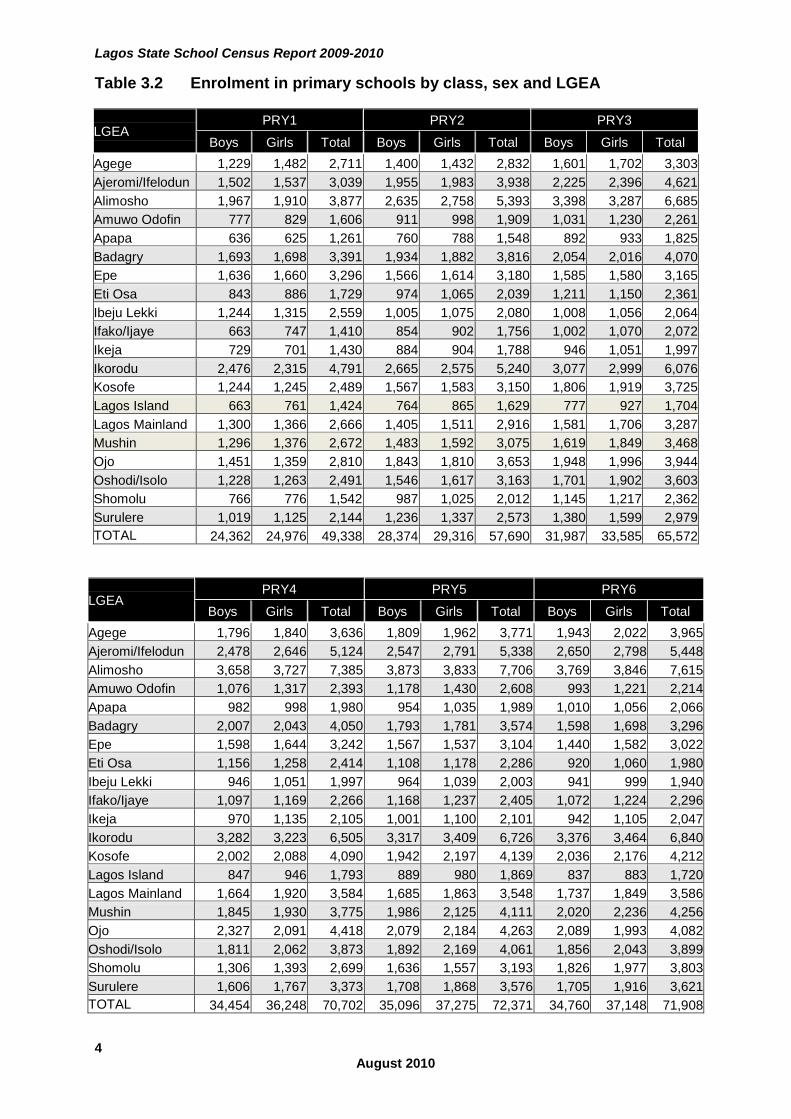
Table 3.2 Enrolment in primary schools by class, sex and LGEA
LGEA PRY1 PRY2 PRY3
Boys Girls Total Boys Girls Total Boys Girls Total Agege 1,229 1,482 2,711 1,400 1,432 2,832 1,601 1,702 3,303 Ajeromi/Ifelodun 1,502 1,537 3,039 1,955 1,983 3,938 2,225 2,396 4,621 Alimosho 1,967 1,910 3,877 2,635 2,758 5,393 3,398 3,287 6,685 Amuwo Odofin 777 829 1,606 911 998 1,909 1,031 1,230 2,261 Apapa 636 625 1,261 760 788 1,548 892 933 1,825 Badagry 1,693 1,698 3,391 1,934 1,882 3,816 2,054 2,016 4,070 Epe 1,636 1,660 3,296 1,566 1,614 3,180 1,585 1,580 3,165 Eti Osa 843 886 1,729 974 1,065 2,039 1,211 1,150 2,361 Ibeju Lekki 1,244 1,315 2,559 1,005 1,075 2,080 1,008 1,056 2,064 Ifako/Ijaye 663 747 1,410 854 902 1,756 1,002 1,070 2,072 Ikeja 729 701 1,430 884 904 1,788 946 1,051 1,997 Ikorodu 2,476 2,315 4,791 2,665 2,575 5,240 3,077 2,999 6,076 Kosofe 1,244 1,245 2,489 1,567 1,583 3,150 1,806 1,919 3,725 Lagos Island 663 761 1,424 764 865 1,629 777 927 1,704 Lagos Mainland 1,300 1,366 2,666 1,405 1,511 2,916 1,581 1,706 3,287 Mushin 1,296 1,376 2,672 1,483 1,592 3,075 1,619 1,849 3,468 Ojo 1,451 1,359 2,810 1,843 1,810 3,653 1,948 1,996 3,944 Oshodi/Isolo 1,228 1,263 2,491 1,546 1,617 3,163 1,701 1,902 3,603 Shomolu 766 776 1,542 987 1,025 2,012 1,145 1,217 2,362 Surulere 1,019 1,125 2,144 1,236 1,337 2,573 1,380 1,599 2,979 TOTAL 24,362 24,976 49,338 28,374 29,316 57,690 31,987 33,585 65,572
LGEA PRY4 PRY5 PRY6
Boys Girls Total Boys Girls Total Boys Girls Total Agege 1,796 1,840 3,636 1,809 1,962 3,771 1,943 2,022 3,965 Ajeromi/Ifelodun 2,478 2,646 5,124 2,547 2,791 5,338 2,650 2,798 5,448 Alimosho 3,658 3,727 7,385 3,873 3,833 7,706 3,769 3,846 7,615 Amuwo Odofin 1,076 1,317 2,393 1,178 1,430 2,608 993 1,221 2,214 Apapa 982 998 1,980 954 1,035 1,989 1,010 1,056 2,066 Badagry 2,007 2,043 4,050 1,793 1,781 3,574 1,598 1,698 3,296 Epe 1,598 1,644 3,242 1,567 1,537 3,104 1,440 1,582 3,022 Eti Osa 1,156 1,258 2,414 1,108 1,178 2,286 920 1,060 1,980 Ibeju Lekki 946 1,051 1,997 964 1,039 2,003 941 999 1,940 Ifako/Ijaye 1,097 1,169 2,266 1,168 1,237 2,405 1,072 1,224 2,296 Ikeja 970 1,135 2,105 1,001 1,100 2,101 942 1,105 2,047 Ikorodu 3,282 3,223 6,505 3,317 3,409 6,726 3,376 3,464 6,840 Kosofe 2,002 2,088 4,090 1,942 2,197 4,139 2,036 2,176 4,212 Lagos Island 847 946 1,793 889 980 1,869 837 883 1,720 Lagos Mainland 1,664 1,920 3,584 1,685 1,863 3,548 1,737 1,849 3,586 Mushin 1,845 1,930 3,775 1,986 2,125 4,111 2,020 2,236 4,256 Ojo 2,327 2,091 4,418 2,079 2,184 4,263 2,089 1,993 4,082 Oshodi/Isolo 1,811 2,062 3,873 1,892 2,169 4,061 1,856 2,043 3,899 Shomolu 1,306 1,393 2,699 1,636 1,557 3,193 1,826 1,977 3,803 Surulere 1,606 1,767 3,373 1,708 1,868 3,576 1,705 1,916 3,621 TOTAL 34,454 36,248 70,702 35,096 37,275 72,371 34,760 37,148 71,908
Lagos State School Census Report 2009-2010
5 August 2010
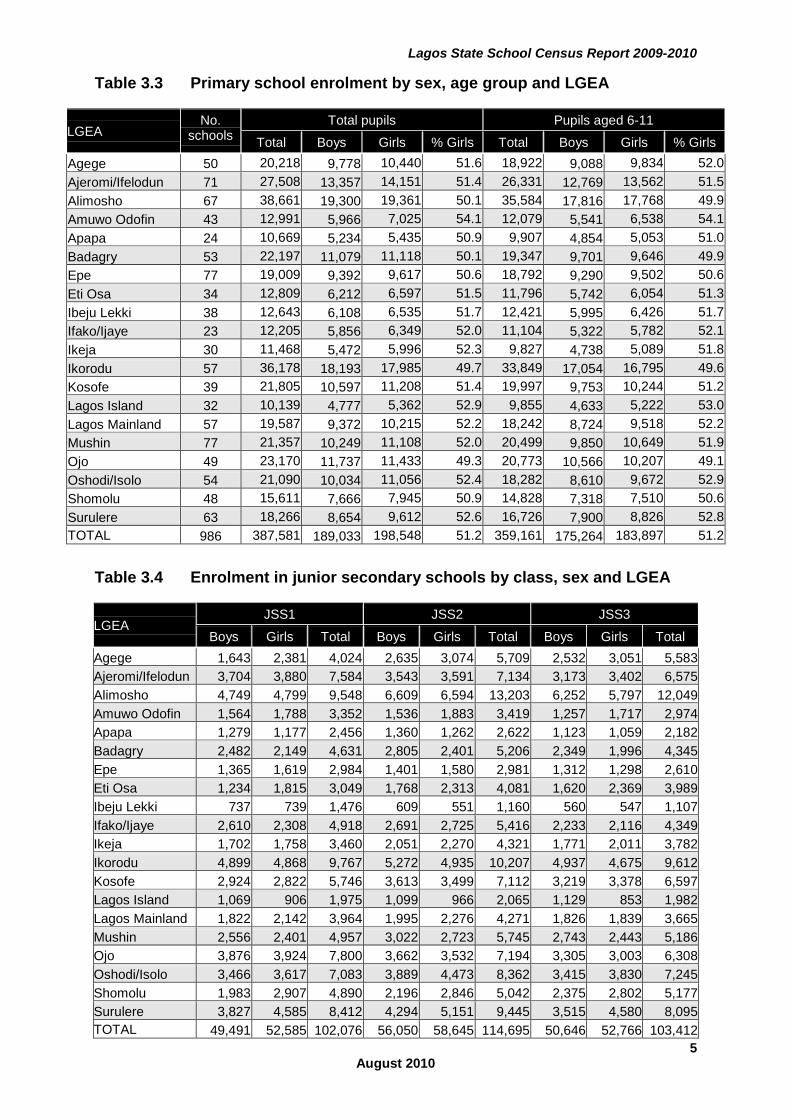
Table 3.3 Primary school enrolment by sex, age group and LGEA
LGEA No.
schools Total pupils Pupils aged 6-11
Total Boys Girls % Girls Total Boys Girls % Girls Agege 50 20,218 9,778 10,440 51.6 18,922 9,088 9,834 52.0 Ajeromi/Ifelodun 71 27,508 13,357 14,151 51.4 26,331 12,769 13,562 51.5 Alimosho 67 38,661 19,300 19,361 50.1 35,584 17,816 17,768 49.9 Amuwo Odofin 43 12,991 5,966 7,025 54.1 12,079 5,541 6,538 54.1 Apapa 24 10,669 5,234 5,435 50.9 9,907 4,854 5,053 51.0 Badagry 53 22,197 11,079 11,118 50.1 19,347 9,701 9,646 49.9 Epe 77 19,009 9,392 9,617 50.6 18,792 9,290 9,502 50.6 Eti Osa 34 12,809 6,212 6,597 51.5 11,796 5,742 6,054 51.3 Ibeju Lekki 38 12,643 6,108 6,535 51.7 12,421 5,995 6,426 51.7 Ifako/Ijaye 23 12,205 5,856 6,349 52.0 11,104 5,322 5,782 52.1 Ikeja 30 11,468 5,472 5,996 52.3 9,827 4,738 5,089 51.8 Ikorodu 57 36,178 18,193 17,985 49.7 33,849 17,054 16,795 49.6 Kosofe 39 21,805 10,597 11,208 51.4 19,997 9,753 10,244 51.2 Lagos Island 32 10,139 4,777 5,362 52.9 9,855 4,633 5,222 53.0 Lagos Mainland 57 19,587 9,372 10,215 52.2 18,242 8,724 9,518 52.2 Mushin 77 21,357 10,249 11,108 52.0 20,499 9,850 10,649 51.9 Ojo 49 23,170 11,737 11,433 49.3 20,773 10,566 10,207 49.1 Oshodi/Isolo 54 21,090 10,034 11,056 52.4 18,282 8,610 9,672 52.9 Shomolu 48 15,611 7,666 7,945 50.9 14,828 7,318 7,510 50.6 Surulere 63 18,266 8,654 9,612 52.6 16,726 7,900 8,826 52.8 TOTAL 986 387,581 189,033 198,548 51.2 359,161 175,264 183,897 51.2
Table 3.4 Enrolment in junior secondary schools by class, sex and LGEA
LGEA JSS1 JSS2 JSS3
Boys Girls Total Boys Girls Total Boys Girls Total Agege 1,643 2,381 4,024 2,635 3,074 5,709 2,532 3,051 5,583 Ajeromi/Ifelodun 3,704 3,880 7,584 3,543 3,591 7,134 3,173 3,402 6,575 Alimosho 4,749 4,799 9,548 6,609 6,594 13,203 6,252 5,797 12,049 Amuwo Odofin 1,564 1,788 3,352 1,536 1,883 3,419 1,257 1,717 2,974 Apapa 1,279 1,177 2,456 1,360 1,262 2,622 1,123 1,059 2,182 Badagry 2,482 2,149 4,631 2,805 2,401 5,206 2,349 1,996 4,345 Epe 1,365 1,619 2,984 1,401 1,580 2,981 1,312 1,298 2,610 Eti Osa 1,234 1,815 3,049 1,768 2,313 4,081 1,620 2,369 3,989 Ibeju Lekki 737 739 1,476 609 551 1,160 560 547 1,107 Ifako/Ijaye 2,610 2,308 4,918 2,691 2,725 5,416 2,233 2,116 4,349 Ikeja 1,702 1,758 3,460 2,051 2,270 4,321 1,771 2,011 3,782 Ikorodu 4,899 4,868 9,767 5,272 4,935 10,207 4,937 4,675 9,612 Kosofe 2,924 2,822 5,746 3,613 3,499 7,112 3,219 3,378 6,597 Lagos Island 1,069 906 1,975 1,099 966 2,065 1,129 853 1,982 Lagos Mainland 1,822 2,142 3,964 1,995 2,276 4,271 1,826 1,839 3,665 Mushin 2,556 2,401 4,957 3,022 2,723 5,745 2,743 2,443 5,186 Ojo 3,876 3,924 7,800 3,662 3,532 7,194 3,305 3,003 6,308 Oshodi/Isolo 3,466 3,617 7,083 3,889 4,473 8,362 3,415 3,830 7,245 Shomolu 1,983 2,907 4,890 2,196 2,846 5,042 2,375 2,802 5,177 Surulere 3,827 4,585 8,412 4,294 5,151 9,445 3,515 4,580 8,095 TOTAL 49,491 52,585 102,076 56,050 58,645 114,695 50,646 52,766 103,412
Lagos State School Census Report 2009-2010
6 August 2010
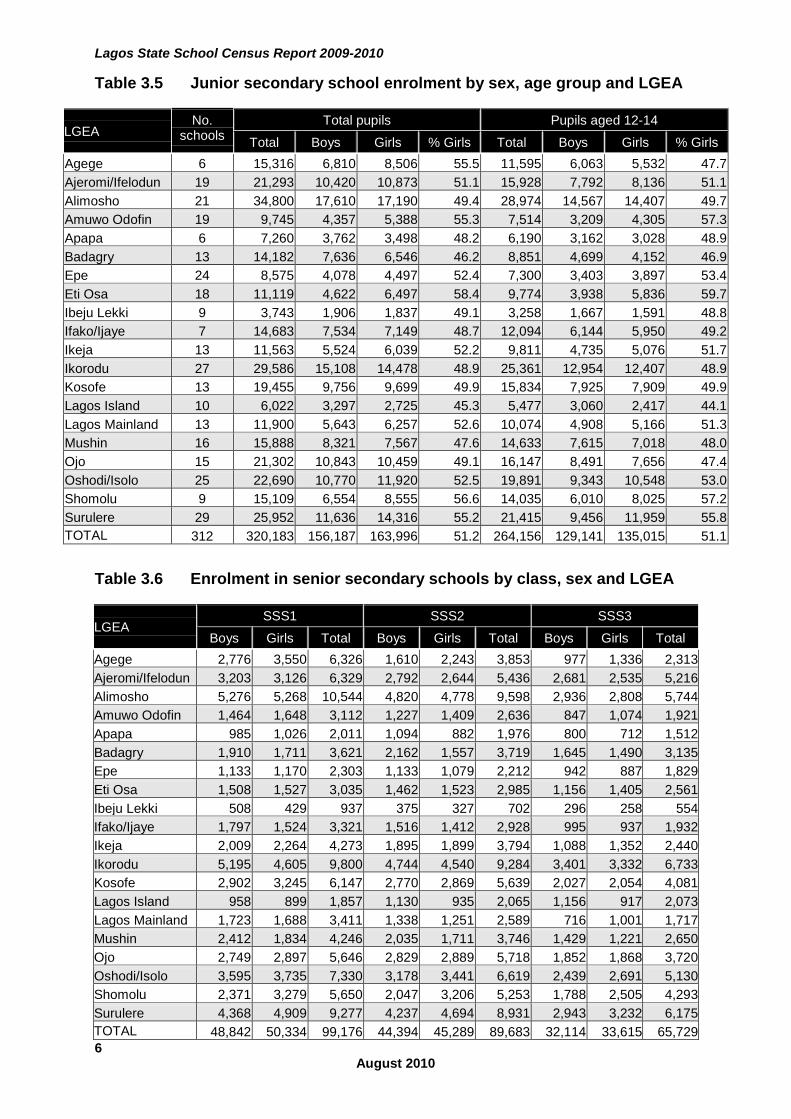
Table 3.5 Junior secondary school enrolment by sex, age group and LGEA
LGEA No.
schools Total pupils Pupils aged 12-14
Total Boys Girls % Girls Total Boys Girls % Girls Agege 6 15,316 6,810 8,506 55.5 11,595 6,063 5,532 47.7 Ajeromi/Ifelodun 19 21,293 10,420 10,873 51.1 15,928 7,792 8,136 51.1 Alimosho 21 34,800 17,610 17,190 49.4 28,974 14,567 14,407 49.7 Amuwo Odofin 19 9,745 4,357 5,388 55.3 7,514 3,209 4,305 57.3 Apapa 6 7,260 3,762 3,498 48.2 6,190 3,162 3,028 48.9 Badagry 13 14,182 7,636 6,546 46.2 8,851 4,699 4,152 46.9 Epe 24 8,575 4,078 4,497 52.4 7,300 3,403 3,897 53.4 Eti Osa 18 11,119 4,622 6,497 58.4 9,774 3,938 5,836 59.7 Ibeju Lekki 9 3,743 1,906 1,837 49.1 3,258 1,667 1,591 48.8 Ifako/Ijaye 7 14,683 7,534 7,149 48.7 12,094 6,144 5,950 49.2 Ikeja 13 11,563 5,524 6,039 52.2 9,811 4,735 5,076 51.7 Ikorodu 27 29,586 15,108 14,478 48.9 25,361 12,954 12,407 48.9 Kosofe 13 19,455 9,756 9,699 49.9 15,834 7,925 7,909 49.9 Lagos Island 10 6,022 3,297 2,725 45.3 5,477 3,060 2,417 44.1 Lagos Mainland 13 11,900 5,643 6,257 52.6 10,074 4,908 5,166 51.3 Mushin 16 15,888 8,321 7,567 47.6 14,633 7,615 7,018 48.0 Ojo 15 21,302 10,843 10,459 49.1 16,147 8,491 7,656 47.4 Oshodi/Isolo 25 22,690 10,770 11,920 52.5 19,891 9,343 10,548 53.0 Shomolu 9 15,109 6,554 8,555 56.6 14,035 6,010 8,025 57.2 Surulere 29 25,952 11,636 14,316 55.2 21,415 9,456 11,959 55.8 TOTAL 312 320,183 156,187 163,996 51.2 264,156 129,141 135,015 51.1
Table 3.6 Enrolment in senior secondary schools by class, sex and LGEA
LGEA SSS1 SSS2 SSS3
Boys Girls Total Boys Girls Total Boys Girls Total Agege 2,776 3,550 6,326 1,610 2,243 3,853 977 1,336 2,313 Ajeromi/Ifelodun 3,203 3,126 6,329 2,792 2,644 5,436 2,681 2,535 5,216 Alimosho 5,276 5,268 10,544 4,820 4,778 9,598 2,936 2,808 5,744 Amuwo Odofin 1,464 1,648 3,112 1,227 1,409 2,636 847 1,074 1,921 Apapa 985 1,026 2,011 1,094 882 1,976 800 712 1,512 Badagry 1,910 1,711 3,621 2,162 1,557 3,719 1,645 1,490 3,135 Epe 1,133 1,170 2,303 1,133 1,079 2,212 942 887 1,829 Eti Osa 1,508 1,527 3,035 1,462 1,523 2,985 1,156 1,405 2,561 Ibeju Lekki 508 429 937 375 327 702 296 258 554 Ifako/Ijaye 1,797 1,524 3,321 1,516 1,412 2,928 995 937 1,932 Ikeja 2,009 2,264 4,273 1,895 1,899 3,794 1,088 1,352 2,440 Ikorodu 5,195 4,605 9,800 4,744 4,540 9,284 3,401 3,332 6,733 Kosofe 2,902 3,245 6,147 2,770 2,869 5,639 2,027 2,054 4,081 Lagos Island 958 899 1,857 1,130 935 2,065 1,156 917 2,073 Lagos Mainland 1,723 1,688 3,411 1,338 1,251 2,589 716 1,001 1,717 Mushin 2,412 1,834 4,246 2,035 1,711 3,746 1,429 1,221 2,650 Ojo 2,749 2,897 5,646 2,829 2,889 5,718 1,852 1,868 3,720 Oshodi/Isolo 3,595 3,735 7,330 3,178 3,441 6,619 2,439 2,691 5,130 Shomolu 2,371 3,279 5,650 2,047 3,206 5,253 1,788 2,505 4,293 Surulere 4,368 4,909 9,277 4,237 4,694 8,931 2,943 3,232 6,175 TOTAL 48,842 50,334 99,176 44,394 45,289 89,683 32,114 33,615 65,729
Lagos State School Census Report 2009-2010
7 August 2010
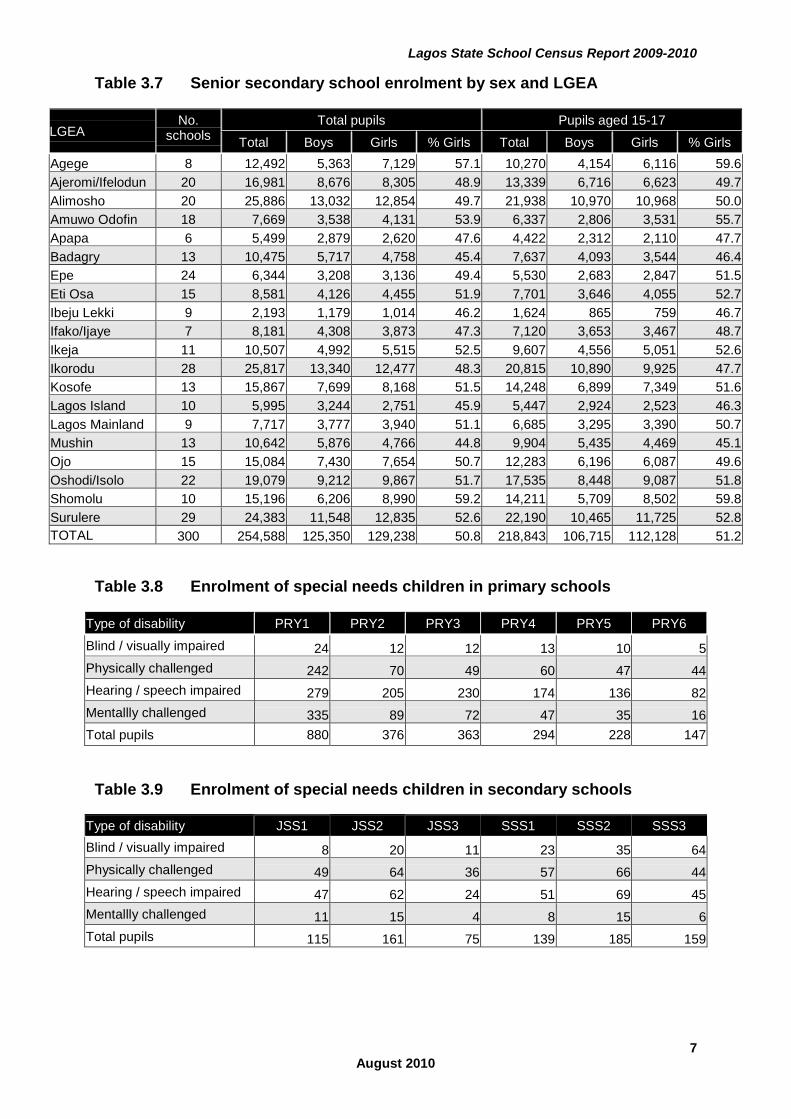
Table 3.7 Senior secondary school enrolment by sex and LGEA
LGEA No.
schools Total pupils Pupils aged 15-17
Total Boys Girls % Girls Total Boys Girls % Girls Agege 8 12,492 5,363 7,129 57.1 10,270 4,154 6,116 59.6 Ajeromi/Ifelodun 20 16,981 8,676 8,305 48.9 13,339 6,716 6,623 49.7 Alimosho 20 25,886 13,032 12,854 49.7 21,938 10,970 10,968 50.0 Amuwo Odofin 18 7,669 3,538 4,131 53.9 6,337 2,806 3,531 55.7 Apapa 6 5,499 2,879 2,620 47.6 4,422 2,312 2,110 47.7 Badagry 13 10,475 5,717 4,758 45.4 7,637 4,093 3,544 46.4 Epe 24 6,344 3,208 3,136 49.4 5,530 2,683 2,847 51.5 Eti Osa 15 8,581 4,126 4,455 51.9 7,701 3,646 4,055 52.7 Ibeju Lekki 9 2,193 1,179 1,014 46.2 1,624 865 759 46.7 Ifako/Ijaye 7 8,181 4,308 3,873 47.3 7,120 3,653 3,467 48.7 Ikeja 11 10,507 4,992 5,515 52.5 9,607 4,556 5,051 52.6 Ikorodu 28 25,817 13,340 12,477 48.3 20,815 10,890 9,925 47.7 Kosofe 13 15,867 7,699 8,168 51.5 14,248 6,899 7,349 51.6 Lagos Island 10 5,995 3,244 2,751 45.9 5,447 2,924 2,523 46.3 Lagos Mainland 9 7,717 3,777 3,940 51.1 6,685 3,295 3,390 50.7 Mushin 13 10,642 5,876 4,766 44.8 9,904 5,435 4,469 45.1 Ojo 15 15,084 7,430 7,654 50.7 12,283 6,196 6,087 49.6 Oshodi/Isolo 22 19,079 9,212 9,867 51.7 17,535 8,448 9,087 51.8 Shomolu 10 15,196 6,206 8,990 59.2 14,211 5,709 8,502 59.8 Surulere 29 24,383 11,548 12,835 52.6 22,190 10,465 11,725 52.8 TOTAL 300 254,588 125,350 129,238 50.8 218,843 106,715 112,128 51.2
Table 3.8 Enrolment of special needs children in primary schools
Type of disability PRY1 PRY2 PRY3 PRY4 PRY5 PRY6
Blind / visually impaired 24 12 12 13 10 5 Physically challenged 242 70 49 60 47 44 Hearing / speech impaired 279 205 230 174 136 82 Mentallly challenged 335 89 72 47 35 16 Total pupils 880 376 363 294 228 147
Table 3.9 Enrolment of special needs children in secondary schools
Type of disability JSS1 JSS2 JSS3 SSS1 SSS2 SSS3 Blind / visually impaired 8 20 11 23 35 64 Physically challenged 49 64 36 57 66 44 Hearing / speech impaired 47 62 24 51 69 45 Mentallly challenged 11 15 4 8 15 6 Total pupils 115 161 75 139 185 159
Lagos State School Census Report 2009-2010
8 August 2010
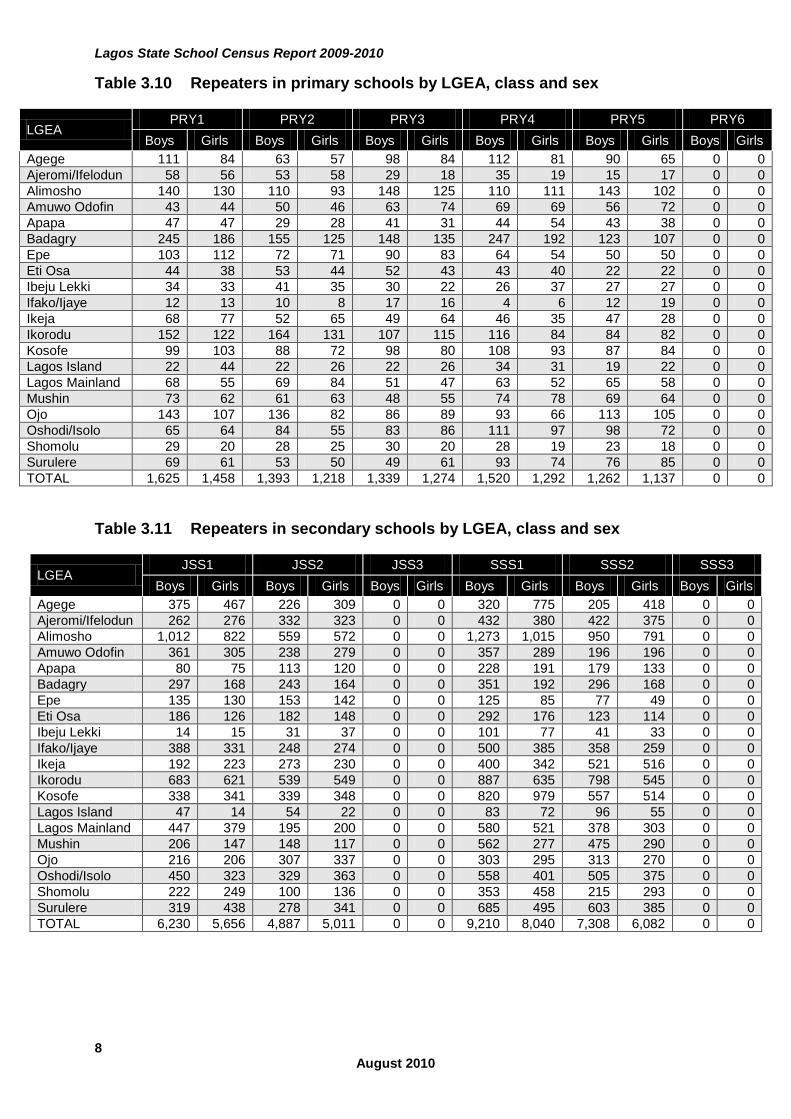
Table 3.10 Repeaters in primary schools by LGEA, class and sex
LGEA PRY1 PRY2 PRY3 PRY4 PRY5 PRY6
Boys Girls Boys Girls Boys Girls Boys Girls Boys Girls Boys Girls Agege 111 84 63 57 98 84 112 81 90 65 0 0 Ajeromi/Ifelodun 58 56 53 58 29 18 35 19 15 17 0 0 Alimosho 140 130 110 93 148 125 110 111 143 102 0 0 Amuwo Odofin 43 44 50 46 63 74 69 69 56 72 0 0 Apapa 47 47 29 28 41 31 44 54 43 38 0 0 Badagry 245 186 155 125 148 135 247 192 123 107 0 0 Epe 103 112 72 71 90 83 64 54 50 50 0 0 Eti Osa 44 38 53 44 52 43 43 40 22 22 0 0 Ibeju Lekki 34 33 41 35 30 22 26 37 27 27 0 0 Ifako/Ijaye 12 13 10 8 17 16 4 6 12 19 0 0 Ikeja 68 77 52 65 49 64 46 35 47 28 0 0 Ikorodu 152 122 164 131 107 115 116 84 84 82 0 0 Kosofe 99 103 88 72 98 80 108 93 87 84 0 0 Lagos Island 22 44 22 26 22 26 34 31 19 22 0 0 Lagos Mainland 68 55 69 84 51 47 63 52 65 58 0 0 Mushin 73 62 61 63 48 55 74 78 69 64 0 0 Ojo 143 107 136 82 86 89 93 66 113 105 0 0 Oshodi/Isolo 65 64 84 55 83 86 111 97 98 72 0 0 Shomolu 29 20 28 25 30 20 28 19 23 18 0 0 Surulere 69 61 53 50 49 61 93 74 76 85 0 0 TOTAL 1,625 1,458 1,393 1,218 1,339 1,274 1,520 1,292 1,262 1,137 0 0
Table 3.11 Repeaters in secondary schools by LGEA, class and sex
LGEA JSS1 JSS2 JSS3 SSS1 SSS2 SSS3
Boys Girls Boys Girls Boys Girls Boys Girls Boys Girls Boys Girls Agege 375 467 226 309 0 0 320 775 205 418 0 0 Ajeromi/Ifelodun 262 276 332 323 0 0 432 380 422 375 0 0 Alimosho 1,012 822 559 572 0 0 1,273 1,015 950 791 0 0 Amuwo Odofin 361 305 238 279 0 0 357 289 196 196 0 0 Apapa 80 75 113 120 0 0 228 191 179 133 0 0 Badagry 297 168 243 164 0 0 351 192 296 168 0 0 Epe 135 130 153 142 0 0 125 85 77 49 0 0 Eti Osa 186 126 182 148 0 0 292 176 123 114 0 0 Ibeju Lekki 14 15 31 37 0 0 101 77 41 33 0 0 Ifako/Ijaye 388 331 248 274 0 0 500 385 358 259 0 0 Ikeja 192 223 273 230 0 0 400 342 521 516 0 0 Ikorodu 683 621 539 549 0 0 887 635 798 545 0 0 Kosofe 338 341 339 348 0 0 820 979 557 514 0 0 Lagos Island 47 14 54 22 0 0 83 72 96 55 0 0 Lagos Mainland 447 379 195 200 0 0 580 521 378 303 0 0 Mushin 206 147 148 117 0 0 562 277 475 290 0 0 Ojo 216 206 307 337 0 0 303 295 313 270 0 0 Oshodi/Isolo 450 323 329 363 0 0 558 401 505 375 0 0 Shomolu 222 249 100 136 0 0 353 458 215 293 0 0 Surulere 319 438 278 341 0 0 685 495 603 385 0 0 TOTAL 6,230 5,656 4,887 5,011 0 0 9,210 8,040 7,308 6,082 0 0
Lagos State School Census Report 2009-2010
9 August 2010
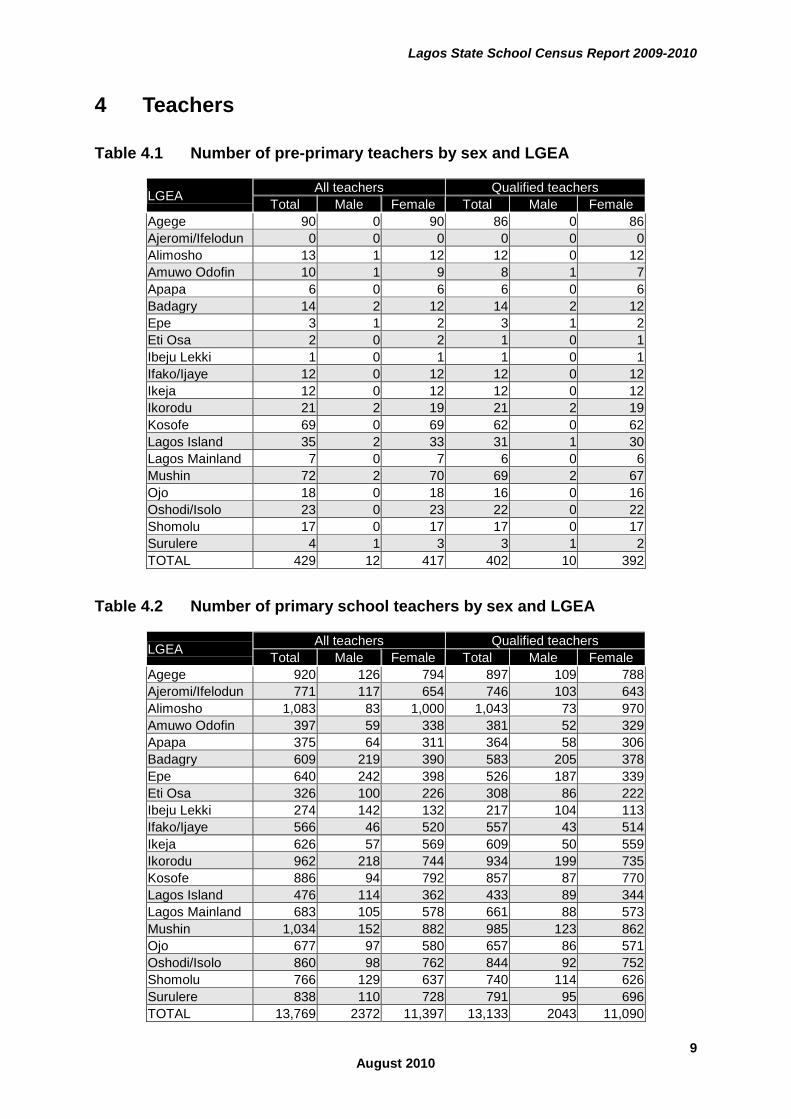
4 Teachers
Table 4.1 Number of pre-primary teachers by sex and LGEA
LGEA All teachers Qualified teachers Total Male Female Total Male Female
Agege 90 0 90 86 0 86 Ajeromi/Ifelodun 0 0 0 0 0 0 Alimosho 13 1 12 12 0 12 Amuwo Odofin 10 1 9 8 1 7 Apapa 6 0 6 6 0 6 Badagry 14 2 12 14 2 12 Epe 3 1 2 3 1 2 Eti Osa 2 0 2 1 0 1 Ibeju Lekki 1 0 1 1 0 1 Ifako/Ijaye 12 0 12 12 0 12 Ikeja 12 0 12 12 0 12 Ikorodu 21 2 19 21 2 19 Kosofe 69 0 69 62 0 62 Lagos Island 35 2 33 31 1 30 Lagos Mainland 7 0 7 6 0 6 Mushin 72 2 70 69 2 67 Ojo 18 0 18 16 0 16 Oshodi/Isolo 23 0 23 22 0 22 Shomolu 17 0 17 17 0 17 Surulere 4 1 3 3 1 2 TOTAL 429 12 417 402 10 392
Table 4.2 Number of primary school teachers by sex and LGEA
LGEA All teachers Qualified teachers Total Male Female Total Male Female
Agege 920 126 794 897 109 788 Ajeromi/Ifelodun 771 117 654 746 103 643 Alimosho 1,083 83 1,000 1,043 73 970 Amuwo Odofin 397 59 338 381 52 329 Apapa 375 64 311 364 58 306 Badagry 609 219 390 583 205 378 Epe 640 242 398 526 187 339 Eti Osa 326 100 226 308 86 222 Ibeju Lekki 274 142 132 217 104 113 Ifako/Ijaye 566 46 520 557 43 514 Ikeja 626 57 569 609 50 559 Ikorodu 962 218 744 934 199 735 Kosofe 886 94 792 857 87 770 Lagos Island 476 114 362 433 89 344 Lagos Mainland 683 105 578 661 88 573 Mushin 1,034 152 882 985 123 862 Ojo 677 97 580 657 86 571 Oshodi/Isolo 860 98 762 844 92 752 Shomolu 766 129 637 740 114 626 Surulere 838 110 728 791 95 696 TOTAL 13,769 2372 11,397 13,133 2043 11,090
Lagos State School Census Report 2009-2010
10 August 2010
Table 4.3 Pupil-teacher ratio by LGEA, primary schools
LGEA All teachers Qualified
teachers Agege 22 23 Ajeromi/Ifelodun 36 37 Alimosho 36 37 Amuwo Odofin 33 34 Apapa 28 29 Badagry 36 38 Epe 30 36 Eti Osa 39 42 Ibeju Lekki 46 58 Ifako/Ijaye 22 22 Ikeja 18 19 Ikorodu 38 39 Kosofe 25 25 Lagos Island 21 23 Lagos Mainland 29 30 Mushin 21 22 Ojo 34 35 Oshodi/Isolo 25 25 Shomolu 20 21 Surulere 22 23 TOTAL 28 30
Note – see definition and explanation on page v.
Table 4.4 Number of junior secondary school teachers by sex and LGEA
LGEA All teachers Qualified teachers Total Male Female Total Male Female
Agege 389 90 299 365 80 285 Ajeromi/Ifelodun 296 129 167 283 120 163 Alimosho 1,260 224 1,036 1,244 219 1,025 Amuwo Odofin 363 94 269 339 82 257 Apapa 148 48 100 139 42 97 Badagry 353 138 215 346 132 214 Epe 248 127 121 236 117 119 Eti Osa 296 123 173 280 119 161 Ibeju Lekki 81 38 43 79 37 42 Ifako/Ijaye 512 96 416 496 91 405 Ikeja 593 125 468 573 115 458 Ikorodu 854 236 618 837 227 610 Kosofe 588 142 446 569 136 433 Lagos Island 153 88 65 143 79 64 Lagos Mainland 344 131 213 334 124 210 Mushin 572 174 398 543 161 382 Ojo 481 121 360 470 118 352 Oshodi/Isolo 911 231 680 866 209 657 Shomolu 419 136 283 396 125 271 Surulere 617 188 429 590 172 418 TOTAL 9,478 2679 6,799 9,128 2505 6,623
Lagos State School Census Report 2009-2010
11 August 2010
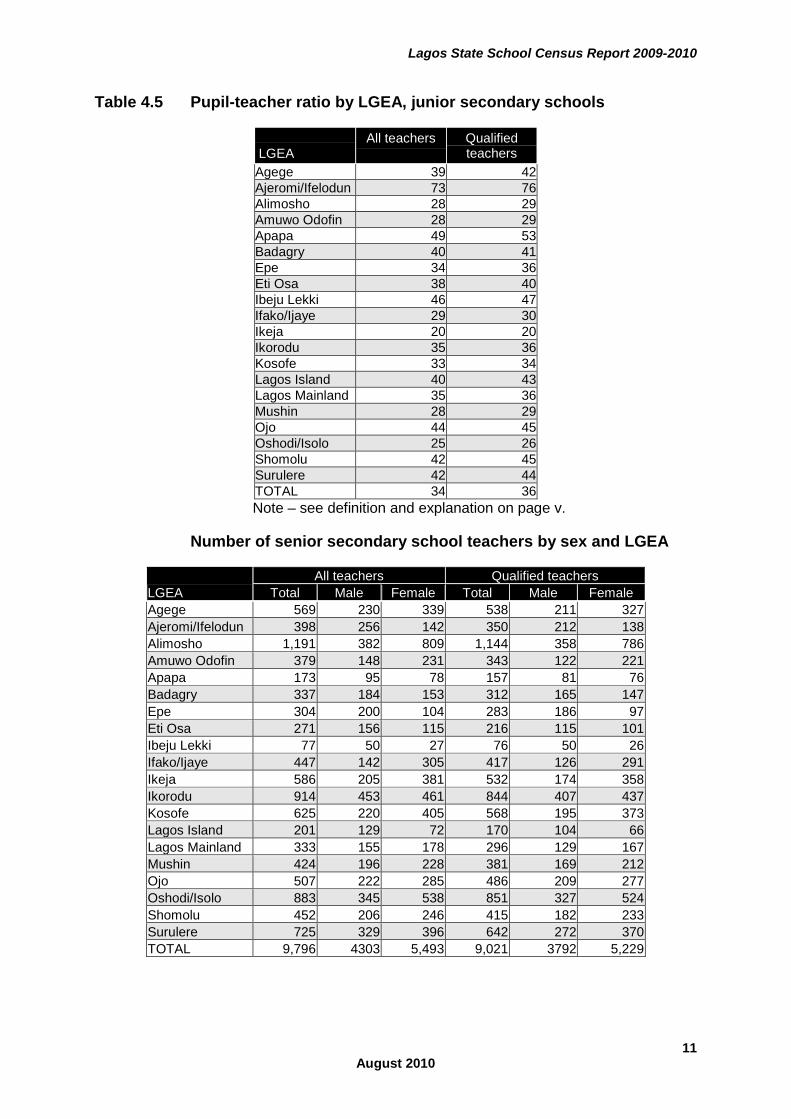
Table 4.5 Pupil-teacher ratio by LGEA, junior secondary schools
LGEA All teachers Qualified
teachers Agege 39 42 Ajeromi/Ifelodun 73 76 Alimosho 28 29 Amuwo Odofin 28 29 Apapa 49 53 Badagry 40 41 Epe 34 36 Eti Osa 38 40 Ibeju Lekki 46 47 Ifako/Ijaye 29 30 Ikeja 20 20 Ikorodu 35 36 Kosofe 33 34 Lagos Island 40 43 Lagos Mainland 35 36 Mushin 28 29 Ojo 44 45 Oshodi/Isolo 25 26 Shomolu 42 45 Surulere 42 44 TOTAL 34 36
Note – see definition and explanation on page v.
Number of senior secondary school teachers by sex and LGEA
LGEA All teachers Qualified teachers
Total Male Female Total Male Female Agege 569 230 339 538 211 327 Ajeromi/Ifelodun 398 256 142 350 212 138 Alimosho 1,191 382 809 1,144 358 786 Amuwo Odofin 379 148 231 343 122 221 Apapa 173 95 78 157 81 76 Badagry 337 184 153 312 165 147 Epe 304 200 104 283 186 97 Eti Osa 271 156 115 216 115 101 Ibeju Lekki 77 50 27 76 50 26 Ifako/Ijaye 447 142 305 417 126 291 Ikeja 586 205 381 532 174 358 Ikorodu 914 453 461 844 407 437 Kosofe 625 220 405 568 195 373 Lagos Island 201 129 72 170 104 66 Lagos Mainland 333 155 178 296 129 167 Mushin 424 196 228 381 169 212 Ojo 507 222 285 486 209 277 Oshodi/Isolo 883 345 538 851 327 524 Shomolu 452 206 246 415 182 233 Surulere 725 329 396 642 272 370 TOTAL 9,796 4303 5,493 9,021 3792 5,229
Lagos State School Census Report 2009-2010
12 August 2010
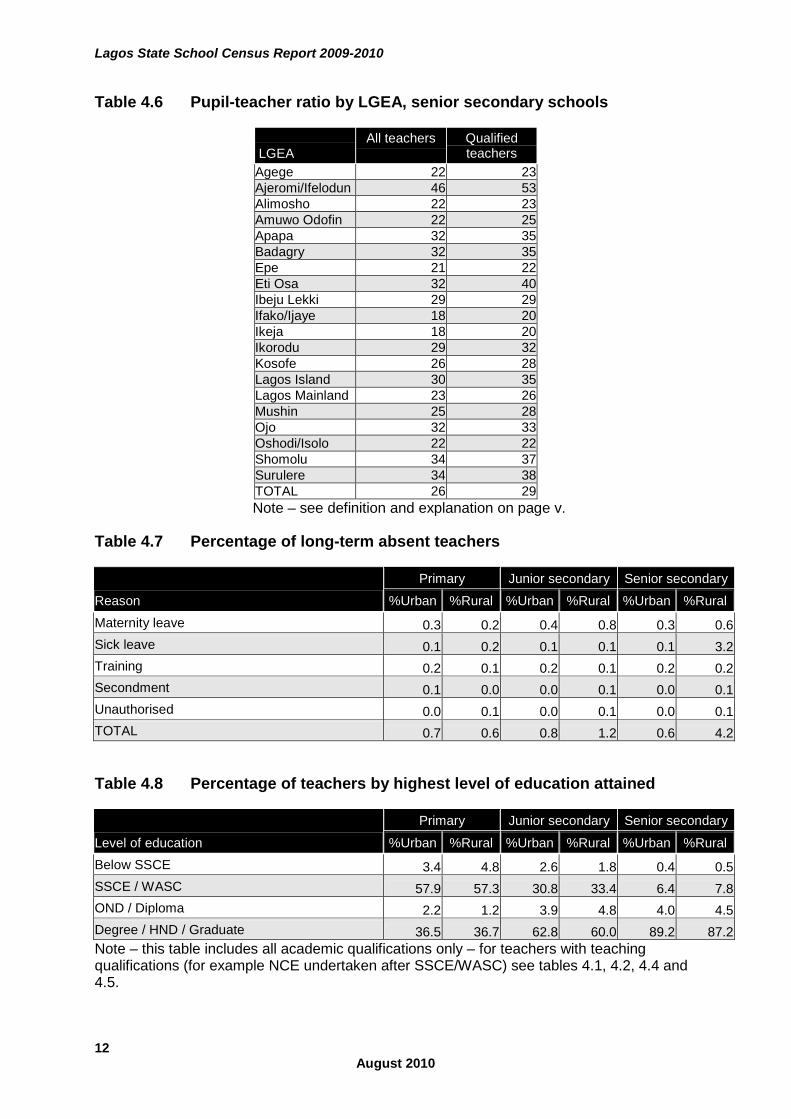
Table 4.6 Pupil-teacher ratio by LGEA, senior secondary schools
LGEA All teachers Qualified
teachers Agege 22 23 Ajeromi/Ifelodun 46 53 Alimosho 22 23 Amuwo Odofin 22 25 Apapa 32 35 Badagry 32 35 Epe 21 22 Eti Osa 32 40 Ibeju Lekki 29 29 Ifako/Ijaye 18 20 Ikeja 18 20 Ikorodu 29 32 Kosofe 26 28 Lagos Island 30 35 Lagos Mainland 23 26 Mushin 25 28 Ojo 32 33 Oshodi/Isolo 22 22 Shomolu 34 37 Surulere 34 38 TOTAL 26 29
Note – see definition and explanation on page v.
Table 4.7 Percentage of long-term absent teachers
Reason
Primary Junior secondary Senior secondary
%Urban %Rural %Urban %Rural %Urban %Rural Maternity leave 0.3 0.2 0.4 0.8 0.3 0.6 Sick leave 0.1 0.2 0.1 0.1 0.1 3.2 Training 0.2 0.1 0.2 0.1 0.2 0.2 Secondment 0.1 0.0 0.0 0.1 0.0 0.1 Unauthorised 0.0 0.1 0.0 0.1 0.0 0.1 TOTAL 0.7 0.6 0.8 1.2 0.6 4.2
Table 4.8 Percentage of teachers by highest level of education attained
Level of education
Primary Junior secondary Senior secondary
%Urban %Rural %Urban %Rural %Urban %Rural Below SSCE 3.4 4.8 2.6 1.8 0.4 0.5 SSCE / WASC 57.9 57.3 30.8 33.4 6.4 7.8 OND / Diploma 2.2 1.2 3.9 4.8 4.0 4.5 Degree / HND / Graduate 36.5 36.7 62.8 60.0 89.2 87.2 Note – this table includes all academic qualifications only – for teachers with teaching qualifications (for example NCE undertaken after SSCE/WASC) see tables 4.1, 4.2, 4.4 and 4.5.
Lagos State School Census Report 2009-2010
13 August 2010
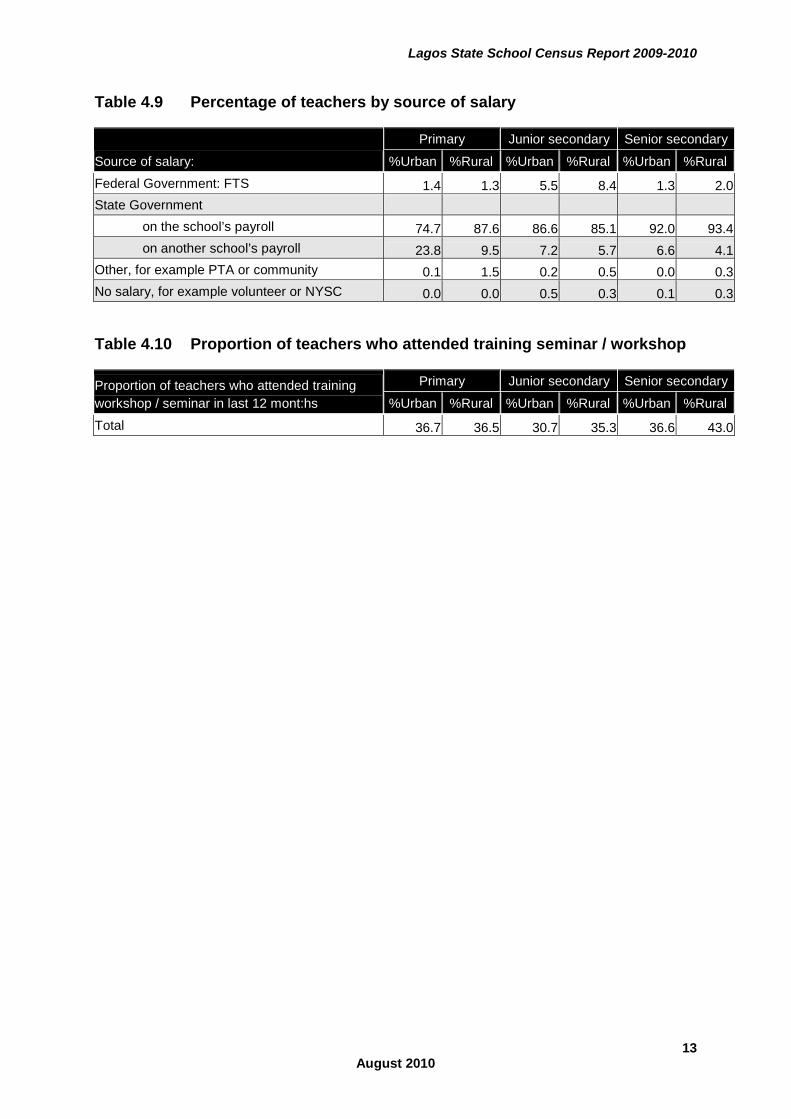
Table 4.9 Percentage of teachers by source of salary
Source of salary:
Primary Junior secondary Senior secondary
%Urban %Rural %Urban %Rural %Urban %Rural Federal Government: FTS 1.4 1.3 5.5 8.4 1.3 2.0 State Government on the school’s payroll 74.7 87.6 86.6 85.1 92.0 93.4 on another school’s payroll 23.8 9.5 7.2 5.7 6.6 4.1 Other, for example PTA or community 0.1 1.5 0.2 0.5 0.0 0.3 No salary, for example volunteer or NYSC 0.0 0.0 0.5 0.3 0.1 0.3
Table 4.10 Proportion of teachers who attended training seminar / workshop
Proportion of teachers who attended training workshop / seminar in last 12 mont:hs
Primary Junior secondary Senior secondary
%Urban %Rural %Urban %Rural %Urban %Rural Total 36.7 36.5 30.7 35.3 36.6 43.0
Lagos State School Census Report 2009-2010
14 August 2010
5 Facilities
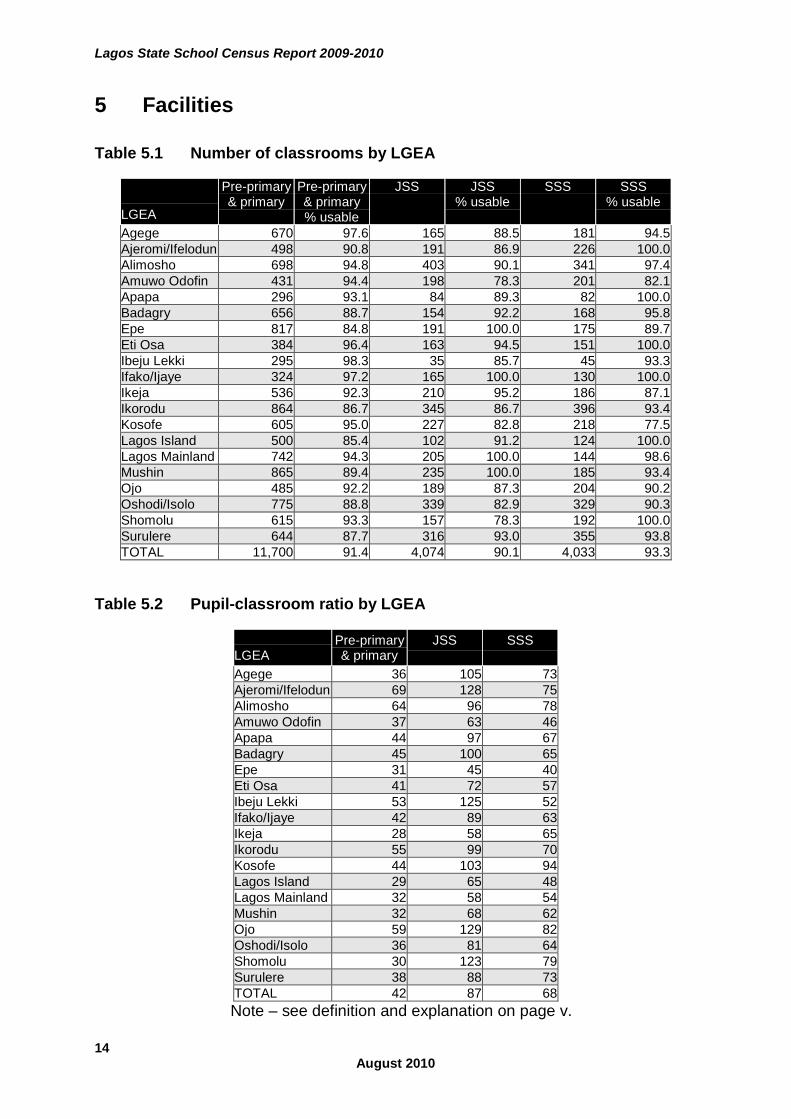
Table 5.1 Number of classrooms by LGEA
LGEA
Pre-primary & primary
Pre-primary & primary % usable
JSS JSS % usable
SSS SSS % usable
Agege 670 97.6 165 88.5 181 94.5 Ajeromi/Ifelodun 498 90.8 191 86.9 226 100.0 Alimosho 698 94.8 403 90.1 341 97.4 Amuwo Odofin 431 94.4 198 78.3 201 82.1 Apapa 296 93.1 84 89.3 82 100.0 Badagry 656 88.7 154 92.2 168 95.8 Epe 817 84.8 191 100.0 175 89.7 Eti Osa 384 96.4 163 94.5 151 100.0 Ibeju Lekki 295 98.3 35 85.7 45 93.3 Ifako/Ijaye 324 97.2 165 100.0 130 100.0 Ikeja 536 92.3 210 95.2 186 87.1 Ikorodu 864 86.7 345 86.7 396 93.4 Kosofe 605 95.0 227 82.8 218 77.5 Lagos Island 500 85.4 102 91.2 124 100.0 Lagos Mainland 742 94.3 205 100.0 144 98.6 Mushin 865 89.4 235 100.0 185 93.4 Ojo 485 92.2 189 87.3 204 90.2 Oshodi/Isolo 775 88.8 339 82.9 329 90.3 Shomolu 615 93.3 157 78.3 192 100.0 Surulere 644 87.7 316 93.0 355 93.8 TOTAL 11,700 91.4 4,074 90.1 4,033 93.3
Table 5.2 Pupil-classroom ratio by LGEA
LGEA Pre-primary & primary
JSS SSS
Agege 36 105 73 Ajeromi/Ifelodun 69 128 75 Alimosho 64 96 78 Amuwo Odofin 37 63 46 Apapa 44 97 67 Badagry 45 100 65 Epe 31 45 40 Eti Osa 41 72 57 Ibeju Lekki 53 125 52 Ifako/Ijaye 42 89 63 Ikeja 28 58 65 Ikorodu 55 99 70 Kosofe 44 103 94 Lagos Island 29 65 48 Lagos Mainland 32 58 54 Mushin 32 68 62 Ojo 59 129 82 Oshodi/Isolo 36 81 64 Shomolu 30 123 79 Surulere 38 88 73 TOTAL 42 87 68
Note – see definition and explanation on page v.
Lagos State School Census Report 2009-2010
15 August 2010
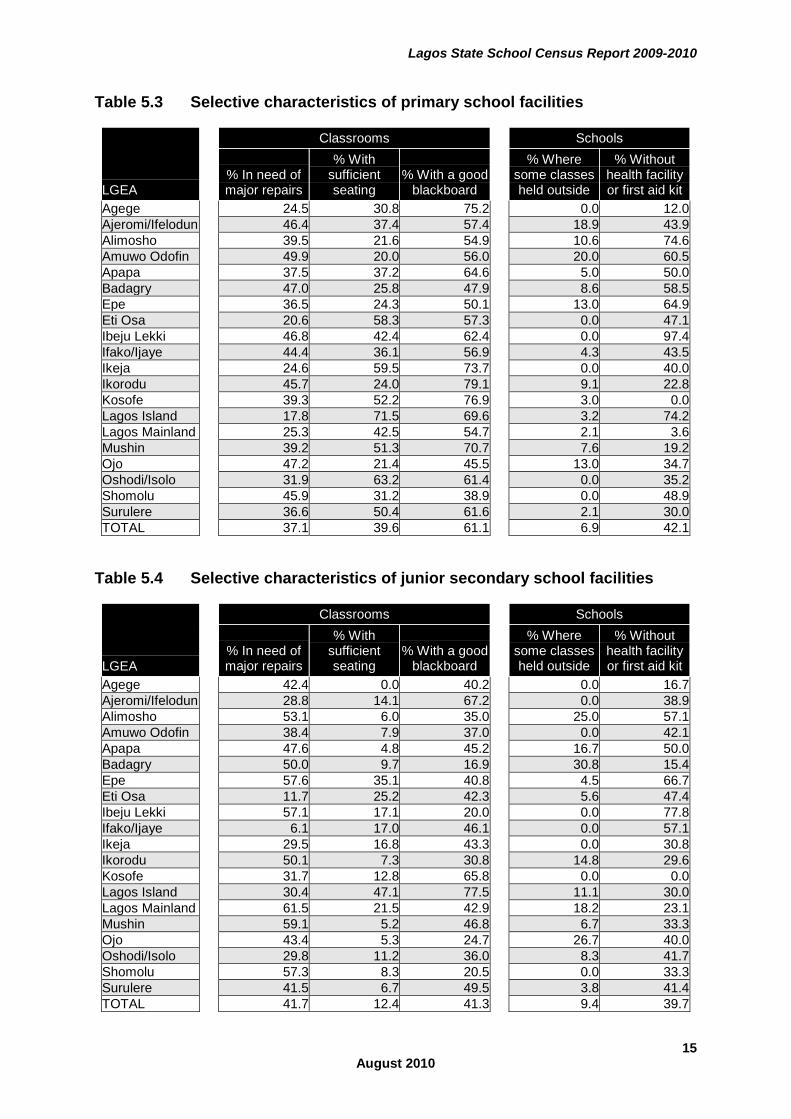
Table 5.3 Selective characteristics of primary school facilities
LGEA
Classrooms Schools
% In need of major repairs
% With sufficient seating
% With a good blackboard
% Where some classes held outside
% Without health facility or first aid kit
Agege 24.5 30.8 75.2 0.0 12.0 Ajeromi/Ifelodun 46.4 37.4 57.4 18.9 43.9 Alimosho 39.5 21.6 54.9 10.6 74.6 Amuwo Odofin 49.9 20.0 56.0 20.0 60.5 Apapa 37.5 37.2 64.6 5.0 50.0 Badagry 47.0 25.8 47.9 8.6 58.5 Epe 36.5 24.3 50.1 13.0 64.9 Eti Osa 20.6 58.3 57.3 0.0 47.1 Ibeju Lekki 46.8 42.4 62.4 0.0 97.4 Ifako/Ijaye 44.4 36.1 56.9 4.3 43.5 Ikeja 24.6 59.5 73.7 0.0 40.0 Ikorodu 45.7 24.0 79.1 9.1 22.8 Kosofe 39.3 52.2 76.9 3.0 0.0 Lagos Island 17.8 71.5 69.6 3.2 74.2 Lagos Mainland 25.3 42.5 54.7 2.1 3.6 Mushin 39.2 51.3 70.7 7.6 19.2 Ojo 47.2 21.4 45.5 13.0 34.7 Oshodi/Isolo 31.9 63.2 61.4 0.0 35.2 Shomolu 45.9 31.2 38.9 0.0 48.9 Surulere 36.6 50.4 61.6 2.1 30.0 TOTAL 37.1 39.6 61.1 6.9 42.1
Table 5.4 Selective characteristics of junior secondary school facilities
LGEA
Classrooms Schools
% In need of major repairs
% With sufficient seating
% With a good blackboard
% Where some classes held outside
% Without health facility or first aid kit
Agege 42.4 0.0 40.2 0.0 16.7 Ajeromi/Ifelodun 28.8 14.1 67.2 0.0 38.9 Alimosho 53.1 6.0 35.0 25.0 57.1 Amuwo Odofin 38.4 7.9 37.0 0.0 42.1 Apapa 47.6 4.8 45.2 16.7 50.0 Badagry 50.0 9.7 16.9 30.8 15.4 Epe 57.6 35.1 40.8 4.5 66.7 Eti Osa 11.7 25.2 42.3 5.6 47.4 Ibeju Lekki 57.1 17.1 20.0 0.0 77.8 Ifako/Ijaye 6.1 17.0 46.1 0.0 57.1 Ikeja 29.5 16.8 43.3 0.0 30.8 Ikorodu 50.1 7.3 30.8 14.8 29.6 Kosofe 31.7 12.8 65.8 0.0 0.0 Lagos Island 30.4 47.1 77.5 11.1 30.0 Lagos Mainland 61.5 21.5 42.9 18.2 23.1 Mushin 59.1 5.2 46.8 6.7 33.3 Ojo 43.4 5.3 24.7 26.7 40.0 Oshodi/Isolo 29.8 11.2 36.0 8.3 41.7 Shomolu 57.3 8.3 20.5 0.0 33.3 Surulere 41.5 6.7 49.5 3.8 41.4 TOTAL 41.7 12.4 41.3 9.4 39.7
Lagos State School Census Report 2009-2010
16 August 2010
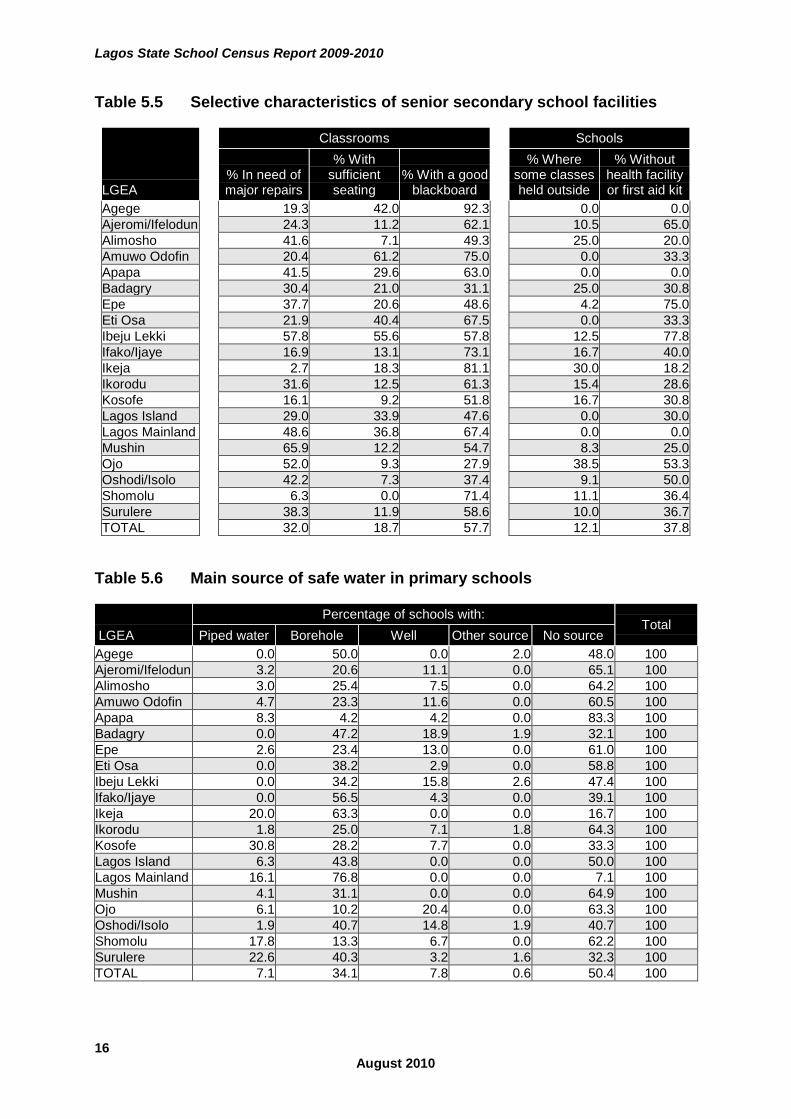
Table 5.5 Selective characteristics of senior secondary school facilities
LGEA
Classrooms Schools
% In need of major repairs
% With sufficient seating
% With a good blackboard
% Where some classes held outside
% Without health facility or first aid kit
Agege 19.3 42.0 92.3 0.0 0.0 Ajeromi/Ifelodun 24.3 11.2 62.1 10.5 65.0 Alimosho 41.6 7.1 49.3 25.0 20.0 Amuwo Odofin 20.4 61.2 75.0 0.0 33.3 Apapa 41.5 29.6 63.0 0.0 0.0 Badagry 30.4 21.0 31.1 25.0 30.8 Epe 37.7 20.6 48.6 4.2 75.0 Eti Osa 21.9 40.4 67.5 0.0 33.3 Ibeju Lekki 57.8 55.6 57.8 12.5 77.8 Ifako/Ijaye 16.9 13.1 73.1 16.7 40.0 Ikeja 2.7 18.3 81.1 30.0 18.2 Ikorodu 31.6 12.5 61.3 15.4 28.6 Kosofe 16.1 9.2 51.8 16.7 30.8 Lagos Island 29.0 33.9 47.6 0.0 30.0 Lagos Mainland 48.6 36.8 67.4 0.0 0.0 Mushin 65.9 12.2 54.7 8.3 25.0 Ojo 52.0 9.3 27.9 38.5 53.3 Oshodi/Isolo 42.2 7.3 37.4 9.1 50.0 Shomolu 6.3 0.0 71.4 11.1 36.4 Surulere 38.3 11.9 58.6 10.0 36.7 TOTAL 32.0 18.7 57.7 12.1 37.8
Table 5.6 Main source of safe water in primary schools
LGEA Percentage of schools with:
Total Piped water Borehole Well Other source No source
Agege 0.0 50.0 0.0 2.0 48.0 100 Ajeromi/Ifelodun 3.2 20.6 11.1 0.0 65.1 100 Alimosho 3.0 25.4 7.5 0.0 64.2 100 Amuwo Odofin 4.7 23.3 11.6 0.0 60.5 100 Apapa 8.3 4.2 4.2 0.0 83.3 100 Badagry 0.0 47.2 18.9 1.9 32.1 100 Epe 2.6 23.4 13.0 0.0 61.0 100 Eti Osa 0.0 38.2 2.9 0.0 58.8 100 Ibeju Lekki 0.0 34.2 15.8 2.6 47.4 100 Ifako/Ijaye 0.0 56.5 4.3 0.0 39.1 100 Ikeja 20.0 63.3 0.0 0.0 16.7 100 Ikorodu 1.8 25.0 7.1 1.8 64.3 100 Kosofe 30.8 28.2 7.7 0.0 33.3 100 Lagos Island 6.3 43.8 0.0 0.0 50.0 100 Lagos Mainland 16.1 76.8 0.0 0.0 7.1 100 Mushin 4.1 31.1 0.0 0.0 64.9 100 Ojo 6.1 10.2 20.4 0.0 63.3 100 Oshodi/Isolo 1.9 40.7 14.8 1.9 40.7 100 Shomolu 17.8 13.3 6.7 0.0 62.2 100 Surulere 22.6 40.3 3.2 1.6 32.3 100 TOTAL 7.1 34.1 7.8 0.6 50.4 100
Lagos State School Census Report 2009-2010
17 August 2010
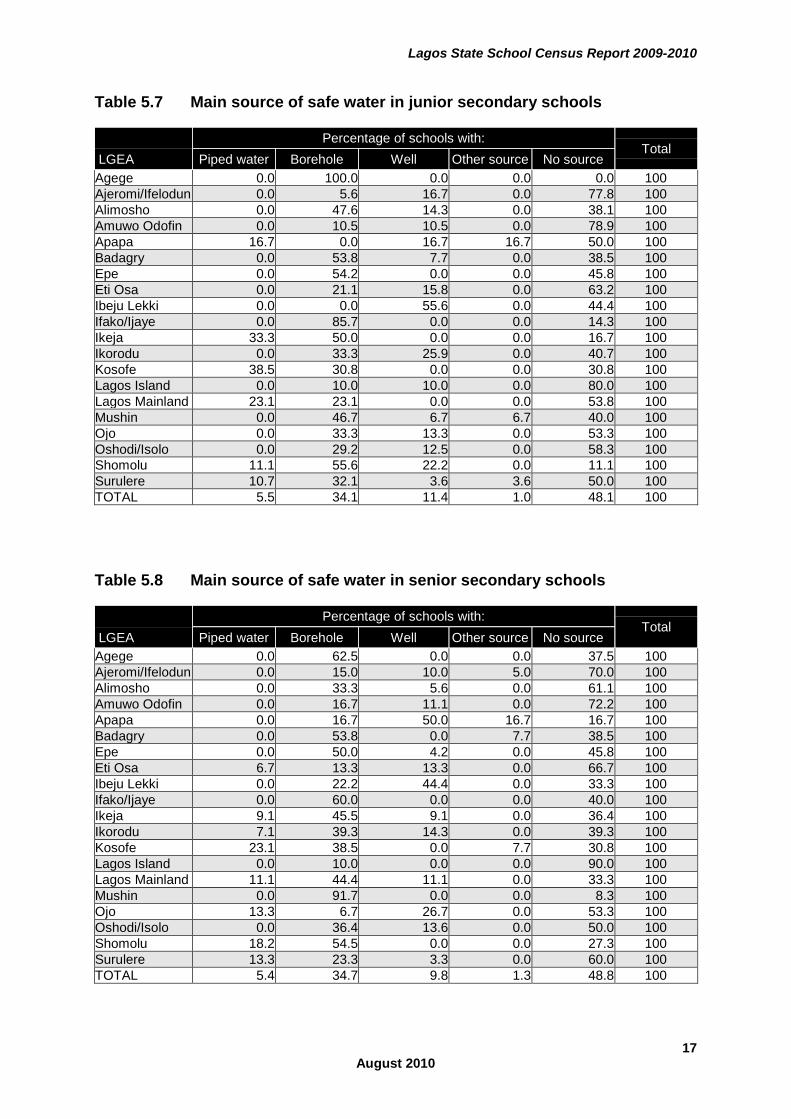
Table 5.7 Main source of safe water in junior secondary schools
LGEA Percentage of schools with:
Total Piped water Borehole Well Other source No source
Agege 0.0 100.0 0.0 0.0 0.0 100 Ajeromi/Ifelodun 0.0 5.6 16.7 0.0 77.8 100 Alimosho 0.0 47.6 14.3 0.0 38.1 100 Amuwo Odofin 0.0 10.5 10.5 0.0 78.9 100 Apapa 16.7 0.0 16.7 16.7 50.0 100 Badagry 0.0 53.8 7.7 0.0 38.5 100 Epe 0.0 54.2 0.0 0.0 45.8 100 Eti Osa 0.0 21.1 15.8 0.0 63.2 100 Ibeju Lekki 0.0 0.0 55.6 0.0 44.4 100 Ifako/Ijaye 0.0 85.7 0.0 0.0 14.3 100 Ikeja 33.3 50.0 0.0 0.0 16.7 100 Ikorodu 0.0 33.3 25.9 0.0 40.7 100 Kosofe 38.5 30.8 0.0 0.0 30.8 100 Lagos Island 0.0 10.0 10.0 0.0 80.0 100 Lagos Mainland 23.1 23.1 0.0 0.0 53.8 100 Mushin 0.0 46.7 6.7 6.7 40.0 100 Ojo 0.0 33.3 13.3 0.0 53.3 100 Oshodi/Isolo 0.0 29.2 12.5 0.0 58.3 100 Shomolu 11.1 55.6 22.2 0.0 11.1 100 Surulere 10.7 32.1 3.6 3.6 50.0 100 TOTAL 5.5 34.1 11.4 1.0 48.1 100
Table 5.8 Main source of safe water in senior secondary schools
LGEA Percentage of schools with:
Total Piped water Borehole Well Other source No source
Agege 0.0 62.5 0.0 0.0 37.5 100 Ajeromi/Ifelodun 0.0 15.0 10.0 5.0 70.0 100 Alimosho 0.0 33.3 5.6 0.0 61.1 100 Amuwo Odofin 0.0 16.7 11.1 0.0 72.2 100 Apapa 0.0 16.7 50.0 16.7 16.7 100 Badagry 0.0 53.8 0.0 7.7 38.5 100 Epe 0.0 50.0 4.2 0.0 45.8 100 Eti Osa 6.7 13.3 13.3 0.0 66.7 100 Ibeju Lekki 0.0 22.2 44.4 0.0 33.3 100 Ifako/Ijaye 0.0 60.0 0.0 0.0 40.0 100 Ikeja 9.1 45.5 9.1 0.0 36.4 100 Ikorodu 7.1 39.3 14.3 0.0 39.3 100 Kosofe 23.1 38.5 0.0 7.7 30.8 100 Lagos Island 0.0 10.0 0.0 0.0 90.0 100 Lagos Mainland 11.1 44.4 11.1 0.0 33.3 100 Mushin 0.0 91.7 0.0 0.0 8.3 100 Ojo 13.3 6.7 26.7 0.0 53.3 100 Oshodi/Isolo 0.0 36.4 13.6 0.0 50.0 100 Shomolu 18.2 54.5 0.0 0.0 27.3 100 Surulere 13.3 23.3 3.3 0.0 60.0 100 TOTAL 5.4 34.7 9.8 1.3 48.8 100
Lagos State School Census Report 2009-2010
18 August 2010
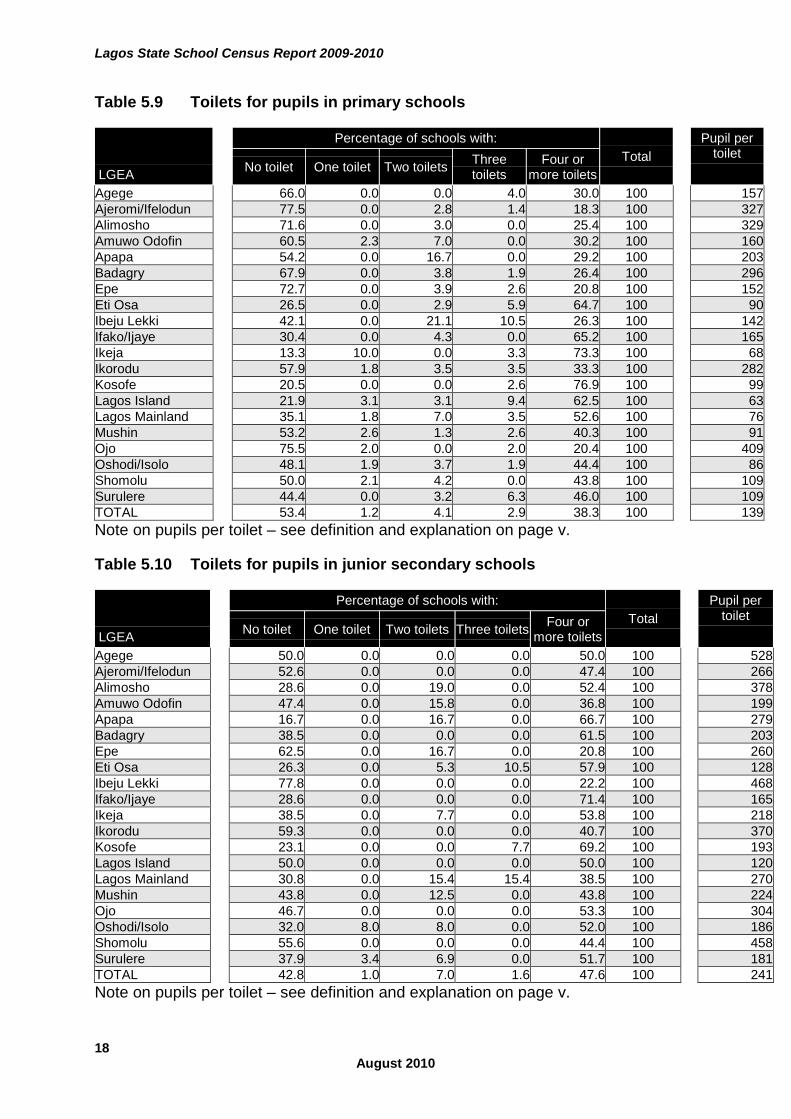
Table 5.9 Toilets for pupils in primary schools
LGEA
Percentage of schools with: Total
Pupil per toilet No toilet One toilet Two toilets Three
toilets Four or
more toilets
Agege 66.0 0.0 0.0 4.0 30.0 100 157 Ajeromi/Ifelodun 77.5 0.0 2.8 1.4 18.3 100 327 Alimosho 71.6 0.0 3.0 0.0 25.4 100 329 Amuwo Odofin 60.5 2.3 7.0 0.0 30.2 100 160 Apapa 54.2 0.0 16.7 0.0 29.2 100 203 Badagry 67.9 0.0 3.8 1.9 26.4 100 296 Epe 72.7 0.0 3.9 2.6 20.8 100 152 Eti Osa 26.5 0.0 2.9 5.9 64.7 100 90 Ibeju Lekki 42.1 0.0 21.1 10.5 26.3 100 142 Ifako/Ijaye 30.4 0.0 4.3 0.0 65.2 100 165 Ikeja 13.3 10.0 0.0 3.3 73.3 100 68 Ikorodu 57.9 1.8 3.5 3.5 33.3 100 282 Kosofe 20.5 0.0 0.0 2.6 76.9 100 99 Lagos Island 21.9 3.1 3.1 9.4 62.5 100 63 Lagos Mainland 35.1 1.8 7.0 3.5 52.6 100 76 Mushin 53.2 2.6 1.3 2.6 40.3 100 91 Ojo 75.5 2.0 0.0 2.0 20.4 100 409 Oshodi/Isolo 48.1 1.9 3.7 1.9 44.4 100 86 Shomolu 50.0 2.1 4.2 0.0 43.8 100 109 Surulere 44.4 0.0 3.2 6.3 46.0 100 109 TOTAL 53.4 1.2 4.1 2.9 38.3 100 139 Note on pupils per toilet – see definition and explanation on page v.
Table 5.10 Toilets for pupils in junior secondary schools
LGEA
Percentage of schools with: Total
Pupil per toilet No toilet One toilet Two toilets Three toilets Four or
more toilets
Agege 50.0 0.0 0.0 0.0 50.0 100 528 Ajeromi/Ifelodun 52.6 0.0 0.0 0.0 47.4 100 266 Alimosho 28.6 0.0 19.0 0.0 52.4 100 378 Amuwo Odofin 47.4 0.0 15.8 0.0 36.8 100 199 Apapa 16.7 0.0 16.7 0.0 66.7 100 279 Badagry 38.5 0.0 0.0 0.0 61.5 100 203 Epe 62.5 0.0 16.7 0.0 20.8 100 260 Eti Osa 26.3 0.0 5.3 10.5 57.9 100 128 Ibeju Lekki 77.8 0.0 0.0 0.0 22.2 100 468 Ifako/Ijaye 28.6 0.0 0.0 0.0 71.4 100 165 Ikeja 38.5 0.0 7.7 0.0 53.8 100 218 Ikorodu 59.3 0.0 0.0 0.0 40.7 100 370 Kosofe 23.1 0.0 0.0 7.7 69.2 100 193 Lagos Island 50.0 0.0 0.0 0.0 50.0 100 120 Lagos Mainland 30.8 0.0 15.4 15.4 38.5 100 270 Mushin 43.8 0.0 12.5 0.0 43.8 100 224 Ojo 46.7 0.0 0.0 0.0 53.3 100 304 Oshodi/Isolo 32.0 8.0 8.0 0.0 52.0 100 186 Shomolu 55.6 0.0 0.0 0.0 44.4 100 458 Surulere 37.9 3.4 6.9 0.0 51.7 100 181 TOTAL 42.8 1.0 7.0 1.6 47.6 100 241 Note on pupils per toilet – see definition and explanation on page v.
Lagos State School Census Report 2009-2010
19 August 2010
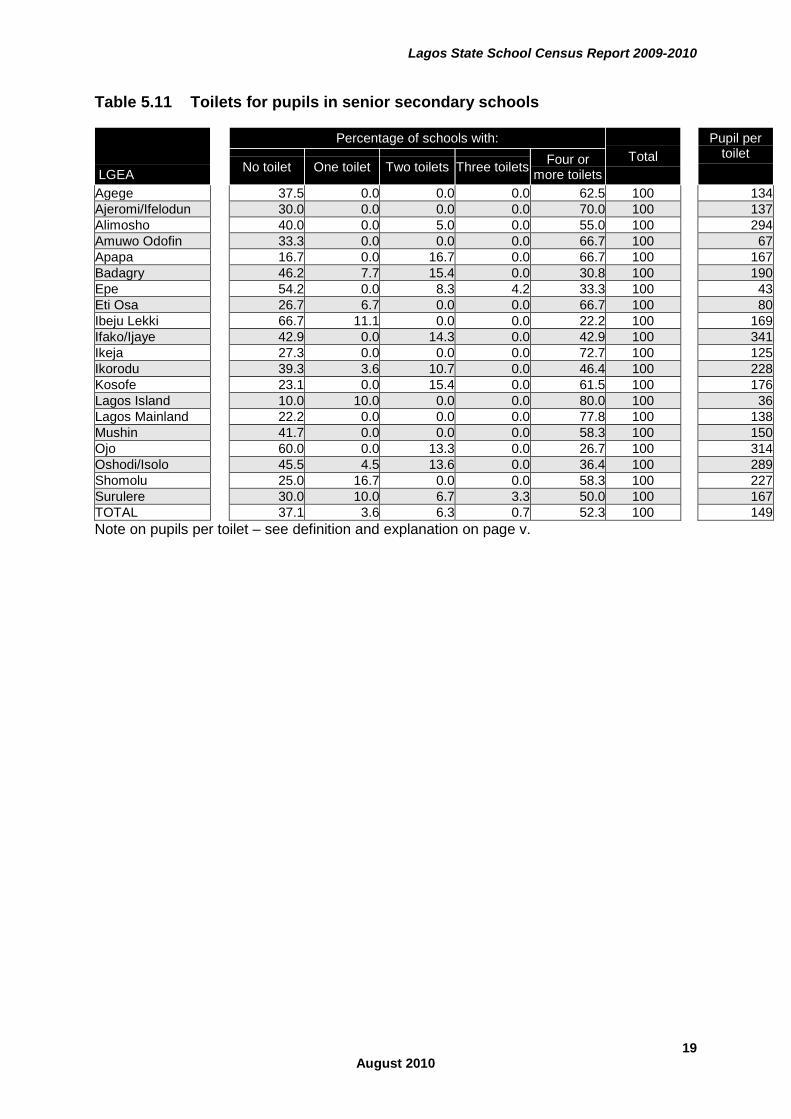
Table 5.11 Toilets for pupils in senior secondary schools
LGEA
Percentage of schools with: Total
Pupil per toilet No toilet One toilet Two toilets Three toilets Four or
more toilets
Agege 37.5 0.0 0.0 0.0 62.5 100 134 Ajeromi/Ifelodun 30.0 0.0 0.0 0.0 70.0 100 137 Alimosho 40.0 0.0 5.0 0.0 55.0 100 294 Amuwo Odofin 33.3 0.0 0.0 0.0 66.7 100 67 Apapa 16.7 0.0 16.7 0.0 66.7 100 167 Badagry 46.2 7.7 15.4 0.0 30.8 100 190 Epe 54.2 0.0 8.3 4.2 33.3 100 43 Eti Osa 26.7 6.7 0.0 0.0 66.7 100 80 Ibeju Lekki 66.7 11.1 0.0 0.0 22.2 100 169 Ifako/Ijaye 42.9 0.0 14.3 0.0 42.9 100 341 Ikeja 27.3 0.0 0.0 0.0 72.7 100 125 Ikorodu 39.3 3.6 10.7 0.0 46.4 100 228 Kosofe 23.1 0.0 15.4 0.0 61.5 100 176 Lagos Island 10.0 10.0 0.0 0.0 80.0 100 36 Lagos Mainland 22.2 0.0 0.0 0.0 77.8 100 138 Mushin 41.7 0.0 0.0 0.0 58.3 100 150 Ojo 60.0 0.0 13.3 0.0 26.7 100 314 Oshodi/Isolo 45.5 4.5 13.6 0.0 36.4 100 289 Shomolu 25.0 16.7 0.0 0.0 58.3 100 227 Surulere 30.0 10.0 6.7 3.3 50.0 100 167 TOTAL 37.1 3.6 6.3 0.7 52.3 100 149 Note on pupils per toilet – see definition and explanation on page v.
Lagos State School Census Report 2009-2010
20 August 2010
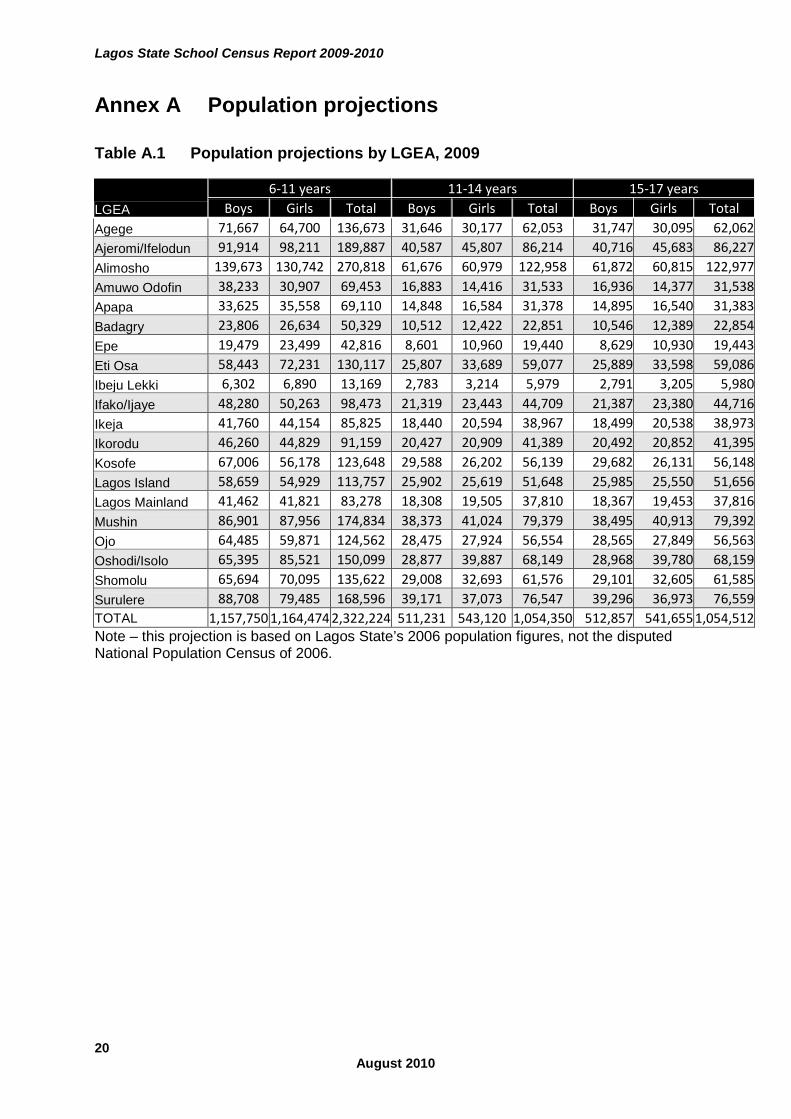
Annex A Population projections
Table A.1 Population projections by LGEA, 2009
LGEA 6-11 years 11-14 years 15-17 years
Boys Girls Total Boys Girls Total Boys Girls Total Agege 71,667 64,700 136,673 31,646 30,177 62,053 31,747 30,095 62,062 Ajeromi/Ifelodun 91,914 98,211 189,887 40,587 45,807 86,214 40,716 45,683 86,227 Alimosho 139,673 130,742 270,818 61,676 60,979 122,958 61,872 60,815 122,977 Amuwo Odofin 38,233 30,907 69,453 16,883 14,416 31,533 16,936 14,377 31,538 Apapa 33,625 35,558 69,110 14,848 16,584 31,378 14,895 16,540 31,383 Badagry 23,806 26,634 50,329 10,512 12,422 22,851 10,546 12,389 22,854 Epe 19,479 23,499 42,816 8,601 10,960 19,440 8,629 10,930 19,443 Eti Osa 58,443 72,231 130,117 25,807 33,689 59,077 25,889 33,598 59,086 Ibeju Lekki 6,302 6,890 13,169 2,783 3,214 5,979 2,791 3,205 5,980 Ifako/Ijaye 48,280 50,263 98,473 21,319 23,443 44,709 21,387 23,380 44,716 Ikeja 41,760 44,154 85,825 18,440 20,594 38,967 18,499 20,538 38,973 Ikorodu 46,260 44,829 91,159 20,427 20,909 41,389 20,492 20,852 41,395 Kosofe 67,006 56,178 123,648 29,588 26,202 56,139 29,682 26,131 56,148 Lagos Island 58,659 54,929 113,757 25,902 25,619 51,648 25,985 25,550 51,656 Lagos Mainland 41,462 41,821 83,278 18,308 19,505 37,810 18,367 19,453 37,816 Mushin 86,901 87,956 174,834 38,373 41,024 79,379 38,495 40,913 79,392 Ojo 64,485 59,871 124,562 28,475 27,924 56,554 28,565 27,849 56,563 Oshodi/Isolo 65,395 85,521 150,099 28,877 39,887 68,149 28,968 39,780 68,159 Shomolu 65,694 70,095 135,622 29,008 32,693 61,576 29,101 32,605 61,585 Surulere 88,708 79,485 168,596 39,171 37,073 76,547 39,296 36,973 76,559 TOTAL 1,157,750 1,164,474 2,322,224 511,231 543,120 1,054,350 512,857 541,655 1,054,512 Note – this projection is based on Lagos State’s 2006 population figures, not the disputed National Population Census of 2006.