Mining BEA Data to Break Local Stories by Jeannine Aversa and Thomas Dail (Texas)
26
Thomas Dail and Jeannine Aversa U.S. Bureau of Economic Analysis June 19, 2013 Mining BEA Economic Data to Break Local Stories
-
Upload
reynolds-center-for-business-journalism -
Category
Career
-
view
238 -
download
1
Transcript of Mining BEA Data to Break Local Stories by Jeannine Aversa and Thomas Dail (Texas)

Thomas Dail and Jeannine Aversa U.S. Bureau of Economic Analysis
June 19, 2013
Mining BEA Economic Data to Break Local Stories

www.bea.gov
Where to Begin?
§ You might have a hunch about something that is happening in your local economy. Or, you are on the hunt for a compelling data point to build a story around.
§ Either way, if you are willing to take the =me to analyze BEA’s interac=ve database of local economic sta=s=cs, the odds are good that you will come away with an enterprising story.
2

www.bea.gov
fr
Our Story
§ Before we dig in, we want to tell you a liBle about ourselves.
§ I’m Jeannine Aversa, I’m chief of public affairs and outreach at the BEA. Before I joined the bureau in September 2011, I worked as a journalist for nearly 30 years. For more than a decade, I was The Associated Press’ chief economics writer, covering the Federal Reserve, the Treasury Department, the IMF, World Bank and of course – all the major economic indicators!

www.bea.gov
Our Story
§ I’m Thomas Dail, and I’m a public affairs specialist at the BEA. I bring a dozen years worth of experience in newspaper repor=ng and in public rela=ons. Before joining the bureau, I covered poli=cs and business for Freedom Communica=ons in North Carolina

www.bea.gov
Today’s Goals
§ We will walk you through the types of local economic sta=s=cs BEA has available on its public website and their importance.
§ We will dissect several news stories using BEA sta=s=cs and tell you how to find them.
§ We will ask you to mine BEA’s database for specific data points.
www.bea.gov
Where to Begin?
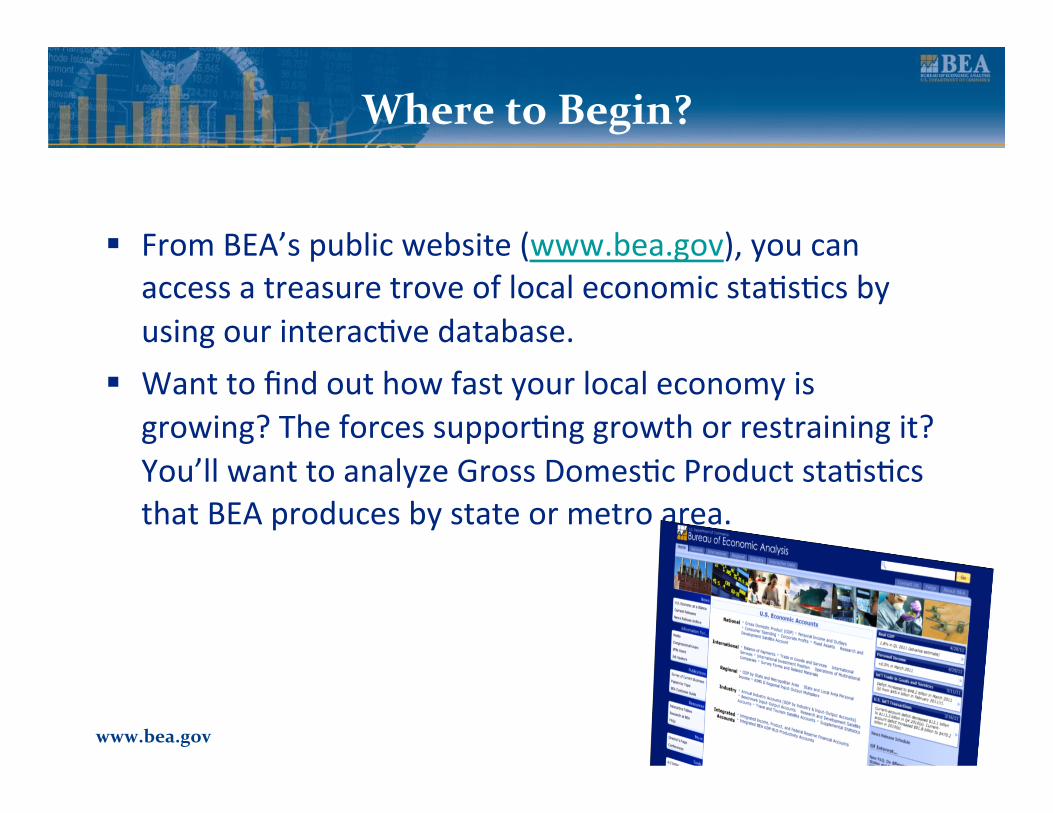
§ From BEA’s public website (www.bea.gov), you can access a treasure trove of local economic sta=s=cs by using our interac=ve database.
§ Want to find out how fast your local economy is growing? The forces suppor=ng growth or restraining it? You’ll want to analyze Gross Domes=c Product sta=s=cs that BEA produces by state or metro area.
6

www.bea.gov
Where to Begin? § Want to find out how much
people in your state, county or metro area earn? Which industries are paying more or less?
§ How much is paid in Social Security, Medicare, unemployment insurance and other government benefits?
§ Then you’ll want to troll through our income sta=s=cs by state, county or metro area.
7

www.bea.gov
Where to Begin?
§ By analyzing BEA’s local economic data, you’ll be able to spot trends and gather historical context. You might unearth data points that run counter to “conven=onal wisdom” – useful in producing a myth-‐bus=ng story.
§ Before you dive into BEA’s database, you probably will want to take =me to scan the local economic reports we produce.
8

www.bea.gov
Where to Begin?
A sampling of our published reports: § GDP by Metro Area.
Sta=s=cs for 2011. Released Feb. 22
§ State Quarterly Personal Income. Final quarter of 2012. March 27 release date. Quarterly sta=s=cs for 2013 released June 28, Sept. 30 and Dec. 19.
www.bea.gov
Where to Begin?
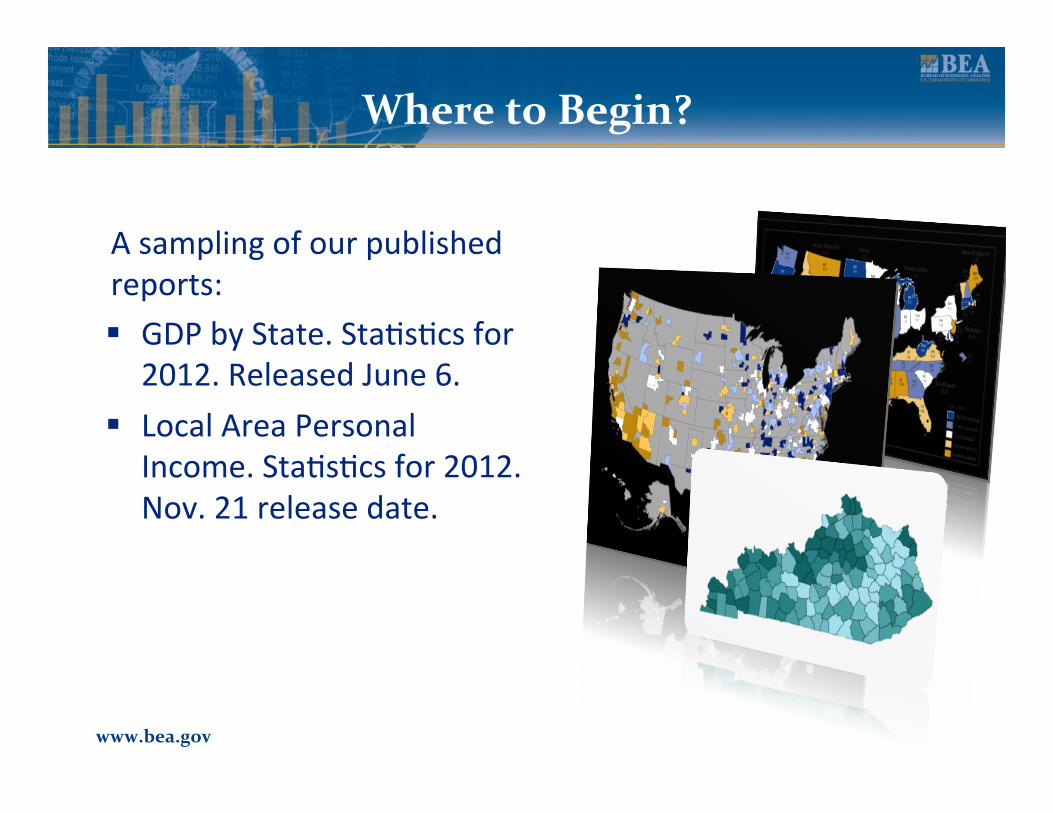
A sampling of our published reports: § GDP by State. Sta=s=cs for
2012. Released June 6. § Local Area Personal
Income. Sta=s=cs for 2012. Nov. 21 release date.
www.bea.gov
Anatomy of a Story
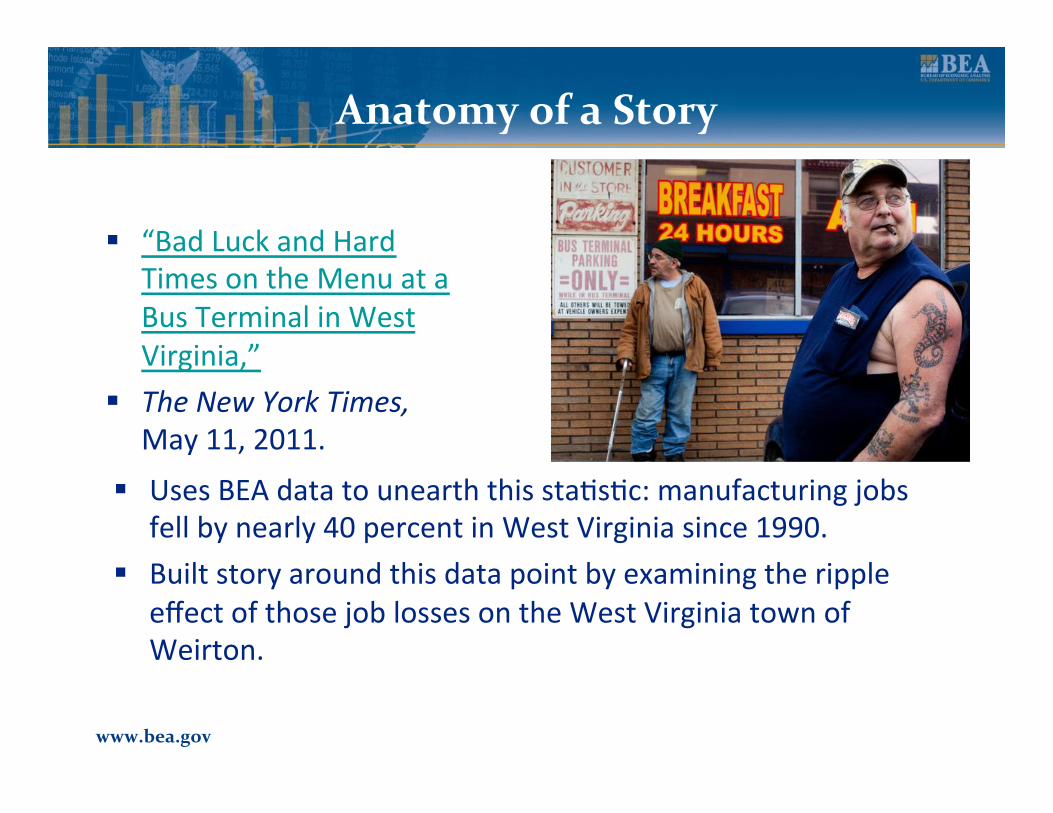
§ “Bad Luck and Hard Times on the Menu at a Bus Terminal in West Virginia,”
§ The New York Times, May 11, 2011.
§ Uses BEA data to unearth this sta=s=c: manufacturing jobs fell by nearly 40 percent in West Virginia since 1990.
§ Built story around this data point by examining the ripple effect of those job losses on the West Virginia town of Weirton.

www.bea.gov
Finding the Data
§ We’re going to walk you through how to find this data point.
www.bea.gov
www.bea.gov
Anatomy of a Story
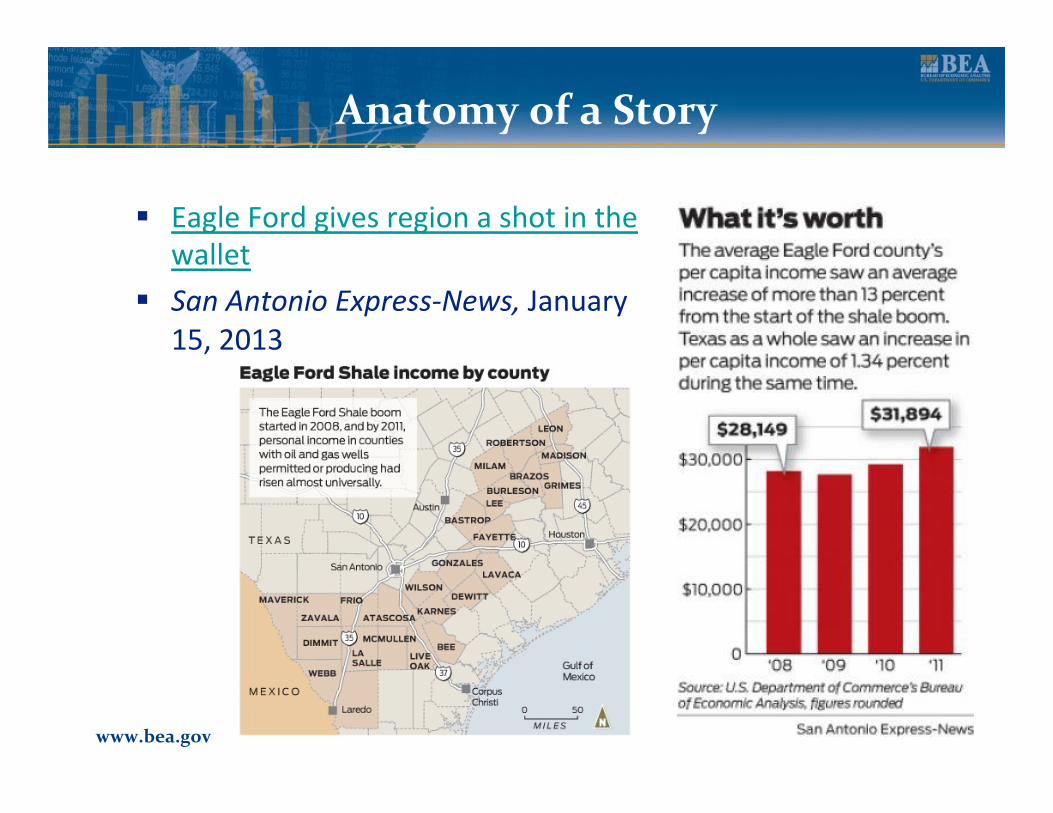
§ Eagle Ford gives region a shot in the wallet
§ San Antonio Express-‐News, January 15, 2013

www.bea.gov
Anatomy of a Story
§ The reporters used BEA data as the basis for the story but fleshed it out by talking to local experts and regular people.
§ The average county per-‐capita income in the Eagle Ford Shale region grew 13.62 percent between 2008 through 2011. Statewide, per-‐capita personal income grew 1.34 percent during that period.

www.bea.gov
Finding the Data
§ We’re going to walk you through how to find these data points.
www.bea.gov

www.bea.gov
Exercise 1
§ Now it’s your turn. Find percent change in per-‐capita personal income for your county for 2008-‐2011.
§ Here is the formula for percent change: Percent_Change = (Last_Year/First_Year) – 1
§ What does this figure tell us? § What can you compare it to? § What is your lead? § Who would you talk to next?

www.bea.gov
Anatomy of a Story
§ “Wealth Rises in America’s Heartland” USA Today, Nov. 27, 2012.
§ Here’s an example of how reporters can analyze BEA’s local economic data to produce a na=onal story.

www.bea.gov
Anatomy of a Story
§ USA Today analyzed BEA’s per-‐capita personal-‐income data for metro areas and for coun=es. (Note: USA Today adjusted BEA’s figures for infla=on.)
§ Bridgeport-‐Stamford, Conn., metro area had income of
$78,504 per person in 2011, the most affluent place in the country in the past decade, USA Today reported.
www.bea.gov
Finding the Data
§ We’re going to walk you through how to find these data points.
www.bea.gov

www.bea.gov
Anatomy of a Story
§ Houston tops list for fastest growth
§ Houston Chronicle, February 22, 2013
§ Based on the metro GDP report released in late February, the author spoke to a local expert to dig into the details of the local story.
§ Infla=on-‐adjusted gross domes=c product for Houston-‐Sugar Land-‐Baytown increased 3.7 percent in 2011.

www.bea.gov
Finding the Data
§ We’re going to walk you through how to find these data points.
www.bea.gov

www.bea.gov
Exercise 2
§ Now it’s your turn. Find overall real GDP growth for your metro area in 2011. Which industry grew fastest?
§ What do these sta=s=cs tell us? § What can you compare them to? § What is your lead? § Who would you talk to next?

www.bea.gov
23
Anatomy of a Story
§ “A Tricky Science,” Durango Herald, Oct. 7, 2012 § “The USA Pro Cycling
Challenge brought world media to Durango as well as thousands of spectators. But it’s unclear how much special events such as the bicycle race help the economy.”
– Durango Herald

www.bea.gov
Anatomy of a Story
§ Reporter dissects a regional economic-‐impact study. Turns to BEA’s User Guide on “RIMS II” Regional Input-‐Output Mul=pliers to help analyze and truth squad a study.
§ User Guide can be found at hBp://bea.gov/regional/rims/index.cfm
www.bea.gov
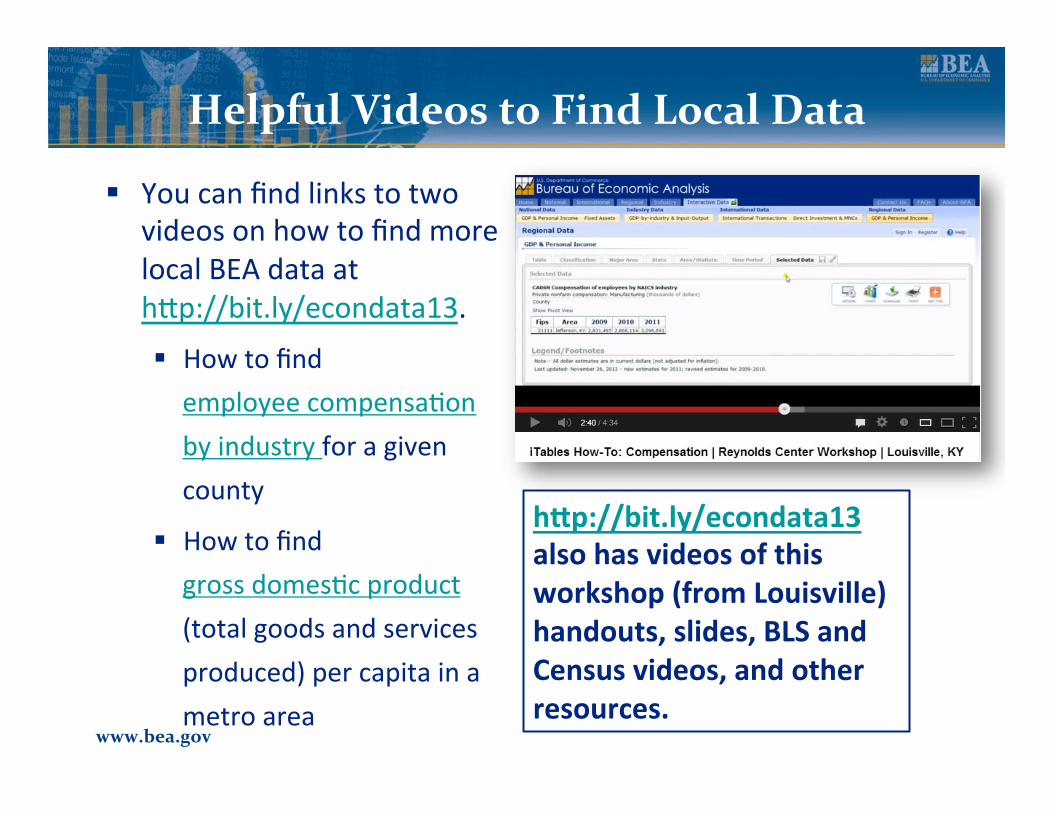
Helpful Videos to Find Local Data
§ You can find links to two videos on how to find more local BEA data at hBp://bit.ly/econdata13. § How to find employee compensa=on by industry for a given county
§ How to find gross domes=c product (total goods and services produced) per capita in a metro area
h"p://bit.ly/econdata13 also has videos of this workshop (from Louisville) handouts, slides, BLS and Census videos, and other resources.

www.bea.gov
Where to Find Us
§ BEA’s Media Line: 202-‐606-‐2649
§ Jeannine Aversa, chief of public affairs and outreach. [email protected]. 202-‐606-‐9327
§ Thomas Dail, public affairs specialist.
[email protected]. 202-‐606-‐9209