Miniaturized biosignature analysis reveals implications ... · Miniaturized biosignature analysis...
17
HAL Id: hal-00297947 https://hal.archives-ouvertes.fr/hal-00297947 Submitted on 28 Nov 2007 HAL is a multi-disciplinary open access archive for the deposit and dissemination of sci- entific research documents, whether they are pub- lished or not. The documents may come from teaching and research institutions in France or abroad, or from public or private research centers. L’archive ouverte pluridisciplinaire HAL, est destinée au dépôt et à la diffusion de documents scientifiques de niveau recherche, publiés ou non, émanant des établissements d’enseignement et de recherche français ou étrangers, des laboratoires publics ou privés. Miniaturized biosignature analysis reveals implications for the formation of cold seep carbonates at Hydrate Ridge (off Oregon, USA) T. Leefmann, J. Bauermeister, A. Kronz, V. Liebetrau, J. Reitner, V. Thiel To cite this version: T. Leefmann, J. Bauermeister, A. Kronz, V. Liebetrau, J. Reitner, et al.. Miniaturized biosignature analysis reveals implications for the formation of cold seep carbonates at Hydrate Ridge (off Oregon, USA). Biogeosciences Discussions, European Geosciences Union, 2007, 4 (6), pp.4443-4458. hal- 00297947
Transcript of Miniaturized biosignature analysis reveals implications ... · Miniaturized biosignature analysis...
HAL Id: hal-00297947https://hal.archives-ouvertes.fr/hal-00297947
Submitted on 28 Nov 2007
HAL is a multi-disciplinary open accessarchive for the deposit and dissemination of sci-entific research documents, whether they are pub-lished or not. The documents may come fromteaching and research institutions in France orabroad, or from public or private research centers.
L’archive ouverte pluridisciplinaire HAL, estdestinée au dépôt et à la diffusion de documentsscientifiques de niveau recherche, publiés ou non,émanant des établissements d’enseignement et derecherche français ou étrangers, des laboratoirespublics ou privés.
Miniaturized biosignature analysis reveals implicationsfor the formation of cold seep carbonates at Hydrate
Ridge (off Oregon, USA)T. Leefmann, J. Bauermeister, A. Kronz, V. Liebetrau, J. Reitner, V. Thiel
To cite this version:T. Leefmann, J. Bauermeister, A. Kronz, V. Liebetrau, J. Reitner, et al.. Miniaturized biosignatureanalysis reveals implications for the formation of cold seep carbonates at Hydrate Ridge (off Oregon,USA). Biogeosciences Discussions, European Geosciences Union, 2007, 4 (6), pp.4443-4458. �hal-00297947�
BGD
4, 4443–4458, 2007
Biosignature analysis
of cold seep
carbonates
T. Leefmann et al.
Title Page
Abstract Introduction
Conclusions References
Tables Figures
◭ ◮
◭ ◮
Back Close
Full Screen / Esc
Printer-friendly Version
Interactive Discussion
EGU
Biogeosciences Discuss., 4, 4443–4458, 2007
www.biogeosciences-discuss.net/4/4443/2007/
© Author(s) 2007. This work is licensed
under a Creative Commons License.
BiogeosciencesDiscussions
Biogeosciences Discussions is the access reviewed discussion forum of Biogeosciences
Miniaturized biosignature analysis reveals
implications for the formation of cold
seep carbonates at Hydrate Ridge
(off Oregon, USA)
T. Leefmann1, J. Bauermeister
1, A. Kronz
1, V. Liebetrau
2, J. Reitner
1, and
V. Thiel1
1Geoscience Centre (GZG), University of Gottingen, Gottingen, Germany
2Leibniz-Institut fur Meereswissenschaften (IfM-GEOMAR), Kiel, Germany
Received: 9 November 2007 – Accepted: 16 November 2007 – Published: 28 November 2007
Correspondence to: V. Thiel ([email protected])
4443
BGD
4, 4443–4458, 2007
Biosignature analysis
of cold seep
carbonates
T. Leefmann et al.
Title Page
Abstract Introduction
Conclusions References
Tables Figures
◭ ◮
◭ ◮
Back Close
Full Screen / Esc
Printer-friendly Version
Interactive Discussion
EGU
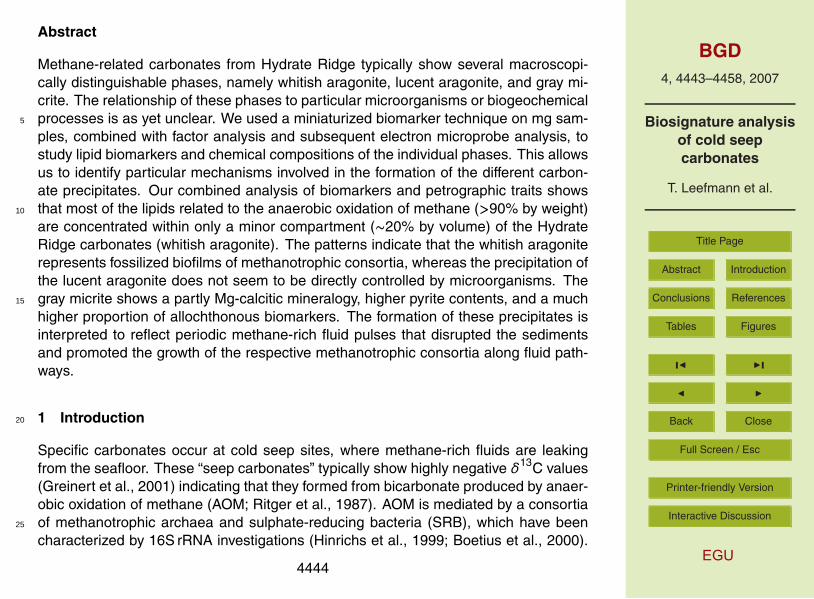
Abstract
Methane-related carbonates from Hydrate Ridge typically show several macroscopi-
cally distinguishable phases, namely whitish aragonite, lucent aragonite, and gray mi-
crite. The relationship of these phases to particular microorganisms or biogeochemical
processes is as yet unclear. We used a miniaturized biomarker technique on mg sam-5
ples, combined with factor analysis and subsequent electron microprobe analysis, to
study lipid biomarkers and chemical compositions of the individual phases. This allows
us to identify particular mechanisms involved in the formation of the different carbon-
ate precipitates. Our combined analysis of biomarkers and petrographic traits shows
that most of the lipids related to the anaerobic oxidation of methane (>90% by weight)10
are concentrated within only a minor compartment (∼20% by volume) of the Hydrate
Ridge carbonates (whitish aragonite). The patterns indicate that the whitish aragonite
represents fossilized biofilms of methanotrophic consortia, whereas the precipitation of
the lucent aragonite does not seem to be directly controlled by microorganisms. The
gray micrite shows a partly Mg-calcitic mineralogy, higher pyrite contents, and a much15
higher proportion of allochthonous biomarkers. The formation of these precipitates is
interpreted to reflect periodic methane-rich fluid pulses that disrupted the sediments
and promoted the growth of the respective methanotrophic consortia along fluid path-
ways.
1 Introduction20
Specific carbonates occur at cold seep sites, where methane-rich fluids are leaking
from the seafloor. These “seep carbonates” typically show highly negative δ13C values
(Greinert et al., 2001) indicating that they formed from bicarbonate produced by anaer-
obic oxidation of methane (AOM; Ritger et al., 1987). AOM is mediated by a consortia
of methanotrophic archaea and sulphate-reducing bacteria (SRB), which have been25
characterized by 16S rRNA investigations (Hinrichs et al., 1999; Boetius et al., 2000).
4444
BGD
4, 4443–4458, 2007
Biosignature analysis
of cold seep
carbonates
T. Leefmann et al.
Title Page
Abstract Introduction
Conclusions References
Tables Figures
◭ ◮
◭ ◮
Back Close
Full Screen / Esc
Printer-friendly Version
Interactive Discussion
EGU
Two major phylogenetic groups of methanotrophic archaea (ANME-1 and ANME-2,
ANME=anaerobic methane oxidizers) were distinguished. While ANME-2 archaea
have been observed in tight association with SRB of the Desulfosarcina/Desulfococcus
group, ANME-1 archaea sometimes occur with these SRB, but at other times are ob-
served as monospecific aggregations or isolated filaments (Orphan et al., 2002). In5
anoxic marine sediments, carbonate crusts, and recent microbial mats from cold seep
sites, methanotrophic consortia can be traced using specific, strongly13
C-depleted
biomarkers. Different species of methanotrophic archaea are considered to be the
sources of characteristic isoprenoids (Hinrichs et al., 1999; Elvert et al, 2005; Blumen-
berg et al., 2004; Pape et al., 2005). These isoprenoids include C20 and C25 irregular10
isoprenoid hydrocarbons (crocetane and 2,6,10,15,19-pentamethylicosane and unsat-
urated derivatives), the glycerol diethers archaeol and sn-2-hydroxyarchaeol (2,3-di-O-
phytanyl-sn-glycerol and 2-O-3-hydroxyphytanyl-3-O-phytanyl-sn-glycerol), and glyc-
erol dialkyl glycerol tetraethers (GDGT) carrying two C40 isopranyl moieties. Non-
isoprenoid monoalkylglycerolethers (MAGEs), 1,2-dialkylglycerolethers (DAGEs), and15
C14 to C18 n-, iso- and anteiso-fatty acids, and alcohols found at cold-seeps have
commonly been regarded as biomarkers for associated SRB (Pancost et al., 2001a;
Hinrichs et al., 2000).
The cold seep sites at Hydrate Ridge, located about 90 km off the coast of Ore-
gon (USA) at 600 m to 800 m water depth, have been extensively studied since the20
mid-1980s. Different seep carbonate lithologies have been the targets of several inves-
tigations (Kulm and Suess, 1990; Ritger et al., 1987; Bohrmann et al., 1998; Greinert
et al., 2001). Generally, authigenic carbonates from Hydrate Ridge consist primarily
of aragonite (Greinert et al., 2001). At SE-Knoll, an up to 90 m high chemoherm lo-
cated about 15 km SE from the southern summit of Hydrate Ridge (Bohrmann et al,25
2000), three major carbonate types are closely interfingered. These types consist of
(i) a macroscopically opaque, cryptocrystalline variety ranging in color from white to
pinkish and brownish, (ii) a translucent aragonite consisting of fibrous, acicular crys-
tals, and (iii) a gray, microcrystalline carbonate with varying content of Mg-calcite and
4445
BGD
4, 4443–4458, 2007
Biosignature analysis
of cold seep
carbonates
T. Leefmann et al.
Title Page
Abstract Introduction
Conclusions References
Tables Figures
◭ ◮
◭ ◮
Back Close
Full Screen / Esc
Printer-friendly Version
Interactive Discussion
EGU
various components, namely shell fragments, pellets containing pyrite, peloids and de-
trital quartz, and feldspar grains (Teichert et al., 2005).
In order to study the linkage of these phases to particular microorganisms and/or bio-
geochemical processes, we used a miniaturized biomarker technique, combined with
factor analysis, and subsequent electron microprobe analyses. The aim was to iden-5
tify differences in the lipid biomarker patterns and the chemical compositions between
the phases that would allow us to understand the mechanisms involved in forming the
particular carbonate precipitates.
2 Material and methods
Sample collection – The samples were obtained from a carbonate block collected dur-10
ing cruise SO165/2 of RV “Sonne” in August 2002. The block was gathered directly
from the top of the SE-Knoll chemoherm using a TV grab (Station 230-1, TVG-13,
44◦
27.04′
N, 125◦
01.80′
W, 615 m water depth). First U-Th isotope analyses of 5 sub-
samples from this core, using the MC-ICP-MS method after Fietzke et al. (2005),
imply distinct precipitation phases of cold-seep related carbonates between 205 and15
98 ka BP (unpublished).
Sample preparation – From a 28.5 cm (length) by 50 mm (diameter) core drilled from
sample TVG 13, 18 micro drill cores (<2 mm long, 2 mm in diameter, 6–21 mg in weight)
were taken using a diamond-studded hollow drill. Microscope observations allowed
us to classify the micro-drill cores into three distinct phases according to Teichert et20
al. (2005): (i) “whitish aragonite” (8 samples), (ii) “lucent aragonite” (6 samples), and (iii)
“gray micrite” (4 samples). The samples were pestled and extracted in screwed glass
vials using 200µL CH2Cl2 and ultrasonication (35 min; 60◦
C). After centrifuging, the
supernatant was decanted. The extraction was repeated twice. The combined extracts
were dried, and derivatized by adding 50µL N,O-bis (trimethylsilyl)trifluoroacetamide25
(BSTFA; 90 min; 80◦
C). The reaction mixtures were dried in a gentle stream of nitro-
gen, and redissolved in n-hexane. For each mg of the weighted carbonate sample,
4446
BGD
4, 4443–4458, 2007
Biosignature analysis
of cold seep
carbonates
T. Leefmann et al.
Title Page
Abstract Introduction
Conclusions References
Tables Figures
◭ ◮
◭ ◮
Back Close
Full Screen / Esc
Printer-friendly Version
Interactive Discussion
EGU
2µL of n-hexane were added. 1µL of each extract was analyzed in a coupled gas
chromatograph mass spectrometer (GC/MS).
GC/MS – The GC/MS system used was a Varian CP-3800 GC coupled to a Var-
ian 1200 quadrupole MS operated in electron impact mode at 70 eV. The samples
were injected on-column into a fused silica capillary column (Phenomenex ZB-1; 30 m;5
0.25 mm; 0.1µm film thickness). In the injector, the samples were heated from 50◦
C
(0.2 min isothermal) to 290◦
C at 150◦
C/min (5 min isothermal). The GC-oven was pro-
grammed from 50◦
C (1 min isothermal) to 300◦
C at 10◦
C/min, and was held at 300◦
C
for 15 min. Helium was used as the carrier gas at a flow rate of 1.4 mL. Compounds
were identified by comparison with published mass spectral data.10
Factor analysis – A factor analysis was implemented using Statistica 6.0, developed
by Statsoft Inc, Tulsa. The compound concentrations were treated as multivariate to
show correlations of the compounds with each other (biomarker families). Absolute
concentrations (in µg/g carbonate weighted samples) were used as base data. Fac-
tors were extracted by Principle Component Analyses (PCA). The maximum number15
of factors to be extracted was determined using the scree test (Cattel, 1966a). The
rotational strategy was varimax normalized (Kaiser, 1958, 1959).
Electron microprobe analysis – Polished thin sections (250µm thickness) were pre-
pared from sampled areas of the carbonate. Element distributions of Mg, S, Mn, Fe,
Sr, (wavelength dispersive system) and Ca (energy dispersive system) were mapped20
using a JEOL JXA 8900 RL electron microprobe. The acceleration voltage was set to
15 kV and a beam current of 40 nA, measured by Faraday cup, was used. The acqui-
sition time was set to 70 ms per step. The scan grid was spaced at 20 or 40µm steps,
depending on the dimension of each area, resulting in total dimensions between 7×5
and 10×20 mm. The backscatter signal in composition mode and the cathodolumines-25
cence signal (integrated spectral range from 200 to 900 nm) were acquired simulta-
neously. Since carbonates have sensitive behavior under electron bombardment, the
beam diameter was set to 20µm.
4447
BGD
4, 4443–4458, 2007
Biosignature analysis
of cold seep
carbonates
T. Leefmann et al.
Title Page
Abstract Introduction
Conclusions References
Tables Figures
◭ ◮
◭ ◮
Back Close
Full Screen / Esc
Printer-friendly Version
Interactive Discussion
EGU
3 Results
Biomarkers – The whitish aragonite samples showed the highest lipid biomarker con-
centrations, containing more than 90% of the total AOM-related lipid signature ob-
served (Table 1, Fig. 1). In all whitish aragonite samples (n=8), archaeol, sn-2-
hydroxyarchaeol and DAGEs were the most prominent lipid biomarkers (Table 1). In5
five out of eight samples, sn-2-hydroxyarchaeol was more abundant than archaeol. The
most abundant DAGE showed n-C14 and C17-cyclopropyl moieties at the sn-1 and sn-2
positions, respectively (DAGE IIa according to the designation given by Pancost et al.,
2001a). Another, somewhat less abundant, DAGE containing two anteiso-C15 alkyl
chains was observed in the whitish aragonite samples (DAGE If according to Pancost10
et al., 2001a). Other DAGEs occurred in trace concentrations. Furthermore, crocetane,
PMI, and phytanol occurred in all whitish aragonite samples, but with concentrations
about an order of magnitude lower than those of the ether lipids (Table 1).
Unlike the whitish aragonite, the lucent aragonite samples (n=6) contained only trace
amounts of lipid biomarkers (Table 1). n-alkanes (n-C23 to n-C31), n-fatty acids (n-C1415
to n-C18), squalene, and sterols, specifically cholesterol and sitosterol, dominate the
patterns. In two out of six samples, PMI was detected, whereas phytanol and sn-2-
hydroxyarchaeol were observed in only one sample each. Archaeol was found in three
samples, while crocetane and DAGEs were generally below the detection limit in the
lucent aragonite (Table 1).20
The gray micrite samples (n=4) were characterized by archaeol as the main com-
pound, although its absolute concentrations were an order of magnitude lower than in
the whitish aragonite (Table 1). Notably, sn-2-hydroxyarchaeol was completely absent
from the gray micrite, whereas smaller amounts of DAGEs, PMI, crocetane, sterols,
n-fatty acids, and trace-amounts of n-alkanes were evident. Average concentrations of25
sterols and n-fatty acids were even higher in the gray micrite than in the whitish arago-
nite, except for n-C18, which was similarly abundant in both phases. A specific trait of
the gray micrite was the occurrence of perylene, which was found in three of the four
4448
BGD
4, 4443–4458, 2007
Biosignature analysis
of cold seep
carbonates
T. Leefmann et al.
Title Page
Abstract Introduction
Conclusions References
Tables Figures
◭ ◮
◭ ◮
Back Close
Full Screen / Esc
Printer-friendly Version
Interactive Discussion
EGU
samples analyzed.
Factor analysis – The two factors extracted accounted for 44.9% and 24.6% of the
total variance. The factor loadings plot revealed a compound group consisting of PMI,
crocetane, DAGE IIa, DAGE If, archaeol, sn2-hydroxyarchaeol, and phytanol, which
has slightly negative loadings with factor 1 and highly positive loadings with factor 25
(Fig. 2). A second group of compounds that loads positive with factor 1 and slightly
negative with factor 2 included n-alkanes, n-fatty acids, and sterols. One compound,
n-tricosane (n-C23), plotted between the two compound groups.
Electron microprobe analyses – The electron microprobe data showed that the
whitish aragonite was considerably enriched in Sr compared to the lucent aragonite10
(Fig. 3h). Both aragonite phases nevertheless revealed higher Sr concentrations than
the gray micrite (Fig. 3f). Ca was somewhat more abundant in the lucent aragonite than
in the whitish aragonite and the gray micrite; Mn was not observed in any of the phases.
Fe, Mg, and S were detected in the gray micrite, but they were below detection limit
in the aragonites. In the gray micrite, distributions of Mg and Ca were anticorrelating15
(Fig. 3c, e). S and Fe, on the other hand, spatially correlated (Fig. 3b, d).
4 Discussion
The strong correlation between the concentrations of PMI, crocetane, DAGE IIa, DAGE
If, archaeol, and sn-2-hydroxyarchaeol suggests that these AOM-related biomarkers
originate from a closely associated biological source. Blumenberg et al. (2004) pro-20
posed high proportions of sn-2-hydroxyarchaeol vs. archaeol, and the presence of cro-
cetane, as traits to distinguish microbial consortia dominated by ANME-2 vs. ANME-1.
Concentrations of these compounds are highest in the whitish aragonite. Here, the
sn-2-hydroxyarchaeol/archaeol ratios range from 0.48 to 2.13 (Table 1). This spread
can be interpreted in terms of varying contributions of ANME-1 vs. ANME-2 archaea,25
respectively, which were both observed in sediments from Hydrate Ridge (Elvert et al.,
2005; Knittel et al., 2003). However, unlike archaeol, sn-2-hydroxyarchaeol is rarely
4449

BGD
4, 4443–4458, 2007
Biosignature analysis
of cold seep
carbonates
T. Leefmann et al.
Title Page
Abstract Introduction
Conclusions References
Tables Figures
◭ ◮
◭ ◮
Back Close
Full Screen / Esc
Printer-friendly Version
Interactive Discussion
EGU
present in the fossil record (Peckmann and Thiel, 2004), indicating its preferential di-
agenetic degradation, or even conversion to archaeol by dehydroxylation of the phytyl
moiety. Therefore, the ratios of sn-2-hydroxyarchaeol/archaeol of Hydrate Ridge ma-
terial must be interpreted cautiously, especially when comparing with data from recent
microbial consortia. As the studied carbonates are several ten thousand years old, the5
original abundance of sn-2-hydroxyarchaeol may have been considerably higher than it
is now. Furthermore, taking into account the prominent occurrence of crocetane found
exclusively in whitish aragonite samples (Table 1), we propose that ANME-2 archaea
were directly involved in forming this carbonate type.
High abundances of DAGEs with non-isoprenoid alkyl moieties have been assigned10
to the SRB present in the methanotrophic consortia (Pancost et al., 2001a), due to
their structural similarity to ether lipids of some deeply branching bacteria. Here, we
follow this commonly accepted interpretation. However, it should be pointed out that the
bacterial origin of DAGEs was recently challenged: Elvert et al. (2005) observed high
abundances of these compounds in sections of a Hydrate Ridge sediment core where15
ANME-1 dominated while the numbers of SRB-cells were markedly low. Although the
exact source organisms in these systems are as yet unclear, the high abundances of
DAGEs in the whitish aragonite and the strong correlation with archaeal isoprenoid
biomarkers clearly imply an origin from within the consortia involved in AOM.
The traces of lipid biomarkers in the lucent aragonite did not show any specific pat-20
tern (Fig. 1). Considering (i) the low sample amounts used, (ii) the low compound
concentrations, and (iii) the absence of a characteristic biomarker pattern, contami-
nation from the other carbonate phases during sample preparation is a conceivable
source for the lipids observed in the lucent aragonite samples. Thus, it seems unlikely
that there is direct involvement of particular AOM-related (and other) microorganisms25
in the precipitation of the lucent aragonite, as proposed for the whitish aragonite.
In the gray micrite, abundant Mg reflects a partly Mg-calcitic mineralogy, correspond-
ing to micrites described at another SE-Knoll location (Teichert et al., 2005). Fur-
thermore, the similarity of distributions of Fe and S in the gray micrite indicates likely
4450
BGD
4, 4443–4458, 2007
Biosignature analysis
of cold seep
carbonates
T. Leefmann et al.
Title Page
Abstract Introduction
Conclusions References
Tables Figures
◭ ◮
◭ ◮
Back Close
Full Screen / Esc
Printer-friendly Version
Interactive Discussion
EGU
pyrite occurrence in these carbonates (Fig. 3b, d; see also Teichert et al., 2005). The
gray micrite contained biomarker compounds from both compound clusters revealed
by factor analysis (Fig. 2). The presence of PMI, archaeol, and DAGEs, together with
the conspicuous absence of sn-2-hydroxyarchaeol and the very low amounts of cro-
cetane, suggests that ANME-1 archaea are involved in the formation of the gray mi-5
crite, rather than ANME-2 archaea. On the other hand, factor analysis suggests that
long-chain n-alkanes, conventional sterols (sitosterol, cholesterol), and n-fatty acids
represent water-column-sourced contributions rather than AOM-derived compounds.
In this context, it is interesting that the intermediate position of n-tricosane between
the two compound clusters (Fig. 2) corresponds with a dual, partly AOM-related origin10
of this hydrocarbon (Thiel et al., 2001). Perylene, which is thought to originate from
both terrestrial and aquatic organic matter during diagenesis (Silliman et al., 2000),
is presumably derived from allochthonous sources. These combined findings are in-
terpreted to reflect incorporation of allochthonous organic and inorganic matter during
AOM-induced carbonate precipitation resulting in the formation of the gray micrite.15
5 Conclusions
Combining miniaturized lipid biomarker analysis and electron microprobe analysis al-
lowed us to resolve biosignatures of a complex microbialite at the mm-scale, and al-
lowed us to develop a model for the origin of distinct carbonate phases. The results
showed a highly localized distribution of lipid biomarkers within the Hydrate Ridge car-20
bonates. More than 90% of the AOM-related lipid signature was concentrated in only
about 20% of the total carbonate rock volume, specifically in a whitish aragonite phase.
The biomarker and inorganic patterns of the whitish aragonite were highly specific and
indicated an association with methanotrophic consortia containing ANME-2 archaea
and sulfate-reducing bacteria. We suggest that the whitish aragonite formed during25
periodic methane-rich fluid pulses that disrupted the sediment and led to the growth
of the respective microorganisms along fluid pathways. By contrast, low amounts of
4451
BGD
4, 4443–4458, 2007
Biosignature analysis
of cold seep
carbonates
T. Leefmann et al.
Title Page
Abstract Introduction
Conclusions References
Tables Figures
◭ ◮
◭ ◮
Back Close
Full Screen / Esc
Printer-friendly Version
Interactive Discussion
EGU
lipid-biomarkers and lower Sr-contents observed in the lucent aragonite indicated that
the formation of this precipitate was not directly mediated by microorganisms, but rather
occurred during intermittent periods of low fluid supply. The gray micrite showed both
authigenic and allochthonous signals that likely originated from carbonate cementation
of allochthonous organic and inorganic matter caused by microbial anaerobic methan-5
otrophy during phases of low background methane supply.
Acknowledgements. We are grateful to P. Linke and C. Utecht (IFM-GEOMAR, The Leibniz In-
stitute of Marine Sciences at the University of Kiel), who coordinated the joint project COMET
(COntrols on METhane fluxes and their climatic relevance in marine gas hydrate-bearing sedi-
ments), and A. Eisenhauer (IFM-GEOMAR), chief scientist of RV “Sonne” cruise 165/2, which10
retrieved the carbonates studied here. We further wish to thank K. Simon (University of
Gottingen) for an introduction to factor analysis. This study was financially supported by the
German Ministry of Education and Research (BMBF) (Grant 03G0600D, COMET), and by the
Deutsche Forschungsgemeinschaft (Grant Th 713/3). This is publication no. GEOTECH–294
of the R and D-Programme GEOTECHNOLOGIEN.15
References
Blumenberg, M., Seifert, R., Reitner, J., Pape, T., and Michaelis, W.: Membrane lipid patterns
typify distinct anaerobic methanotrophic consortia, P. Natl. Acad. Sci. USA, 101, 11 111–
11 116, 2004.
Boetius, A., Ravenschlag, K., Schubert, C., Rickert, D., Widdel, F., Gieseke, A., Amann, R.,20
Jørgensen, B. B., Witte, U., and Pfannkuche, O.: A marine microbial consortium apparently
mediating anaerobic oxidation of methane, Nature, 407, 623–626, 2000.
Bohrmann, G., Linke, P., Suess, E., and Pfannkuche, O.: FS SONNE Cruise Report SO143,
GEOMAR Rep. 93, 243 pp., 2000.
Bohrmann, G., Greinert, J., Suess, E., and Torres, M.: Authigenic carbonates from the Casca-25
dia subduction zone and their relation to gas hydrate stability, Geology, 26, 647–650, 1998.
Cattell, R. B.: The scree test for the number of factors. Multivar. Behav. Res., 1, 245–276,
1966a.
4452
BGD
4, 4443–4458, 2007
Biosignature analysis
of cold seep
carbonates
T. Leefmann et al.
Title Page
Abstract Introduction
Conclusions References
Tables Figures
◭ ◮
◭ ◮
Back Close
Full Screen / Esc
Printer-friendly Version
Interactive Discussion
EGU
Elvert M., Hopmans, E. C., Treude, T., Boetius, A., and Suess, E.: Spatial variations of methan-
otrophic consortia at cold methane seeps: implications from a high-resolution molecular and
isotopic approach, Geobiology, 3, 195–209, 2005.
Fietzke, J., Liebetrau, V., Eisenhauer, A., and Dullo, C.: Determination of uranium isotope ratios
by multi-static MIC-ICP-MS: method and implementation for precise U- and Th-series isotope5
measurements, J. Anal. Atom. Spectrom., 20, 395–401, 2005.
Greinert, J., Bohrmann, G., and Suess, E.: Gas hydrate-associated carbonates and methane-
venting at Hydrate Ridge: classification, distribution, and origin of authigenic lithologies, in:
Natural Gas Hydrates: Occurrence, Distribution, and Detection, edited by: Paull, C. K. and
Dillon, W. P., American Geophysical Union, Washington, DC, USA, 99–113, 2001.10
Hinrichs, K.-U., Hayes, J. M., Sylva, S. P., Brewer, P. G., and DeLong, E. F.: Methane-
consuming archaebacteria in marine sediments, Nature, 398, 802–805, 1999.
Hinrichs, K.-U., Summons, R. E., Orphan, V., Sylva, S. P., and Hayes, J. M.: Molecular and
isotopic analyses of anaerobic methane-oxidizing communities in marine sediments, Org.
Geochem., 31, 1685–1701, 2000.15
Kaiser, H. F.: The varimax criterion for analytic rotation in factor analyses, Psychometrika, 23,
187–200, 1958.
Kaiser, H. F.: The application of electronic computers to factor analysis, Educ. Psychol. Meas.,
19, 141–151, 1959.
Knittel, K., Boetius, A., Lemke, A., Eilers, H., Lochte, K., Pfannkuche, O., Linke, P., and Amann,20
R.: Activity, distribution, and diversity of sulfate reducers and other bacteria in sediments
above gashydrate (Cascadia margin, Oregon), Geomicrobiol. J., 20, 269–294, 2003.
Kulm, L. D. and Suess, E.: Relationship between carbonate deposits and fluid venting: Oregon
accretionary prism, J. Geophys. Res., 95, 8899–8915, 1990.
Orphan, V. J., House, C. H., Hinrichs, K.-U., McKeegan, K. D., and DeLong, E. F.: Multiple25
archaeal goups mediate methane oxidation in anoxic cold seep sediments, P. Natl. Acad.
Sci. USA, 99, 7663–7668, 2002.
Pape T., Blumenberg M., Seifert R., Gulin S.B., Egorov V. N., and Michaelis W.: Lipid geo-
chemistry of methane-derived Black Sea carbonates, Palaeogeogr. Palaeocl., 227, 31–47,
2005.30
Pancost, R. D., Bouloubassi, I., Aloisi, G., Sinninghe Damste, J. S., and the Medinaut Ship-
board Scientific Party: Three series of non-isoprenoid dialkyl glycerol diethers in cold-seep
carbonate crusts, Org. Geochem., 32, 695–707, 2001a.
4453
BGD
4, 4443–4458, 2007
Biosignature analysis
of cold seep
carbonates
T. Leefmann et al.
Title Page
Abstract Introduction
Conclusions References
Tables Figures
◭ ◮
◭ ◮
Back Close
Full Screen / Esc
Printer-friendly Version
Interactive Discussion
EGU
Peckmann, J. and Thiel, V.: Carbon cycling at ancient methane-seeps, Chem. Geol., 205,
433–467, 2004.
Ritger, S., Carson, B., and Suess, E.: Methane-derived authigenic carbonates formed by
subduction-induced pore-water expulsion along the Oregon/Washington margin, Geol. Soc.
Am. Bull., 98, 147–156, 1987.5
Silliman, J. E., Meyers, P. A., Ostrom, P. H., Ostrom, N. E., and Eadie, B. J.: Insights into the
origin of perylene of sediments from Saanich Inlet, British Columbia, Org. Geochem., 31,
1133–1142, 2000.
Teichert, B. M. A., Bohrmann, G., and Suess, E.: Chemoherms on Hydrate Ridge – Unique
microbially-mediated carbonate build-ups growing into the water column, Palaeogeogr.10
Palaeocl., 227, 67–85, 2005.
Thiel, V., Peckmann, J., Schmale, O., Reitner, J., and Michaelis, W.: A new straight-chain
hydrocarbon biomarker associated with anaerobic methane cycling, Org. Geochem., 32,
1019–1023, 2001.
15
4454
BGD
4, 4443–4458, 2007
Biosignature analysis
of cold seep
carbonates
T. Leefmann et al.
Title Page
Abstract Introduction
Conclusions References
Tables Figures
◭ ◮
◭ ◮
Back Close
Full Screen / Esc
Printer-friendly Version
Interactive Discussion
EGU
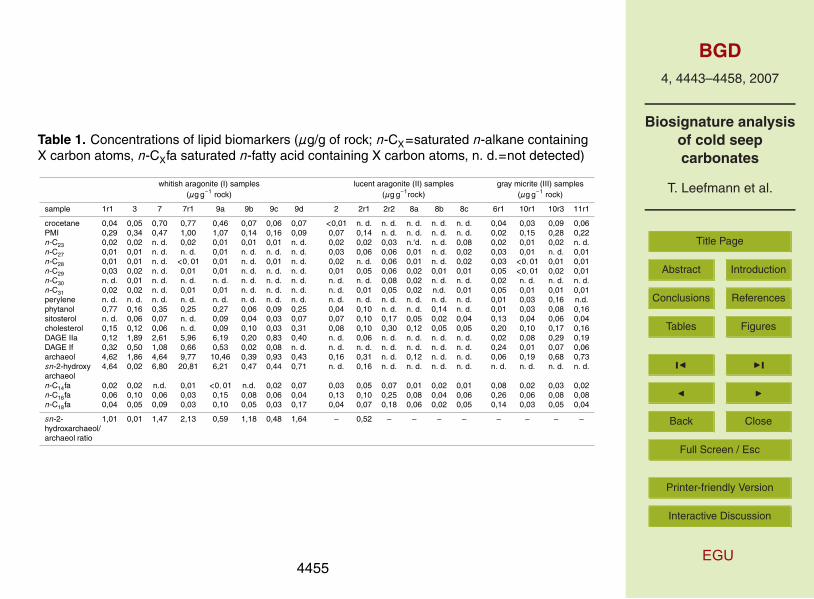
Table 1. Concentrations of lipid biomarkers (µg/g of rock; n-CX=saturated n-alkane containing
X carbon atoms, n-CXfa saturated n-fatty acid containing X carbon atoms, n. d.=not detected)
whitish aragonite (I) samples lucent aragonite (II) samples gray micrite (III) samples
(µg g−1
rock) (µg g−1
rock) (µg g−1
rock)
sample 1r1 3 7 7r1 9a 9b 9c 9d 2 2r1 2r2 8a 8b 8c 6r1 10r1 10r3 11r1
crocetane 0,04 0,05 0,70 0,77 0,46 0,07 0,06 0,07 <0,01 n. d. n. d. n. d. n. d. n. d. 0,04 0,03 0,09 0,06
PMI 0,29 0,34 0,47 1,00 1,07 0,14 0,16 0,09 0,07 0,14 n. d. n. d. n. d. n. d. 0,02 0,15 0,28 0,22
n-C23 0,02 0,02 n. d. 0,02 0,01 0,01 0,01 n. d. 0,02 0,02 0,03 n.‘d. n. d. 0,08 0,02 0,01 0,02 n. d.
n-C27 0,01 0,01 n. d. n. d. 0,01 n. d. n. d. n. d. 0,03 0,06 0,06 0,01 n. d. 0,02 0,03 0,01 n. d. 0,01
n-C28 0,01 0,01 n. d. <0,01 0,01 n. d. 0,01 n. d. 0,02 n. d. 0,06 0,01 n. d. 0,02 0,03 <0,01 0,01 0,01
n-C29 0,03 0,02 n. d. 0,01 0,01 n. d. n. d. n. d. 0,01 0,05 0,06 0,02 0,01 0,01 0,05 <0,01 0,02 0,01
n-C30 n. d. 0,01 n. d. n. d. n. d. n. d. n. d. n. d. n. d. n. d. 0,08 0,02 n. d. n. d. 0,02 n. d. n. d. n. d.
n-C31 0,02 0,02 n. d. 0,01 0,01 n. d. n. d. n. d. n. d. 0,01 0,05 0,02 n.d. 0,01 0,05 0,01 0,01 0,01
perylene n. d. n. d. n. d. n. d. n. d. n. d. n. d. n. d. n. d. n. d. n. d. n. d. n. d. n. d. 0,01 0,03 0,16 n.d.
phytanol 0,77 0,16 0,35 0,25 0,27 0,06 0,09 0,25 0,04 0,10 n. d. n. d. 0,14 n. d. 0,01 0,03 0,08 0,16
sitosterol n. d. 0,06 0,07 n. d. 0,09 0,04 0,03 0,07 0,07 0,10 0,17 0,05 0,02 0,04 0,13 0,04 0,06 0,04
cholesterol 0,15 0,12 0,06 n. d. 0,09 0,10 0,03 0,31 0,08 0,10 0,30 0,12 0,05 0,05 0,20 0,10 0,17 0,16
DAGE IIa 0,12 1,89 2,61 5,96 6,19 0,20 0,83 0,40 n. d. 0,06 n. d. n. d. n. d. n. d. 0,02 0,08 0,29 0,19
DAGE If 0,32 0,50 1,08 0,66 0,53 0,02 0,08 n. d. n. d. n. d. n. d. n. d. n. d. n. d. 0,24 0,01 0,07 0,06
archaeol 4,62 1,86 4,64 9,77 10,46 0,39 0,93 0,43 0,16 0,31 n. d. 0,12 n. d. n. d. 0,06 0,19 0,68 0,73
sn-2-hydroxy
archaeol
4,64 0,02 6,80 20,81 6,21 0,47 0,44 0,71 n. d. 0,16 n. d. n. d. n. d. n. d. n. d. n. d. n. d. n. d.
n-C14fa 0,02 0,02 n.d. 0,01 <0,01 n.d. 0,02 0,07 0,03 0,05 0,07 0,01 0,02 0,01 0,08 0,02 0,03 0,02
n-C16fa 0,06 0,10 0,06 0,03 0,15 0,08 0,06 0,04 0,13 0,10 0,25 0,08 0,04 0,06 0,26 0,06 0,08 0,08
n-C18fa 0,04 0,05 0,09 0,03 0,10 0,05 0,03 0,17 0,04 0,07 0,18 0,06 0,02 0,05 0,14 0,03 0,05 0,04
sn-2-
hydroxarchaeol/
archaeol ratio
1,01 0,01 1,47 2,13 0,59 1,18 0,48 1,64 – 0,52 – – – – – – – –
4455
BGD
4, 4443–4458, 2007
Biosignature analysis
of cold seep
carbonates
T. Leefmann et al.
Title Page
Abstract Introduction
Conclusions References
Tables Figures
◭ ◮
◭ ◮
Back Close
Full Screen / Esc
Printer-friendly Version
Interactive Discussion
EGU
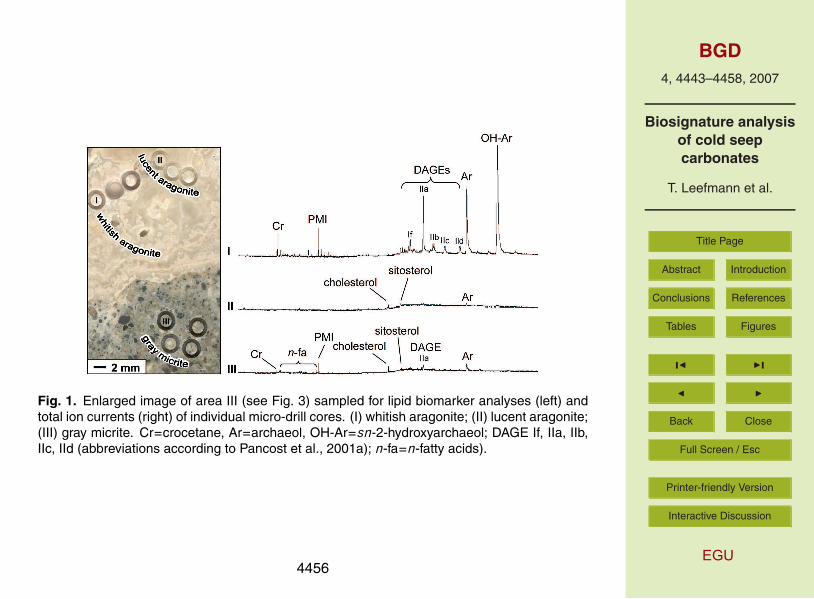
Fig. 1. Enlarged image of area III (see Fig. 3) sampled for lipid biomarker analyses (left) and
total ion currents (right) of individual micro-drill cores. (I) whitish aragonite; (II) lucent aragonite;
(III) gray micrite. Cr=crocetane, Ar=archaeol, OH-Ar=sn-2-hydroxyarchaeol; DAGE If, IIa, IIb,
IIc, IId (abbreviations according to Pancost et al., 2001a); n-fa=n-fatty acids).
4456

BGD
4, 4443–4458, 2007
Biosignature analysis
of cold seep
carbonates
T. Leefmann et al.
Title Page
Abstract Introduction
Conclusions References
Tables Figures
◭ ◮
◭ ◮
Back Close
Full Screen / Esc
Printer-friendly Version
Interactive Discussion
EGU
Fig. 2. Two-dimensional plot of compound factor loadings, showing two distinct groups of lipid
biomarkers (marked by gray ellipses) (n-CX=saturated n-alkane containing X carbon atoms,
n-CXfa=saturated n-fatty acid containing X carbon atoms).
4457
BGD
4, 4443–4458, 2007
Biosignature analysis
of cold seep
carbonates
T. Leefmann et al.
Title Page
Abstract Introduction
Conclusions References
Tables Figures
◭ ◮
◭ ◮
Back Close
Full Screen / Esc
Printer-friendly Version
Interactive Discussion
EGU
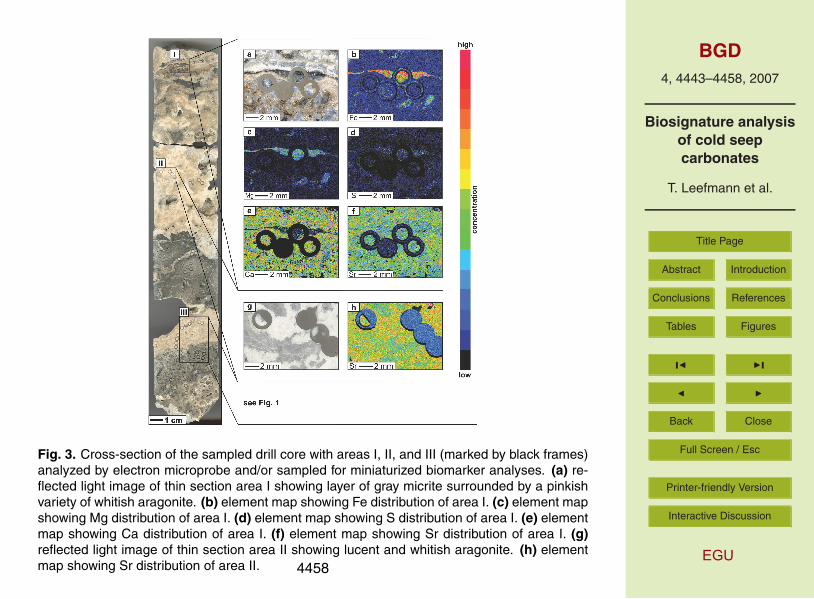
Fig. 3. Cross-section of the sampled drill core with areas I, II, and III (marked by black frames)
analyzed by electron microprobe and/or sampled for miniaturized biomarker analyses. (a) re-
flected light image of thin section area I showing layer of gray micrite surrounded by a pinkish
variety of whitish aragonite. (b) element map showing Fe distribution of area I. (c) element map
showing Mg distribution of area I. (d) element map showing S distribution of area I. (e) element
map showing Ca distribution of area I. (f) element map showing Sr distribution of area I. (g)
reflected light image of thin section area II showing lucent and whitish aragonite. (h) element
map showing Sr distribution of area II. 4458