Miniaturization of Liquid Chromatography: Why Do We Do It?Miniaturization of Liquid Chromatography:...
6
Miniaturization of Liquid Chromatography: Why Do We Do It? Evert-Jan Sneekes, Laurent Rieux, and Remco Swart Thermo Fisher Scientific, Amsterdam, The Netherlands White Paper 70814 Executive Summary Miniaturization of liquid chromatography (LC) is generally done to increase sensitivity, a necessity in proteomics to detect low abundant peptides and proteins. Other benefits of miniaturization include improving the efficiency of interfacing with mass spectrometry and reduction of solvent consumption. Nowadays, miniaturized LC is much easier to use and both the instrumentation and the connections are operated in the same way as conventional- scale LC systems. This opens up opportunities to apply miniaturized LC to novel workflows and applications, especially for capillary and micro LC. Introduction The development of miniaturized LC started approximately three decades ago, with the first commercial products appearing in 1987. Over time nano LC has established itself as an indispensable tool for bioanalytical research, especially in the field of proteomics, which requires the highest levels of sensitivity. However with the routine use of nano LC in proteomics laboratories, the principles behind the increase in sensitivity have sometimes been forgotten. Understanding these principles and their practical implications does allow foreseeing how miniaturized LC can benefit proteomics, bioanalysis, and beyond. Sensitivity – Size Matters In order to understand the increase in sensitivity from smaller inner diameter (i.d.) columns, the difference between sample concentration and sample amount must first be clear. It can be summarized as follows: • Sample injection in LC means a volume of a certain concentration is introduced – This is a fixed amount: e.g. 1 µL of 1 pmol/µL = 1 pmol • Upon injection, this amount is diluted in the LC volume – This creates a new concentration • A low volume LC will generate a higher concentration for the same injected amount – Smaller i.d. columns provide more sensitivity than large i.d. columns Figure 1 shows the same injected amount (four “peptides”) on a 4.6 mm and 75 µm i.d. column. The higher concentration in the latter is evident. The relative increase in sensitivity can be calculated using Equation 1. Keywords RSLCnano, Nano LC, Capillary LC, Micro LC, Mass spectrometry, nanoViper Figure 1. Different concentration in LC system for the same injected amounts. 4.6 mm 0.075 mm 2 ( ) ≈ 3800 Diameter standard column Diameter narrow column ( ) 2 Equation 1. Concentration Factor
Transcript of Miniaturization of Liquid Chromatography: Why Do We Do It?Miniaturization of Liquid Chromatography:...

Miniaturization of Liquid Chromatography: Why Do We Do It? Evert-Jan Sneekes, Laurent Rieux, and Remco SwartThermo Fisher Scientific, Amsterdam, The Netherlands
Wh
ite Pap
er 708
14
Executive Summary Miniaturization of liquid chromatography (LC) is generally done to increase sensitivity, a necessity in proteomics to detect low abundant peptides and proteins. Other benefits of miniaturization include improving the efficiency of interfacing with mass spectrometry and reduction of solvent consumption. Nowadays, miniaturized LC is much easier to use and both the instrumentation and the connections are operated in the same way as conventional-scale LC systems. This opens up opportunities to apply miniaturized LC to novel workflows and applications, especially for capillary and micro LC.
IntroductionThe development of miniaturized LC started approximately three decades ago, with the first commercial products appearing in 1987. Over time nano LC has established itself as an indispensable tool for bioanalytical research, especially in the field of proteomics, which requires the highest levels of sensitivity. However with the routine use of nano LC in proteomics laboratories, the principles behind the increase in sensitivity have sometimes been forgotten. Understanding these principles and their practical implications does allow foreseeing how miniaturized LC can benefit proteomics, bioanalysis, and beyond.
Sensitivity – Size MattersIn order to understand the increase in sensitivity from smaller inner diameter (i.d.) columns, the difference between sample concentration and sample amount must first be clear. It can be summarized as follows:
• Sample injection in LC means a volume of a certain concentration is introduced – This is a fixed amount: e.g. 1 µL of 1 pmol/µL = 1 pmol
• Upon injection, this amount is diluted in the LC volume – This creates a new concentration
• A low volume LC will generate a higher concentration for the same injected amount – Smaller i.d. columns provide more sensitivity than large i.d. columns
Figure 1 shows the same injected amount (four “peptides”) on a 4.6 mm and 75 µm i.d. column. The higher concentration in the latter is evident. The relative increase in sensitivity can be calculated using Equation 1.
KeywordsRSLCnano, Nano LC, Capillary LC, Micro LC, Mass spectrometry, nanoViper
Figure 1. Different concentration in LC system for the same injected amounts.
4.6 mm0.075 mm
2 ( ) ≈ 3800
Diameter standard columnDiameter narrow column( )
2
Equation 1. Concentration Factor
2 Optical detectors (e.g. UV detectors) and electrospray mass spectrometers are concentration sensitive. Their signal is directly proportional to the sample concentration in the peak eluting from the column.
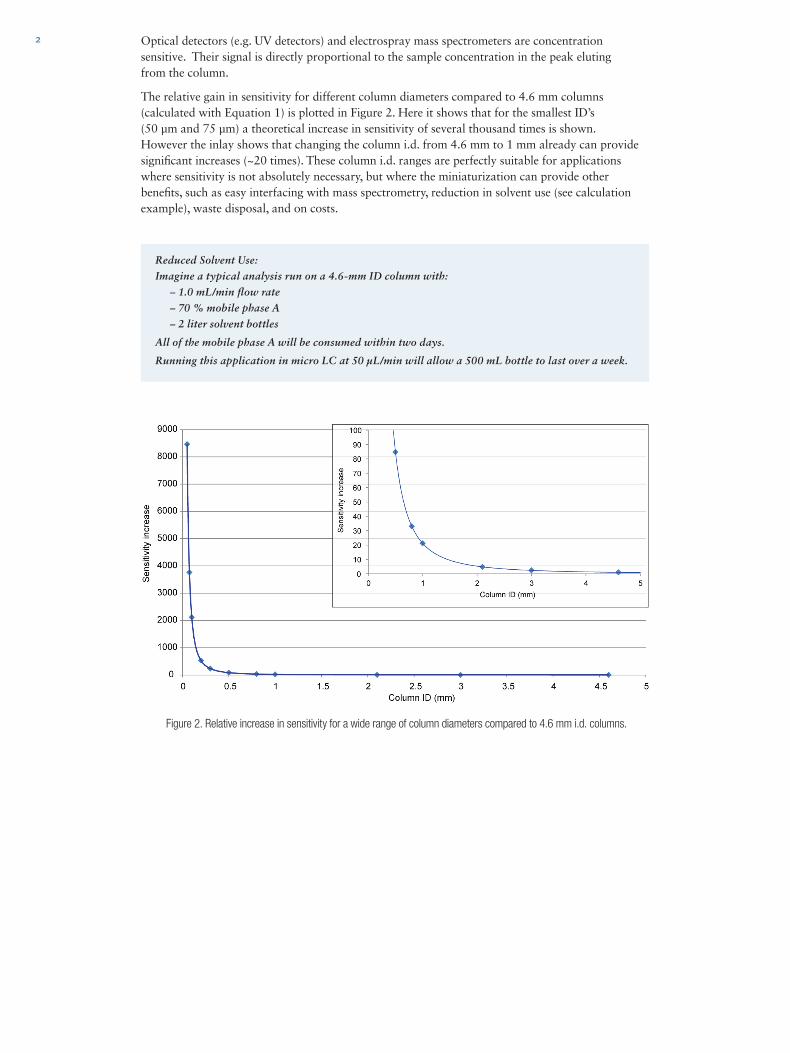
The relative gain in sensitivity for different column diameters compared to 4.6 mm columns (calculated with Equation 1) is plotted in Figure 2. Here it shows that for the smallest ID’s (50 µm and 75 µm) a theoretical increase in sensitivity of several thousand times is shown. However the inlay shows that changing the column i.d. from 4.6 mm to 1 mm already can provide significant increases (~20 times). These column i.d. ranges are perfectly suitable for applications where sensitivity is not absolutely necessary, but where the miniaturization can provide other benefits, such as easy interfacing with mass spectrometry, reduction in solvent use (see calculation example), waste disposal, and on costs.
Figure 2. Relative increase in sensitivity for a wide range of column diameters compared to 4.6 mm i.d. columns.
Reduced Solvent Use:
Imagine a typical analysis run on a 4.6-mm ID column with:
– 1.0 mL/min flow rate
– 70 % mobile phase A
– 2 liter solvent bottles
All of the mobile phase A will be consumed within two days.
Running this application in micro LC at 50 µL/min will allow a 500 mL bottle to last over a week.

3UHPLC Instrumentation for Nano, Capillary and Micro LC This calculated sensitivity increase is actually a scale factor between the conventional and miniaturized LC application, with flow rate as the best example. Typically, the flow rate in conventional LC (4.6 mm i.d.) is 1000–1200 µL/min and in nano LC (75 µm i.d.) 0.250–0.300 µL/min. The ratio of 4000 reflects the scale factor between a 4.6 mm i.d. and a nano LC column and will result in (approximately) the same linear velocity through both columns.
The Thermo Scientific™ Dionex™ UltiMate™ 3000 RSLCnano system (Figure 3) has been designed to deliver the very low flow rates and very high pressures required for modern nano LC. The UltiMate 3000 RSLCnano system can deliver flow rates as low as 20 nL/min* and up to 50 µL/min at UHPLC pressures, making it the perfect instrument for nano, capillary, as well as micro LC.1 The module has a built-in column compartment to support a range of applications, while minimizing the physical distance between the various LC elements. This allows connection tubing to be as short as possible.
Another important aspect to connection tubing is the inner diameter. The connection tubing in nano LC (20 µm) is roughly 10 times smaller in inner diameters. Usually in capillary and micro LC, 50 and 75 µm i.d. tubing is used, respectively.
The best results are obtained if the correct tubing is also properly connected. Thermo Scientific™ Dionex™ nanoViper™ fittings provide a factory-made, fingertight UHPLC connection, which is virtually dead-volume free. nanoViper fittings come integrated on the connection tubing and columns and allow for tool-free assembly, without the risks of introducing dead volume or breaking capillaries upon connection.
*Lowest flow rates are only available upon request
Figure 3. UltiMate 3000 RSLCnano system, interior view, and nanoViper fitting.

4 Miniaturized LC – Fields of ApplicationMiniaturized LC is often divided in three categories or flow rate ranges: nano, capillary, and micro LC. Nano LC refers to applications with flow rates below 1000 nL/min, capillary LC encompasses applications in the low µL/min flow rate range (1–10 µL/min), while micro LC covers the use of flow rates above 10 µL/min.
Examples of typical applications are shown next for each flow range. The first example and most common nano LC application is in proteomics discovery workflows. Here, sample limitation is the major reason for nano LC. In the second example, capillary LC is applied to the targeted quantification of peptides of a complex matrix. Sample availability might be higher, but throughput is essential. Capillary LC offers the best of both worlds. For the third example, micro LC is applied to increase throughput in the analysis of a monoclonal antibody (MAb) digest. Here sample availability is not the limiting factor, but the added sensitivity with robustness is of value. Lastly, an example outside of bioanalysis is provided.
In proteomics, researchers face a double challenge. The proteins of interest are present at low concentration and sample volumes are small, resulting in extremely low amounts. Additionally, samples are extremely complex. These factors led to the development of nano LC systems and columns with very high separation power enabling unique applications as shown in Figure 4. Köcher et. al. have performed a similar experiment, where they on average identified 2516 proteins in the tryptic HeLa digest using an 8 h gradient on a 50 cm column.2
Figure 4. High resolution separation of E.coli digest on a 75 µm i.d. × 50 cm nano LC column with a 10 hour gradient.
Rel
ativ
e A
bund
ance

5The next example is the capillary LC application in a targeted quantitative workflow. In this case, capillary LC was chosen to increase throughput, robustness, and ease-of-use, while retaining great sensitivity. A yeast digest spiked with isotopically-labeled peptides was separated on a 300 µm i.d. column. The sample was separated in 30 minutes using a 4 µL/min flow rate and coupled to a Thermo Scientific™ TSQ Vantage™ triple quadrupole mass spectrometer using the standard HESI-II interface. Detection was performed in SRM mode down to 10 amol (Figure 5). More details can be found in Thermo Scientific application note 583.3
10Time (min)
Rel
ativ
e A
bund
nace
100
0
RT: 15.18AA: 2266011
NL: 2.87E5
NL: 2.75E4
NL: 3.79E3
NL: 1.06E3
NL: 7.37E2
NL: 7.72E1Yeast matrixblank
0.01 fmol
0.1 fmol
1 fmol
10 fmol
100 fmol
11 15 17 1816141312 2019
RT: 15.15AA: 8768
RT: 15.16AA: 223785
RT: 15.14AA: 27169
RT: 15.18AA: 5565
100
0100
0100
0100
0100
0
Figure 5. Extracted chromatograms of the peptide SAAGAFGPELSR spiked into 500 ng of yeast-digest matrix at different concentration levels.
The following micro flow example is of particular relevance for high efficiency and high throughput peptide mapping applications in the biopharmaceutical industry. In this specific case, a MAb digest was first separated by a generic 30 minute gradient at 6 µL/min. In two consecutive steps the flow rate was raised to 15 µL/min, while the gradient was shortened simultaneously. Figure 6 shows how the analysis time could be reduced by a factor of 3 without compromising the data quality. Raising the flow in a similar fashion on a standard-bore LC column would probably complicate the interfacing with the mass spectrometer and require eluent replacement twice a day.
Figure 6. Speeding up the analysis of a Lys C MAb digest on a 300 µm i.d. × 15 cm Thermo Scientific™ Acclaim™ PepMap™ RSLC column.

Finland +358 9 3291 0200France +33 1 60 92 48 00Germany +49 6103 408 1014India +91 22 6742 9494Italy +39 02 950 591 Japan +81 6 6885 1213
Korea +82 2 3420 8600Netherlands +31 76 579 55 55Norway +46 8 556 468 00Singapore +65 6289 1190 Sweden +46 8 556 468 00 Switzerland +41 61 716 77 00
Taiwan +886 2 8751 6655UK/Ireland +44 1442 233555USA and Canada +847 295 7500
Finally, Xiang He et. al. demonstrate promising results for micro LC in areas, such as forensic toxicology. 4 A simple and highly sensitive method was developed to quantify cannabinoids in biological sample for forensic toxicological purposes. The method was similar in design and cycle time as the typically applied standard-bore application, but was much more sensitive, allowing the analysis of further diluted samples. This versatile workflow can be adopted for quantitation of other classes of common illicit/abused drugs by forensic toxicologists. It also significantly reduced the consumption of reagents by more than 90% and efforts in mass spectrometer maintenance
Conclusion Miniaturization of LC is often associated exclusively with the increased sensitivity offered by nano LC as required in proteomics studies. However, substantial gain in sensitivity can already be achieved in capillary and micro LC. Additionally, UHPLC capabilities are available over the entire flow range—from nano to conventional scale—greatly simplifying the scaling down of analyses, without compromising on capabilities.
While proteomics is still the main focus for nano LC, there is much potential in the biopharmaceu-tical and the forensic/toxicology applications. As mentioned, not only do users gain in sensitivity from using miniaturized LC, but MS interfacing as well as sample and solvent consumption, will also reduce drastically. This pays off in extended operation time or reduction of operational costs. Switching to capillary or micro LC could mean reaching the perfect balance of sensitivity and robustness, throughput, and ease-of-use.
So to come back to the title question: “Miniaturization of liquid chromatography; why do we do it?”, because there is a lot to gain!
References1. Rieux, L.; Sneekes, E-J.; Swart, R. Nano LC: Principles, Evolution, and State-of-the-Art of the
Technique. LCGC NA 2011, 29 (10), 926–934, [Online] http://www.chromatographyonline.com/lcgc/Column%3A+Innovations+in+HPLC/Nano-LC-Principles-Evolution-and-State-of-the-Art-/ArticleStandard/Article/detail/745381 (accessed August 7, 2013).
2. Köcher, T.; Swart, R.; Mechtler, K. Anal. Chem. 2011, 83, 2699–2704.
3. Kiyonami, R.; Swart, R; Zabrouskov, V.; Huhmer, A. Increased Robustness and Throughput forTargeted Protein Quantification Using Capillary Flow and a Conventional ESI Probe, ThermoScientific Application Note 583, [Online] http://www.thermoscientific.com/ecomm/servlet/techresource?resourceId=102334&storeId=11152&from=search# (accessed August 7, 2013).
4. He, X.; Kozak, M.; Nimkar, S. Anal. Chem. 2012, 84 (18), 7643–7647.
Wh
ite Pap
er 708
17
www.thermofisher.com/RSLCnano ©20136Thermo Fisher Scientific Inc. All rights reserved. All trademarks are the property of Thermo Fisher Scientific Inc. and its subsidiaries. This information is presented as an example of the capabilities of Thermo Fisher Scientific Inc. products. It is not intended to encourage use of these products in any manners that might infringe the intellectual property rights of others. Specifications, terms and pricing are subject to change. Not all products are available in all countries. Please consult your local sales representative for details.
Australia +61 3 9757 4486 Austria +43 810 282 206 Belgium +32 53 73 42 41 Brazil +55 11 3731 5140 China +852 2428 3282 Denmark +45 70 23 62 60WP70817_E 07/16S


![Magneto-DielectricSubstratesinAntenna Miniaturization: … · 2018-09-30 · arXiv:physics/0603116v1 [physics.class-ph] 15 Mar 2006 Magneto-DielectricSubstratesinAntenna Miniaturization:](https://static.fdocuments.net/doc/165x107/5e966d432d89866f0d4e39f6/magneto-dielectricsubstratesinantenna-miniaturization-2018-09-30-arxivphysics0603116v1.jpg)