Mini-Project 2: Piecewise-Defined Functions -...
11
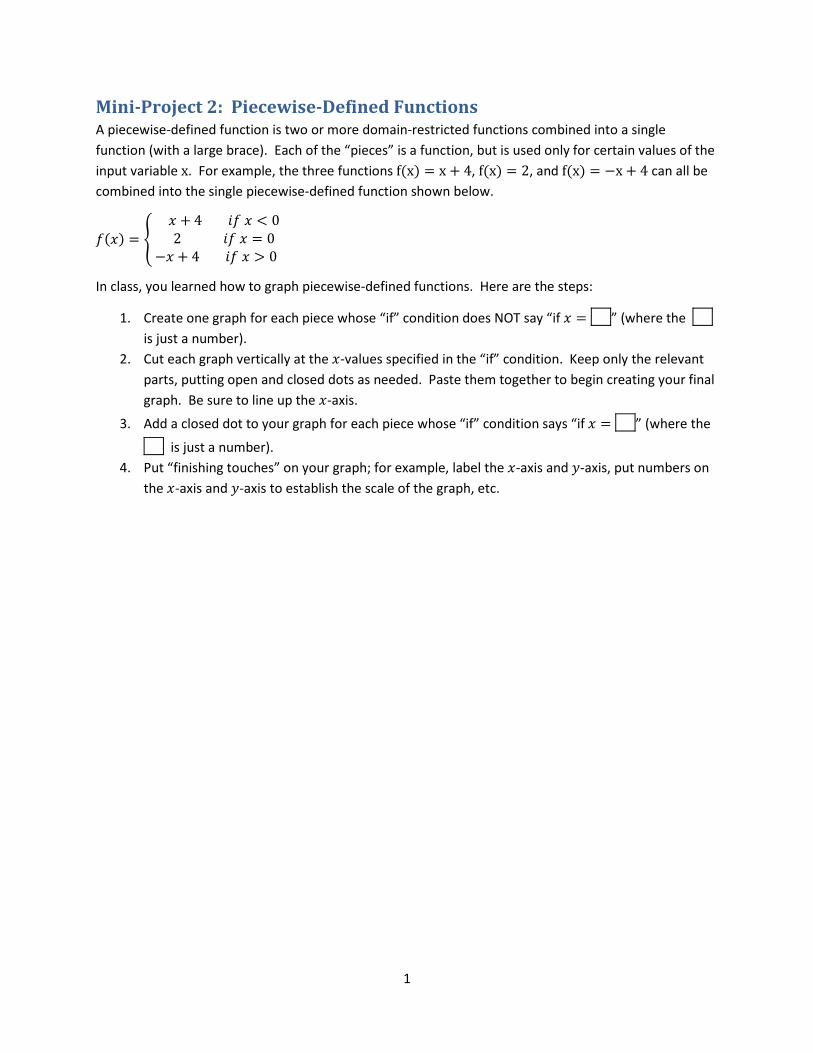
1 Mini-Project 2: Piecewise-Defined Functions A piecewise-defined function is two or more domain-restricted functions combined into a single function (with a large brace). Each of the “pieces” is a function, but is used only for certain values of the input variable x. For example, the three functions f(x) = x + 4, f(x) = 2, and f(x) = −x + 4 can all be combined into the single piecewise-defined function shown below. () = +4 < 0 2 = 0 − + 4 > 0 In class, you learned how to graph piecewise-defined functions. Here are the steps: 1. Create one graph for each piece whose “if” condition does NOT say “if = ” (where the is just a number). 2. Cut each graph vertically at the -values specified in the “if” condition. Keep only the relevant parts, putting open and closed dots as needed. Paste them together to begin creating your final graph. Be sure to line up the -axis. 3. Add a closed dot to your graph for each piece whose “if” condition says “if = ” (where the is just a number). 4. Put “finishing touches” on your graph; for example, label the -axis and -axis, put numbers on the -axis and -axis to establish the scale of the graph, etc.
Transcript of Mini-Project 2: Piecewise-Defined Functions -...
1
Mini-Project 2: Piecewise-Defined Functions A piecewise-defined function is two or more domain-restricted functions combined into a single
function (with a large brace). Each of the “pieces” is a function, but is used only for certain values of the
input variable x. For example, the three functions f(x) = x + 4, f(x) = 2, and f(x) = −x + 4 can all be
combined into the single piecewise-defined function shown below.
(�) = � � + 4 � � < 0 2 � � = 0−� + 4 � � > 0
In class, you learned how to graph piecewise-defined functions. Here are the steps:
1. Create one graph for each piece whose “if” condition does NOT say “if � = ” (where the
is just a number).
2. Cut each graph vertically at the �-values specified in the “if” condition. Keep only the relevant
parts, putting open and closed dots as needed. Paste them together to begin creating your final
graph. Be sure to line up the �-axis.
3. Add a closed dot to your graph for each piece whose “if” condition says “if � = ” (where the
is just a number).
4. Put “finishing touches” on your graph; for example, label the �-axis and �-axis, put numbers on
the �-axis and �-axis to establish the scale of the graph, etc.

2
For example, to graph the piecewise-defined function,…
(�) = �� � 4�� � 02�� � 0� � 4�� � 0
…start by graphing…
f�x� � x � 4, and f�x� � x � 4
…then cut them vertically at the value of x listed in the “if” condition.
0 0
Keep only the relevant parts (remember to place open and closed dots as appropriate) to get two
shaded graph pieces.
Paste them together (lining up the x-axis in each piece) to create the graph of the piecewise-defined
function.

3
Add the point �0,2� to this graph because the middle function states that when x � 0, f�x� � 2.
As a final touch, put arrows at the edges of the graph. The final graph is shown below.
Domain: �∞,∞� Range: �∞, 4� Continuous?: No

4
Notice that the first piece has an arrow where it hits the edge of the graph and an open dot at the cut
line. The middle piece produces just a single closed dot because it is only used for exactly one value of �. That value, � � 0, triggers the use of the middle function ��� � 2. And for any input, that function
produces an output of 2. (� � 2) Hence, the graph shows the single closed dot �0,2). The third piece
starts with an open dot at the cut line and has an arrow where it hits the edge of the graph.
Notice also that the open dots from pieces 1 and 3 are exactly the same point, and are therefore one
atop the other.
Expert Tip: When a closed dot and an open dot are in the same place, the closed dot “fills” the open dot
so that only the closed dot is visible.

5
Exercises
1. For the piecewise-defined function shown below, create its graph by cutting and pasting the graphs
provided at the end of this packet. (Be sure to follow all four steps described on page 1.) Then answer
the questions that follow.
��� � � −3� + 5 � 0 < � < 1 2 � � = 13� − 1 � � > 1
Using interval notation, what is the domain of ���?
Using interval notation, what is the range of ���?
Is ��� continuous on its domain?

6
2. For the piecewise-defined function shown below, create its graph by cutting and pasting the graph
provided at the end of this packet. (Be sure to follow all four steps described on page 1.) Then answer
the questions that follow.
���� � �� � � ≠ 0−2 � � = 0
Using interval notation, what is the domain of ����?
Using interval notation, what is the range of ����?
Is ���� continuous on its domain?

7
3. Consider the piecewise-defined function shown below. At the end of this packet, find the blank grids
for each of the three pieces. Create those graphs yourself by hand. Then create the graph of the
piecewise-defined function below by cutting and pasting the graphs you created. Answer the questions
that follow.
ℎ��� � � 3 � − 4 < � < −1|�| � − 1 ≤ � ≤ 4√� � 4 < � ≤ 16
Using interval notation, what is the domain of ℎ���?
Using interval notation, what is the range of ℎ���?
Is ℎ��� continuous on its domain?

8
4. Without cutting or pasting, graph the piecewise-defined function shown below by hand. Then,
answer the questions that follow.
��� � �√�! � 8 � � � 1�#� 1 � � � 1√�! �1 � � � 8
Using interval notation, what is the domain of ���?
Using interval notation, what is the range of ���?
Is ��� continuous on its domain?

9
Graphs to cut out and use when completing this mini-project appear below. Do not include these pages
when you submit your project.
��� � 3� � 5
��� � 3� 1

10
���� � �
ℎ��� � 3
(You draw the graph)

11
ℎ��� � |�| (You draw the graph)
ℎ��� � √�
(You draw the graph)