Mineral transformations and textural evolution during … · Mineral transformations and textural...
16
Mineral transformations and textural evolution during roasting of bog iron ores Grzegorz Rzepa 1 • Tomasz Bajda 1 • Adam Gawel 1 • Klaudia Debiec 2 • Lukasz Drewniak 2 Received: 28 January 2015 / Accepted: 2 July 2015 / Published online: 15 July 2015 Ó The Author(s) 2015. This article is published with open access at Springerlink.com Abstract The processes occurring during roasting of bog iron ores were characterized using TG–DTG–DTA–QMS, XRD, FTIR and specific surface analysis. Removal of physically adsorbed water is followed by dehydroxylation of iron oxyhydroxides and oxidation of organic matter at 200–600 °C. The main product of the transformations is disordered nanocrystalline (proto)hematite or hematite/- maghemite mixture, depending on organic matter content and heating conditions. The conversion of iron oxyhy- droxides to hematite occurs at temperatures different than those reported for pure compounds. At higher tempera- tures, protohematite undergoes recrystallization to the stoichiometric hematite, and manganese oxides are par- tially reduced. At 1000 °C, the roasting products consist of hematite and cristobalite together with Mn–Fe spinels if the initial ore contained Mn oxides. The admixtures of various secondary silicates were encountered as well. Low- to moderate-temperature roasting slightly affects the specific surface area and lowers volume of micropores. The high- temperature transformations lead to decrease in the specific surface area and to the destruction of porous texture of the bog iron ores. Although the general course of the processes during roasting was similar in all the samples, some of their details as well as mineralogy and properties of the products are highly dependent on the composition of the initial material. Keywords Iron (oxyhydr)oxides Ferrihydrite Goethite Hematite Surface properties Introduction Iron oxides and oxyhydroxides are important Fe carriers in the Earth’s crust, especially in near-surface environ- ments [1], and the only iron ores used at present. Their chemistry, crystal structure and surface properties cause that these minerals play major role in near-surface envi- ronments, strongly influencing, among others, (bio)geo- chemical cycling of many major and trace elements. Some of the (oxyhydr)oxides, particularly those containing water molecules and/or hydroxyl groups, are transformed at elevated temperatures. These include ferrihydrite (5Fe 2 O 3 9H 2 O or Fe 5 HO 8 4H 2 O), goethite (a-FeOOH), lepidocrocite (c-FeOOH), akagane ´ite [b-FeO(OH,Cl)], feroxyhite (d 0 -FeOOH) and schwertmannite [Fe 8 O 8 (OH) 6 (SO 4 )nH 2 O]. Some oxides, like maghemite (c-Fe 2 O 3 ), may be affected as well. In oxidizing condi- tions, the Fe(II)-containing compounds, like magnetite (Fe 3 O 4 ), can be easily oxidized, even (when being ultra- fine) at room temperature [1, 2]. Hematite (a-Fe 2 O 3 ) is usually the final product of such transformations. Although the overall course of the processes is widely known, the effects of various crystal-chemical and chemical factors on the transformation mechanisms and properties of the products are still under vigorous debate [1, 3]. This type of research focuses usually on monomineral synthetic samples [e.g., 4–10] and does not fully reflect the complexity of the processes during thermal transformations of natural & Grzegorz Rzepa [email protected] 1 Department of Mineralogy, Petrography and Geochemistry, Faculty of Geology, Geophysics and Environmental Protection, AGH University of Science and Technology, al. A. Mickiewicza 30, 30-059 Krakow, Poland 2 Laboratory of Environmental Pollution Analysis, Faculty of Biology, University of Warsaw, ul. Miecznikowa 1, 02-096 Warsaw, Poland 123 J Therm Anal Calorim (2016) 123:615–630 DOI 10.1007/s10973-015-4925-1
Transcript of Mineral transformations and textural evolution during … · Mineral transformations and textural...
Mineral transformations and textural evolution during roastingof bog iron ores
Grzegorz Rzepa1• Tomasz Bajda1
• Adam Gaweł1• Klaudia Debiec2
•
Lukasz Drewniak2
Received: 28 January 2015 / Accepted: 2 July 2015 / Published online: 15 July 2015
� The Author(s) 2015. This article is published with open access at Springerlink.com
Abstract The processes occurring during roasting of bog
iron ores were characterized using TG–DTG–DTA–QMS,
XRD, FTIR and specific surface analysis. Removal of
physically adsorbed water is followed by dehydroxylation
of iron oxyhydroxides and oxidation of organic matter at
200–600 �C. The main product of the transformations is
disordered nanocrystalline (proto)hematite or hematite/-
maghemite mixture, depending on organic matter content
and heating conditions. The conversion of iron oxyhy-
droxides to hematite occurs at temperatures different than
those reported for pure compounds. At higher tempera-
tures, protohematite undergoes recrystallization to the
stoichiometric hematite, and manganese oxides are par-
tially reduced. At 1000 �C, the roasting products consist of
hematite and cristobalite together with Mn–Fe spinels if the
initial ore contained Mn oxides. The admixtures of various
secondary silicates were encountered as well. Low- to
moderate-temperature roasting slightly affects the specific
surface area and lowers volume of micropores. The high-
temperature transformations lead to decrease in the specific
surface area and to the destruction of porous texture of the
bog iron ores. Although the general course of the processes
during roasting was similar in all the samples, some of their
details as well as mineralogy and properties of the products
are highly dependent on the composition of the initial
material.
Keywords Iron (oxyhydr)oxides � Ferrihydrite �Goethite � Hematite � Surface properties
Introduction
Iron oxides and oxyhydroxides are important Fe carriers
in the Earth’s crust, especially in near-surface environ-
ments [1], and the only iron ores used at present. Their
chemistry, crystal structure and surface properties cause
that these minerals play major role in near-surface envi-
ronments, strongly influencing, among others, (bio)geo-
chemical cycling of many major and trace elements. Some
of the (oxyhydr)oxides, particularly those containing
water molecules and/or hydroxyl groups, are transformed
at elevated temperatures. These include ferrihydrite
(5Fe2O3�9H2O or Fe5HO8�4H2O), goethite (a-FeOOH),
lepidocrocite (c-FeOOH), akaganeite [b-FeO(OH,Cl)],
feroxyhite (d0-FeOOH) and schwertmannite
[Fe8O8(OH)6(SO4)�nH2O]. Some oxides, like maghemite
(c-Fe2O3), may be affected as well. In oxidizing condi-
tions, the Fe(II)-containing compounds, like magnetite
(Fe3O4), can be easily oxidized, even (when being ultra-
fine) at room temperature [1, 2]. Hematite (a-Fe2O3) is
usually the final product of such transformations. Although
the overall course of the processes is widely known, the
effects of various crystal-chemical and chemical factors on
the transformation mechanisms and properties of the
products are still under vigorous debate [1, 3]. This type of
research focuses usually on monomineral synthetic samples
[e.g., 4–10] and does not fully reflect the complexity of the
processes during thermal transformations of natural
& Grzegorz Rzepa
1 Department of Mineralogy, Petrography and Geochemistry,
Faculty of Geology, Geophysics and Environmental
Protection, AGH University of Science and Technology, al.
A. Mickiewicza 30, 30-059 Krakow, Poland
2 Laboratory of Environmental Pollution Analysis, Faculty of
Biology, University of Warsaw, ul. Miecznikowa 1,
02-096 Warsaw, Poland
123
J Therm Anal Calorim (2016) 123:615–630
DOI 10.1007/s10973-015-4925-1

Fe-oxide-rich materials [e.g., 10–17], archeological findings
[18, 19] and composite industrial products or wastes [20–22].
A good example of such a complex system are bog iron ores.
Bog iron ores are Holocene terrestrial iron accumula-
tions occurring in wet, shallow depressions, several cen-
timeters below the land surface, within the zone of
groundwater oscillation [23–25]. Their occurrences were
reported in many regions of northern Europe, Asia and
North America [25–33]. In the past, bog iron ores were
used in iron metallurgy [24, 28, 34–36], as pigments
[24, 37] and even as building material [24, 38–40]. The
composition of bog iron ores combined with their porous
structure results in complex surface chemistry and large
specific surface areas. Therefore, these mineral raw mate-
rials have been used as sorbents for removing hydrogen
sulfide and hydrogen cyanide from flue gases and biogas
[41–45] and have also been recently investigated as heavy
metal sorbents [46, 47].
Bog iron ores can be divided into two main types: fine
(or ‘‘soft’’) ores, representing a loose deposit, and cemented
(lump or ‘‘hard’’) ores, resembling slag or ferruginous
sandstone in hand specimens [24, 25, 46]. The ores form
cryptocrystalline ‘‘limonite,’’ which consists predominately
of the iron oxyhydroxides: ferrihydrite, goethite, and
sometimes lepidocrocite. These are accompanied by vari-
able amounts of siliciclastic material (like quartz and
feldspars). Poorly crystalline hydrous manganese oxides,
mainly vernadite (MnO2�nH2O) type [24, 46], are also
encountered. Under reducing conditions and at elevated
content of organic matter, iron phosphates [predominately
vivianite, Fe3(PO4)2�8H2O] and carbonates (siderite,
FeCO3 and various Mn–Ca–Fe carbonates) can be formed
[24, 31, 37]. Pyrite (FeS2) was reported in some areas as
well [26, 27, 48, 49]. Although iron oxide, hematite
(Fe2O3), was occasionally encountered [23], it originated
from peat-bog fires or meadow burnings [24]. Magnetite
(Fe3O4) in turn may be a product of bacterial reduction
[23]. An important constituent of most bog iron ores is
also organic matter, exhibiting variable chemistry and
maturity [24].
Utilization of bog iron ores as natural mineral sorbents
meets an important problem of lacking simple correlation
between their (chemical and mineral) composition and
surface properties or sorption capacity [47]. Although the
uptake of heavy metals by the ores is controlled mainly by
iron oxyhydroxides, the processes are considerably modi-
fied by numerous ions (mainly silicate, phosphate and
organic anions) associated with the mineral surfaces. Also,
bog iron ores contain a significant amount of organic
matter—up to 15 mass% of organic carbon was reported in
some ‘‘fine’’ ores [24, 46]. The presence of organic matter
and other ‘‘active’’ substances, like manganese oxides,
causes further complications in the sorption mechanisms.
Both organic matter and manganese oxides are also capable
of binding various pollutants, such as trace metals, and
other inorganic and organic compounds. A complex
organic–mineral system is formed, which provides various
types of active centers that play role in sorption processes
[47]. Hence, a specific pollutant adsorption mechanism
depends strongly on mutual interactions of the components
of bog iron ore. In order to improve the sorption capacity
and also to enhance predictability of the influence of
mineral composition on the amount of bound metals, some
bog iron ore treatments were considered. The treatments
include the removal of organic matter which was consid-
ered as possibly blocking active sorption centers on the
surface of iron oxyhydroxides [50, 51]. The simplest way
to achieve the removal of organic matter is roasting the
material in oxidizing conditions. However, the method is
also the most invasive because it affects mineral compo-
sition, predominately due to dehydration and dehydroxy-
lation of iron oxyhydroxides, the most important sorption-
active constituents of bog iron ore.
The study is aimed at the evaluation of the impact of the
temperature conditions on thermal transformations in a
complex, mineral–organic system on the example of a bog
iron ore. As already mentioned, the alterations of the initial
compounds during heating of natural multi-component
materials proceed via much more intricate pathways than
those observed when pure, synthetic materials are
annealed. Therefore, thorough studies in this area are still
scarce, and detailed tracking of the thermal processes
taking place in the course of roasting bog iron ores may
shed more light on the problem. Also, recognition of the
properties of the resulting products should allow the
selection of proper temperature conditions of roasting to
achieve an expected improvement of bog iron ore sorption
properties. It might be helpful in estimating the tempera-
ture condition that affected natural ferruginous materials in
the past during intentional thermal treatment (e.g., when
used as mineral pigments or during pre-enrichment of ores
prior to metallurgical processes) or during natural thermal
events as fires of peat-bogs, moors, forests or meadows.
Experimental
Materials
Four samples of bog iron ores from deposits located in
Poland were selected for this study. The samples Debe Małe
(DM-f) and Kolechowice (KOL) represent fine ores, while
the samples Debe Małe (DM-l) and Grady Dolne (GD) are
lump ores. A brief mineralogical and chemical description of
the samples is summarized in Table 1. They consist pre-
dominately of poorly crystalline ferric oxyhydroxides
616 G. Rzepa et al.
123

(ferrihydrite and goethite) with variable admixture of sili-
ciclastic material (mainly quartz). High ratio of the oxalate-
to dithionite-extracted Fe indicates high proportion of fer-
rihydrite among Fe carriers [52, 53]. Manganese oxides
(vernadite) are important constituents of the GD sample,
while small amounts of (partly oxidized) vivianite and/or
amorphous iron phosphates are found in the remaining
samples. The organic matter is an important component of
the fine ores (DM-f and KOL), which is reflected by dis-
tinctly high total carbon concentrations (Table 1).
Analytical methods
The natural samples were characterized using X-ray
powder diffraction (XRD) and thermal analyses (DTA/
DTG/TG). Because thermal analyses were carried out in
dynamic mode (with constant heating rate), they results
could not be used to estimate the reaction temperatures.
Therefore, in order to obtain detailed data on the phase
transformations, the samples were heated in a muffle fur-
nace at the temperature conditions of 150, 200, 250, 300,
350, 400, 450, 500, 550, 600, 700, 800, 900 and 1000 �C(sample KOL) or 200, 300, 500, 700, 1000 �C (the rest of
the samples) for an hour. After cooling, the roasted sam-
ples were analyzed by XRD and by FTIR in the case of
KOL sample. Surface area and porosity of the natural and
preheated (at 200, 400, 700 and 1000 �C) KOL sample
were also measured.
X-ray diffraction patterns were collected using Rigaku
SmartLab instrument equipped with a graphite monochro-
mator, rotation Cu anode, 45 kV and 200 mA generator
settings, 2–75�2h recording range, 0.05� step size and
counting time of 1 s per step. Eliminating an influence of
instrumental parameters on peak intensities was achieved
by adjusting the primary beam value using plano-parallel
plate cut from the highly crystalline Brazilian quartz
specimen prior to each analysis. The XRD patterns were
processed with XRAYAN software using the diffraction
pattern database of the International Centre for Diffraction
Data [57]. X-ray diffractometry allowed to obtain qualita-
tive mineralogical data. However, quantitative Rietveld
analysis was not applied, because of high contents of
amorphous or nearly amorphous substances of both organic
and mineral types in the bog iron ores. Their presence
renders the quantitative analysis hardly reliable, and they
cannot be removed prior to measurements because they
represent the major components of the samples.
In order to support the results of XRD analyses, the
Fourier-transformed infrared (FTIR) spectra of the KOL
sample annealed at 150, 200, 250, 300, 350, 400, 500, 700,
Table 1 Chemical and mineralogical characteristics of the samples [47, 54]
Debe Małe
DM-f
Debe Małe
DM-l
Kolechowice
KOL
Grady Dolne
GD
SiO2 15.00 4.02 7.88 22.81
TiO2 0.09 0.02 0.02 0.11
MnO2 0.65 2.03 0.27 15.25
Al2O3 1.62 0.37 0.28 1.02
Fe2O3 39.16 63.18 47.93 43.72
FeO 0.17 0.40 0.49 0.08
CaO 2.91 2.87 2.63 1.72
MgO 0.20 2.51 0.08 0.27
Na2O 0.12 0.04 0.04 0.15
K2O 0.27 0.07 0.07 0.32
P2O5 5.59 7.68 3.11 2.87
H2O? 9.15 9.33 n.a. 7.34
LOI 23.82 6.55 35.60 4.02
BET/m2 g-1 99 242 152 154
FeDCB/mass% 27.41 41.57 31.93 28.85
FeOX/mass% 21.06 37.01 4.94 14.45
Ctot/mass% 11.30 2.74 8.75 1.17
Mineralogy Fh, Q, Gt, P, Mn Fh, Gt, Q, V, Mn Fh, Q, Gt, P Fh, Q, Gt, Mn
LOI, loss on ignition; H2O?, chemically bound water, analyzed by the Penfield method [55]; Ctot, total carbon; FeDCB, iron extracted by
dithionite-citrate-bicarbonate method [56]; FeOX, iron extracted in acid ammonium oxalate [52]; Fh, ferrihydrite; Gt, goethite; P, amorphous
phosphates; Mn, manganese oxides; V, vivianite (main phases underlined)
Mineral transformations and textural evolution during roasting of bog iron ores 617
123

800 and 1000 �C were collected in the range of
400–4000 cm-1. The spectra were obtained applying
Bruker Tensor 27 spectrometer. Prior to analysis, KBr
pellets were obtained by homogenizing 200 mg of ground
KBr with 4 mg of the sample.
Simultaneous thermogravimetric (TG) and differential
thermal analysis (DTA) measurements, below referred to
STA, were taken using Netzsch STA 449F3 Jupiter appa-
ratus. Fifty milligrams of an air-dried sample was heated
from 20 to 1000 �C in an alumina crucible, at 10 �C min-1
in flowing (40 mL min-1) synthetic air. In order to ensure
similar heat capacity and heat conductivity, hematite
obtained by annealing of synthetic 2-line ferrihydrite at
1000 �C was used as an inert (reference) material.
Applying of hematite involves an inconvenience consisting
in an additional exotherm appearing on DTA curves (dis-
cussed below). Nevertheless, the overall shape of the DTA
curve is substantially more legible than with Al2O3 used as
the reference. Analyses of the evolved gases were carried
out using quadrupole mass spectrometer—Netzsch QMS
403C Aeolos.
The porous texture properties (surface area and porosity)
of the natural and preheated KOL sample were evaluated
using Micrometrics ASAP 2020 instrument, by low-tem-
perature (at -196 �C) nitrogen adsorption and desorption
study, applying Brunauer–Emmet–Teller [58] isotherm.
Prior to analysis, the samples were outgassed at 90 �C for
12 h, i.e., under conditions preventing thermal transfor-
mation of poorly ordered iron oxyhydroxides [59, 60].
Results and discussion
Coupled STA–QMS analysis
The DTA–TG–DTG curves of all bog iron ores studied
show similar patterns (Fig. 1). The surface-adsorbed water
was removed at lower temperatures (\cca. 200 �C). The
dehydration was completed at temperatures from cca. 190–
195 �C (DM-f, KOL and GD samples) to cca. 210 �C(sample DM-l). In this temperature range, the lowest
mass loss was recorded in sample GD (*7 mass%), while
the rest of the samples exhibit slightly higher losses of
10–13 mass%. Such variability is related to the differences
in phase composition of the bog iron ores. Here, the most
effective humidity adsorbents are iron oxyhydroxides and
organic matter and the total content of these constituents is
the lowest in GD sample (Table 1). Another mass loss,
recorded above cca. 200 �C, is related to dehydration
and dehydroxylation of iron oxyhydroxides as well as
oxidation of organic matter, according to following sim-
plified reactions:
2FeOOH goethiteð Þ ! Fe2O3 þ H2O ð1Þ2Fe5HO8 � 4H2O ferrihydriteð Þ ! 5Fe2O3 þ 5H2O ð2ÞCH2O organic matterð Þ þ O2 ! CO2 þ H2O ð3Þ
In the case of GD sample, dehydration of manganese oxi-
des is also involved:
MnO2 � nH2O vernaditeð Þ ! MnO2 þ nH2O ð4Þ
QMS signals of H2O and CO2 (Fig. 1) indicate that
dehydration and dehydroxylation processes were initiated
at slightly lower temperatures than organic matter oxida-
tion. The bend of DTG curve, accompanying oxyhydrox-
ides dehydroxylation (which is evidenced by corresponding
QMS signal of H2O), has a minimum at 240–260 �C(Fig. 1). However, an endotherm related to this reaction is
visible on DTA curve only when heating is carried out in
inert (e.g., N2) atmosphere or when the sample was treated
with concentrated H2O2 prior to the measurements (data
not presented here). Otherwise, the endotherm is over-
lapped by a large exotherm of organic matter oxidation
with a maximum at 300–310 �C. It should be noted that the
latter peak is distinctly sharper for the fine bog iron ores
(DM-f and KOL) than for the lump bog iron ores (GD and
DM-l), which can be related to significantly higher content
of total carbon and thus of organic matter in fine ores
(Table 1). Also, organic matter is less matured in these
samples than in lump bog ores [54], and consequently, it is
oxidized in narrower temperature range. The mass losses
accompanying these reactions in the fine ores are sub-
stantially larger as well (ca. 14.5 mass% for DM-f and ca.
23.5 mass% for KOL in comparison with ca. 5.5 mass%
for GD and ca. 9 mass% for DM-l). At higher tempera-
tures, the bog iron ores loose additional 1–2 mass% which
is usually attributed to clay and/or carbonate admixtures,
but DTG curves are featureless. This loss may be also
related to gradual expelling of hydroxyls from non-stoi-
chiometric (proto)hematite (see the discussion below). In
the case of GD sample only, a small mass loss (1.0 mass%)
on DTG curve was recorded at 625–875 �C, which is
related to reduction of Mn4? to Mn3? in manganese oxides
and simultaneous O2 emanation [61, 62]:
2MnO2 ! Mn2O3 þ 1=2O2 ð5Þ
The subsequent partial reduction to Mn2? is also pos-
sible at higher (*900 �C) temperature [63, 64]:
3Mn2O3 ! 2Mn3O4 þ 1=2O2 ð6Þ
The mass loss related to this reaction is approximately
three times smaller than that related to the first reduction,
so it is virtually unrecognizable on the both DTA and DTG
curves, but an additional mass loss above 875 �C(*0.3 mass%) was recorded. Assuming 15.25 mass% of
618 G. Rzepa et al.
123
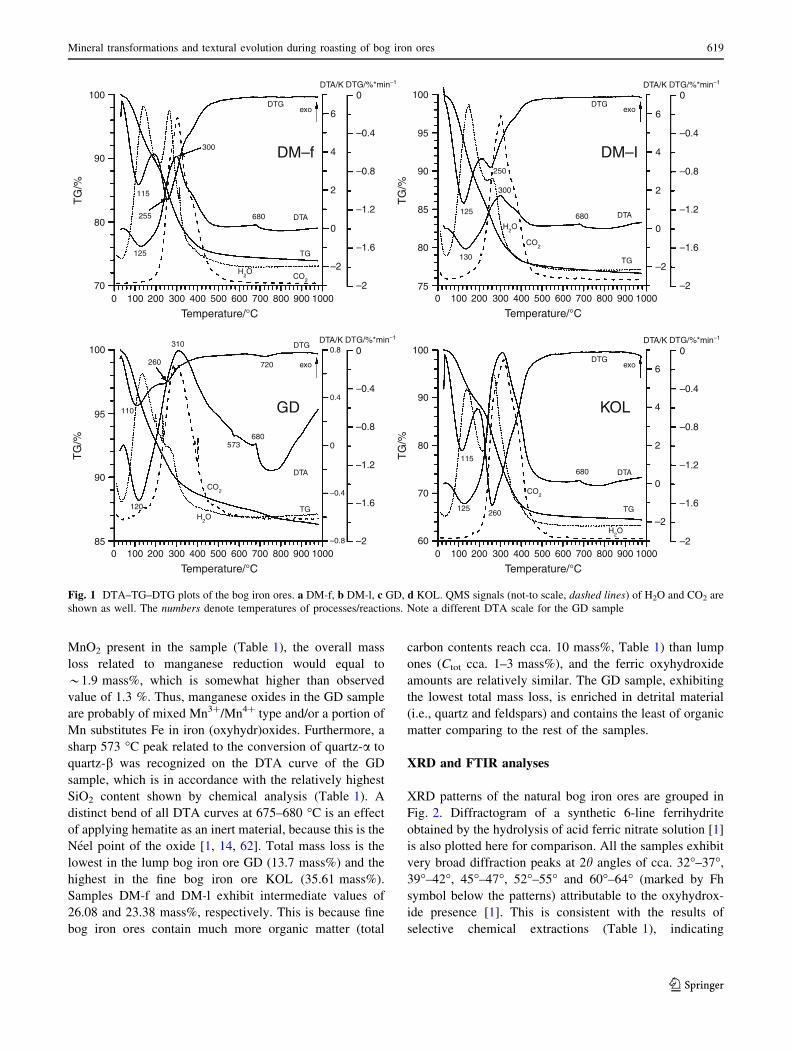
MnO2 present in the sample (Table 1), the overall mass
loss related to manganese reduction would equal to
*1.9 mass%, which is somewhat higher than observed
value of 1.3 %. Thus, manganese oxides in the GD sample
are probably of mixed Mn3?/Mn4? type and/or a portion of
Mn substitutes Fe in iron (oxyhydr)oxides. Furthermore, a
sharp 573 �C peak related to the conversion of quartz-a to
quartz-b was recognized on the DTA curve of the GD
sample, which is in accordance with the relatively highest
SiO2 content shown by chemical analysis (Table 1). A
distinct bend of all DTA curves at 675–680 �C is an effect
of applying hematite as an inert material, because this is the
Neel point of the oxide [1, 14, 62]. Total mass loss is the
lowest in the lump bog iron ore GD (13.7 mass%) and the
highest in the fine bog iron ore KOL (35.61 mass%).
Samples DM-f and DM-l exhibit intermediate values of
26.08 and 23.38 mass%, respectively. This is because fine
bog iron ores contain much more organic matter (total
carbon contents reach cca. 10 mass%, Table 1) than lump
ones (Ctot cca. 1–3 mass%), and the ferric oxyhydroxide
amounts are relatively similar. The GD sample, exhibiting
the lowest total mass loss, is enriched in detrital material
(i.e., quartz and feldspars) and contains the least of organic
matter comparing to the rest of the samples.
XRD and FTIR analyses
XRD patterns of the natural bog iron ores are grouped in
Fig. 2. Diffractogram of a synthetic 6-line ferrihydrite
obtained by the hydrolysis of acid ferric nitrate solution [1]
is also plotted here for comparison. All the samples exhibit
very broad diffraction peaks at 2h angles of cca. 32�–37�,39�–42�, 45�–47�, 52�–55� and 60�–64� (marked by Fh
symbol below the patterns) attributable to the oxyhydrox-
ide presence [1]. This is consistent with the results of
selective chemical extractions (Table 1), indicating
100
90
80
70
TG
/%
TG
/%T
G/%
TG
/%
0 100 200 300 400 500 600 700 800 900 1000
Temperature/°C0 100 200 300 400 500 600 700 800 900 1000
Temperature/°C
0 100 200 300 400 500 600 700 800 900 1000
Temperature/°C0 100 200 300 400 500 600 700 800 900 1000
Temperature/°C
6
4
2
0
–2
6
4
2
0
–2
6
4
2
0
–2
0
–0.4
–0.8
–1.2
–1.6
–2
0
–0.4
–0.8
–1.2
–1.6
–2
0
–0.4
–0.8
–1.2
–1.6
–2
0
–0.4
–0.8
–1.2
–1.6
–2
100
95
90
85
100
90
80
70
60
100
95
90
85
80
75
DTA/K DTG/%*min–1 DTA/K DTG/%*min–1
DTA/K DTG/%*min–1DTA/K DTG/%*min–1
DTGexo
DTGexo
DTGexoexo
DM–f DM–I
KOLGD
300
680 DTA
TG
CO2
H2O
H2O
CO2
CO2
H2O
H2O
125
255
115
250
300
125
130
680 DTA
TG
DTA
TG260125
115
680
CO2
DTA
TG
680
120
110
260
310 DTG
720
573
0.8
0.4
0
–0.4
–0.8
Fig. 1 DTA–TG–DTG plots of the bog iron ores. a DM-f, b DM-l, c GD, d KOL. QMS signals (not-to scale, dashed lines) of H2O and CO2 are
shown as well. The numbers denote temperatures of processes/reactions. Note a different DTA scale for the GD sample
Mineral transformations and textural evolution during roasting of bog iron ores 619
123

substantial ferrihydrite concentrations in the bog iron ores.
The ores contain poorly crystalline goethite as well, which
is accompanied by a series of the oxyhydroxide peaks
present in the XRD pattern of the KOL sample, and some
single peaks observed on the diffractograms of the other
samples. Siliciclastic detrital material, i.e., quartz and
feldspars, are also highlighted in the XRD patterns (Fig. 2).
The rest of the components listed in Table 1 were recog-
nized on the basis of an optical microscopy and scanning
electron microscopy observations (data not presented here
[24, 54]).
Infrared spectra of the natural and heated KOL sample
are presented in Fig. 3. Very broad band with the maxi-
mum at *450–470 cm-1, and a shoulder *680 cm-1,
visible at the spectra of unheated and annealed at 150 �Csample is typical for ferrihydrite [65, 66]. Distinct bands at
cca. 3385 and 1635 cm-1 are assigned to the stretching and
bending OH vibrations, respectively [67–69]. Another
strong band occurs at 1020 cm-1. Silicates and/or phos-
phates may absorb infrared radiation in this region [65],
and both these compounds are present in the sample
(Table 1). The band was noticed in the spectra of essen-
tially all bog iron ores [54]. A minor doublet at 780 and
800 cm-1 is diagnostic for small quartz admixture [65].
Goethite is poorly noticeable—apart from strong Fe–O
band at cca. 460 cm-1, shared with ferrihydrite, only two
shoulders at cca. 895–900 and 3200–3240 cm-1 are
10 20 30 40 50 60 70
2ΘCuKα
6L–Fh
DM–l
DM-f
KOL
GD
G
GQQ
Fh
Fh Fh Fh
FhFhFh
Fh
QQ Q
Q
Q QG
GG
G
Q
Q Q
Q
Q
GQ Q
F
Fh
FhFh Fh
Fh
Fh
Fh
G
GGG
G
G
GG G G
Q
Q
Q
Q
Q
QQQ
FG
G
Fig. 2 XRD patterns of the natural (non-roasted) bog iron ores and
synthetic 6-line ferrihydrite. Explanations: F feldspar, Fh ferrihydrite,
G goethite, Q quartz
4000 3500 3000 2500 2000 1500 1000 500
wavenumber/cm–1
abso
rban
ce/a
.u.
25°C
150°C
200°C
250°C
300°C
350°C
400°C
500°C
700°C
800°C
1000°C
33853240
1635
1635
1635
1635
1635
1635
1635
1635
1635
1635
1400
1400
1400
1400
1400
1400
1021
1021
1021
1021
1020
1018
1018
1022
1080
1087
1087
895
795
780
680
460
668
458
458537
457
457
457
457
457
457
457
537
537
535
537457
538
543
542
542575
3385
3385
3385
3386
3395
3397
3405
3420
3445
3460
895
3240
795
795
997
940
9701135
1201
Fig. 3 Background-corrected FTIR spectra of the natural (non-
roasted) and roasted KOL sample. The numbers denote position of
the absorption bands
620 G. Rzepa et al.
123

observed (Fig. 3). The shift of the latter from the reference
3140–3160 cm-1 position [1, 70] can be an effect of poor
crystallinity of the oxyhydroxide. Organic matter is
responsible for a broad band at cca. 1400 cm-1 [65]. A
doublet at 2360–2340 cm-1, as well as sharp peak at
668 cm-1, occurring in most of the spectra, is related to
antisymmetric stretching of the CO2 molecule [70] and is
not an inherent feature of the samples.
The first signs of phase transformations occur at the
temperature as low as 200 �C (Figs. 3–7). The FTIR
spectrum of KOL sample heated at 150 �C shows virtually
all the features of the unheated material, but at higher
temperatures, distinct changes are evident (Fig. 3). Inten-
sities of the bands related to OH vibrations (cca. 1635 and
3385 cm-1) as well as the intensity of the absorption band
at *1400 cm-1, related to organic matter, are gradually
reduced with the increasing temperature. At 200 �C,
diffraction peaks of goethite disappear partially (sample
DM-l, Fig. 5) or completely (KOL, GD and DM-f samples,
Figs. 4, 6, 7) and a broad 2.55 A ferrihydrite band is
changing its shape. Nanocrystalline hematite develops at
the same time, with some broad diffraction 110 (2.52 A),
104 (2.70 A), 300 (1.45 A) and 021 (3.69 A) peaks
(Table 2) already recognizable. These peaks are not
apparent in the XRD pattern of the GD sample (Fig. 6).
This is consistent with FTIR spectrum, where strong band
at 460 cm-1 is split into two peaks with the maxima at 540
10 20 30 40 50 60 70
2ΘCuKα
unheated
200°C
300°C
500°C
700°C
1000°C
G
GGG
GGG
Fh
Fh Fh Fh
Fh
FhQ Q
Q
Q
Q Q
Q
Q
Q
QQQ H
H
HH HM
MM
H
H
H
HH
H
H
H
H
HH
HH
MF
F
Q
Q
Q
QQQQ
Q
Q
Q
Q
Q
QQQ
F
H
H
HH
H
H
HH
H
HH
H
F
Q
Q
Q QQ
QC
C
C
C
H
HH
H
H
HH
H
HH
Fig. 4 XRD patterns of sample DM-f heated at different tempera-
tures. Explanations: C cristobalite-like phase, F feldspar, Fh ferrihy-
drite, G goethite, H hematite, M maghemite, Q quartz
10 20 30 40 50 60 70
2ΘCuKα
unheated
200°C
300°C
500°C
700°C
1000°C
GGQ
Q
Q
Fh
Fh Fh Fh
Fh
Fh Fh Fh
Fh
Fh Fh FhG
HH
H H H
H
H
H
H H H
HHHH
H
H
H
HH
HH
H
H
H
HQ
Q
C
C
C
C
Ol
Ol
H
H
H
H
H
HHH
H
H
H
Fig. 5 XRD patterns of sample DM-l heated at different tempera-
tures. Explanations: C cristobalite-like phase, F feldspar, Fh ferrihy-
drite, G goethite, H hematite, Ol olivine, Q quartz
Mineral transformations and textural evolution during roasting of bog iron ores 621
123

and 457 cm-1 (Fig. 3). These bands are attributed to the
stretching Fe–O vibrations in hematite [71]. Also, goethite-
related shoulders at *3240 and 895 cm-1 disappear at
200 �C. In the fine bog iron ores (KOL and DM-f)
roasted to 200 �C, an admixture of maghemite is also
marked in XRD patterns (Figs. 4, 7). It is understandable,
because maghemite is often recorded as a product of iron
oxyhydroxide heating in the presence of organic matter
[1, 11, 72, 73]. Disappearance of goethite at 200 �C,
however, is quite surprising, since such temperature is
several dozen of degrees lower than required for dehy-
droxylation [1, 74]. Only small changes in unit-cell
dimensions of synthetic goethite heated at 200 �C were
recorded in previous works [75], although goethite infrared
emission spectra were markedly disturbed during heating
to 175 �C [76]. The fade of the oxyhydroxide peaks can be
an effect of decomposition of nanometer-sized crystallites,
but decreasing crystallinity at the temperature just below
that of dehydroxylation and conversion to hematite is also
possible [77]. Ruan et al. [78] heated fine-crystalline syn-
thetic goethite at 180–270 �C and detected hematite at
200 �C with no goethite observed above 230 �C. More-
over, Walter et al. [79], on the basis of high-temperature
XRD analysis, found a clear correlation between goethite
particle size and transformation temperatures, and for very
small particles, this process took place at temperature as
low as 192 �C. According to Christensen et al. [8], the
conversion of nanocrystalline goethite into hematite could
start at even lower temperatures—they detected first signs
of transformation at 171 �C. Therefore, goethite decom-
position at relatively very low-temperature conditions
could be at least partially related to its very fine crys-
tallinity in bog iron ores. The other possible explanation of
the process is that, as already mentioned, the fine bog iron
ores contain significant amounts of the organic matter and
its oxidation provides additional heat (see DTA curves of
KOL and DM-f samples, Fig. 1), which may be sufficient
to increase the sample temperature above that required for
dehydroxylation. Although QMS signals of H2O and CO2
suggest that dehydroxylation precedes oxidation (Fig. 1), it
should be noted that thermal analyses were performed in
dynamic conditions (i.e., with constant heating rate) and
the XRD patterns were recorded for the samples roasted in
a furnace, thus in static conditions. Moreover, goethite
peaks at 200 �C are recognizable only on the diffractogram
of the DM-l sample, which initially contained the least of
the mineral (see Table 1, the highest FeOX/FeDCB ratio of
the sample indicates the lowest goethite to ferrihydrite
proportion), but—at the same time—which contained quite
low amount of the organic matter (Table 1; Fig. 1). For
comparison, the goethite is no more recognizable at 200 �Cin the XRD pattern of the KOL sample, which was origi-
nally rich in the oxyhydroxide (Fig. 2) and the organic
matter (Table 1; Fig. 1).
Transformation of ferrihydrite is an additional problem.
As already mentioned, a shape modification of a wide
diffraction band of the mineral is apparent, related to its
gradual conversion into hematite. However, the complete
transformation of ferrihydrite itself does not occur under
such low-temperature conditions. The exotherm related to
this process is usually noted at temperatures exceeding
300 �C [1] or, in case of the natural samples usually con-
taining silicate admixtures, even at higher temperatures
[10, 80–82]. Dry heating of ferrihydrite at 227 �C resulted
in evident changes of the XRD patterns recorded after 9 h
of the process when approximately one quarter of the
10 20 30 40 50 60 70
2ΘCuKα
unheated
200°C
300°C
500°C
700°C
1000°C
FhFh Fh Fh
FhFh
FhGQ Q
Q
Q
Q
Q
Q
Q
Q
Q
Q
Q
Q
Q
Q
Q
Q
F
F
F
H H
H
HH
H HH
H
H
H
H
H
H
H
Q
Q
Q
Q
Q
Q
Q
Q
Px
JC
J
C
JJ
JH
H
H
HH
HH
H
H
H
H
H
Fig. 6 XRD patterns of sample GD heated at different temperatures.
Explanations: C cristobalite-like phase, F feldspar, Fh ferrihydrite,
G goethite, H hematite, J jacobsite–iwakiite, Px pyroxene, Q quartz
cFig. 7 XRD patterns of sample KOL heated at different tempera-
tures. Explanations: C cristobalite-like phase, F feldspar, G goethite,
H hematite, M maghemite, Ol olivine, Q quartz
622 G. Rzepa et al.
123

10 20 30 40 50 60 70
2ΘCuKα
10 20 30 40 50 60 70
2ΘCuKα
unheated
200°C
250°C
300°C
350°C
400°C
450°C
500°C
550°C
600°C
700°C
800°C
900°C
G
1000°C
G
GG
G
GG
GGG
G
G
GFh
FhFhFh
Q
Q
Q
Q
QQQ
Q Q
Q
Q
Q
Q
Q
Q
F
H
H
H
H H
HH
HM
Fh
Fh
Fh
H
H
HM
M
Q
Q
Q
Q
Q
Q
Q
QH
H
H
HH
HH
H
M
H
HH
HH
HHHH
H
H
H
Q
QQ Q
Q
Q
Q
Q
Q
Q
Q
Q
Q
Q
Q
Q
Q
Q QQ
Q
F
F
H
H
HQ
HH
H H
H
HHHH
H
H
H
H
H
H
H H
HH
H
HH
H
H
H
HH
HH
H
H
H
Q
Q
Q Q
Q
Q
Q
Q
Q
Q
Q
F
F
Q Q
FQ
Q
Q Q
Q
HH
H
HH
HH
H
H
H
H
HH
H
HHHHH H
Q
Q
Q
Q
Q
QQQQ
Q
H
H
H
HQ
H
H
H
Q
HH
H
H
C
Q
Q
F Ol
H
H
H
H
F
Ol
H
Mineral transformations and textural evolution during roasting of bog iron ores 623
123

oxyhydroxide was converted to hematite [1, 83]. On the
other hand, even at temperatures much lower than 200 �C,
some changes in the composition and surface chemistry of
the oxyhydroxide may occur. Prolonged heating at
[100 �C causes ferrihydrite (6L) dehydration and reduc-
tion of the specific surface area [59, 83]. Under favorable
conditions, an intermediate phase between ferrihydrite and
hematite may form [84]. In the case of the bog iron ores,
given the relatively short (1 h) time of roasting, a partially
dehydrated ferrihydrite probably occurs at 200 �C. Ferri-
hydrite thermal reactions were not observed directly during
STA analysis because it is virtually impossible in such a
complex material as bog iron ore. The oxyhydroxide con-
tinuously loses water, and for this reason, dehydroxylation
endotherm is not visible [1]. Moreover, the exotherm
related to the transformation to hematite is located in the
temperature region in which organic matter is decomposed;
hence, the exotherm of organic matter oxidation is apparent
instead. In order to prevent organic matter oxidation,
thermal analysis could be carried out in an inert atmosphere
(e.g., in N2). However, in such conditions, the ferrihydrite
exotherm is usually absent [1]. In bog iron ores that exo-
therm was observed only in cases, in which, prior to the
analysis, samples had been treated with concentrated H2O2
in order to remove organic matter [54]. Such a treatment,
however, removes manganese oxides as well, and there-
fore, it was not applied in this work.
Goethite disappears in all the samples at temperatures of
300 �C (Figs. 4–7), which is consistent with literature data—
dehydroxylation endotherm of the oxyhydroxide usually
occurs between 250 and 300 �C [1, 3, 6, 14, 75, 85, 86].
The hematite 110, 104 and 116 peaks are distinct in the
XRD patterns, except the GD sample (Fig. 6). This may be
partly related to overlapping effect of quartz, although an
influence of high manganese content in the sample is fea-
sible as well. The majority of the manganese is bound in
Mn oxides; however, selective chemical extractions and
SEM–EDS analyses indicated that substantial amount of
the metal in the Mn-rich bog iron ores could be embedded
in the goethite structure [54]. The results of thermal anal-
yses indirectly support this possibility. Isomorphic substi-
tution of Mn for Fe in goethite complicates the progress of
dehydroxylation [3, 14, 87], which can cause the formation
of fully developed hematite at a temperature somewhat
higher than during transformation of pure (non-substituted)
goethite, despite the Mn-goethite itself starts to dehy-
droxylate at slightly lower temperature than the pure one.
There is no clear difference between XRD patterns of the
bog iron ores heated at 300 and 500 �C, except the GD
sample, where a broad 104 hematite peak appears at 500 �C(Fig. 6). The complete oxidation of organic matter is evi-
denced by disappearance of the absorption band at
1400 cm-1 in FTIR spectra collected after annealing bog
iron ore above 400 �C (Fig. 3). This is in a good agreement
with the results of thermal analysis. Interestingly, the
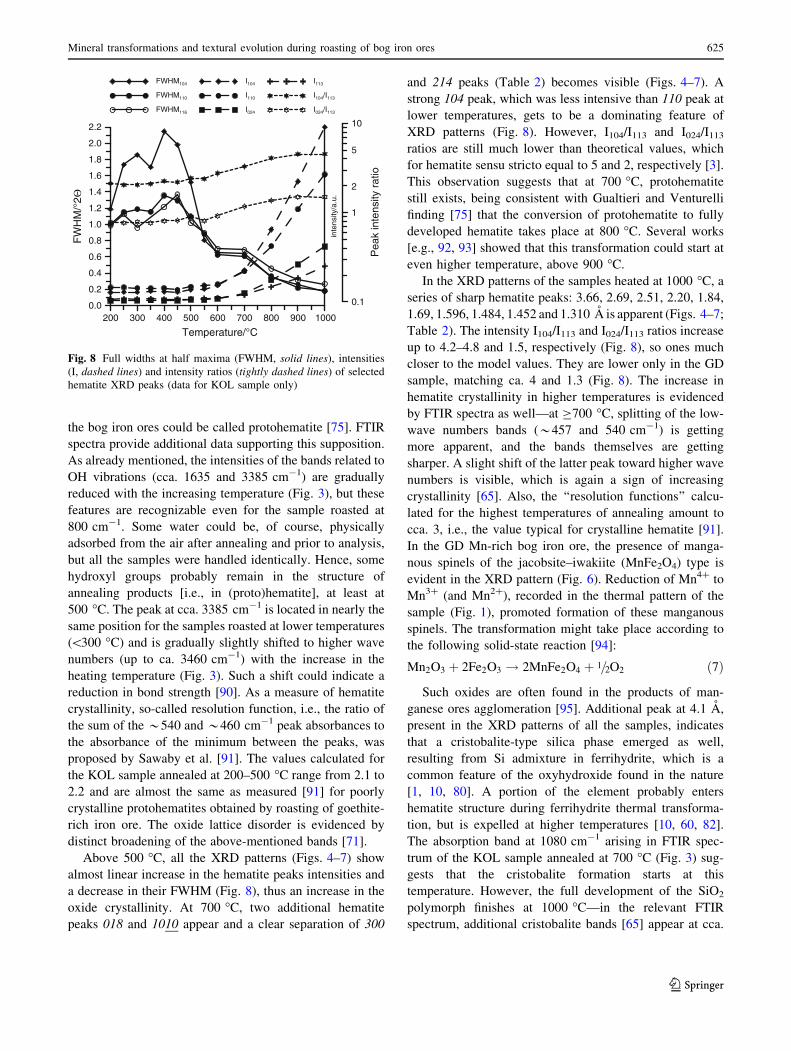
FWHM (full widths at half maxima) values of hematite
peaks measured for KOL sample slightly increase in the
range of 200–450 �C (Fig. 8), suggesting some decrease in
crystallinity and/or structural ordering of the oxide in this
temperature range. Moreover, the intensity ratios of both
104–113 and 024–113 peaks, very sensitive to the incor-
poration of hydroxyl groups in the hematite structure [3],
are very low (Fig. 8). This is consistent with a general
observation that in hematite formed by goethite dehydrox-
ylation, hydroxyls are trapped and the oxide can retain up to
half the stoichiometric water content of the parent oxyhy-
droxide, giving a formula Fe2-x-/3(OH)xO3-x [88, 89].
Therefore, the ‘‘hydrated’’ product of goethite conversion in
Table 2 Positions of main X-ray diffraction peaks (A) of ferrihydrite, goethite, hematite and maghemite
Ferrihydrite (29–712) Goethite (29–713) Hematite (15–534) Maghemite (25–1402)
d I hkl d I hkl d I hkl d I hkl
2.50 100 100 4.98 12 020 3.66 25 012 2.95 30 220
2.21 80 112 4.183 100 110 2.69 100 104 2.514 100 313
1.96 80 113 3.383 10 120 2.51 50 110 2.086 15 400
1.72 50 114 2.693 35 130 2.201 30 113 1.604 20 513
1.51 70 115 2.583 12 021 1.838 40 024 1.474 40 440
1.48 80 300 2.489 10 040 1.690 60 116
2.450 50 111 1.596 16 018
2.253 14 121 1.484 35 214
2.190 18 140 1.452 35 300
1.7192 20 221 1.310 20 1010
1.5637 10 151
Less-intense peaks (I\ 10) have been omitted. Numbers in brackets denote ICDD cards
624 G. Rzepa et al.
123
the bog iron ores could be called protohematite [75]. FTIR
spectra provide additional data supporting this supposition.
As already mentioned, the intensities of the bands related to
OH vibrations (cca. 1635 and 3385 cm-1) are gradually
reduced with the increasing temperature (Fig. 3), but these
features are recognizable even for the sample roasted at
800 cm-1. Some water could be, of course, physically
adsorbed from the air after annealing and prior to analysis,
but all the samples were handled identically. Hence, some
hydroxyl groups probably remain in the structure of
annealing products [i.e., in (proto)hematite], at least at
500 �C. The peak at cca. 3385 cm-1 is located in nearly the
same position for the samples roasted at lower temperatures
(\300 �C) and is gradually slightly shifted to higher wave
numbers (up to ca. 3460 cm-1) with the increase in the
heating temperature (Fig. 3). Such a shift could indicate a
reduction in bond strength [90]. As a measure of hematite
crystallinity, so-called resolution function, i.e., the ratio of
the sum of the *540 and *460 cm-1 peak absorbances to
the absorbance of the minimum between the peaks, was
proposed by Sawaby et al. [91]. The values calculated for
the KOL sample annealed at 200–500 �C range from 2.1 to
2.2 and are almost the same as measured [91] for poorly
crystalline protohematites obtained by roasting of goethite-
rich iron ore. The oxide lattice disorder is evidenced by
distinct broadening of the above-mentioned bands [71].
Above 500 �C, all the XRD patterns (Figs. 4–7) show
almost linear increase in the hematite peaks intensities and
a decrease in their FWHM (Fig. 8), thus an increase in the
oxide crystallinity. At 700 �C, two additional hematite
peaks 018 and 1010 appear and a clear separation of 300
and 214 peaks (Table 2) becomes visible (Figs. 4–7). A
strong 104 peak, which was less intensive than 110 peak at
lower temperatures, gets to be a dominating feature of
XRD patterns (Fig. 8). However, I104/I113 and I024/I113
ratios are still much lower than theoretical values, which
for hematite sensu stricto equal to 5 and 2, respectively [3].
This observation suggests that at 700 �C, protohematite
still exists, being consistent with Gualtieri and Venturelli
finding [75] that the conversion of protohematite to fully
developed hematite takes place at 800 �C. Several works
[e.g., 92, 93] showed that this transformation could start at
even higher temperature, above 900 �C.
In the XRD patterns of the samples heated at 1000 �C, a
series of sharp hematite peaks: 3.66, 2.69, 2.51, 2.20, 1.84,
1.69, 1.596, 1.484, 1.452 and 1.310 A is apparent (Figs. 4–7;
Table 2). The intensity I104/I113 and I024/I113 ratios increase
up to 4.2–4.8 and 1.5, respectively (Fig. 8), so ones much
closer to the model values. They are lower only in the GD
sample, matching ca. 4 and 1.3 (Fig. 8). The increase in
hematite crystallinity in higher temperatures is evidenced
by FTIR spectra as well—at C700 �C, splitting of the low-
wave numbers bands (*457 and 540 cm-1) is getting
more apparent, and the bands themselves are getting
sharper. A slight shift of the latter peak toward higher wave
numbers is visible, which is again a sign of increasing
crystallinity [65]. Also, the ‘‘resolution functions’’ calcu-
lated for the highest temperatures of annealing amount to
cca. 3, i.e., the value typical for crystalline hematite [91].
In the GD Mn-rich bog iron ore, the presence of manga-
nous spinels of the jacobsite–iwakiite (MnFe2O4) type is
evident in the XRD pattern (Fig. 6). Reduction of Mn4? to
Mn3? (and Mn2?), recorded in the thermal pattern of the
sample (Fig. 1), promoted formation of these manganous
spinels. The transformation might take place according to
the following solid-state reaction [94]:
Mn2O3 þ 2Fe2O3 ! 2MnFe2O4 þ 1=2O2 ð7Þ
Such oxides are often found in the products of man-
ganese ores agglomeration [95]. Additional peak at 4.1 A,
present in the XRD patterns of all the samples, indicates
that a cristobalite-type silica phase emerged as well,
resulting from Si admixture in ferrihydrite, which is a
common feature of the oxyhydroxide found in the nature
[1, 10, 80]. A portion of the element probably enters
hematite structure during ferrihydrite thermal transforma-
tion, but is expelled at higher temperatures [10, 60, 82].
The absorption band at 1080 cm-1 arising in FTIR spec-
trum of the KOL sample annealed at 700 �C (Fig. 3) sug-
gests that the cristobalite formation starts at this
temperature. However, the full development of the SiO2
polymorph finishes at 1000 �C—in the relevant FTIR
spectrum, additional cristobalite bands [65] appear at cca.
200 300 400 500 600 700 800 900 1000
Temperature/°C
0.0
0.2
0.4
0.6
0.8
1.0
1.2
1.4
1.6
1.8
2.0
2.2
FW
HM
/°2Θ
inte
nsity
/a.u
.
0.1
1
10
Pea
k in
tens
ity r
atio
FWHM104
FWHM110
FWHM116
I104
I110
I024
I113
I104/I113
I024/I113
2
5
Fig. 8 Full widths at half maxima (FWHM, solid lines), intensities
(I, dashed lines) and intensity ratios (tightly dashed lines) of selected
hematite XRD peaks (data for KOL sample only)
Mineral transformations and textural evolution during roasting of bog iron ores 625
123

1200 (shoulder), 1140 (shoulder) and 795 cm-1 (Fig. 3).
The presence of cristobalite was recently reported in heated
ferruginous (goethite, schwertmannite and ferrihydrite)
AMD precipitates, but it was interpreted as related to
amorphous silica content in untreated sample [16]. This is
hardly the case of bog iron ores, although electron micro-
scopic observations showed traces of opal-type silica in
some samples (but not in these four samples studied here).
The majority of non-siliciclastic Si is bound in ferrihydrite
which is evidenced by [54]: (1) the results of selective
chemical extractions (in acid ammonium oxalate extracts,
Si was present and the reagent dissolves ferrihydrite but
does not dissolve amorphous silica), (2) the results of EDS
analyses of ferrihydrite aggregates (all these aggregates
contained significant amounts of Si) and (3) FTIR spectra,
which did not reveal the presence of amorphous silica in
unheated KOL sample (Fig. 3).
Diffractograms of the samples DM-f and KOL reveal
small peaks at 2.86 and 2.64 A, suggesting that at 1000 �C,
ferrous olivines with fayalite structure emerged. Fayalite
and Ca-fayalite are widespread in the iron ore sinters
[96–98]. The presence of olivines might explain the arising
of FTIR shoulders at 940, 970 and 997 cm-1 [65, 66].
Origin of some peaks which are recognizable on XRD
patterns of the samples heated at 1000 �C, namely *7.2,
6.5–6.6 and 3.55 A (samples DM-f and DM-l, Figs. 4, 5)
and 8.2 A (sample GD, Fig. 6), remains unclear. They
probably reflect the presence of poorly defined ferric
phosphates, secondary pyroxenes and/or calcium-alu-
minum silicates. Pyroxenes were already found in roasted
at 800 �C Si-ferrihydrites precipitated from the submarine
hydrothermal fluids [99]. Pyroxene and calcium silicates
are also common in metallurgical sinters [95, 98].
Specific surface area and porosity
Bog iron ores exhibit large surface areas, occasionally
exceeding a value of 200 m2 g-1 [24]. Table 3 summarizes
changes of specific surface area and porosity of the fine bog
iron ore from Kolechowice (sample KOL) in the course of
roasting. During heating at 200 �C, the surface area slightly
decreased (about 10 %) from initial 152 to 139 m2 g-1
(Table 3). Total porosity and macropore proportion
increased, with simultaneous decrease in the volume and
proportion of micropores (Fig. 9). This is probably an
effect of both structural changes and mineral transforma-
tions. Initial development of microporosity due to the
expulsion of water from iron oxyhydroxides is usually
followed by the coalescence of the micropores [1]. In the
case of bog iron ore, dehydroxylation starts below 200 �C,
which is evidenced by the disappearance of goethite XRD
peaks and infrared absorption bands. Hence, the coales-
cence of micropores and shrinkage of nanocrystalline
aggregates produce meso- and macroporosity. Also, the
stress associated with water expulsion may cause the
development of cracks propagated from the surfaces of
particles [15]. Dehydroxylation and decomposition of
goethite and ferrihydrite are followed by hematite forma-
tion. As goethite–hematite conversion is a topotactic
reaction [86, 100, 101], hematite obtained at relatively low
temperatures should retain size and morphology of the
precursor [1, 102], and for that reason, surface area has not
decreased significantly. The growth of hematite crystallites
via surface diffusion–coalescence mechanism probably
promoted the conversion of micropores into mesopores
[1, 100], which is reflected by the volume increase in the
latter. At 400 �C, a small increase in the surface area (up to
143 m2 g-1) and total porosity (to 0.276 cm3 g-1) was
recorded, with the proportion of all kinds of pores appeared
to remain roughly the same (Table 3; Fig. 9). This is in
agreement with a slight broadening of the hematite peaks
(Fig. 8), and similar changes observed previously in
hematite formed by goethite heating [86, 103]. The
removal of organic matter is probably important as well,
because their molecules were found to block the access of
gases to the pores and consequently to lower specific
Table 3 Porous texture parameters of natural and roasted bog iron ore (sample KOL)
Unheated 200 �C 400 �Ca 400 �Cb 700 �C 1000 �C
Surface area, SBET/m2 g-1 152 139 67 143 78 2.56
Total pore volume, Vt/cm3 g-1 0.190 0.257 0.194 0.276 0.191 0.015
Micropore volume, Vmic/cm3 g-1 0.063 0.051 0.026 0.053 0.029 0.001
Micropore proportion, Vmic/Vt 0.332 0.198 0.134 0.192 0.152 0.067
Mesopore volume, Vmes/cm3 g-1 0.095 0.158 0.106 0.169 0.150 0.006
Mesopore proportion, Vmes/Vt 0.500 0.615 0.546 0.612 0.785 0.400
Macropore volume, Vmac/cm3 g-1 0.032 0.048 0.062 0.054 0.012 0.008
Macropore proportion, Vmac/Vt 0.168 0.187 0.320 0.196 0.063 0.533
a, b Sample roasted with insufficient and full access of air, respectively
626 G. Rzepa et al.
123

surface area [51]. This is consistent with the disappearance
of organic-matter-related FTIR *1400 cm-1 band at
400 �C (Fig. 3). Admittedly, the exotherm originated from
the oxidation of the organic matter and accompanying mass
loss recorded on DTA and TG/DTG curves, respectively,
ends in temperatures higher than 400 �C (Fig. 1). It has to
be noted, however, that the thermal analysis was carried
out in a dynamic mode with the sample heated at a constant
rate, which obviously shifts the reactions associated with
mass changes to higher temperatures.
It should also be noted that if the roasting is run under
conditions of insufficient access of air, a sudden decrease in
specific surface area and total porosity together with a
distinct increase in macropore proportion is observed
[column 400 �C(a) in Table 3]. This is an effect of
maghemite formation beside hematite.
Together with heating and further increase in tempera-
ture, a significant decrease in specific surface area occurs
(Fig. 9), reaching values of 78 m2 g-1 at 700 �C and even
2.5 m2 g-1 at 1000 �C (Table 3). These are consistent with
the increase in hematite crystallinity and average crystallite
dimensions inferred from XRD data (Figs. 4–8). This is the
result of the aggregation of small hematite crystallites into
larger ones and sintering [1, 60]. Total porosity is dimin-
ished a dozen times, and micropore volume decreases to
almost zero value at the same time, with subsequent
increase in the proportions of both mesopores and macro-
pores (Table 3). Similar changes were observed during
thermal transformation of goethite to hematite [86].
Summary and conclusions
Our study showed that a series of chemical reactions and
physical transformations occur during heating of the bog
iron ores under oxidizing conditions. At lower temperature,
physically adsorbed surface water is removed followed by
the continuous release of structural water and hydroxyls
from ferrihydrite. A further increase in heating temperature
results in dehydration and dehydroxylation of iron oxyhy-
droxides as well as oxidation of organic matter. These
slightly affect the specific surface area but lower volume of
micropores. During heating of bog iron ore rich in organic
matter, iron oxyhydroxides may dehydroxylate at lower
temperatures. Also, maghemite may form as an interme-
diate product, particularly during the heating with insuffi-
cient air access. Such case with maghemite formed is
accompanied with a distinct decrease in surface area and
microporosity. Dehydroxylation and oxidation processes
terminate in the temperature range of 400–600 �C, with
nanocrystalline hematite as the main product. The hematite
presumably contains hydroxyl groups (and other impuri-
ties, like silicate and phosphate) and therefore can be
named protohematite. Protohematite undergoes recrystal-
lization to the proper (stoichiometric) hematite at 800 �C,
which is probably associated with the removal of OH
groups and silica. The latter forms a separate cristobalite-
like phase. Manganese oxides in the Mn-rich bog iron ores
are partially reduced and then converted to jacobsite-like
spinels. At the highest temperatures of roasting, various
0 100 200 300 400 500 600 700 800 900 1000
Temperature/°C
0
40
80
120
160
Sur
face
are
a/m
2 *g–
1
0
0.1
0.2
0.3
pore
vol
ume/
cm3 *
g–1
0
0.2
0.4
0.6
0.8
Por
e vo
lum
e re
lativ
e to
tota
l vol
ume
BET
VTOT
VMIC
VMES
VMAC
VMIC /VTOT
VMES/VTOT
VMAC/VTOT
Fig. 9 Porous texture
parameters of natural and
roasted KOL sample.
Explanations: BET specific
surface area (dashed line), VTOT
total pore volume, VMIC
micropore volume, VMES
mesopore volume, VMAC
macropore volume. Pore
volumes are plotted with solid
lines and pore proportions with
tightly dashed lines
Mineral transformations and textural evolution during roasting of bog iron ores 627
123

secondary silicates can be encountered as well. The
transformations occurring at high temperature lead to a
drastic fall of a specific surface area and to the destruction
of porous texture of the bog iron ores.
This work documents that the heating of bog iron ores,
even at relatively high temperatures of 400–450 �C, has not
resulted in pronounced reduction of the surface area and
porosity, despite distinct changes of mineral composition.
This may be of importance if the utilization of bog iron
ores is considered, because a relatively simple treatment
(roasting) results in the modification of the material com-
position, while the porous texture parameters remain rela-
tively weakly affected.
The transformations of iron oxyhydroxides in bog iron
ores occur at temperatures different than those reported for
pure compounds wherein the differences concern the shifts
toward both higher and lower temperatures. From the
viewpoint of the raw material utilization (as a sorbent for
instance), it is obviously disadvantageous feature; however,
it allows (through extended product analysis) inferring the
composition and properties of the starting material and/or the
conditions to which the material (the bog iron ore) was
subjected to. It might be interesting, e.g., in archeology, in
due course of deducing of the details of iron ore dressing
processes (the roasting was the simplest and at the same time
the most effective way of ore processing prior to bloomery
process in the past) or inferring the methods of processing,
which were applied in the past to natural ferruginous pig-
ments in order to achieve the desired color effect.
Acknowledgements This work was supported by LIDER Project
No. LIDER/043/403/L-4/12/NCBR/2013 from The National Centre
for Research and Development, Poland. The authors are indebted to
Anna Tomczyk M.Sc. for her help during analysis and interpretation
of porous texture parameters. Dr. Bartosz Budzyn is acknowledged
for carefully reading the manuscript. We also thank two anonymous
reviewers whose constructive comments and remarks allowed
improving the quality and clarity of the manuscript.
Open Access This article is distributed under the terms of the
Creative Commons Attribution 4.0 International License (http://crea
tivecommons.org/licenses/by/4.0/), which permits unrestricted use,
distribution, and reproduction in any medium, provided you give
appropriate credit to the original author(s) and the source, provide a
link to the Creative Commons license, and indicate if changes were
made.
References
1. Cornell RM, Schwertmann U. The iron oxides: structure,
properties, reactions, occurrences and uses. 2nd ed. Weinheim:
Wiley; 2003.
2. Murad E, Schwertmann U. Temporal stability of a fine-grained
magnetite. Clays Clay Miner. 1993;41:111–3.
3. Wells MA, Fitzpatrick RW, Gilkes RJ. Thermal and mineral
properties of Al-, Cr-, Mn-, Ni- and Ti-substituted goethite.
Clays Clay Miner. 2006;54:176–94.
4. Subrt J, Balek V, Criado JM, Perez-Maqueda LA, Vecernikova
E. Characterisation of a-FeOOH grinding products using
simultaneous DTA and TG/DTG coupled with MS. J Therm
Anal. 1998;53:509–17.
5. Dinesen AR, Pedersen CT, Bender Koch C. The thermal con-
version of lepidocrocite (c-FeOOH) revisited. J Therm Anal
Calorim. 2001;64:1303–10.
6. Mitov I, Paneva D, Kunev B. Comparative study of the thermal
decomposition of iron oxyhydroxides. Thermochim Acta.
2002;386:179–88.
7. Przepiera K, Przepiera A. Thermal transformations of selected
transition metals hydroxides. J Therm Anal Calorim. 2003;74:
659–66.
8. Christensen AN, Jensen TR, Bahl CRH, DiMasi E. Nano size
crystals of goethite, a-FeOOH. Synthesis and thermal transfor-
mation. J Solid State Chem. 2007;180:1431–5.
9. Liu H, Chen T, Xie Q, Zou X, Qing C, Frost RL. Kinetic study
of goethite dehydration and the effect of aluminum substitution
on the dehydrate. Thermochim Acta. 2012;545:20–5.
10. Pieczara G, Rzepa G, Gaweł A. The influence of silicate content
on thermal stability of 2-line ferrihydrite and properties of its
transformation products. Geol Geophys Environ. 2014;40:160–1.
11. Perrier N, Gilkes RJ, Colin F. Heating Fe oxide-rich soils
increases the dissolution rate of metals. Clays Clay Miner.
2006;52:165–75.
12. Morcos RM, Navrotsky A. Iron ore sintering. Characterization
by calorimetry and thermal analysis. J Therm Anal Calorim.
2009;96:353–61.
13. Zevgolis EN, Zografdis C, Perraki T, Devlin E. Phase trans-
formations of nickeliferous laterites during preheating and
reduction with carbon monoxide. J Therm Anal Calorim.
2010;100:133–9.
14. Strezov V, Ziolkowski A, Evans TJ, Nelson PF. Assessment of
evolution of loss on ignition matter during heating of iron ores.
J Therm Anal Calorim. 2010;100:901–7.
15. Strezov V, Evans TJ, Zymla V, Strezov L. Structural deterio-
ration of iron ore particles during thermal processing. Int J
Miner Process. 2011;100:27–32.
16. Pulisova P, Masa B, Michalkova E, Vecernikova E, Marikova
M, Bezdicka P, Murafa N, Subrt J. Thermal behaviour of natural
and synthetic iron precipitates from mine drainage. J Therm
Anal Calorim. 2014;116:625–32.
17. Wang Y, Xing S, Zhang Y, Li Z, Ma Y, Zhang Z. Mineralogical
and thermal characteristics of low-grade Jinlong bauxite sourced
from Guangxi Province, China. J Therm Anal Calorim. 2015.
doi:10.1007/s10973-015-4742-6.
18. Zivkovic D, Strbac N, Sokic M, Andric V, Jovanovic I, Jovicic
M, Andjelic B, Radoslavlejic S. Physicochemical investigation
of some archaeometallurgical findings from locality Kmpije
(Bor, Serbia). J Therm Anal Calorim. 2014;118:1369–73.
19. Ion RM, Radovici C, Fierascu RC, Fierascu I. Thermal and
mineralogical investigations of iron archaeological materials.
J Therm Anal Calorim. 2015. doi:10.1007/s10973-015-4659-0.
20. Atasoy A. The comparison of the Bayer process wastes on the
base of chemical and physical properties. J Therm Anal
Calorim. 2007;90:153–8.
21. Pascual J, Corpas FA, Lopez-Beceiro J, Benıtez-Guerrero M,
Artiaga R. Thermal characterization of a Spanish red mud.
J Therm Anal Calorim. 2009;96:407–12.
22. Rivas Mercury JM, Cabral AA, Paiva AEM, Angelica RS,
Neves RF, Scheller T. Thermal behavior and evolution of the
minerals of Brazilian red mud. J Therm Anal Calorim.
2011;2011(104):635–43.
23. Banning A. Bog iron ores and their potential role in arsenic
dynamics: an overview and ‘‘Paleo Example’’. Eng Life Sci.
2008;8:641–9.
628 G. Rzepa et al.
123

24. Ratajczak T, Rzepa G. Polish bog iron ores. Krakow: Wyd.
AGH; 2011 (in Polish).25. Ramanaidou ER, Wells MA. Sedimentary hosted iron ores. In:
Holland HD, Turekian KK, editors. Treatise on geochemistry.
2nd ed. Oxford: Elsevier; 2014. p. 313–55.
26. Crerar DA, Knox GW, Means JL. Biogeochemistry of bog iron
in the New Jersey pine barrens. Chem Geol. 1979;24:111–35.
27. De Geyter G, Vandenberghe Verdonck L, Stoops G. Mineralogy
of Holocene bog-iron ore from northern Belgium. N Jb Mineral
Abh. 1985;153:1–17.
28. Joosten I, Jansen JBH, Kars H. Geochemistry and the past:
estimation of the output of a Germanic iron production site in
the Netherlands. J Geochem Explor. 1998;62:129–37.
29. Breuning-Madsen H, Rønsbo J, Holst MK. Comparison of the
composition of iron pans in Danish burial mounds with bog iron
and spodic material. Catena. 2000;39:1–9.
30. Bricker OP, Newell WL, Simon NS. Bog iron formation in the
Nassawango watershed, Maryland. U.S. Geological Survey
Open-File Report 03-346, 2003.
31. Kaczorek D, Sommer M. Micromorphology, chemistry and min-
eralogy of bog iron ores from Poland. Catena. 2003;54:392–402.
32. Kaczorek D, Sommer M, Andruschkewitsch I, Oktaba L,
Czerwinski Z, Stahr K. A comparative micromorphological and
chemical study of ‘‘Raseneisenstein’’ (bog iron ore) and ‘‘Ort-
stein’’. Geoderma. 2004;121:83–94.
33. Kholodov VN, Nedumov RI, Golubovskaya EV. Facies types of
sedimentary iron ore deposits and their geochemical features:
communication 1: Facies groups of sedimentary ores, their
lithology, and genesis. Lithol Miner Resour. 2012;47:447–72.
34. Piwocki M. Mineral raw materials and commodities of Poland.
Prz Geol. 2004;52:744–52.
35. Mighall TM, Foster IDL, Crew P, Chapman AS, Finn A. Using
mineral magnetism to characterise ironworking and to detect its
evidence in peat bogs. J Arch Sci. 2009;36:130–9.
36. Torok B, Thiele A. Extracting phosphoric iron under laborato-
rial conditions smelting bog iron ores. IOP Conf Series Mater
Sci Eng. 2013. doi:10.1088/1757-899X/47/1/012034.
37. Virtanen K. Geological control of iron and phosphorous pre-
cipitates in mires of the Ruukki-Vihanti area, Central Finland.
Bull Geol Surv Finl. 1994;375:1–69.
38. Kraczkowska I, Ratajczak T, Rzepa G. Mineral composition and
physico-mechanical properties of the lump bog iron ores used in
historical buildings in Poland. Prz Geol. 2001;49:1147–56.
39. Dreesen R, Dusar M. Historical building stones in the province
of Limburg (NE Belgium): role of petrography in the prove-
nance and durability assessment. Mater Character. 2004;53:
273–87.
40. Barbel A. Verwitterung und Konservierung von Objekten aus
Raseneisenstein. Z Dtsch Ges Geowiss. 2005;156:151–8.
41. Wieckowska J. Catalytic and adsorptive desulphurization of
gases. Catal Today. 1995;24:405–65.
42. Schweigkofler M, Niessner R. Removal of siloxanes in biogases.
J Hazard Mater. 2001;B83:183–96.
43. Gaj K, Cybulska H, Knop F, Steininger M. Examination of
biogas hydrogen sulphide sorption on a layer of activated bog
ore. Environ Protect Eng. 2008;34:33–41.
44. Gaj K, Cybulska-Szulc H. Time changeability model of the bog
ore sorption ability. Ecol Chem Eng S. 2014;21:113–23.
45. Zdeb M. An efficiency of H2S removal from biogas via
physicochemical and biological methods—a case study. Ann Set
Environ Prot. 2013;15:551–63.
46. Rzepa G, Ratajczak T. Mineral composition of bog iron ores and
their sorption properties. Miner Resour Manag. 2004;20:61–73
(in Polish with English summary).47. Rzepa G, Bajda T, Ratajczak T. Utilization of bog iron ores as
sorbents of heavy metals. J Hazard Mater. 2009;162:1007–13.
48. Stoops G. SEM and light microscopic observations of minerals
in bog ores of the Belgian Campine. Geoderma. 1983;30:
179–86.
49. Jakobsen BH. Accumulation of pyrite and Fe-rich carbonate and
phosphate minerals in a lowland moor area. J Soil Sci.
1988;39:447–55.
50. Bajda T, Klojzy-Karczmarczyk B, Rzepa G, Fijał J, Mazurek J.
Sorption of Cu(II), Zn(II) and Hg(II) onto natural and modified
bog iron ores. Miner Resour Manag. 2004;20:83–98 (in Polishwith English summary).
51. Fijał J, Zietkiewicz J. Influence of the way of bog iron ores
modification on their sorptive properties. Miner Resour Manag.
2004;20:75–81 (in Polish with English summary).52. Schwertmann U, Schulze DG, Murad E. Identification of ferrihy-
drite in soils by dissolution kinetics, differential X-Ray diffraction
and Mossbauer spectroscopy. Soil Sci Soc Am J. 1982;46:869–75.
53. Rzepa G, Bajda T, Sikora M. Speciation and concentration of
trace elements in the ferruginous sediments of Poland. Pol J
Environ Stud. 2006;15:474–8.
54. Rzepa G. Mineral and chemical composition of bog iron ores
and their physicochemical properties in terms of the possibility
of using them as natural sorbents. Ph.D. thesis, AGH; Krakow;
2003. (in Polish).
55. Sandell EB. Micro determination of water by the Penfield
method. Mikrochem ver Microchim Acta. 1951;38:487–91.
56. Mehra OP, Jackson ML. Iron oxide removal from soils and clays
by a dithionite-citrate system buffered with sodium carbonate.
Clays Clay Miner. 1960;7:317–27.
57. The Powder Diffraction File PDF-4?. International Centre for
Diffraction Data, Newton Square, 2013.
58. Brunauer S, Emmett PH, Teller E. Adsorption of gases in
multimolecular layers. J Am Chem Soc. 1938;60:309–19.
59. Weidler PG. BET sample pretreatment of synthetic ferrihydrite
and its influence on the determination of surface area and
porosity. J Porous Mater. 1997;4:165–9.
60. Glasauer SM, Hug P, Weidler PG, Gehring AU. Inhibition of
sintering by Si during the conversion of Si-rich ferrihydrite to
hematite. Clays Clay Miner. 2000;48:51–6.
61. Gonzalez C, Gutierrez JI, Gonzalez-Velasco JR, Cid A, Arranz
A, Arranz JF. Transformations of manganese oxides under dif-
ferent thermal conditions. J Therm Anal. 1996;47:93–102.
62. Foldvari M. Handbook of thermogravimetric system of minerals
and its use in geological practice. Budapest: Occasional Papers
of the Geological Institute of Hungary, 213; 2011.
63. Liptay G. Atlas of thermoanalytical curves (TG-, DTG-, DTA-
curves measured simultaneously), vol. 2. Budapest: Akademiai
Kiado; 1973.
64. Prieto O, del Arco M, Rives V. Structural evolution upon
heating of sol-gel prepared birnessites. Thermochim Acta.
2003;401:95–109.
65. Russell JD, Fraser AR. Infrared methods. In: Wilson MJ, editor.
Clay mineralogy: spectroscopic and chemical determinative
methods. London: Chapman & Hall; 1994. p. 11–67.
66. Chukanov NV. Infrared spectra of mineral species. Extended
library. Dodrecht: Springer; 2014.
67. Mazzetti L, Thistlethwaite PJ. Raman spectra and thermal
transformations of ferrihydrite and schwertmannite. J Raman
Spectrosc. 2002;33:104–11.
68. Walter D. Characterization of synthetic hematite pigments.
Thermochim Acta. 2006;445:195–9.
69. Vallina B, Rodriguez-Blanco JD, Brown AP, Benning LG, Blanco
JA. Enhanced magnetic coercivity of a-Fe2O3 obtained from
carbonated 2-line ferrihydrite. J Nanopart Res. 2014;16:2322.
70. van der Marel HW, Beutelspacher H. Atlas of infrared spec-
troscopy of clay minerals and their admixtures. Amsterdam:
Elsevier; 1976.
Mineral transformations and textural evolution during roasting of bog iron ores 629
123

71. Chernyshova IV, Hochella MF, Madden AS. Size-dependent
structural transformations of hematite nanoparticles. 1. Phase
transition. Phys Chem Chem Phys. 2007;9:1736–50.
72. Campbell AS, Schwertmann U, Campbell PA. Formation of
cubic phases on heating ferrihydrite. Clay Miner. 1997;32:
615–22.
73. Grogan KL, Gilkes RJ, Lottermoser BG. Maghemite formation
in burnt plant litter at East Trinity, North Queensland, Australia.
Clays Clay Miner. 2003;51:390–6.
74. Paterson E, Swaffield R. Influence of adsorbed anions on the
dehydroxylation of synthetic goethite. J Therm Anal. 1980;18:
161–7.
75. Gualtieri AF, Venturelli P. In situ study of the goethite-hematite
phase transformation by real-time synchrotron powder diffrac-
tion. Am Miner. 1999;84:895–904.
76. Frost RL, Ding Z, Ruan HD. Thermal analysis of goethite.
Relevance to Australian indigenous art. J Therm Anal Calorim.
2003;71:783–97.
77. Mørup S, Meaz TM. Bender Koch C, Hansen HCB. Nanocrys-
tallinity induced by heating. Z. Phys D. 1997;40:166–9.
78. Ruan HD, Frost RL, Klopproge JT. The behavior of hydroxyl
units of synthetic goethite and its dehydroxylated product
hematite. Spectrochim Acta A. 2001;57:2575–86.
79. Walter D, Buxbaum G, Laqua W. The mechanism of the thermal
transformation from goethite to hematite. J Therm Anal
Calorim. 2001;63:733–48.
80. Carlson L, Schwertmann U. Natural ferrihydrites in surface
deposits from Finland and their association with silica. Geochim
Cosmochim Acta. 1981;45:421–9.
81. Vempati RK, Loeppert RH, Sittertz-Bhatkar H, Burghardt RC.
Infrared vibrations of hematite formed from aqueous- and dry-
thermal incubation of Si-containing ferrihydrite. Clays Clay
Miner. 1990;38:294–8.
82. Campbell AS, Schwertmann U, Stanjek H, Friedl J, Kyek A,
Campbell PA. Si incorporation into hematite by heating Si-fer-
rihydrite. Langmuir. 2002;18:7804–9.
83. Stanjek H, Weidler PG. The effect of dry heating on the
chemistry, surface area, and oxalate solubility of synthetic 2-line
and 6-line ferrihydrites. Clay Miner. 1992;27:397–412.
84. Michel FM, Barron V, Torrent J, Morales MP, Serna CJ, Boily
J-F, Liu Q, Ambrosini A, Cismasu AC, Brown GE Jr. Ordered
ferrimagnetic form of ferrihydrite reveals links among structure,
composition, and magnetism. PNAS. 2010;107:2787–92.
85. Przepiera K, Przepiera A. Kinetics of thermal transformations of
precipitated magnetite and goethite. J Therm Anal Calorim.
2001;65:497–503.
86. Liu HL, Chen T, Zou X, Qing C, Frost RL. Thermal heating of
natural goethite: thermal transformation and physical properties.
Thermochim Acta. 2013;568:115–21.
87. Ford RG, Bertsch PM. Distinguishing between surface and bulk
dehydration-dehydroxylation reactions in synthetic goethites by
high-resolution thermogravimetric analysis. Clays Clay Miner.
1999;47:329–37.
88. Wolska E, Schwertmann U. Nonstoichiometric structures during
dehydoxylation of goethite. Z Kristalogr. 1989;189:223–37.
89. Peterson KM, Heaney PJ, Post JE, Eng PJ. A refined monoclinic
structure for a variety o ‘‘hydrohematite’’. Am Mineral.
2015;100:570–9.
90. Ruan HD, Frost RL, Kloprogge JT, Duong L. Infrared spec-
troscopy of goethite dehydroxylation III. FT-IR microscopy of
in situ study of the thermal transformation of goethite to
hematite. Spectrochim Acta. 2005;58:967–81.
91. Sawaby A, Moharram MA, Shabaka AA, El Saker N. Spectro-
scopic method for the determination of crystallinity of hematite.
Proc Indian Acad Sci (Chem Sci). 1989;101:529–38.
92. Kustova GN, Burgina EB, Sadykov VA, Poryvaev SG. Vibra-
tional spectroscopic investigation of the goethite thermal
decomposition products. Phys Chem Miner. 1992;18:379–82.
93. Burgina EB, Kustova GN, Tsybulya SV, Kryukova GN, Litvak
GS, Isupova LA, Sadykov VA. Structure of the metastable
modification of iron(III) oxide. J Struct Chem. 2000;41:
396–402.
94. Shaheen WM, Hong KS. Thermal characterization and physico-
chemical properties of Fe2O3–Mn2O3/Al2O3 systems. J Therm
Anal Calorim. 2002;68:289–306.
95. Wyderko-Delekta M, Bolewski A. Mineralogy of ore pellets and
sinters. Krakow: AGH; 1995 (in Polish).96. Jouhari AK. Sintering of ore fines—principles and a few case
studies. In: Misr VN, Reddy PSR, Mohapatr BK, editors. Min-
eral characterisation and processing. New Delhi: Allied Pub;
2004. p. 237–44.
97. Gupta RC. Theory and laboratory experiments in ferrous met-
allurgy. New Delhi: PHI; 2010.
98. Fan J, Qui G, Jiang T, Guo Y, Yang Y, Cai M. Studies on
alternative blast furnace burden structure with high proportion
sinter. In: Jiang T, Hwang J-Y, Masset P, Yucel O, Padilla R,
Zhou G, editors. 3rd international symposium on high temper-
ature metallurgical processing. Hoboken: Wiley; 2012. p. 59–66.
99. Toner BM, Berquo TS, Michel FM, Sorensen JV, Templeton
AS, Edwards KJ. Mineralogy of iron microbial mats from Loihi
Seamount. Front Microbiol. 2012;3:1–18.
100. Watari F, Van Landuydt J, Delavignette P, Amelincx S. Electron
microscopic study of dehydration transformations. I. Twin for-
mation and mosaic structure in hematite derived from goethite.
J Solid State Chem. 1979;29:137–50.
101. Cudennec Y, Lecerf A. Topotactic transformations of goethite
and lepidocrocite into hematite and maghemite. Solid State Sci.
2005;7:520–9.
102. Gialanella S, Girardi F, Ischia G, Lonardelli I, Mattarelli M,
Montagna M. On the goethite to hematite phase transformation.
J Therm Anal Calorim. 2010;102:867–73.
103. Derie R, Ghodsi M, Calvo-Roche C. DTA study of the dehy-
dration of synthetic goethite aFeOOH. J Therm Anal.
1976;9:435–40.
630 G. Rzepa et al.
123