Mindtree Limited · Mindtree Limited (NSE: MINDTREE, BSE: 532819) Earnings release Third quarter...
12
Mindtree Limited (NSE: MINDTREE, BSE: 532819) Earnings release Third quarter ended December 31, 2017 January 17, 2018
Transcript of Mindtree Limited · Mindtree Limited (NSE: MINDTREE, BSE: 532819) Earnings release Third quarter...
Mindtree Limited (NSE: MINDTREE, BSE: 532819)
Earnings release
Third quarter ended December 31, 2017
January 17, 2018
© Mindtree 2018 Page 2 of 12
Contents
1. Press Release 3
2. Key Financial Metrics 6
3. Key Ratios 6
4. Key Revenue Metrics 7
5. Effort and Utilization 8
6. Key Client Metrics 8
7. Key Employee Metrics 9
8. Infrastructure 9
9. Statutory Financials 10
Earnings Conference Call for Analysts / Investors
January 17, 2018 (6:30 PM IST)
Primary Number: +91 22 3938 1087
(The number listed above is universally accessible from all networks and all countries)
Local Access Number: 3940 3977 Available in - Ahmedabad, Bangalore, Chandigarh, Chennai, Gurgaon (NCR), Hyderabad, Kochi/Cochin, Kolkata, Lucknow, Pune Accessible from all carriers.
Toll free numbers:
Singapore: 800 101 2045
Hong Kong: 800 964 448
UK: 0 808 101 1573
US: 1 866 746 2133
Replay of conference call available until January 31, 2018
+91 22 3065 2322 (Playback id: 230712#)
Webcast – Participants have the option to attend the conference call by logging in to the online webcast, please note participants in webcast would be in listen-only mode. The webcast link is as below.
Mindtree Q3 FY18 Webcast Link
Transcript will be available on www.mindtree.com after January 24, 2018
© Mindtree 2018 Page 3 of 12
Mindtree Reports Third Quarter 2017-18 Results In USD terms, Net Profit rises 13.8% q-o-q / 44.1% y-o-y;
Revenue grows 3.9% q-o-q / 11.5% y-o-y
Bangalore (India) and Warren (NJ), January 17, 2018: Mindtree, a global Digital transformation and
technology services company, announced its consolidated results today for the third quarter ended December
31, 2017 as approved by its board of directors.
Key financial highlights:
Quarter ended December 31, 2017
In USD:
o Revenue at $214.3 million (growth of 3.9% q-o-q / 11.5% y-o-y)
o Net profit at $22 million (growth of 13.8% q-o-q / 44.1% y-o-y)
In INR:
o Revenue at ₹ 13,777 million (growth of 3.5% q-o-q / 6.4% y-o-y)
o Net profit at ₹ 1,415 million (growth of 13.4% q-o-q / 37.2% y-o-y)
Other highlights:
Clients:
o 344 active clients as of December 31, 2017
People:
o 17,200 Mindtree Minds as of December 31, 2017
o Trailing 12 months attrition is 12.6%
Our ‘Execute Smart’ approach to Delivery continues to bear fruit and contributed to a robust
quarter on all fronts. By delivering fast time-to-market for our solutions, we have created even
further competitive advantage for our clients.” said Rostow Ravanan, CEO & Managing
Director, Mindtree. “These strong results also reflect our ongoing leadership in Digital, and
our unique ability to be the core Digital anchor-partner for next-generation Digital
transformations.”
We are optimistic about the opportunities ahead and Mindtree is well-positioned to
powering these possibilities.”
© Mindtree 2018 Page 4 of 12
Multi-year and multi-million dollar wins with leading global clients:
o Providing digital transformation, quality assurance and technology operations services for a
leading Industry association in the education sector
o Providing managed services for a leading technology company
o Anchor Digital partner for an enterprise-wide transformation initiative for a large beauty care
company
o Implementing ShotClasses, Mindtree’s employee-training and micro-learning platform, for a
leading consumer goods company
o Migrating SAP ERP and BI solutions to SAP HANA for a large commercial vehicle retailer in the
US
Awards and Recognition:
o Mindtree named a “Rising Star” in Public Cloud Infrastructure Consulting and Implementation
Services, Public Cloud Infrastructure Managed Services and Public Cloud SAP Services by
Information Services Group (ISG)
o Mindtree's SAP Practice wins the SAP Gold Quality Award in United Kingdom for workforce
planning using SAP Business Planning & Consolidation suite
o Mindtree positioned as a leader in the Zinnov Zones for Product Engineering Services 2017
o Mindtree named among the Large System Integrators for Agile and DevOps services by Gartner
Announcements
o The board of directors at its meeting held on January 17, 2018 have recommended an interim
dividend of 20% ( ₹ 2 per equity share of par value ₹ 10 each)
© Mindtree 2018 Page 5 of 12
About Mindtree
Mindtree [NSE: MINDTREE] delivers digital transformation and technology services from ideation to
execution, enabling Global 2000 clients to outperform the competition. “Born digital,” Mindtree takes an agile,
collaborative approach to creating customized solutions across the digital value chain. At the same time, our
deep expertise in infrastructure and applications management helps optimize your IT into a strategic asset.
Whether you need to differentiate your company, reinvent business functions or accelerate revenue growth,
we can get you there. Visit www.mindtree.com to learn more.
Safe harbour
Certain statements in this release concerning our future growth prospects are forward-looking statements,
which involve a number of risks, and uncertainties that could cause our actual results to differ materially from
those in such forward-looking statements. We do not undertake to update any forward-looking statement that
may be made from time to time by us or on our behalf.
Visit us at www.mindtree.com. For more information, contact:
INDIA UNITED STATES
Raman Suprajarama Andrea Dunbeck
Mindtree Matter Communications
+91 99860 77100 978-518-4555
[email protected] [email protected]
EUROPE
Imogen Nation
Hotwire
+4420 7608 4675
Mindtree Limited, Global Village, RVCE Post, Mysore Road, Bangalore-560059;
CIN: L72200KA1999PLC025564; Phone: + 91 80 6706 4000; Fax: +91 80 6706 4100;
E-mail: [email protected]/[email protected]; Website: www.mindtree.com
© Mindtree 2018 Page 6 of 12
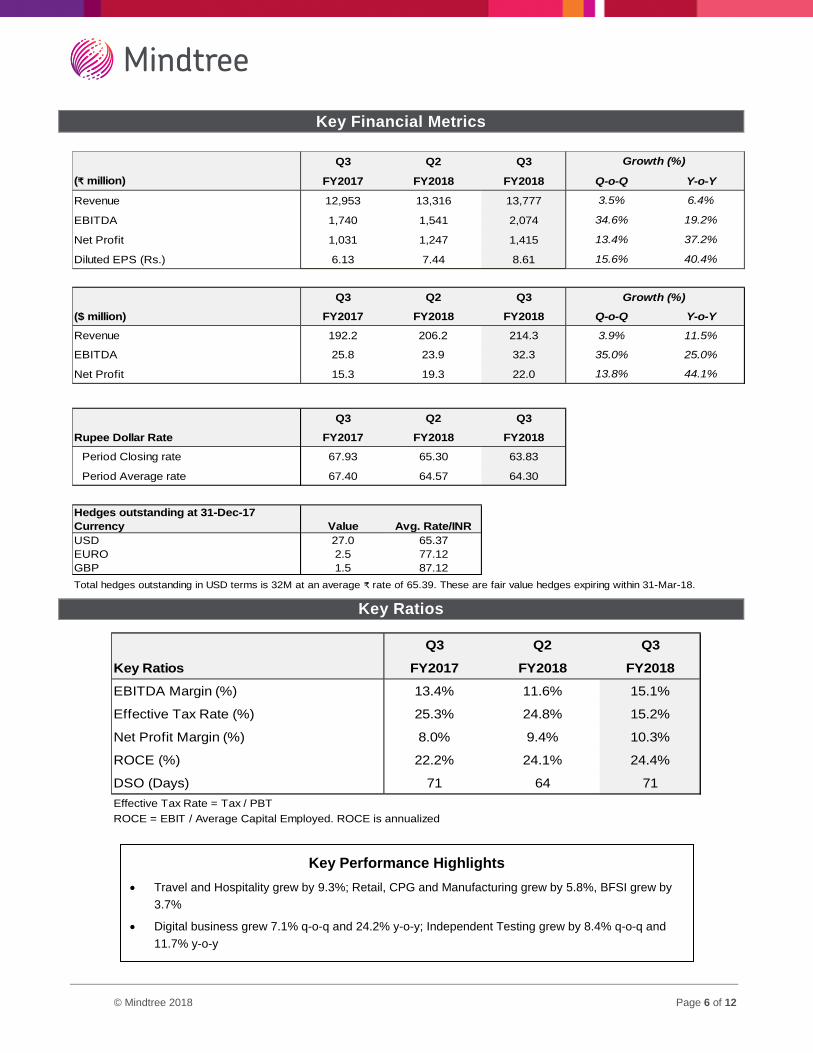
Key Financial Metrics
Q3 Q2 Q3
(₹ million) FY2017 FY2018 FY2018 Q-o-Q Y-o-Y
Revenue 12,953 13,316 13,777 3.5% 6.4%
EBITDA 1,740 1,541 2,074 34.6% 19.2%
Net Profit 1,031 1,247 1,415 13.4% 37.2%
Diluted EPS (Rs.) 6.13 7.44 8.61 15.6% 40.4%
Q3 Q2 Q3
($ million) FY2017 FY2018 FY2018 Q-o-Q Y-o-Y
Revenue 192.2 206.2 214.3 3.9% 11.5%
EBITDA 25.8 23.9 32.3 35.0% 25.0%
Net Profit 15.3 19.3 22.0 13.8% 44.1%
Q3 Q2 Q3
Rupee Dollar Rate FY2017 FY2018 FY2018
Period Closing rate 67.93 65.30 63.83
Period Average rate 67.40 64.57 64.30
Hedges outstanding at 31-Dec-17
Currency Value Avg. Rate/INR
USD 27.0 65.37
EURO 2.5 77.12
GBP 1.5 87.12
Total hedges outstanding in USD terms is 32M at an average ₹ rate of 65.39. These are fair value hedges expiring within 31-Mar-18.
Growth (%)
Growth (%)
Key Ratios
Q3 Q2 Q3
Key Ratios FY2017 FY2018 FY2018
EBITDA Margin (%) 13.4% 11.6% 15.1%
Effective Tax Rate (%) 25.3% 24.8% 15.2%
Net Profit Margin (%) 8.0% 9.4% 10.3%
ROCE (%) 22.2% 24.1% 24.4%
DSO (Days) 71 64 71
Effective Tax Rate = Tax / PBT
ROCE = EBIT / Average Capital Employed. ROCE is annualized
Key Performance Highlights
Travel and Hospitality grew by 9.3%; Retail, CPG and Manufacturing grew by 5.8%, BFSI grew by
3.7%
Digital business grew 7.1% q-o-q and 24.2% y-o-y; Independent Testing grew by 8.4% q-o-q and
11.7% y-o-y
$5Mn clients has grown by 5 taking the total count to 38
© Mindtree 2018 Page 7 of 12
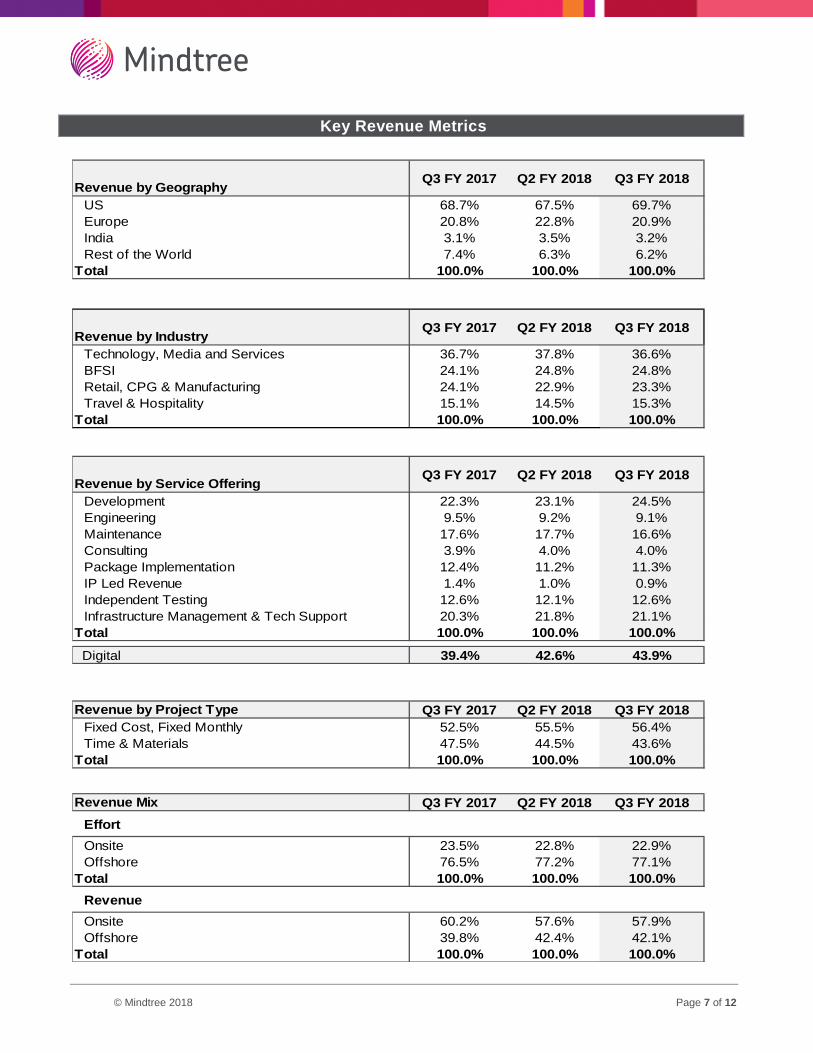
Key Revenue Metrics
Revenue by Geography Q3 FY 2017 Q2 FY 2018 Q3 FY 2018
US 68.7% 67.5% 69.7%
Europe 20.8% 22.8% 20.9%
India 3.1% 3.5% 3.2%
Rest of the World 7.4% 6.3% 6.2%
Total 100.0% 100.0% 100.0%
Revenue by Industry Q3 FY 2017 Q2 FY 2018 Q3 FY 2018
Technology, Media and Services 36.7% 37.8% 36.6%
BFSI 24.1% 24.8% 24.8%
Retail, CPG & Manufacturing 24.1% 22.9% 23.3%
Travel & Hospitality 15.1% 14.5% 15.3%
Total 100.0% 100.0% 100.0%
Revenue by Service Offering Q3 FY 2017 Q2 FY 2018 Q3 FY 2018
Development 22.3% 23.1% 24.5%
Engineering 9.5% 9.2% 9.1%
Maintenance 17.6% 17.7% 16.6%
Consulting 3.9% 4.0% 4.0%
Package Implementation 12.4% 11.2% 11.3%
IP Led Revenue 1.4% 1.0% 0.9%
Independent Testing 12.6% 12.1% 12.6%
Infrastructure Management & Tech Support 20.3% 21.8% 21.1%
Total 100.0% 100.0% 100.0%
Digital 39.4% 42.6% 43.9%
Revenue by Project Type Q3 FY 2017 Q2 FY 2018 Q3 FY 2018
Fixed Cost, Fixed Monthly 52.5% 55.5% 56.4%
Time & Materials 47.5% 44.5% 43.6%
Total 100.0% 100.0% 100.0%
Revenue Mix Q3 FY 2017 Q2 FY 2018 Q3 FY 2018
Effort
Onsite 23.5% 22.8% 22.9%
Offshore 76.5% 77.2% 77.1%
Total 100.0% 100.0% 100.0%
Revenue
Onsite 60.2% 57.6% 57.9%
Offshore 39.8% 42.4% 42.1%
Total 100.0% 100.0% 100.0%
© Mindtree 2018 Page 8 of 12
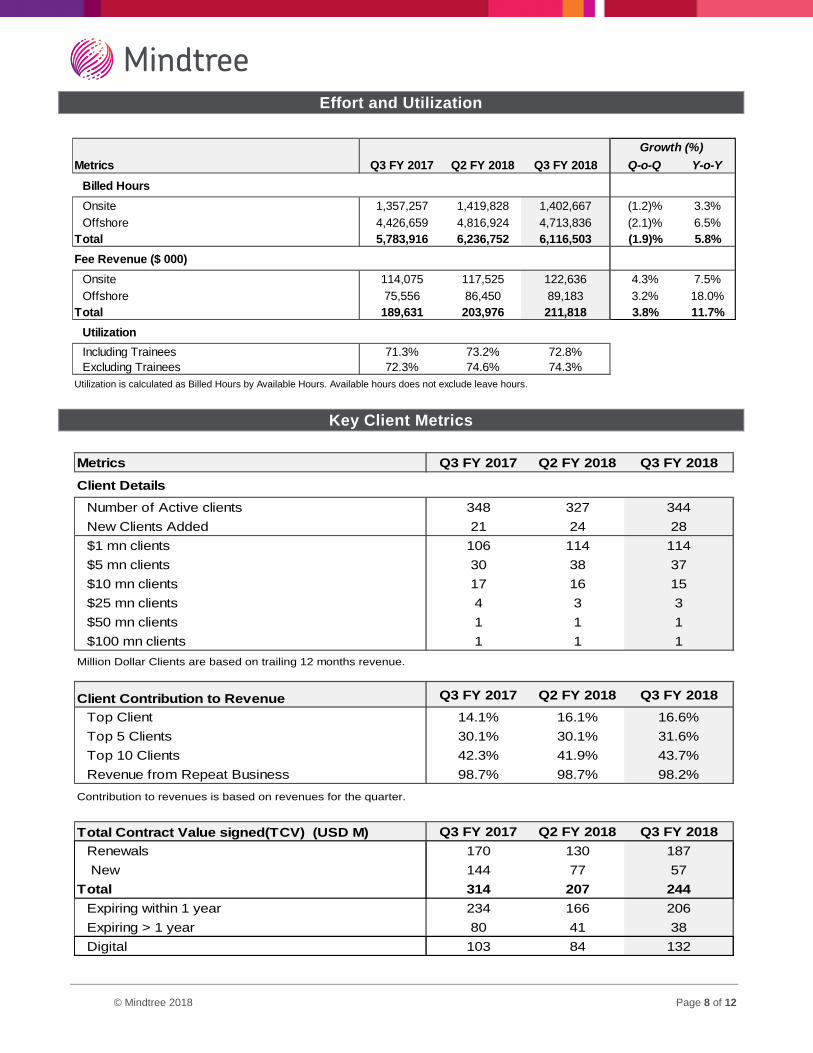
Effort and Utilization
Metrics Q3 FY 2017 Q2 FY 2018 Q3 FY 2018 Q-o-Q Y-o-Y
Billed Hours
Onsite 1,357,257 1,419,828 1,402,667 (1.2)% 3.3%
Offshore 4,426,659 4,816,924 4,713,836 (2.1)% 6.5%
Total 5,783,916 6,236,752 6,116,503 (1.9)% 5.8%
Fee Revenue ($ 000)
Onsite 114,075 117,525 122,636 4.3% 7.5%
Offshore 75,556 86,450 89,183 3.2% 18.0%
Total 189,631 203,976 211,818 3.8% 11.7%
Utilization
Including Trainees 71.3% 73.2% 72.8%
Excluding Trainees 72.3% 74.6% 74.3%
Utilization is calculated as Billed Hours by Available Hours. Available hours does not exclude leave hours.
Growth (%)
Key Client Metrics
Metrics Q3 FY 2017 Q2 FY 2018 Q3 FY 2018
Client Details
Number of Active clients 348 327 344
New Clients Added 21 24 28
$1 mn clients 106 114 114
$5 mn clients 30 38 37
$10 mn clients 17 16 15
$25 mn clients 4 3 3
$50 mn clients 1 1 1
$100 mn clients 1 1 1
Million Dollar Clients are based on trailing 12 months revenue.
Client Contribution to Revenue Q3 FY 2017 Q2 FY 2018 Q3 FY 2018
Top Client 14.1% 16.1% 16.6%
Top 5 Clients 30.1% 30.1% 31.6%
Top 10 Clients 42.3% 41.9% 43.7%
Revenue from Repeat Business 98.7% 98.7% 98.2%
Contribution to revenues is based on revenues for the quarter.
Total Contract Value signed(TCV) (USD M) Q3 FY 2017 Q2 FY 2018 Q3 FY 2018
Renewals 170 130 187
New 144 77 57
Total 314 207 244
Expiring within 1 year 234 166 206
Expiring > 1 year 80 41 38
Digital 103 84 132
© Mindtree 2018 Page 9 of 12
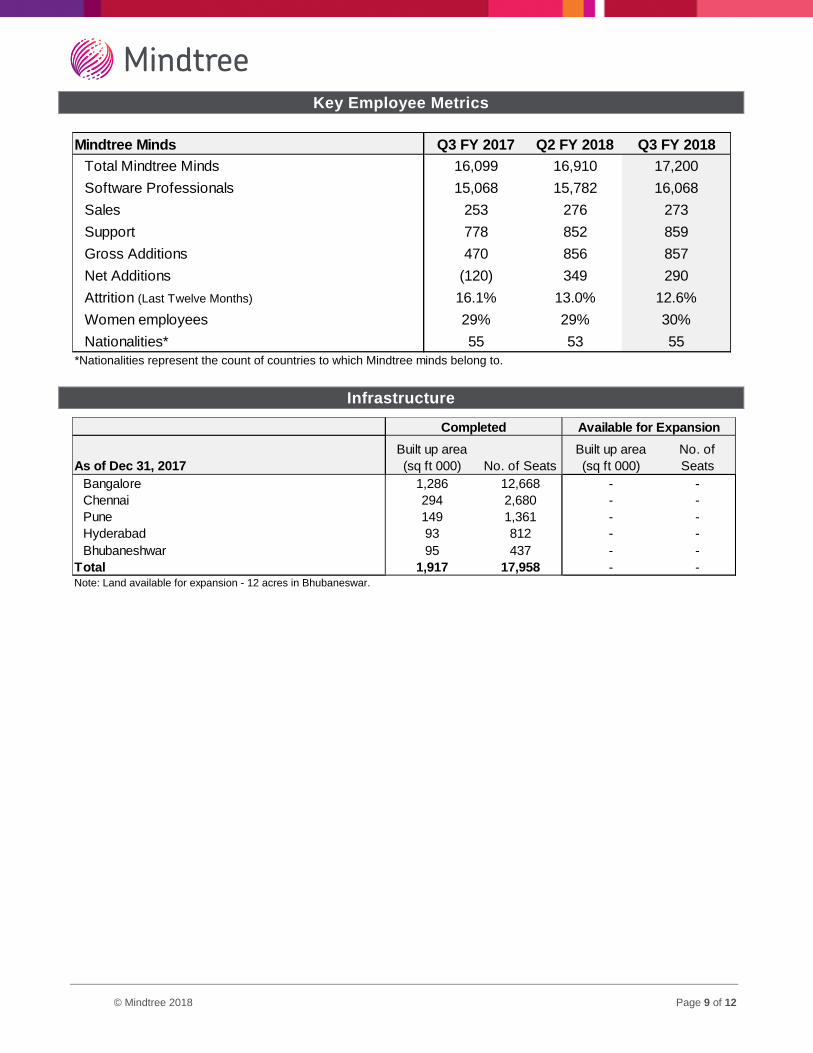
Key Employee Metrics
Mindtree Minds Q3 FY 2017 Q2 FY 2018 Q3 FY 2018
Total Mindtree Minds 16,099 16,910 17,200
Software Professionals 15,068 15,782 16,068
Sales 253 276 273
Support 778 852 859
Gross Additions 470 856 857
Net Additions (120) 349 290
Attrition (Last Twelve Months) 16.1% 13.0% 12.6%
Women employees 29% 29% 30%
Nationalities* 55 53 55
*Nationalities represent the count of countries to which Mindtree minds belong to.
Infrastructure
As of Dec 31, 2017
Built up area
(sq ft 000) No. of Seats
Built up area
(sq ft 000)
No. of
Seats
Bangalore 1,286 12,668 - -
Chennai 294 2,680 - -
Pune 149 1,361 - -
Hyderabad 93 812 - -
Bhubaneshwar 95 437 - -
Total 1,917 17,958 - -Note: Land available for expansion - 12 acres in Bhubaneswar.
Completed Available for Expansion
© Mindtree 2018 Page 10 of 12
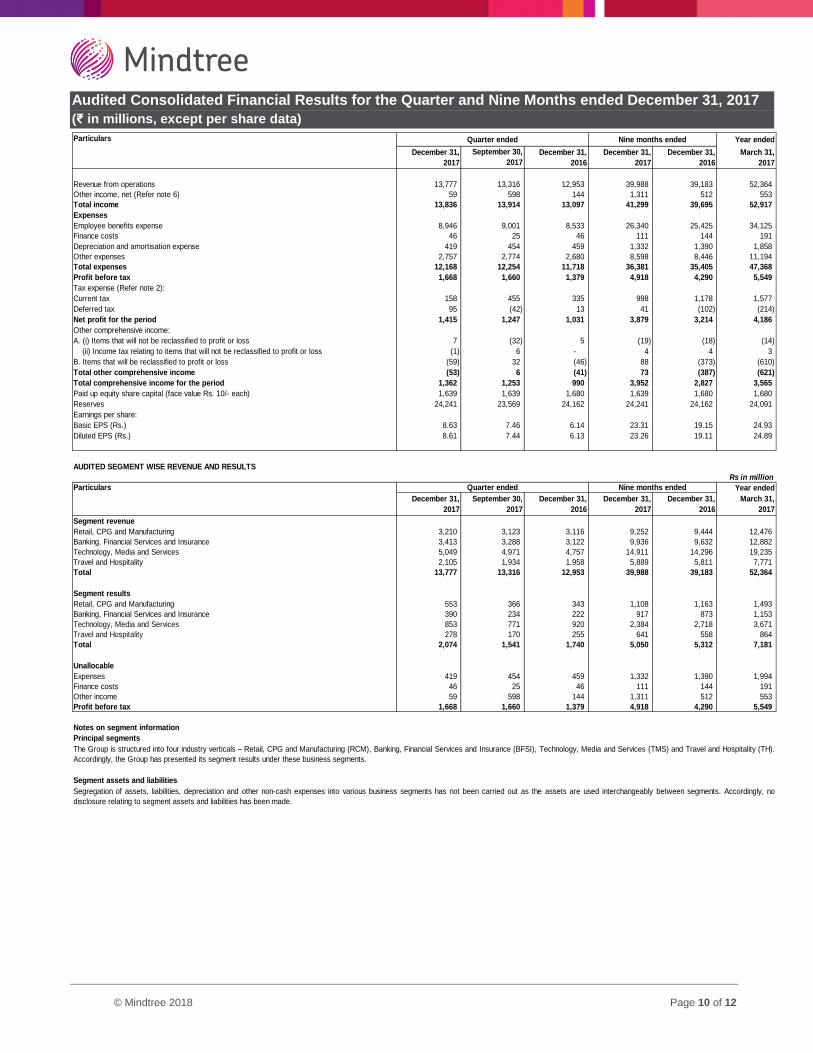
Audited Consolidated Financial Results for the Quarter and Nine Months ended December 31, 2017
(₹ in millions, except per share data)
Particulars Year ended
December 31,
2017
September 30,
2017
December 31,
2016
December 31,
2017
December 31,
2016
March 31,
2017
Revenue from operations 13,777 13,316 12,953 39,988 39,183 52,364
Other income, net (Refer note 6) 59 598 144 1,311 512 553
Total income 13,836 13,914 13,097 41,299 39,695 52,917
Expenses
Employee benefits expense 8,946 9,001 8,533 26,340 25,425 34,125
Finance costs 46 25 46 111 144 191
Depreciation and amortisation expense 419 454 459 1,332 1,390 1,858
Other expenses 2,757 2,774 2,680 8,598 8,446 11,194
Total expenses 12,168 12,254 11,718 36,381 35,405 47,368
Profit before tax 1,668 1,660 1,379 4,918 4,290 5,549
Tax expense (Refer note 2):
Current tax 158 455 335 998 1,178 1,577
Deferred tax 95 (42) 13 41 (102) (214)
Net profit for the period 1,415 1,247 1,031 3,879 3,214 4,186
Other comprehensive income:
A. (i) Items that will not be reclassified to profit or loss 7 (32) 5 (19) (18) (14)
(ii) Income tax relating to items that will not be reclassified to profit or loss (1) 6 - 4 4 3
B. Items that will be reclassified to profit or loss (59) 32 (46) 88 (373) (610)
Total other comprehensive income (53) 6 (41) 73 (387) (621)
Total comprehensive income for the period 1,362 1,253 990 3,952 2,827 3,565
Paid up equity share capital (face value Rs. 10/- each) 1,639 1,639 1,680 1,639 1,680 1,680
Reserves 24,241 23,569 24,162 24,241 24,162 24,091
Earnings per share:
Basic EPS (Rs.) 8.63 7.46 6.14 23.31 19.15 24.93
Diluted EPS (Rs.) 8.61 7.44 6.13 23.26 19.11 24.89
AUDITED SEGMENT WISE REVENUE AND RESULTS
Rs in million
Particulars Year ended
December 31,
2017
September 30,
2017
December 31,
2016
December 31,
2017
December 31,
2016
March 31,
2017
Segment revenue
Retail, CPG and Manufacturing 3,210 3,123 3,116 9,252 9,444 12,476
Banking, Financial Services and Insurance 3,413 3,288 3,122 9,936 9,632 12,882
Technology, Media and Services 5,049 4,971 4,757 14,911 14,296 19,235
Travel and Hospitality 2,105 1,934 1,958 5,889 5,811 7,771
Total 13,777 13,316 12,953 39,988 39,183 52,364
Segment results
Retail, CPG and Manufacturing 553 366 343 1,108 1,163 1,493
Banking, Financial Services and Insurance 390 234 222 917 873 1,153
Technology, Media and Services 853 771 920 2,384 2,718 3,671
Travel and Hospitality 278 170 255 641 558 864
Total 2,074 1,541 1,740 5,050 5,312 7,181
Unallocable
Expenses 419 454 459 1,332 1,390 1,994
Finance costs 46 25 46 111 144 191
Other income 59 598 144 1,311 512 553
Profit before tax 1,668 1,660 1,379 4,918 4,290 5,549
Notes on segment information
Principal segments
Segment assets and liabilities
The Group is structured into four industry verticals – Retail, CPG and Manufacturing (RCM), Banking, Financial Services and Insurance (BFSI), Technology, Media and Services (TMS) and Travel and Hospitality (TH).
Accordingly, the Group has presented its segment results under these business segments.
Segregation of assets, liabilities, depreciation and other non-cash expenses into various business segments has not been carried out as the assets are used interchangeably between segments. Accordingly, no
disclosure relating to segment assets and liabilities has been made.
Nine months endedQuarter ended
Quarter ended Nine months ended
© Mindtree 2018 Page 11 of 12
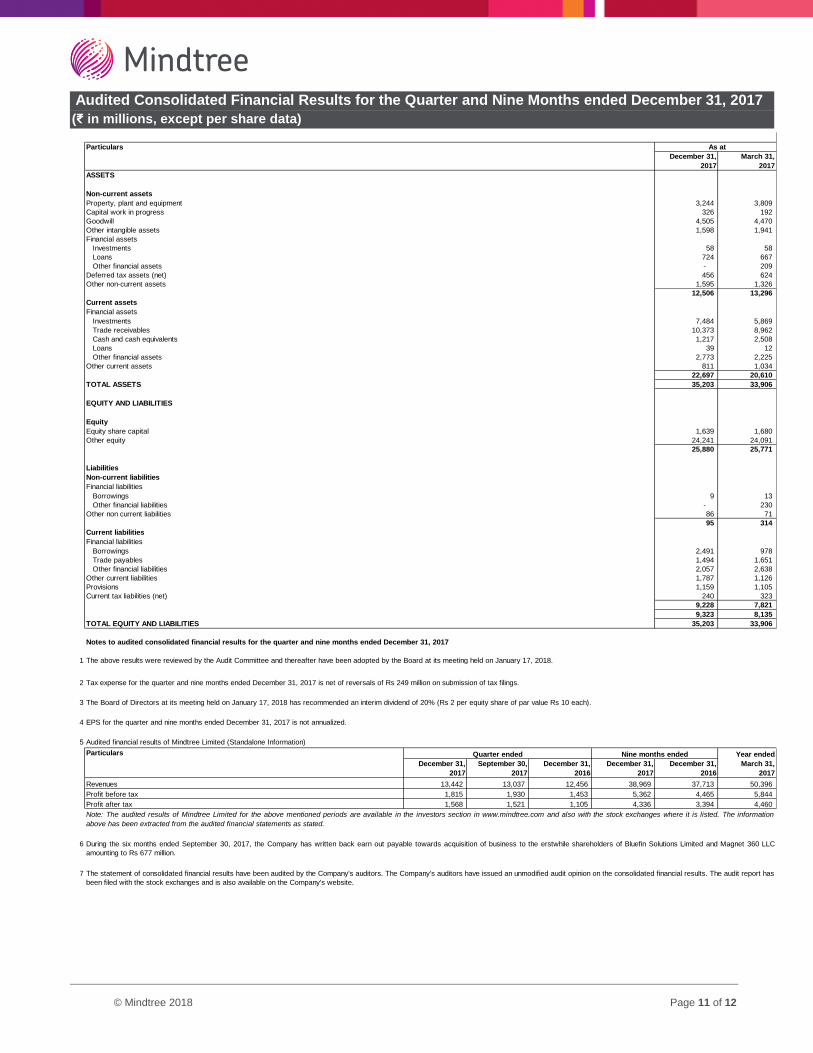
Audited Consolidated Financial Results for the Quarter and Nine Months ended December 31, 2017
(₹ in millions, except per share data)
December 31,
2017
March 31,
2017
ASSETS
Non-current assets
Property, plant and equipment 3,244 3,809
Capital work in progress 326 192
Goodwill 4,505 4,470
Other intangible assets 1,598 1,941
Financial assets
Investments 58 58
Loans 724 667
Other financial assets - 209
Deferred tax assets (net) 456 624
Other non-current assets 1,595 1,326
12,506 13,296
Current assets
Financial assets
Investments 7,484 5,869
Trade receivables 10,373 8,962
Cash and cash equivalents 1,217 2,508
Loans 39 12
Other financial assets 2,773 2,225
Other current assets 811 1,034
22,697 20,610
TOTAL ASSETS 35,203 33,906
EQUITY AND LIABILITIES
Equity
Equity share capital 1,639 1,680
Other equity 24,241 24,091
25,880 25,771
Liabilities
Non-current liabilities
Financial liabilities
Borrowings 9 13
Other financial liabilities - 230
Other non current liabilities 86 71
95 314
Current liabilities
Financial liabilities
Borrowings 2,491 978
Trade payables 1,494 1,651
Other financial liabilities 2,057 2,638
Other current liabilities 1,787 1,126
Provisions 1,159 1,105
Current tax liabilities (net) 240 323
9,228 7,821
9,323 8,135
TOTAL EQUITY AND LIABILITIES 35,203 33,906
Notes to audited consolidated financial results for the quarter and nine months ended December 31, 2017
1
2 Tax expense for the quarter and nine months ended December 31, 2017 is net of reversals of Rs 249 million on submission of tax filings.
3
4 EPS for the quarter and nine months ended December 31, 2017 is not annualized.
5 Audited financial results of Mindtree Limited (Standalone Information)
Particulars Year ended
December 31,
2017
September 30,
2017
December 31,
2016
December 31,
2017
December 31,
2016
March 31,
2017
Revenues 13,442 13,037 12,456 38,969 37,713 50,396
Profit before tax 1,815 1,930 1,453 5,362 4,465 5,844
Profit after tax 1,568 1,521 1,105 4,336 3,394 4,460
6
7
Particulars As at
The above results were reviewed by the Audit Committee and thereafter have been adopted by the Board at its meeting held on January 17, 2018.
Note: The audited results of Mindtree Limited for the above mentioned periods are available in the investors section in www.mindtree.com and also with the stock exchanges where it is listed. The information
above has been extracted from the audited financial statements as stated.
The statement of consolidated financial results have been audited by the Company's auditors. The Company's auditors have issued an unmodified audit opinion on the consolidated financial results. The audit report has
been filed with the stock exchanges and is also available on the Company's website.
During the six months ended September 30, 2017, the Company has written back earn out payable towards acquisition of business to the erstwhile shareholders of Bluefin Solutions Limited and Magnet 360 LLC
amounting to Rs 677 million.
Quarter ended Nine months ended
The Board of Directors at its meeting held on January 17, 2018 has recommended an interim dividend of 20% (Rs 2 per equity share of par value Rs 10 each).
For more information please contact:
Sushanth Pai
Mindtree Limited
Safe Harbor:
Certain statements in this release concerning our future growth prospects are forward-looking statements, which involve
a number of risks, and uncertainties that could cause our actual results to differ materially from those in such forward-
looking statements. We do not undertake to update any forward-looking statement that may be made from time to time by
us or on our behalf.