Miltefosine inhibits the membrane remodeling caused by ...
37
Journal Pre-proof Miltefosine inhibits the membrane remodeling caused by phospholipase action by changing membrane physical properties Yenisleidy de las Mercedes Zulueta Díaz, Ernesto Esteban Ambroggio, María Laura Fanani PII: S0005-2736(20)30249-2 DOI: https://doi.org/10.1016/j.bbamem.2020.183407 Reference: BBAMEM 183407 To appear in: BBA - Biomembranes Received date: 25 April 2020 Revised date: 23 June 2020 Accepted date: 29 June 2020 Please cite this article as: Y. de las Mercedes Zulueta Díaz, E.E. Ambroggio and M.L. Fanani, Miltefosine inhibits the membrane remodeling caused by phospholipase action by changing membrane physical properties, BBA - Biomembranes (2020), https://doi.org/ 10.1016/j.bbamem.2020.183407 This is a PDF file of an article that has undergone enhancements after acceptance, such as the addition of a cover page and metadata, and formatting for readability, but it is not yet the definitive version of record. This version will undergo additional copyediting, typesetting and review before it is published in its final form, but we are providing this version to give early visibility of the article. Please note that, during the production process, errors may be discovered which could affect the content, and all legal disclaimers that apply to the journal pertain. © 2020 Published by Elsevier.
Transcript of Miltefosine inhibits the membrane remodeling caused by ...

Journal Pre-proof
Miltefosine inhibits the membrane remodeling caused byphospholipase action by changing membrane physical properties
Yenisleidy de las Mercedes Zulueta Díaz, Ernesto EstebanAmbroggio, María Laura Fanani
PII: S0005-2736(20)30249-2
DOI: https://doi.org/10.1016/j.bbamem.2020.183407
Reference: BBAMEM 183407
To appear in: BBA - Biomembranes
Received date: 25 April 2020
Revised date: 23 June 2020
Accepted date: 29 June 2020
Please cite this article as: Y. de las Mercedes Zulueta Díaz, E.E. Ambroggio and M.L.Fanani, Miltefosine inhibits the membrane remodeling caused by phospholipase actionby changing membrane physical properties, BBA - Biomembranes (2020), https://doi.org/10.1016/j.bbamem.2020.183407
This is a PDF file of an article that has undergone enhancements after acceptance, suchas the addition of a cover page and metadata, and formatting for readability, but it isnot yet the definitive version of record. This version will undergo additional copyediting,typesetting and review before it is published in its final form, but we are providing thisversion to give early visibility of the article. Please note that, during the productionprocess, errors may be discovered which could affect the content, and all legal disclaimersthat apply to the journal pertain.
© 2020 Published by Elsevier.

Jour
nal P
re-p
roof
1
Miltefosine inhibits the membrane remodeling caused by phospholipase action by changing
membrane physical properties
Yenisleidy de las Mercedes Zulueta Díaz a,b
, Ernesto Esteban Ambroggio a,b
and María Laura Fanani a,b
*
a Departamento de Química Biológica Ranwel Caputto, Facultad de Ciencias Químicas, Universidad
Nacional de Córdoba, Córdoba, Argentina.
b Centro de Investigaciones en Química Biológica de Córdoba (CIQUIBIC), CONICET, Haya de la
Torre y Medina Allende, Ciudad Universitaria, X5000HUA, Córdoba, Argentina.
* Corresponding author: María Laura Fanani, [email protected]; tel +54-351-5353458.
Abstract: Miltefosine (hexadecylphosphocholine or HePC) is an alkylphosphocholine approved for
the treatment of visceral and cutaneous Leishmaniasis. HePC exerts its effect by interacting with
lipid membranes and affecting membrane-dependent processes. The molecular geometry of HePC
suggests that the pharmacological function of HePC is to alter membrane curvature. As a model
system, we studied the enzyme production in model membranes of diacylglycerol (DAG) or
ceramide (CER), lipids involved in cell signaling which alter the structure of membranes. Here, we
studied the effect of HePC on changes in phospholipase activity and on the effect that the lipid
products have on the curvature and fusogenicity of membranes where they accumulate. Our results
indicate that HePC inhibits the long-time restructuring of membranes, characteristic of the DAG
and CER enzyme formation processes. In addition, the drug also reduces the fusogenicity of
phospholipase-derived products. We postulate that the effect of HePC is due to a non-specific
geometric compensation of HePC to the inverted cone-shape of DAG and CER products, acting as a
relaxation agent of membrane curvature stress. These data are important for understanding the
Journal Pre-proof

Jour
nal P
re-p
roof
2
mechanism of action by which HePC regulates the lipid metabolism and signal transduction
pathways in which these enzymes are involved.
Keywords: alkylphospholipids, phospholipase C, sphingomyelinase; lipid membrane curvature,
liposome aggregation, liposome fusion.
Abbreviations: DOPC: dioleoylphosphatidylcholine; DOPE: dioleoylphosphatidylethanolamine;
POPC: 1-palmitoyl-2-oleoyl-glycero-3-phosphocholine, DAG: diacylglycerol; CER: ceramide; SM:
sphingomyelin; HePC; Hexadecylphosphocholine or miltefosine, SMase: sphingomyelinase; PLC:
Phospholipase C; TLC: thin-plate chromatography, DLS: dynamic light scattering; GUVs: giant
unilamellar vesicles; LUVs: large unilamellar vesicles.
1. Introduction
Miltefosine or hexadecylphosphocholine (HePC) is an alkyllysophospholipid analog. Along with
other alkylphospholipid analog members, HePC was originally developed as an antitumor agent in
the late 1980s. Even after HePC was approved for the treatment of cutaneous metastases in breast
cancer patients, it was found clinically ineffective [1]. However, further studies demonstrated that
HePC is active against most Leishmania species, including those that cause cutaneous disease.
HePC, sold under the trade name Impavido® among others, is used against the cutaneous, mucosal
and visceral forms of Leishmaniasis in different countries [1–5]. This treatment shows several side
effects including vomiting, abdominal pain, fever, headaches, and decreased kidney function.
Currently, HePC–based treatments are studied in 42 clinical trials reported in the U.S. National
Library of Medicine (NLM-NIH) (ClinicalTrials.gov). 38 of them are for less aggressive treatment
of Leishmaniasis in its different forms, and one for cancer therapy.
Journal Pre-proof

Jour
nal P
re-p
roof
3
HePC mechanism of action against both Leishmania parasites and human cancer cells links its
activity mainly to (i) apoptosis and (ii) disturbance of lipid-dependent cell signaling pathways[5]. In
all cases, HePC action involves insertion into the plasma membrane as a prerequisite for drug
uptake before the active molecule reaches its intracellular targeting. In mammalian cell cultures,
HePC is most effective in metabolically active, proliferating cells, such as cancer cells, but not in
quiescent normal cells [2]. HePC is active against most species of Leishmania, but not all [5]. At
plasma membrane level, L. donovani, the causative species on the Indian subcontinent and in
eastern Africa, show a prevalence of phosphatidylethanolamine (PE) over phosphatidylcholine (PC)
and sphingomyelin (SM) [6]. This contrast with the occurrence in the mammalian cells plasma
membrane, where PC prevails over SM and PE [7]. Notably, a transient treatment of Leishmania
parasites with HePC enhances the PE and reduces PC content in the plasma membrane.
HePC affects the biosynthesis of PC by inhibiting the rate-limiting enzyme CTP:phosphocholine
cytidylyltransferase (CT) and altering intracellular cholesterol traffic and metabolism in human
tumor cell lines [2,4,6,8]. HePC was also responsible for an apoptosis-like death in L. donovani,
both in the promastigotes and amastigotes forms [9]. This drug interferes with phospholipid
metabolism that is differentially expressed in HePC-susceptible and HePC-resistant L. donovani
[10]. Different than mammalian cells, cholesterol is not biosynthesized in Leishmania parasites,
which have to take it up from the external medium. Ergosterol, is also present in Leishmania
membranes, due to biosynthesis. Total sterols account for as much as 43.3 % w/w of neutral lipids
[11]. It has been reported that HePC has strong affinity for sterols [9,12,13] and HePC transiently
treated parasites show an increase in its cholesterol content [6]. It is worth noting that both lipids
increased after HePC transient treatment (PE and cholesterol) have in common its capacity for
promoting non-lamellar lipid phases [14,15].
Early reports demonstrated that the activity of several enzymes of central relevance in lipid
homeostasis and cell signaling are highly regulated by the presence of non-lamellar forming lipids.
An increase in the content of the nonlamellar-phase prone lipids PE or diacylglycerol (DAG) on
Journal Pre-proof

Jour
nal P
re-p
roof
4
lipid membranes triggers the binding of several cytosolic proteins, whose membrane forms are
metabolically active. The mechanism governing this effect correlates with an increase in the
membrane’s stored curvature and responds to an increased surface hydrophobicity and dehydration
[16–18]. This is the case of CT and DAG kinase [16,19,20], protein kinase C [17,21], G protein
[22–24], and other important enzymes that regulate lipid metabolism, including several
phospholipases [19,25,26]. In this context, it is conceivable that specific therapies could be
designed on the basis of regulating membrane lipid structure [15]. Destabilization of nonlamellar
membrane structures by the cytotoxic drug daunomycin has been demonstrated to promote G-
protein and PKC dissociation from the plasma membrane and disruption of cellular signaling
pathways [27].
It was proposed that HePC acts on CT activity by disrupting membrane curvature elastic stress and
inhibiting membrane-associated protein activity. Dymond et al. [28] evaluated the structure-activity
relationship of alkyllysophospholipids from the literature and provided a theoretical framework for
the hypothesis, which predicts that the most potent alkyllysophospholipid analogs will be in the
type I lipid group. Type I lipids form aggregates whose polar–apolar interface curves away from the
aqueous domains, which is commonly reported as ―positive‖ curvature structures, like micelles.
HePC shows a cone-like shape and was determined to belong to type I, favoring micelles and small
lamellar structures [12,28]. On the other hand, inverted-cone lipids (e.g. PE) forms non-lamellar
structures with ―negative‖ curvature, such as hexagonal o cubic phases [14]. The combination of
both groups of non-lamellar prone lipids (conic and inverted-conic shaped) would compensate their
geometric constrains stabilizing planar lamellar phases. Direct evidence of the HePC capacity of
perturbing highly ‖negative‖ curved lipid structures has been provided by Malheiros [29]. In this
thesis, the addition of only 5 % w/w of HePC to cubosomes disrupts its cubic crystalline structure.
Previous reports from our laboratory and others [12,30–32] demonstrate that the incorporation of
HePC into the lipid interface results in changes of the physical properties of the host membrane. In
the present work, we test the capacity of HePC to alter the high curved membrane structures
Journal Pre-proof

Jour
nal P
re-p
roof
5
induced by the enzyme production of DAG and ceramide (CER), both cataloged as lamellar
disrupting lipids. These important lipid second messengers are produced by the action of
phospholipase C (PLC) and sphingomyelinase (SMase), respectively, and have an inverted-cone
geometry. Their membrane accumulation induces the restructuring of the lipid bilayers into
aggregates containing non-lamellar structures with high surface curvature [26,33–36], affecting
various cellular processes including those that involves membrane fusion [16,37]. Furthermore,
direct evidence has been reported that enzymatically-induced changes in lipid composition regulate
the fusion between the plasma membrane and liposomes [38]. In turn, those changes in curvature
stress have the potential to affect the action of other important actors in lipid metabolism and
signaling, as described above [16,19–22,24,39–41].
Enzymes related to lipid metabolism, such as phospholipases, are very susceptible to changes in the
physical properties of the membrane and, in turn, indirectly transmit information to other metabolic
pathways through structural and electrostatic changes or phase state alterations of the
biomembranes in which they act [33,41–44]. Based on these reports, here we study the effect of
HePC on phospholipase enzyme activity and on the membrane physical property changes that the
phospholipase products induce. Our hypothesis is that the membrane insertion of the amphiphilic
cone-shaped alkylphospholipid HePC either directly modulates membrane curvature or
compensates the stress generated by the inverted-cone shaped lipids produced by PLC or SMase.
We thus address not only the biochemical but also the biophysical changes that HePC exerts when
present in lipid membranes. Our results aid the understanding of the mechanism of action by which
HePC regulates the lipid metabolism and signal transduction pathways.
2. Materials and methods
2.1. Chemicals and reagents
Journal Pre-proof

Jour
nal P
re-p
roof
6
Miltefosine or Hexadecylphosphocholine (HePC), 1,2-dioleoyl-sn-glycero-3-phosphocholine
(DOPC), 1-palmitoyl-2-oleoyl-glycero-3-phosphocholine (POPC), 1,2-dioleoyl-sn-glycero-3-
phosphoethanolamine (DOPE) and Sphingomyelin (Brain, Bovine) (SM) were purchased from
Avanti Polar Lipids, Inc. (Alabama, U.S.A.). Fluorescent probes 1,2-dioleoyl-sn-glycerol-3-
phosphoethanolamine-N-lysamine rhodamine B sulfonyl) (ammonium salt) (Rho-PE) and
phosphatidylethanolamine-N- (7-nitro-2-1,3-benzoxadiazol-4-yl) (NBD-PE) were from Avanti
Polar Lipids, Inc. (Alabama, U.S.A.). For enzyme activity studies, the enzymes sphingomyelinase
(SMase) from Bacillus cereus (EC 3.1.4.12) and phospholipase C (PLC) from porcine pancreas (EC
3.1.1.4) were used. Both were purchased from Sigma-Aldrich (St. Louis, MO). All other reagents,
chloroform, methanol, acetic acid, sodium chloride, Tris-Base and HPTLC (high-performance thin-
layer chromatography) silica gel 60 aluminum plates (Kieselgel 60), were purchased from Merck
(Darmstadt, Germany). Hexane and petroleum ether were from Sintorgan (Argentina). All reagents
were analytical grade (99% Pure) and used without further purification. Deionized water, with a
resistivity of ~ 18 MΩ cm, was obtained from a Milli-Q Gradient System (Millipore, Bedford, MA).
2.2 Methods
2.2.1 Vesicles preparation
Multilamellar vesicles (MLVs) containing SM:DOPE (70:30 molar ratio) or DOPC:DOPE (80:20
molar ratio) were used in the absence and presence of 20 mol% of HePC. The MLVs were prepared
by generating a uniform lipid film on the wall of a glass test tube. For this, 160 nmol of lipid or
lipid/HePC mixtures were placed into glass tubes from a chloroform lipid solution and drayed by
solvent evaporation under an N2 (g) stream. Traces of solvent were removed during 2 h treatment in
a high vacuum chamber. The lipids were hydrated with 400 L of a buffer solution containing 10
mM HEPES, 200 mM NaCl, 10 mM CaCl2, at pH 7 for PLC studies and with the addition of 2 mM
MgCl2 for SMase. The samples were vigorously mixed for two min and subjected to five freeze-
thaw cycles (−195°C in liquid nitrogen and 60°C in a heating bath, respectively). Each procedure
Journal Pre-proof

Jour
nal P
re-p
roof
7
was maintained for 2 min. Large unilamellar vesicles (LUVs) were prepared by extrusion (21 times)
of MLVs through polycarbonate filters of 100 nm pore size at 45°C. The liposomes samples were
kept at room temperature (22±2C) and used within 8 h. For fluorescent measurements, appropriate
aliquots of the fluorescent probe Rho-PE were added to the chloroform lipid suspension, reaching 1
mol%.
GUVs were prepared by electroformation. Briefly, 7 μL of a lipid (POPC or bbSM) or lipid/HePC
solution (0.5 mg/mL in chloroform: methanol 2:1 v/v), doped with 1 mol% of the fluorescent probe
NBD-PE, were spread onto two stainless steel plates as described in the Ref. [45]. The plates were
subjected to vacuum (1 h) to remove any remaining traces of organic solvent. The lipids were
hydrated with a 300 mOsm sucrose solution previously filtered and heated to 60°C. The electrodes
were connected to a homemade function generator applying potential for 1 h at 37°C for POPC or 2
h at 60°C for bbSM vesicles, respectively. Initially, a sine wave potential of 10 Hz was applied,
with amplitude from 0 to 2.6 V peak-to-peak potential increasing linearly in 60 s (Bartlett
modulation), which was afterward maintained at 2.6 V peak-to-peak potential [45].
2.2.2 Enzyme Activity
LUVs containing DOPC:DOPE (80:20 molar ratio) or SM:DOPE (70:30 molar ratio) in the absence
and presence of 20 mol% of HePC to reach a 400 μM total lipid concentration, were incubated with
PLC (7.5 x 10⁻³
U/ml) or Bacillus cereus SMase (1.4 U/mL) at 37°C. For temperature and stirring
control, a Quantum Northwest (Liberty Lake, WA) TC 125 temperature controller system was used.
Aliquots of this suspension were taken at regular intervals and chloroform:methanol (2:1) was
added. The lower phase of the extraction system was evaporated, and the samples subjected to TLC.
Chloroform:methanol:water (100:42:6, v/v/v) was run up to approximately one-third of the plates to
separate PC from SM, and, after drying the plates, chloroform:methanol:acetic acid (96:4.1, v/v/v)
was run up to the top of the plates to isolate the CER. For PLC the same procedure was used, but
using chloroform:methanol:water (60:30:5 v/v/v) to separate DOPC and DOPE, and further
Journal Pre-proof

Jour
nal P
re-p
roof
8
treatment with hexane:ethyl ether:acetic acid (80:20:2 v/v/v) was necessary to separate DAG. For
lipid identification and quantification, the plates were submerged into an aqueous solution of 3%
p/v cupric acetate, 8% v/v phosphoric acid and heated up to 90°C. Lipid semi-quantification was
performed using the ImageJ 1.43u program (NIH).
2.2.3 Effects of phospholipases on vesicle size
Spectrophotometry and vesicle size distribution data were obtained using LUV preparations
containing SM:DOPE or DOPC:DOPE in the absence or presence of 20 mol% of HePC, as
described above. Samples were taken immediately before (t=0) and at specified incubation times
after phospholipase addition. The absorbance of each sample was measured using a UV-visible
spectrophotometer (Shimadzu UV-2401PC). Absorbance curves vs. time were measure at ʎ = 500
nm with a slit width of 1 nm at 37°C.
Changes in vesicle size distribution profiles resulting from PLC or SMase action were followed by
dynamic light scattering (DLS) analysis, using a Submicron Particle Sizer (Nicomp 380, Santa
Barbara, CA). Before enzyme treatment, LUV preparations showed a bell-shape size distribution
centered at 100 nm. Particle size distribution profiles were traced at the different incubation times
after PLC or SMase addition. The percentage of the volume of lipid particles larger than 250 nm
was calculated from size distribution tracings by relating the peak areas corresponding to lipid
particle populations greater than 250 nm to the total area.
2.2.4 Confocal microscopy visualization of giant unilamellar vesicles (GUVs)
A small aliquot of the GUV suspension (50 μL) was transferred to an 8-well observation chamber
(Lab-Tek, Thermo Fisher Scientific, Inc.NYSE:TMO) and diluted with 300 mOsm 10mM HEPES,
200mM NaCl, 10mM CaCl2, 2mM MgCl2 or 10mM HEPES, 200mM NaCl, 10 mM CaCl2 at pH 7
buffer for SMase or PLC experiments, respectively. The sucrose and buffer solutions were checked
for isosmolarity with an Automatic Micro-Osmometer OM-806, (VOGEL GmbH & Co.KG,
Journal Pre-proof

Jour
nal P
re-p
roof
9
Giessen, Germany). Before GUV addition to the well, the glass of the observation chamber was
treated with a 10 mg/mL BSA solution, which prevented GUV rupture onto the slide. The excess of
BSA was eliminated by several washes with buffer. The GUVs were observed with a fluorescence
confocal microscope (Olympus FV 1000, Tokyo, Japan) with a 60x oil objective.
For experiments to study the fusion of LUVs to GUVs, the GUVs in sucrose/buffers were mixed
with the LUV suspension 2:1 (v/v) and this was left for 10 min before imaging by confocal
fluorescence microscopy. GUVs doped with NBD-PE and LUVs doped with Rho-PE were
visualized and fluorescence energy transfer was detected by selecting three different imaging
channels; (i) the direct donor (NBD-PE) excitation at 488 nm and emission at 500-545 nm, (ii)
donor excitation at 488 nm and acceptor (DPPE-Rh) emission at 600-700 nm, and (iii) direct
acceptor excitation at 543 nm and emission at 600-700 nm. The laser power was kept at a minimum
to allow a sufficient signal while avoiding bleaching. Confocal Images of GUVs were processed
and quantified with the FIJI ImageJ software (NIH, USA).
2.2.5. Statistical treatment
Results are expressed as the mean±standard error of the mean (SEM) for three different
experiments. Statistical comparisons were calculated by Student’s t-test using the GraphPad
QuickCalcs Web site: http://www.graphpad.com/quickcalcs (GraphPad Software, San Diego, CA).
Values of P<0.05 or P<0.001 were considered to be statistically significant.
3. Results
3.1. HePC does not directly affect the enzyme activity of phospholipases (PLC and SMase).
We first analyzed the effect of HePC on the enzyme activity of PLC and SMase at short times
(initial velocity). The substrates used were LUVs composed of DOPC:DOPE or SM:DOPE to
Journal Pre-proof

Jour
nal P
re-p
roof
10
evaluate PLC and SMase activity, respectively. Both enzyme actions were reported in the 1990s as
resulting in membrane aggregation and restructuring due to the accumulation of products in the
membrane as DAG (PLC) or Cer (SMase). Those effects were enhanced by the presence of the non-
lamellar forming lipid PE [46,47].
The enzyme products were detected by TLC. When the LUVs composed of DOPC:DOPE were
treated with PLC, the presence of DAG appeared in the first 6 min and its progressive increase was
achieved, reaching 20 % of total DOPC hydrolysis both in the absence and presence of HePC
(Figure 1A). Also, reaction rates remained similar (no significant statistical difference, P0.1) being
3.27±0.04 U.ml-1
.min-1
(HePC absence) and 3.1±0.2 U.ml-1
.min-1
(HePC presence).
Figure 1: Reaction course of the enzymatic production of diacylglycerol (DAG) and ceramide
(CER), determined by thin-layer chromatography (TLC). A) PLC-driven conversion of
glycerophospholipids to DAG in liposomes containing DOPC:DOPE (80:20 molar ratio) with or
without the addition of 20 mol% of HePC. B) SMase-driven conversion of sphingomyelin (SM)
to CER in liposomes containing SM:DOPE (70:30 ratio) with or without the addition of 20 mol%
of HePC. A final lipid concentration of 0.4 mM was used. PLC (3 x 10⁻⁴
U / ml) or SMase (2.8 x
10-2
U / ml) were added at t = 0. Incubation proceeded at 37°C for the indicated intervals, until
stopped by the addition of the solvents required for lipid extraction. Experimental data
correspond to the formation of DAG or CER in the absence (black symbols) and presence of
HePC (open symbols, respectively). Error bars correspond to SD of a triplicate experiment.
A) PLC
Time (min)
0 2 4 6
% D
AG
0
5
10
15
20
25
Col 1 vs % DAG -HePC
Plot 1 Regr
Col 1 vs % DAG + HePC
Plot 2 Regr
-HePC+HePC
B) SMase
Time (min)
0 2 4 6 8 10
% C
ER
0
5
10
15
20
25
30
35
Tiempo (min) vs %cer -HePC
Plot 1 Regr
Tiempo (min) vs %cer +HePC
Plot 2 Regr
-HePC+HePC
Journal Pre-proof

Jour
nal P
re-p
roof
11
A similar situation was observed for SMase activity on SM:DOPE LUVs. The formation of CER
(Figure 1B) reached 20 - 30% of product formation in the first 10 minutes of the reaction. The
reaction rates obtained were 3.1±0.2 and 2.2±0.1 (U.ml-1
.min-1
) in the absence and presence of
HePC, respectively. This indicates a statistically significant inhibition (29%; P<0.05) of the reaction
rate by HePC.
3.2. HePC inhibits PLC and SMase induced liposome fusion
We explored the capacity of HePC to alter the highly curved membrane structures induced by the
DAG and CER lipids. Such inverted-cone-shaped lipids are produced by the action of PLC or
SMase on the outer hemilayer of the liposomes. Therefore, the lipid products accumulate
asymmetrically in the membrane until the flip-flop process dissipates this translayer concentration
gradient. Flip-flop rates for CER and DAG are in the order of ms or longer, and are somewhat
greater for DAG than for CER [48]. Therefore, this process is on a similar time scale to that of the
phospholipase constant rates [49,50]. This induces transient lateral curvature stresses at the
membrane, which relax by restructuring the membrane through processes like fusion or aggregation
where a non-lamellar intermediate occurs [34,35,51,52].
In this section, liposome fusion/aggregation processes after enzyme treatment were indirectly
assessed by turbidimetry. This effect responds to an increase in lipid particle size (from 100 nm
diameter to micrometric-size particles) that increases dispersion of light at 500 nm. Therefore, we
analyzed the lipid particle size change by dynamic light scattering (DLS).
When PLC is added to LUVs composed of DOPC:DOPE, an increase in turbidity is observed
concomitant to DAG production (Figure 2A).
Journal Pre-proof

Jour
nal P
re-p
roof
12
Figure 2: PLC or SMase action on vesicle aggregation. Vesicle restructuring was evidenced by the
turbidimetry method obtaining absorbance curves vs time. (A, D) Liposome aggregation curves
(100 nm diameter) composed of DOPC:DOPE or SM:DOPE were exposed to PLC (7.5 x 10⁻³
U /
ml) (A) or SMase (1.4 U / ml) (D) at 37° C in absence (black line) and presence (blue or red line)
Time (min)
0 10 20 30 40 50 60
Ab
so
rban
ce
(5
00
nm
)
0.0
0.2
0.4
0.6
0.8
1.0
1.2
LUVs_DOPC_DOPE_PLC
LUVs_DOPC_DOPE_HePC_PLC
Time (min)
0 10 20 30 40
Ab
so
rba
nc
e (
50
0n
m)
0.0
0.2
0.4
0.6
0.8
1.0
LUVs_SM16_DOPE_SMasa 1,4 U/ml_37°C
LUVs_SM16_DOPE_HEPC_SMasa 1,4 U/ml_37°C
X Data
- HePC/10min
- HePC/40min
+HePC/10min
+ HePC/40 m
in
CE
R p
rod
uce
d (
%)
0
20
40
60
80
100
120
140
Col 2 Col 6
Col 2
Col 6
X Data
- HePC/10min
- HePC/40min
+HePC/10min
+ HePC/40 m
in
Ab
so
rba
nc
e (
50
0n
m)
0.0
0.1
0.2
0.3
0.4
0.5
0.6
0.7
Col 10
Col 14
Col 10
Col 14
X Data
- HePC/6min
- HePC/60min
+HePC/6min
+ HePC/60 m
in
DA
G p
rod
uc
ed
(%
)
0
20
40
60
80
100
Col 2 Col 6
Col 2
Col 6
X Data
- HePC/6min
- HePC/60min
+HePC/6min
+ HePC/60 m
in
Ab
so
rba
nc
e (
50
0n
m)
0.0
0.2
0.4
0.6
0.8
1.0
1.2
Col 10
Col 14
Col 10
Col 14
A
B
C
D
E
F
2D Graph 2
X Data
- HePC/6min
- HePC/60min
+HePC/6min
+ HePC/60 m
in
Ab
so
rba
nc
e (
50
0n
m)
0,0
0,2
0,4
0,6
0,8
1,0
1,2
Col 10
Col 14
Col 10
Col 14
2D Graph 4
X Data
- HePC/10min
- HePC/60min
+HePC/10min
+ HePC/60 m
in
Ab
so
rba
nc
e (
50
0n
m)
0,0
0,1
0,2
0,3
0,4
0,5
0,6
0,7
Col 10
Col 14
Col 10
Col 14
2D Graph 5
X Data
- HePC/10min
- HePC/40min
+HePC/10min
+ HePC/40 m
in
CE
R p
rod
uc
ed
(%
)
0
20
40
60
80
100
120
140
Col 2 Col 6
Col 2
Col 6
2D Graph 3
X Data
- HePC/6min
- HePC/60min
+HePC/6min
+ HePC/60 m
in
DA
G p
rod
uc
ed
(%
)
0
20
40
60
80
100
B
C
E
F
** *
*
* **
*
2D Graph 1
Time (min)
10 20 30 40
Ab
so
rba
nc
e (
500
nm
)
0,0
0,2
0,4
0,6
0,8
1,0
LUVs_SM16_DOPE_SMasa 1,4 U/ml_37°C
LUVs_SM16_DOPE_HEPC_SMasa 1,4 U/ml_37°C
B
2D Graph 1
Time (min)
0 10 20 30 40 50 60
Ab
so
rban
ce (
500n
m)
0,0
0,2
0,4
0,6
0,8
1,0
1,2
LUVs_DOPC_DOPE_PLC
LUVs_DOPC_DOPE_HePC_PLC
A
2D Graph 2
X Data
- HePC/6min
- HePC/60min
+HePC/6min
+ HePC/60 m
in
Ab
so
rba
nc
e (
50
0n
m)
0,0
0,2
0,4
0,6
0,8
1,0
1,2
Col 10
Col 14
Col 10
Col 14
2D Graph 4
X Data
- HePC/10min
- HePC/60min
+HePC/10min
+ HePC/60 m
in
Ab
so
rba
nc
e (
50
0n
m)
0,0
0,1
0,2
0,3
0,4
0,5
0,6
0,7
Col 10
Col 14
Col 10
Col 14
2D Graph 5
X Data
- HePC/10min
- HePC/40min
+HePC/10min
+ HePC/40 m
in
CE
R p
rod
uced
(%
)
0
20
40
60
80
100
120
140
Col 2 Col 6
Col 2
Col 6
2D Graph 3
X Data
- HePC/6min
- HePC/60min
+HePC/6min
+ HePC/60 m
in
DA
G p
rod
uc
ed
(%
)
0
20
40
60
80
100
B
C
E
F
** *
*
* **
*
2D Graph 1
Time (min)
10 20 30 40
Ab
so
rban
ce (
500n
m)
0,0
0,2
0,4
0,6
0,8
1,0
LUVs_SM16_DOPE_SMasa 1,4 U/ml_37°C
LUVs_SM16_DOPE_HEPC_SMasa 1,4 U/ml_37°C
B
2D Graph 1
Time (min)
0 10 20 30 40 50 60
Ab
so
rba
nc
e (
500
nm
)
0,0
0,2
0,4
0,6
0,8
1,0
1,2
LUVs_DOPC_DOPE_PLC
LUVs_DOPC_DOPE_HePC_PLC
A
PLC SMase
2D Graph 2
X Data
- HePC/6min
- HePC/60min
+HePC/6min
+ HePC/60 m
in
Ab
so
rba
nc
e (
50
0n
m)
0,0
0,2
0,4
0,6
0,8
1,0
1,2
Col 10
Col 14
Col 10
Col 14
2D Graph 4
X Data
- HePC/10min
- HePC/60min
+HePC/10min
+ HePC/60 m
in
Ab
so
rba
nc
e (
50
0n
m)
0,0
0,1
0,2
0,3
0,4
0,5
0,6
0,7
Col 10
Col 14
Col 10
Col 14
2D Graph 5
X Data
- HePC/10min
- HePC/40min
+HePC/10min
+ HePC/40 m
in
CE
R p
rod
uced
(%
)
0
20
40
60
80
100
120
140
Col 2 Col 6
Col 2
Col 6
2D Graph 3
X Data
- HePC/6min
- HePC/60min
+HePC/6min
+ HePC/60 m
in
DA
G p
rod
uced
(%
)
0
20
40
60
80
100
B
C
E
F
** *
*
* **
*
2D Graph 1
Time (min)
10 20 30 40A
bso
rban
ce (
500n
m)
0,0
0,2
0,4
0,6
0,8
1,0
LUVs_SM16_DOPE_SMasa 1,4 U/ml_37°C
LUVs_SM16_DOPE_HEPC_SMasa 1,4 U/ml_37°C
B
2D Graph 1
Time (min)
0 10 20 30 40 50 60
Ab
so
rban
ce (
500n
m)
0,0
0,2
0,4
0,6
0,8
1,0
1,2
LUVs_DOPC_DOPE_PLC
LUVs_DOPC_DOPE_HePC_PLC
A
2D Graph 2
X Data
- HePC/6min
- HePC/60min
+HePC/6min
+ HePC/60 m
in
Ab
so
rba
nc
e (
50
0n
m)
0,0
0,2
0,4
0,6
0,8
1,0
1,2
Col 10
Col 14
Col 10
Col 14
2D Graph 4
X Data
- HePC/10min
- HePC/60min
+HePC/10min
+ HePC/60 m
in
Ab
so
rba
nc
e (
50
0n
m)
0,0
0,1
0,2
0,3
0,4
0,5
0,6
0,7
Col 10
Col 14
Col 10
Col 14
2D Graph 5
X Data
- HePC/10min
- HePC/40min
+HePC/10min
+ HePC/40 m
in
CE
R p
rod
uced
(%
)0
20
40
60
80
100
120
140
Col 2 Col 6
Col 2
Col 6
2D Graph 3
X Data
- HePC/6min
- HePC/60min
+HePC/6min
+ HePC/60 m
in
DA
G p
rod
uc
ed
(%
)
0
20
40
60
80
100
B
C
E
F
** *
*
* **
*
2D Graph 1
Time (min)
10 20 30 40
Ab
so
rban
ce (
500n
m)
0,0
0,2
0,4
0,6
0,8
1,0
LUVs_SM16_DOPE_SMasa 1,4 U/ml_37°C
LUVs_SM16_DOPE_HEPC_SMasa 1,4 U/ml_37°C
B
2D Graph 1
Time (min)
0 10 20 30 40 50 60
Ab
so
rba
nc
e (
500
nm
)
0,0
0,2
0,4
0,6
0,8
1,0
1,2
LUVs_DOPC_DOPE_PLC
LUVs_DOPC_DOPE_HePC_PLC
A
2D Graph 2
X Data
- HePC/6min
- HePC/60min
+HePC/6min
+ HePC/60 m
in
Ab
so
rba
nc
e (
50
0n
m)
0,0
0,2
0,4
0,6
0,8
1,0
1,2
Col 10
Col 14
Col 10
Col 14
2D Graph 4
X Data
- HePC/10min
- HePC/60min
+HePC/10min
+ HePC/60 m
in
Ab
so
rba
nc
e (
50
0n
m)
0,0
0,1
0,2
0,3
0,4
0,5
0,6
0,7
Col 10
Col 14
Col 10
Col 14
2D Graph 5
X Data
- HePC/10min
- HePC/40min
+HePC/10min
+ HePC/40 m
in
CE
R p
rod
uced
(%
)
0
20
40
60
80
100
120
140
Col 2 Col 6
Col 2
Col 6
2D Graph 3
X Data
- HePC/6min
- HePC/60min
+HePC/6min
+ HePC/60 m
in
DA
G p
rod
uc
ed
(%
)
0
20
40
60
80
100
B
C
E
F
** *
*
* **
*
2D Graph 1
Time (min)
10 20 30 40
Ab
so
rban
ce (
500n
m)
0,0
0,2
0,4
0,6
0,8
1,0
LUVs_SM16_DOPE_SMasa 1,4 U/ml_37°C
LUVs_SM16_DOPE_HEPC_SMasa 1,4 U/ml_37°C
B
2D Graph 1
Time (min)
0 10 20 30 40 50 60
Ab
so
rba
nc
e (
500
nm
)
0,0
0,2
0,4
0,6
0,8
1,0
1,2
LUVs_DOPC_DOPE_PLC
LUVs_DOPC_DOPE_HePC_PLC
A
Journal Pre-proof

Jour
nal P
re-p
roof
13
of 20 mol% of HePC. The curves in A and D are representative of triplicate experiments. (B, E)
Comparison of absorbance values obtained at the indicated times after enzyme addition in the
absence (gray bars) and presence (blue or red bars) of HePC. (C, F) Quantification of DAG or
CER enzyme formation in the absence (gray bars) and presence of 20 mol% of HePC (blue and
red bars, respectively). In all cases, the total lipid concentration was 0.4 mM. The experiments
were performed in triplicate, average values ±SEM (n = 3). Asterisks indicate statistical
differences of data obtained in similar conditions in the absence and presence of HePC with P
<0.05 (*) or P <0.0001 (**).
This effect was first observed in the early 1990s by Felix Goñi et al. and was interpreted in terms of
liposome aggregation and fusion [46,47]. The addition of 20 mol% of HePC to our system clearly
showed a drastic decrease in vesicle aggregation, evidenced by a slower absorbance increase
observed after enzyme addition (Figure 2A). This effect was quantified at 6 and 60 min, showing a
decrease in absorbance in the presence of HePC of 95 and 82%, respectively, in comparison to
conditions in the absence of the drug (Figure 2B).
Additionally, there were no significant differences in the amount of DAG formation at 6 min in the
absence and presence of HePC (Figure 2C and 1A). This demonstrates that, even when a similar
amount of DAG is produced, HePC is impairing liposome fusion/aggregation. On the other hand,
after 60 min of enzyme treatment, DAG production was reduced to a fourth (from 68±9 % to 18±5
%, see Figure 2C), while vesicle aggregation, evidenced by an absorbance reduction, decreases to
less than a sixth by the presence of HePC (from 1.02±0.08 to 0.14±0.01, see Figure 2B). Therefore,
even when a significant amount of DAG is produced, its effect on membrane restructuring is still
hampered by HePC.
Early reports demonstrated that full PLC activity requires the presence of membrane surface
irregularities or defects induced by the product DAG causing vesicle aggregation [53]. Our results
show that HePC inhibits PLC activity when studied over long periods, concomitantly with
Journal Pre-proof

Jour
nal P
re-p
roof
14
inhibition of vesicle aggregation. Therefore, we infer that HePC acts indirectly on PLC activity by
somehow relaxing the curvature stress induced by DAG and thus inhibits full PLC activity.
Figure 3: Changes in vesicle size distribution profiles as a consequence of PLC or SMase action
followed by dynamic light scattering (DLS) analysis. Representative graphs of differences in the
population size distribution of lipid particles that initially contained DOPC:DOPE (A, B) or
2D Graph 4
Diameter (nm)
10 100 1000
Fre
qu
en
cy
0.0
0.2
0.4
0.6
0.8
1.0
LUVs SM16
:DOPE
LUVs SM16
:DOPE:SMasa
Diameter (nm)
10 100 1000 10000
Fre
qu
en
cy
0.0
0.2
0.4
0.6
0.8
1.0
LUVs DOPC:DOPE
LUVs DOPC:DOPE:PLC
2D Graph 3
X Data
- (PLC)10min
- (PLC) 6
0min
+ (PLC)10 m
in
+ (PLC) 6
0 min
- PLC 10 m
in
- PLC 60 m
in
+ PLC 10 m
in
+ PLC 60min
Vo
lum
e o
f lip
id p
art
icle
s
>250
nm
(%
)
0
20
40
60
80
100
Col 2 Col 2
Col 2
Col 2
Col 6
Col 6
Col 6
Col 6
-HePC +HePC
***
**
2D Graph 4
X Data
- (SMasa) 1
0min
- (SMasa) 4
0min
+ SMasa) 1
0 min
+ SMasa) 4
0 min
- SMasa 10 m
in
- SMasa 40 m
in
+ SMasa 10 m
in
+ SMasa 40 m
in
vo
lum
e o
f lip
id p
art
icle
s
>250 n
m (
%)
0
20
40
60
80
100
Col 2 Col 2
Col 2
Col 2
Col 6
Col 6
Col 6
Col 6
-HePC +HePC
*
C F
*
PLC SMase
Fre
qu
en
cy
A-HePC
Diameter (nm)
10 100 1000 10000
Fre
qu
en
cy
0.0
0.2
0.4
0.6
0.8
1.0
LUVs DOPC:DOPE:HePC
LUVs DOPC:DOPE:HePC:PLC
B+HePC
D-HePC
Diameter (nm)
10 100 1000 10000
Fre
qu
en
cy
0.0
0.2
0.4
0.6
0.8
1.0
LUVs_SM16:DOPC:HePC
LUVs_SM16:DOPC:HePC:SMasa
E+HePC
C F
Journal Pre-proof

Jour
nal P
re-p
roof
15
SM:DOPE (D, E) before (black symbols) and after 60 min of PLC or 40 min of SMase treatment
(colored symbols). Comparison of the size distribution of LUVs in the absence (A, D) and the
presence of 20 mol% HePC (B, E). The vertical dashed lines in A-B and D-E divide the particles
smaller than the larger than 250 nm. The data is the average values ± SEM of triplicate
experiments. (C, F) Analysis of the number of lipid particles larger than 250 nm as a percentage of
the total population, calculated as the integral of the particle volume distribution curves vs
diameter. Liposome and enzyme conditions are similar to those described in the legend of Figure
2. Asterisks in panels C and F indicate statistical differences of data with P <0.05 (*) or P <0.0001
(**).
The formation of large lipid particles by the action of PLC was confirmed by DLS (Figure 3A-C).
Both vesicles, containing HePC or not, showed a particles population, with a size distribution
centered at 100 nm before enzyme treatment (Figure 3A, black symbols). On the other hand, LUV
suspensions containing HePC showed a small population close to 10 nm (corresponding to less than
8% of the total particle volume), which are HePC-enriched micelles (Figure 3B, black symbols)
[12].
As can be observed from Figure 3, the liposomes of any composition were smaller than 250 nm
before enzymatic treatment (black symbols in Figure 3A, B, D and E). Therefore, the occurrence of
particles larger than 250 nm after the addition of enzymes has been taken as a consequence of
liposome aggregation upon the generation of CER or DAG.
The enzyme production of DAG by PLC induced the appearance of a population of large particles
(micrometric size), shifting the particle size distribution to a diameter range above 250 nm (Figure
3A, blue symbols). The presence of HePC reduces this effect (Figure 3B, blue symbols). A more
detailed analysis shows that in the presence of HePC only~ 45% of the particle volume was
organized in structures larger than 250 nm after treatment with PLC (Figure 3C). This matches the
turbidity measurements, indicating that HePC reduces the vesicle aggregation process induced by
the enzyme production of DAG.
Journal Pre-proof
Jour
nal P
re-p
roof
16
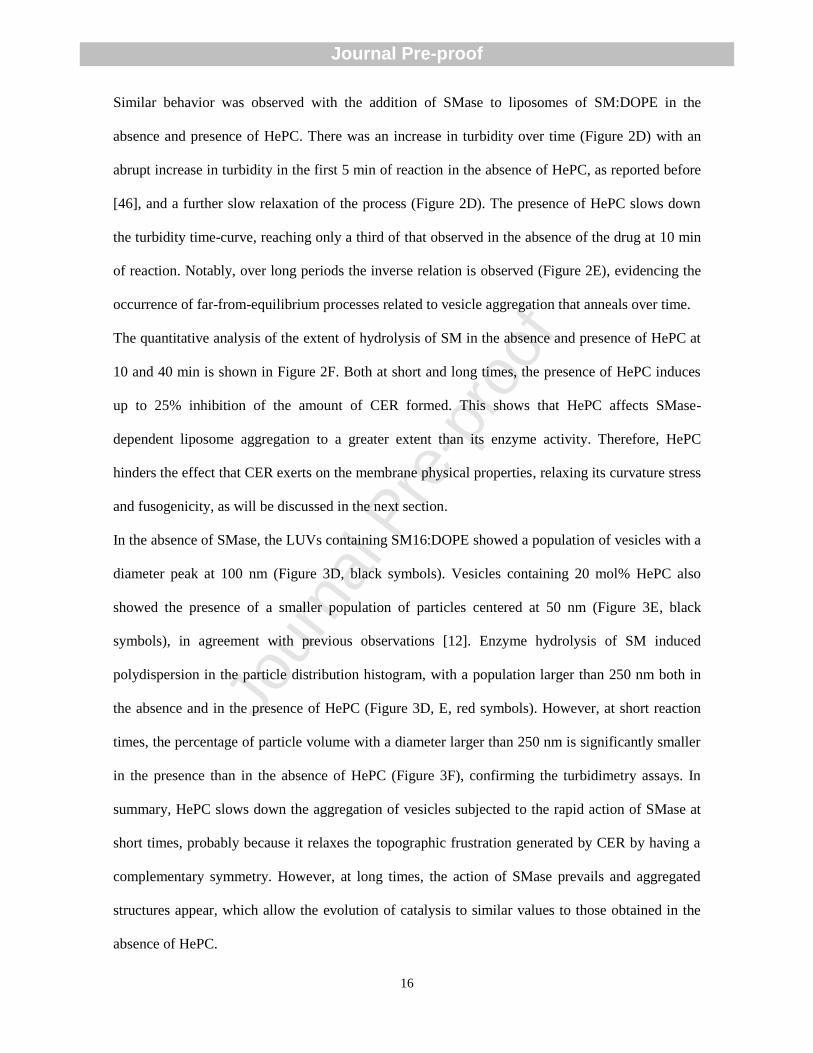
Similar behavior was observed with the addition of SMase to liposomes of SM:DOPE in the
absence and presence of HePC. There was an increase in turbidity over time (Figure 2D) with an
abrupt increase in turbidity in the first 5 min of reaction in the absence of HePC, as reported before
[46], and a further slow relaxation of the process (Figure 2D). The presence of HePC slows down
the turbidity time-curve, reaching only a third of that observed in the absence of the drug at 10 min
of reaction. Notably, over long periods the inverse relation is observed (Figure 2E), evidencing the
occurrence of far-from-equilibrium processes related to vesicle aggregation that anneals over time.
The quantitative analysis of the extent of hydrolysis of SM in the absence and presence of HePC at
10 and 40 min is shown in Figure 2F. Both at short and long times, the presence of HePC induces
up to 25% inhibition of the amount of CER formed. This shows that HePC affects SMase-
dependent liposome aggregation to a greater extent than its enzyme activity. Therefore, HePC
hinders the effect that CER exerts on the membrane physical properties, relaxing its curvature stress
and fusogenicity, as will be discussed in the next section.
In the absence of SMase, the LUVs containing SM16:DOPE showed a population of vesicles with a
diameter peak at 100 nm (Figure 3D, black symbols). Vesicles containing 20 mol% HePC also
showed the presence of a smaller population of particles centered at 50 nm (Figure 3E, black
symbols), in agreement with previous observations [12]. Enzyme hydrolysis of SM induced
polydispersion in the particle distribution histogram, with a population larger than 250 nm both in
the absence and in the presence of HePC (Figure 3D, E, red symbols). However, at short reaction
times, the percentage of particle volume with a diameter larger than 250 nm is significantly smaller
in the presence than in the absence of HePC (Figure 3F), confirming the turbidimetry assays. In
summary, HePC slows down the aggregation of vesicles subjected to the rapid action of SMase at
short times, probably because it relaxes the topographic frustration generated by CER by having a
complementary symmetry. However, at long times, the action of SMase prevails and aggregated
structures appear, which allow the evolution of catalysis to similar values to those obtained in the
absence of HePC.
Journal Pre-proof

Jour
nal P
re-p
roof
17
3.3. HePC inhibits LUV-GUV fusion
From the results shown in the previous section and bibliography data [35,36,46,53], we can
conclude that vesicles containing enzymatically generated CER or DAG show fusogenic properties.
Furthermore, these properties are inhibited by the presence of HePC. Taking into account that
membrane fusion is at the heart of many essential cellular processes, such as intracellular trafficking
and signaling via endo/lysosome fusion [51], and that those are proposed as target processes in
HePC action [8], we further explored the effect of HePC on fusogenic liposomes, using giant
unilamellar vesicles (GUVs) as a fusion target. Those micron-sized vesicles can be visualized
directly under a fluorescence confocal microscope. They are flat at the molecular level, making
them very useful mimics of the plasma membrane [51].
We performed a fusion assay by adapting the procedure described by Lira et al. [54]. In this system,
LUVs, which are the substrate of the phospholipase, are labeled with the lipophilic probe NBD-PE
and are mixed with Rho-PE-labeled GUVs designed as non-substrate. Vesicle fusion after enzyme
addition is detected by two means: I) through the morphological changes of GUVs observed by
confocal microscopy upon enrichment with the non-lamellar forming lipids DOPE and CER or
DAG, and II) lipid mixing increases fluorescence resonance energy transfer (FRET) between the
two probes and the red emission of the acceptor probe increases at expense of the emission of the
donor (green), upon excitation of the donor probe.
GUVs composed of SM and labeled with the fluorescent probe NBD-PE were observed by confocal
microscopy as circles when focused on the equatorial plane (Figure 4).
Journal Pre-proof

Jour
nal P
re-p
roof
18
Figure 4: Confocal microscopy images of GUVs of SM labeled with NBD-PE (green) and
fusogenic Rho-PE-labeled LUVs (red) composed of DOPC:DOPE (80:20) in the absence (upper
panel) or presence (lower panel) of 20 mol% of HePC. The timestamps indicate the time after
PLC addition. Fluorescence intensity profiles for the green and red channel in the GUV regions
along the dashed lines are plotted under each image. Samples were excited at the NBD-PE
excitation and images show the overlay of NBD-PE and Rho-PE emission channels.
LUVs composed of DOPC:DOPE:Rho-PE were used as the substrate of PLC. The addition of the
enzyme to a LUV/GUV mixture triggered DAG formation in LUVs. Its fusion to the GUV
membrane was evidenced by an increase in the red/green fluorescence ratio (increase in the FRET
signal) at 30 min that doubled the initial value (Figure 6A). Concomitantly, changes in GUV shape
were observed, which evidenced the occurrence of membrane areas with high curvature (see Figure
4). This may be explained by concentration of the non-lamellar forming lipids DOPE and DAG
5 min
30 s 10 in 15-30 min
GU
Vs
SM/L
UV
sD
OP
C:D
OP
E:H
eP
C
30 s 5 min 10 min 15-30 min
15-30 min
GU
Vs
SM/L
UV
sD
OP
C:D
OP
E
- PLC + PLC Time
30 s 5 min 15-30 min10 min
30S
0 2 4 6
Y D
ata
0
60
120
Col 31 vs Col 32 Col 34 vs Col 35
5MIN
X Data
0 2 4 6
Y D
ata
0
60
120
Col 37 vs Col 38 Col 40 vs Col 41
10min
X Data
0 2 4 6
Y D
ata
0
60
120
Col 43 vs Col 44 Col 46 vs Col 47
2D Graph 1
0 2 4 60
60
120
green signal 15-30 min
red signal 15-30 min
CONTROL _SIN PLC
Distance (m)
0 2 4 6
Flu
ore
scen
ce in
ten
sit
y (
au
)
0
60
120
green signal ( control)
red signal ( control)
CONTROL _HEPC
Distance (m)
0 2 4 6
Flu
ore
sce
nce in
ten
sit
y (
au
)
0
15
30
Col 24 vs Col 25
Col 26 vs Col 27
5min
0 2 4 60
15
30
green signal 5min
Col 10 vs Col 11
Col 21 vs Col 23
15-30 min_HEPC
0 2 4 60
15
30
green signal 15-30minCol 21 vs Col 23
Col 22 vs Col 23
30s
X Data
0 2 4 6
Y D
ata
0
15
30
Col 29 vs Col 30 Col 32 vs Col 33
2D Graph 9
X Data
0 2 4 6
Y D
ata
0
15
30
Col 35 vs Col 36 Col 38 vs Col 39
Journal Pre-proof

Jour
nal P
re-p
roof
19
originated in the PLC-treated LUVs. The changes in shape were observed in 94% of the GUVs
analyzed (n=47) after 60 min of PLC treatment (see Figure S1 for image gallery and video_PLC in
support information). Control experiments carried out in the presence of 100 mM EDTA, a
condition where PLC is inhibited, did not show shape changes in GUVs (Figure S1).
When 20 mol% of HePC was present in the LUVs, their fusion to GUV membranes was reduced, as
reflected by the low values of the red/green fluorescence ratio, which is statistically different than
that observed in the absence of HePC (Figure 6A). As a consequence of the low extent of fusion
and the presence of the cone-shaped HePC, GUVs incubated with this system showed no shape
change (only 7% of non-circular GUVs were found, n= 85; see Figure 4 and video_PLC_HePC in
support information).
GUVs formed by POPC and labeled with the fluorescent probe NBD-PE were observed by confocal
microscopy as circles when focused on the equatorial plane (Figure 5). Liposomes composed of
SM:DOPE:Rho-PE were used as the substrate of SMase. The addition of the enzyme to a
LUV/GUV mixture triggers CER formation in LUVs. After a few minutes, red dots were observed
attached to GUV (green) membranes (Figure 5 and video_SMase in support information).
This effect has been interpreted as liposome docking in a similar system [54]. In this stage, LUVs
associated with but did not mix with the GUV lipid membrane. As the enzyme reaction progressed,
the GUV membranes showed a significant increase in red fluorescent content (see Figure 6B) due to
a burst in LUV fusion to GUVs, until GUVs collapsed in a non-lamellar lipid structure (Figure 5,
upper panel, see also videos in support information).
Journal Pre-proof

Jour
nal P
re-p
roof
20
Figure 5: Confocal microscopy images of GUVs of POPC labeled with NBD-PE (green) and
fusogenic Rho-PE-labeled LUVs (red) containing SM:DOPE (80:20) in the absence (upper
panel) or presence (lower panel) of 20 mol% of HePC. The timestamps indicate the time after
SMase addition. Fluorescence intensity profiles for the green and red channel in the GUV regions
along the dashed lines are plotted under each image. Samples were excited at the NBD-PE
excitation and images show the overlay of NBD-PE and Rho-PE emission channels.
After 10 min incubation time, the acceptor emission signal reached intensity values 25-30 higher
than the donor emission (Figure 6B). At 30 min of enzyme treatment, microscopy images showed
the presence of amorphous lipid clusters coming from collapsed GUVs, as well as an increase of
GUVs aggregated in groups (see Figure S2). The LUV/GUV mixed solution in the absence of
SMase, or in the presence of SMase + 100 mM EDTA, was stable over 30 min (Figure S2).
15-30min
0 2 4 6
0
50
100
Col 19 vs Col 20
Col 22 vs Col 23
10min
0 2 4 6
0
50
100
Col 13 vs Col 14
Col 16 vs Col 17
5min
0 2 4 6
0
50
100
Col 7 vs Col 8
Col 10 vs Col 11
30s
0 2 4 6
0
200
400
green signal 30 sred signal 30 s
2D Graph 4
Distance (m)
0 2 4 6
Flu
ore
sc
en
ce
in
ten
sit
y (
au
)
0
200
400
Col 25 vs Col 26 Col 28 vs Col 29
- SMase + SMase Time
30 s
5 min30 s 5 min 10 min 15-30 min
5 min 10 min 15-30 min5min
0 2 4 60
200
400
green signal 5 min
red signal 5 min
10 min
0 2 4 6
0
200
400
green signal 10 min
red signal 10 min
EXP
0 2 4 6
0
200
400
Col 25 vs Col 26 Col 28 vs Col 29
CONTROL_HEPC
Distance (m)
0 2 4 6 8Flu
ore
sc
en
ce in
ten
sit
y (
au
)
0
50
100
Col 31 vs Col 32 Col 34 vs Col 35
30 s
0 2 4 6
0
50
100
Col 1 vs Col 2 Col 4 vs Col 5
GU
Vs
PO
PC
/LU
Vs
SM:D
OP
EG
UV
sP
OP
C/L
UV
sSM
:DO
PE:
HeP
C
Journal Pre-proof
Jour
nal P
re-p
roof
21
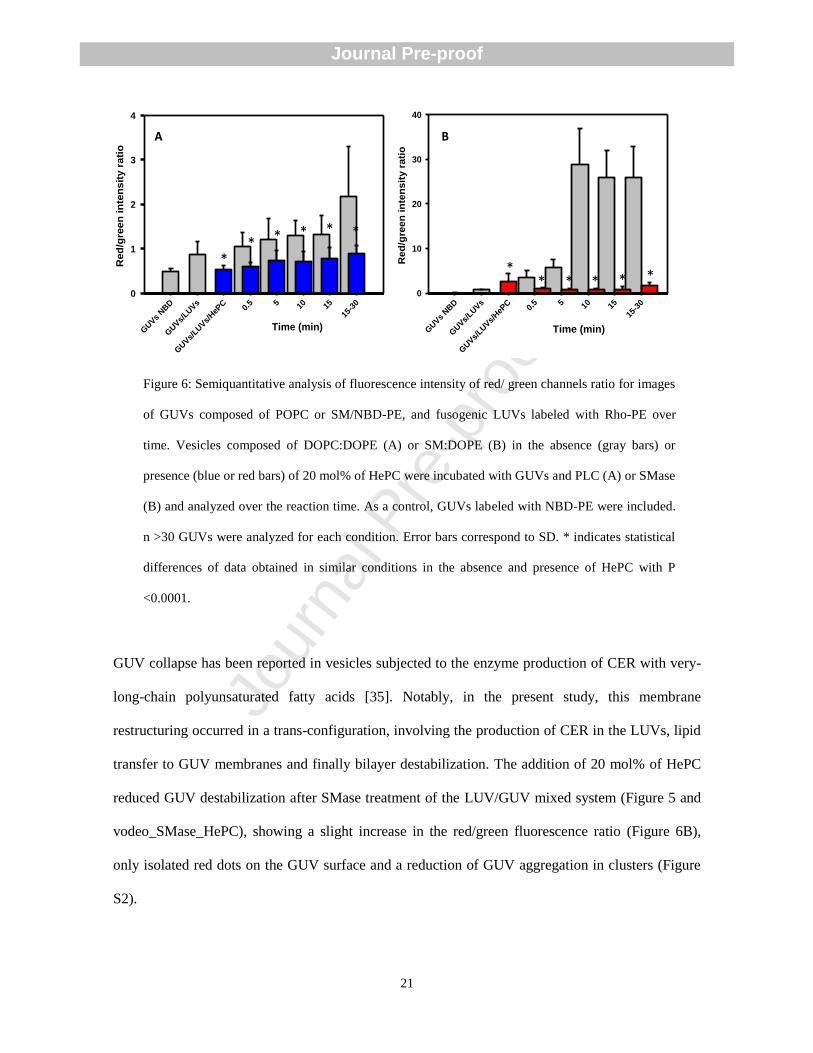
Figure 6: Semiquantitative analysis of fluorescence intensity of red/ green channels ratio for images
of GUVs composed of POPC or SM/NBD-PE, and fusogenic LUVs labeled with Rho-PE over
time. Vesicles composed of DOPC:DOPE (A) or SM:DOPE (B) in the absence (gray bars) or
presence (blue or red bars) of 20 mol% of HePC were incubated with GUVs and PLC (A) or SMase
(B) and analyzed over the reaction time. As a control, GUVs labeled with NBD-PE were included.
n >30 GUVs were analyzed for each condition. Error bars correspond to SD. * indicates statistical
differences of data obtained in similar conditions in the absence and presence of HePC with P
<0.0001.
GUV collapse has been reported in vesicles subjected to the enzyme production of CER with very-
long-chain polyunsaturated fatty acids [35]. Notably, in the present study, this membrane
restructuring occurred in a trans-configuration, involving the production of CER in the LUVs, lipid
transfer to GUV membranes and finally bilayer destabilization. The addition of 20 mol% of HePC
reduced GUV destabilization after SMase treatment of the LUV/GUV mixed system (Figure 5 and
vodeo_SMase_HePC), showing a slight increase in the red/green fluorescence ratio (Figure 6B),
only isolated red dots on the GUV surface and a reduction of GUV aggregation in clusters (Figure
S2).
Time (min)GUVs
NBD
GUVs/
LUVs
GUVs/
LUVs/
HeP
C0.
5 5 10 15
15-3
0
Red
/gre
en
in
ten
sit
y r
ati
o
0
1
2
3
4
Time ( minutes)GUVs
NBD
GUVs/
LUVs
GUVs/
LUVs/
HeP
C0.
5 5 10 15
15-3
0
Red
/gre
en
in
ten
sit
y r
ati
o
0
10
20
30
40
A B
**
* * * *
** * * * *
Time (min)GUVs
NBD
GUVs/
LUVs
GUVs/
LUVs/
HeP
C0.
5 5 10 15
15-3
0
Red
/gre
en
in
ten
sit
y r
ati
o
0
1
2
3
4
Time ( minutes)GUVs
NBD
GUVs/
LUVs
GUVs/
LUVs/
HeP
C0.
5 5 10 15
15-3
0
Red
/gre
en
in
ten
sit
y r
ati
o
0
10
20
30
40
A B
**
* * * *
** * * * *
Journal Pre-proof

Jour
nal P
re-p
roof
22
4. Discussion
Our results indicate that HePC does not significantly influence the initial rate of reactions catalyzed
by PLC or SMase. However, the extent of hydrolysis is inhibited by HePC over longer times. This
effect was interpreted as a consequence of the inhibition of the membrane restructuring that allows
full catalytic activity for PLC [53] and SMase [55,56]. In this work, we used SMase from a bacterial
source, Bacillus cereus, and porcine pancreatic PLC because of its availability and extensive use in
similar studies by other authors [46]. This might hamper the extrapolation of our results to a
eukaryotic cellular environment due to differences in the catalytic mechanism and regulation
properties of those enzymes with their intracellular counterparts. However, the effect of the
accumulation of the DAG and CER products in biomembranes is expected to have similar
consequences on the alteration of the physical properties of the membranes, regardless of their
origin [33,37,57–59].
Phospholipases such as PLC and SMase act on the external hemilayer of vesicles, and access of the
enzyme to the substrates located in the inner hemilayer is impaired. In this picture, membrane
restructuring with the occurrence of nuclei of non-lamellar phases allows not only access to all the
substrate population [56], but also permits the lipid product to dissipate into both hemilayers,
reducing inhibition by product. The hindering of this membrane restructuring by HePC has in turn a
dampening effect on enzyme hydrolysis over longer times.
This complex landscape is reflected in previous reports where HePC affects several phospholipases
differently. HePC has been found to inhibit PLC [60,61] but not phospholipase D or SMase [62].
Furthermore, those authors reported differential regulation of phospholipase A2 (PLA2) by HePC,
which cannot be explained by changes in membrane composition [63]. This suggests that
phospholipase regulation should be understood in a non-classical way, taking into account not only
the biochemical aspects but also the biophysical properties of the host membrane and its bi-
directional regulation with enzyme activity [18,21,26,42,43].
Journal Pre-proof

Jour
nal P
re-p
roof
23
As commented above, the phospholipase-driven catalytic process occurs asymmetrically, since
these enzymes act only on the outer hemilayer of the membrane. DAG and CER are lipids with a
small polar head compared to the two bulky hydrocarbon chains of its hydrophobic region, giving it
a general inverted cone geometry. When the kinetics of the production of those lipids is faster than
the flip-flop dynamics, the resultant membrane is highly stressed and in a state far from its
compositional and curvature balance [52]. GUVs subjected to the asymmetric action of SMase relax
this frustration into the formation of highly curved vesicles associated with the mother GUV [34].
This whole panorama favors the aggregation of vesicles with the formation of intermediate
structures with highly negative curvature, which relaxes the geometric tension. Therefore, DAG and
CER, as well as PE, are considered fusogenic molecules acting by stabilizing those highly curved
membrane regions and promoting fusion events [33,35].
Whist HePC mechanism of action clearly involves cell membrane alteration [2], how this alteration
propagates to the final target enzymes involved in lipid homeostasis and cell signaling is still under
debate. Liquid-ordered (LO) nanodomains enriched in sterols and sphingolipids, named ―lipid rafts‖
occur in living cell membranes and regulate important cell functions. Some authors have reported
alkylphospholipids involvement in lipid raft stability, metabolism and apoptosis [2,9]. On the other
hand, previous works from our laboratory evidenced that the presence of HePC destabilizes LO
domains in cholesterol/phospholipid monolayers [12]. In agreement, Castro et al. concluded that the
mechanism of action of alkylphospholipids is unlikely to be directly linked to alterations of lipid
rafts biophysical properties caused by these drugs [31].
Taking into account the discrepancy on the effect of HePC on the lateral segregation of lipids, we
explored a different aspect of membrane alteration, which involves membrane curvature stress
modulation, following Dymond et al. predictions [28]. The results shown in this work robustly
demonstrate that HePC inhibits membrane restructuring events, characteristic of the enzyme
formation process of DAG and CER. HePC is a single-tailed alkylphospholipid analog that has an
effective cone-shaped geometry (and a low critical parameter of Pc = 0.29) [12], which when
Journal Pre-proof

Jour
nal P
re-p
roof
24
inserted into the bilayers can induce a positive curvature, counteracting the effect caused by DAG
or CER. Therefore, HePC relaxes the curvature-tension of the enzymatically-treated membranes
and restricts bilayer destabilization. It impedes those signaling messengers from diffusing laterally
with continuity towards the membranes of other vesicles. It is worth noting that our results show
that HePC inhibits the shape remodeling of lipid membranes which are not enzyme-substrate but
interact with enzyme-treated vesicles. Thus, the effect of HePC influences cascades of events that
overcome the local environment of enzyme activity.
This work focused on the action of HePC on two structurally unrelated enzymes, which degrade
structurally different lipids (glycerol and sphingophospholipids), having in common that the
products contain small polar groups and inverted cone structures. However, our results suggest that
HePC may act in a non-classical way, and may influence not only those two enzymes but a greater
variety of membrane-bound enzymes sensitive to curvature stress [16,18,19,21]. A recent report
highlights the relationship between membrane curvature elastic stress and phospholipid homeostasis
[18], the main target of HePC action in cells. Notably, HePC-resistant Leishmania promastigotes
and HePC transiently treated parasites show a modification in their membrane lipid profile [6,10].
This lipid regulation may have the capacity to compensate for the non-specific alteration of the
intrinsic curvature of the membrane caused by HePC.
In summary, the results reported in this work contribute to understanding the mechanism of action
by which HePC regulates lipid metabolism and the transduction pathways of signals and offers
evidence of a more holistic effect of HePC.
5. Acknowledgments
This work was supported by the Consejo Nacional de Investigaciones Científicas y Técnicas
(CONICET), Agencia Nacional de Promoción Científica y Tecnológica (ANPCyT, FONCyT PICT
2017-0332 to MLF and PICT 2015-2575 to EEA), and the Secretary of Science and Technology of
Universidad Nacional de Córdoba (SECyT-UNC), Argentina. Y.M.Z.D. is a CONICET fellow;
Journal Pre-proof

Jour
nal P
re-p
roof
25
E.E.A. and M.L.F. are Career Investigators of CONICET-UNC. The microscopy experiments were
performed at the ―Centro de Micro y Nanoscopía de Córdoba‖ (CEMINCO-CIQUIBIC) working as
part of the ―Sistema Nacional de Microscopía (SNM)‖. The authors thank Dr. Carlos Mas and Dr.
Cecilia Sampedro (CPA career-CONICET) for technical assistance in confocal microscopy image
capture and analysis.
Author contributions: Y.M. Zulueta Díaz: Investigation, Validation, Formal Analysis,
Visualization, Writing-review and editing. E.E. Ambroggio: Conceptualization, Supervision,
Writing-review and editing. M.L. Fanani: Conceptualization, Supervision, Visualization, Writing –
Original Draft, Project Administration, Resources, Funding Acquisition.
7. References
[1] S.L. Croft, J. Engel, Miltefosine — discovery of the antileishmanial activity of phospholipid
derivatives, Trans. R. Soc. Trop. Med. Hyg. 100 (2006) S4–S8.
https://doi.org/10.1016/j.trstmh.2006.03.009.
[2] W.J. Van Blitterswijk, M. Verheij, Anticancer Alkylphospholipids : Mechanisms of Action ,
Cellular Sensitivity and Resistance , and Clinical Prospects, Curr. Pharm. Des. 14 (2008)
2061–2074. https://doi.org/10.2174/138161208785294636.
[3] S.L. Croft, K. Seifert, V. Yardley, Current scenario of drug development for leishmaniasis,
Indian J. Med. Res. 123 (2006) 399–410. https://doi.org/10.1016/j.trstmh.2006.03.009
Please.
[4] J. de Almeida Pachioni, J. Gallottini Magalhaes, E.J. Cardoso Lima, L. de Moura Bueno, J.
Ferreira Barbosa, M. Malta de Sa, C. De Oliveira Rangel-Yagui, Alkylphospholipids - A
promising class of chemotherapeutic agents with a broad pharmacological spectrum, J.
Pharm. Pharm. Sci. 16 (2013) 742–759. https://doi.org/10.18433/J3CW23.
[5] T.P.C. Dorlo, M. Balasegaram, J.H. Beijnen, P.J. De Vries, Miltefosine: A review of its
Journal Pre-proof

Jour
nal P
re-p
roof
26
pharmacology and therapeutic efficacy in the treatment of leishmaniasis, J. Antimicrob.
Chemother. 67 (2012) 2576–2597. https://doi.org/10.1093/jac/dks275.
[6] M. Rakotomanga, S. Blanc, K. Gaudin, P. Chaminade, P.M. Loiseau, Miltefosine Affects
Lipid Metabolism in Leishmania donovani Promastigotes, Antimicrob. Agents Chemother.
51 (2007) 1425–1430. https://doi.org/10.1128/AAC.01123-06.
[7] G. van Meer, D.R. Voelker, G.W. Feigenson, Membrane lipids : where they are and how
they behave, Nat. Rev. 9 (2008) 112–124. https://doi.org/10.1038/nrm2330.
[8] P. Ríos-Marco, C. Marco, X. Gálvez, J.M. Jiménez-López, M.P. Carrasco,
Alkylphospholipids: An update on molecular mechanisms and clinical relevance, Biochim.
Biophys. Acta - Biomembr. 1859 (2017) 1657–1667.
https://doi.org/10.1016/j.bbamem.2017.02.016.
[9] M. Saint-Pierre-Chazalet, B.M. Brahim, L. Le Moyec, C. Bories, M. Rakotomanga, P.M.
Loiseau, Membrane sterol depletion impairs miltefosine action in wild-type and miltefosine-
resistant Leishmania donovani promastigotes, J. Antimi. 65 (2009) 993–1001.
https://doi.org/10.1093/jac/dkp321.
[10] M. Rakotomanga, M. Saint-Pierre-Chazalet, P.M. Loiseau, Alteration of fatty acid and sterol
metabolism in miltefosine-resistant Leishmania donovani promastigotes and consequences
for drug-membrane interactions, Antimicrob. Agents Chemother. 49 (2005) 2677–2686.
https://doi.org/10.1128/AAC.49.7.2677-2686.2005.
[11] D.H. Beach, G.G. Holz, G.E. Anekwe, Lipids of Leishmania Promastigotes, J. Parasitol. 65
(1979) 203–216.
[12] Y.D.L.M. Zulueta Díaz, M.L. Fanani, Crossregulation between the insertion of
Hexadecylphosphocholine (miltefosine) into lipid membranes and their rheology and lateral
structure, Biochim. Biophys. Acta - Biomembr. 1859 (2017) 1891–1899.
https://doi.org/10.1016/j.bbamem.2017.06.008.
[13] I.R. Gómez-Serranillos, J.J. Mi ones, P. Dynarowicz- a tka, J. Mi ones, E. Iribarnegaray,
Journal Pre-proof

Jour
nal P
re-p
roof
27
Miltefosine - Cholesterol Interactions : A Monolayer Study, Langmuir. 20 (2004) 928–933.
[14] J.M. Seddon, R.H. Templer, Polymorphism of Lipid-Water Systems, in: R.L. and E.
Sackmann (Ed.), Handb. Biol. Phys., Elsevier Science B.V, London SW7, 1995: pp. 97–160.
[15] P. V. Escribá, Membrane-lipid therapy: A new approach in molecular medicine, Trends Mol.
Med. 12 (2006) 34–43. https://doi.org/10.1016/j.molmed.2005.11.004.
[16] S.M. a Davies, R.M. Epand, R. Kraayenhof, R.B. Cornell, Regulation of CTP:
Phosphocholine cytidylyltransferase activity by the physical properties of lipid membranes:
An important role for stored curvature strain energy, Biochemistry. 40 (2001) 10522–10531.
https://doi.org/10.1021/bi010904c.
[17] R.M. Epand, Lipid polymorphism and protein-lipid interactions, Biochim. Biophys. Acta -
Rev. Biomembr. 1376 (1998) 353–368. https://doi.org/10.1016/S0304-4157(98)00015-X.
[18] M.K. Dymond, Mammalian phospholipid homeostasis: Evidence that membrane curvature
elastic stress drives homeoviscous adaptation in vivo, J. R. Soc. Interface. 13 (2016).
https://doi.org/10.1098/rsif.2016.0228.
[19] R.B. Cornell, R.S. Arnold, Modulation of the activities of enzymes of membrane lipid
metabolism by non-bilayer-forming lipids, Chem. Phys. Lipids. 81 (1996) 215–227.
https://doi.org/10.1016/0009-3084(96)02584-4.
[20] J.C. Bozelli, W. Jennings, S. Black, Y.H. Hou, D. Lameire, P. Chatha, T. Kimura, B. Berno,
A. Khondker, M. Rheinstädter, R.M. Epand, Membrane curvature allosterically regulates the
phosphatidylinositol cycle, controlling its rate and acyl chain composition of its lipid
intermediates, J. Biol. Chem. 293 (2018) 17780–17791.
https://doi.org/10.1074/jbc.RA118.005293.
[21] A.E. Drobnies, S.M. a Davies, R. Kraayenhof, R.F. Epand, R.M. Epand, R.B. Cornell,
CTP:phosphocholine cytidylyltransferase and protein kinase C recognize different physical
features of membranes: Differential responses to an oxidized phosphatidylcholine, Biochim.
Biophys. Acta - Biomembr. 1564 (2002) 82–90. https://doi.org/10.1016/S0005-
Journal Pre-proof

Jour
nal P
re-p
roof
28
2736(02)00404-2.
[22] P. V. Escribá, A. Ozaita, C. Ribas, A. Miralles, E. Fodor, T. Farkas, J.A. García-Sevilla,
Role of lipid polymorphism in G protein-membrane interactions : Nonlamellar-prone
phospholipids and peripheral protein binding, PNAS. 94 (1997) 11375–11380.
https://doi.org/10.1073/pnas.94.21.11375.
[23]
Dimer Drives the Interaction of Heterotrimeric Gi Proteins with Nonlamellar Membrane
Structures, J. Biol. Chem. 279 (2004) 36540–36545.
https://doi.org/10.1074/jbc.M402061200.
[24] O. Vögler, J.M. Barceló, C. Ribas, P. V Escribá, Membrane interactions of G proteins and
other related proteins, Biochim. Biophys. Acta - Biomembr. 1778 (2008) 1640–1652.
https://doi.org/10.1016/j.bbamem.2008.03.008.
[25] M. Ibarguren, P.H.H. Bomans, P.M. Frederik, M. Stonehouse, A.I. Vasil, M.L. Vasil, A.
Alonso, F.M. Goñi, End-products diacylglycerol and ceramide modulate membrane fusion
induced by a phospholipase C/sphingomyelinase from Pseudomonas aeruginosa, Biochim.
Biophys. Acta - Biomembr. 1798 (2010) 59–64.
https://doi.org/10.1016/j.bbamem.2009.10.017.
[26] H. Ahyayauch, A. V Villar, A. Alonso, F.M. Goñi, Modulation of PI-Specific Phospholipase
C by Membrane Curvature and Molecular Order, Biochemistry. 44 (2005) 11592–11600.
https://doi.org/10.1021/bi050715k.
[27] P. V Escriba, M. Sastre, J.A. Garcia-sevilla, Disruption of cellular signaling pathways by
daunomycin through destabilization of nonlamellar membrane structures, PNAS. 92 (1995)
7595–7599. https://doi.org/10.1073/pnas.92.16.7595.
[28] M. Dymond, G. Attard, A.D. Postle, Testing the hypothesis that amphiphilic antineoplastic
lipid analogues act through reduction of membrane curvature elastic stress., J. R. Soc.
Interface. 5 (2008) 1371–1386. https://doi.org/10.1098/rsif.2008.0041.
Journal Pre-proof

Jour
nal P
re-p
roof
29
[29] B. Malheiros, Biophysical Characterization of cubosomal nanoparticles intended for drug
delivery applications and its interaction with a model drug: the miltefosine case,
UNIVERSIDADE DE SÃO PAULO – USP, 2018. https://doi.org/10.11606/D.9.2018.tde-
18122018-172044.
[30] B. Heczková, J.P. Slotte, Effect of anti-tumor ether lipids on ordered domains in model
membranes, FEBS Lett. 580 (2006) 2471–2476.
https://doi.org/10.1016/j.febslet.2006.03.079.
[31] B.M. Castro, A. Fedorov, V. Hornillos, J. Delgado, A.U. Acuña, F. Mollinedo, M. Prieto,
Edelfosine and Miltefosine Effects on Lipid Raft Properties: Membrane Biophysics in Cell
Death by Antitumor Lipids, J. Phys. Chem. B. 117 (2013) 7929–7940.
https://doi.org/10.1021/jp401407d.
[32] J. Miñones, S. Pais, J. Miñones, O. Conde, P. Dynarowicz- atka, Interactions between
membrane sterols and phospholipids in model mammalian and fungi cellular membranes - A
Langmuir monolayer study, Biophys. Chem. 140 (2009) 69–77.
https://doi.org/10.1016/j.bpc.2008.11.011.
[33] F.M. Goñi, L.R. Montes, A. Alonso, Phospholipases C and sphingomyelinases: Lipids as
substrates and modulators of enzyme activity, Prog. Lipid Res. 51 (2012) 238–266.
https://doi.org/10.1016/j.plipres.2012.03.002.
[34] J.M. Holopainen, M.I. Angelova, P.K. Kinnunen, Vectorial budding of vesicles by
asymmetrical enzymatic formation of ceramide in giant liposomes., Biophys. J. 78 (2000)
830–838. https://doi.org/10.1016/S0006-3495(00)76640-9.
[35] D.A. Peñalva, S.S. Antollini, E.E. Ambroggio, M.I. AveldanÌo, M.L. Fanani, Membrane
Restructuring Events during the Enzymatic Generation of Ceramides with Very Long-Chain
Polyunsaturated Fatty Acids, Langmuir. 34 (2018) 4398–4407.
https://doi.org/10.1021/acs.langmuir.7b04374.
[36] F.M. Goñi, A. Alonso, Membrane fusion induced by phospholipase C and
Journal Pre-proof

Jour
nal P
re-p
roof
30
sphingomyelinases, Biosci. Rep. 20 (2000) 443–463.
https://doi.org/10.1023/A:1010450702670.
[37] W.J. van Blitterswijk, A.H. van der Luit, R.J. Veldman, M. Verheij, J. Borst, Ceramide:
second messenger or modulator of membrane structure and dynamics?, Biochem. J. 369
(2003) 199–211. https://doi.org/10.1042/BJ20021528.
[38] R. Pankov, T. Markovska, P. Antonov, L. Ivanova, A. Momchilova, The plasma membrane
lipid composition affects fusion between cells and model membranes, Chem. Biol. Interact.
164 (2006) 167–173. https://doi.org/10.1016/j.cbi.2006.09.010.
[39] Y. Zhang, X. Li, K.A. Becker, E. Gulbins, Ceramide-enriched membrane domains-Structure
and function, Biochim. Biophys. Acta - Biomembr. 1788 (2009) 178–183.
https://doi.org/10.1016/j.bbamem.2008.07.030.
[40] F.M. Goñi, A. Alonso, Sphingomyelinases: Enzymology and membrane activity, FEBS Lett.
531 (2002) 38–46. https://doi.org/10.1016/S0014-5793(02)03482-8.
[41] P.Y. Quartino, G.D. Fidelio, J.B. Manneville, B. Goud, E.E. Ambroggio, Detecting
phospholipase activity with the amphipathic lipid packing sensor motif of ArfGAP1,
Biochem. Biophys. Res. Commun. 505 (2018) 290–294.
https://doi.org/10.1016/j.bbrc.2018.09.116.
[42] B. Maggio, G. a. Borioli, M. Boca, L. Tullio, M.L. Fanani, R.G. Oliveira, C.M. Rosetti, N.
Wilke, Composition-driven Surface Domain Structuring Mediated by Sphingolipids and
Membrane-active Proteins, Cell Biochem. Biophys. 50 (2008) 79–109.
https://doi.org/10.1007/s12013-007-9004-1.
[43] M.L. Fanani, S. Hartel, B. Maggio, L. De Tullio, J. Jara, F. Olmos, R.G. Oliveira, The action
of sphingomyelinase in lipid monolayers as revealed by microscopic image analysis,
Biochim. Biophys. Acta - Biomembr. 1798 (2010).
https://doi.org/10.1016/j.bbamem.2010.01.001.
[44] M.B. Ruiz-Argüello, M.P. Veiga, J.L.R. Arrondo, F.M. Goñi, A. Alonso, Sphingomyelinase
Journal Pre-proof

Jour
nal P
re-p
roof
31
cleavage of sphingomyelin in pure and mixed lipid membranes. Influence of the physical
state of the sphingolipid, Chem. Phys. Lipids. 114 (2002) 11–20.
https://doi.org/10.1016/S0009-3084(01)00195-5.
[45] J.A. Bellon, M.J. Pino, N. Wilke, Low-cost equipment for electroformation of Giant
Unilamellar Vesicles, HardwareX. 4 (2018) e00037.
https://doi.org/10.1016/j.ohx.2018.e00037.
[46] M.B. Ruiz-Alguello, G. Basañez, M.F. Goñi, A. Alonso, Different effects of enzyme-
generated ceramides and diacylglycerols in phospholipid membrane fusion and leakage, J.
Biol. Chem. 271 (1996) 926616–26621. https://doi.org/10.1016/S0079-6107(97)80314-8.
[47] J.L. Nieva, F.M. Goñi, A. Alonso, Liposome Fusion Catalytically Induced by Phospholipase
C, Biochemistry. 28 (1989) 7364–7367. https://doi.org/10.1021/bi00444a032.
[48] F. Ogushi, R. Ishitsuka, T. Kobayashi, Y. Sugita, Rapid flip-flop motions of diacylglycerol
and ceramide in phospholipid bilayers, Chem. Phys. Lett. 522 (2012) 96–102.
https://doi.org/10.1016/j.cplett.2011.11.057.
[49] M.L. Fanani, B. Maggio, Kinetic steps for the hydrolysis of sphingomyelin by Bacillus
cereus sphingomyelinase in lipid monolayers, J. Lipid Res. 41 (2000).
[50] I.R. Miller, J.M. Ruysschaert, Enzymic activity and surface inactivation of phospholipase C
at the water/air interface, J. Colloid Interface Sci. 35 (1971) 340–345.
https://doi.org/10.1016/0021-9797(71)90128-7.
[51] R.B. Lira, R. Dimova, Fusion assays for model membranes: a critical review, in: Adv.
Biomembr. Lipid Self-Assembly, Elsevier, 2019: pp. 229–270.
https://doi.org/10.1016/bs.abl.2019.09.003.
[52] I. López-Montero, M. Vélez, P.F. Devaux, Surface tension induced by sphingomyelin to
ceramide conversion in lipid membranes, Biochim. Biophys. Acta - Biomembr. 1768 (2007)
553–561. https://doi.org/10.1016/j.bbamem.2007.01.001.
[53] G. Basáñez, J.L. Nieva, F.M. Goñi, A. Alonso, Origin of the lag period in the phospholipase
Journal Pre-proof
Jour
nal P
re-p
roof
32
C cleavage of phospholipids in membranes. Concomitant vesicle aggregation and enzyme
activation, Biochemistry. 35 (1996) 15183–15187. https://doi.org/10.1021/bi9616561.
[54] R.B. Lira, T. Robinson, R. Dimova, K.A. Riske, Highly Efficient Protein-free Membrane
Fusion: A Giant Vesicle Study, Biophys. J. 116 (2019) 79–91.
https://doi.org/10.1016/j.bpj.2018.11.3128.
[55] S.N. Pinto, E.L. Laviad, J. Stiban, S.L. Kelly, A.H. Merrill, M. Prieto, A.H. Futerman, L.C.
Silva, Changes in membrane biophysical properties induced by sphingomyelinase depend on
the sphingolipid N-acyl chain., J. Lipid Res. 55 (2014) 53–61.
https://doi.org/10.1194/jlr.M042002.
[56] L.C. Silva, A.H. Futerman, M. Prieto, Lipid raft composition modulates sphingomyelinase
activity and ceramide-induced membrane physical alterations, Biophys. J. 96 (2009) 3210–
3222. https://doi.org/10.1016/j.bpj.2008.12.3923.
[57] I. López-Montero, F. Monroy, M. Vélez, P.F. Devaux, Ceramide: From lateral segregation
to mechanical stress, Biochim. Biophys. Acta - Biomembr. 1798 (2010) 1348–1356.
https://doi.org/10.1016/j.bbamem.2009.12.007.
[58] J.C. Gómez-Fernández, S. Corbalán-García, Diacylglycerols, multivalent membrane
modulators, Chem. Phys. Lipids. 148 (2007) 1–25.
https://doi.org/10.1016/j.chemphyslip.2007.04.003.
[59] A. Alonso, F.M. Goñi, The Physical Properties of Ceramides in Membranes, Annu. Rev.
Biophys. 47 (2018) Epub ahead of print. https://doi.org/10.1146/annurev-biophys-070317-
033309.
[60] D. Berkovic, M. Goeckenjan, S. Lüders, W. Hiddemann, E.A. Fleer,
Hexadecylphosphocholine inhibits phosphatidylinositol and phosphatidylcholine
phospholipase C in human leukemia cells, J. Exp. Ther. Oncol. 1 (1996) 302—311.
[61] M.J. Wargo, M.J. Gross, S. Rajamani, J.L. Allard, L.K.A. Lundblad, G.B. Allen, M.L. Vasil,
L.W. Leclair, D.A. Hogan, Hemolytic phospholipase C inhibition protects lung function
Journal Pre-proof

Jour
nal P
re-p
roof
33
during Pseudomonas aeruginosa infection, Am. J. Respir. Crit. Care Med. 184 (2011) 345–
354. https://doi.org/10.1164/rccm.201103-0374OC.
[62] D. Berkovic, K. Berkovic, C. Binder, D. Haase, E.A.M. Fleer, Hexadecylphosphocholine
does not influence phospholipase D and sphingomyelinase activity in human leukemia cells,
J. Exp. Ther. Oncol. 2 (2002) 213–218. https://doi.org/10.1046/j.1359-4117.2002.01036.x.
[63] D. Berkovic, S. Lüders, M. Goeckenjan, W. Hiddemann, E.A.M. Fleer, Differential
regulation of phospholipase A2 in human leukemia cells by the etherphospholipid analogue
hexadecylphosphocholine, Biochem. Pharmacol. 53 (1997) 1725–1733.
https://doi.org/10.1016/S0006-2952(97)00095-6.
Journal Pre-proof

Jour
nal P
re-p
roof
34
Declaration of interests
☒ The authors declare that they have no known competing financial interests or personal relationships that
could have appeared to influence the work reported in this paper.
☐The authors declare the following financial interests/personal relationships which may be considered as potential competing interests:
Journal Pre-proof
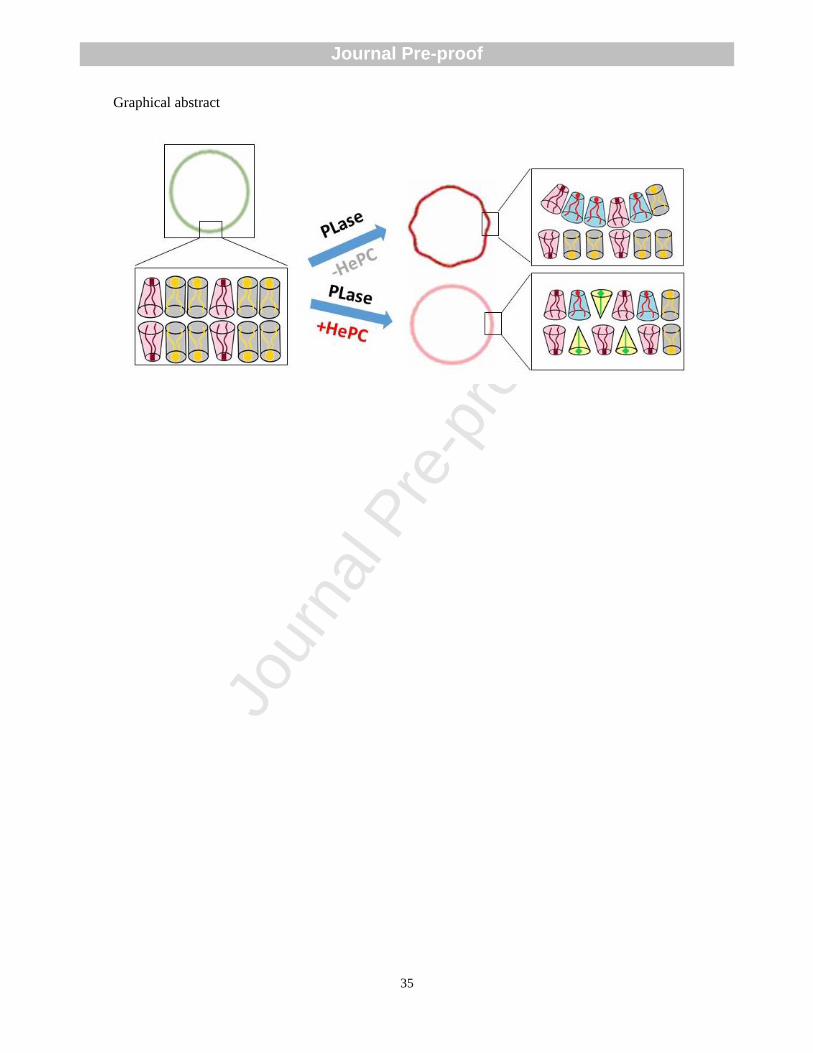
Jour
nal P
re-p
roof
35
Graphical abstract
Journal Pre-proof

Jour
nal P
re-p
roof
36
Highlights
Miltefosine (hexadecylphosphocholine or HePC) alters phospholipases action.
HePC inhibits diacylglycerol and ceramide-induced liposome aggregation.
HePC inhibit membrane fusion induced by phospholipase C and sphingomyelinase action
HePC would act through relaxation of membrane curvature stress
Journal Pre-proof