MILNE BAY PROVINCIAL - Educationmbp.education.gov.pg/Provincial...
80
Transcript of MILNE BAY PROVINCIAL - Educationmbp.education.gov.pg/Provincial...
MILNE BAY PROVINCIAL EDUCATION PLAN
2016-2020
“Achieving Quality Education & Training ”
| P a g e 2 Achieving Quality Education and Training
All rights reserved. No part of this publication may be reproduced, distributed, or transmitted in any form or by any means, including photocopying, recording, or other electronic or mechanical methods, without the prior written permission of the publisher, except for the case of brief quotations in reviews and certain other non-commercial uses permitted by copyright law. For permission requests, write to the publisher at the address below. Milne Bay Administration Provincial Division Free Mail Bag ALOTAU Milne Bay Prepared by Milne Bay Provincial Division of Education Planning, Monitoring and Evaluation Cover Design by Paramount Printing Printed in Papua New Guinea by Paramount Printing First Printing, 2017
ISBN : 978-9980-89-841-8
Achieving Quality Education and Training | P a g e 3
Table of content
Figures and tables ................................................................................................................................................. 4
Abbreviations and acronyms .................................................................................................................................. 5
Statement from the Governor ................................................................................................................................. 7
Message from Chairman ......................................................................................................................................... 8
Acknowledgement from the Principal Education Advisor ..................................................................................... 9
Executive summary .............................................................................................................................................. 10
Milne bay province CONTEXT ........................................................................................................................... 14
Education in Milne Bay ........................................................................................................................................ 18
Progress in education in MILNE BAY ................................................................................................................. 20
Financing education in MILNE BAY ................................................................................................................... 23
Current education snapshot in MILNE BAY ........................................................................................................ 24
Planning framework.............................................................................................................................................. 28
Plan implementation ............................................................................................................................................. 30
The plan ............................................................................................................................................... 32
Monitoring and evaluation .................................................................................................................................... 54
Projections and costing ......................................................................................................................................... 66
DRAFT ONLY14 MAY 2015 NOT FOR GENERAL DISTRIBUTION
| P a g e 4 Achieving Quality Education and Training
Figures and tables Figure 1: Map of Milne Bay Figure 2: Enrolment growth in Elementary 2006-14 Figure 3: Enrolment growth by sector, 2006-14 Figure 4: Prep to grade 12 transition rate, by gender, 2013-2014 Figure 5: Expenditure in Education Sector 2009-2015 Figure 6: Education system, 2015 Figure 7: Gender of enrolled students, by sector, 2014 Figure 8 The Provincial Education Plan connections in planning Figure 9: PEP 2016-2020 logical frame work Figure 10: PEP Outputs Figure 11: PEP Outcome Figure 12: Student population in Milne Bay by Grade, gender and Over-age percentage Figure 13: Map showing political district boundaries and population
Table 1: Funding Sources in PEP 2007-2014 Table 2: Number of schools operating, by management, 2014 Table 3: Number of students enrolled, by grade, 2014 Table 4: Teacher pupil ratio, by grade, 2014 Table 5: Transition rate, 2014 Table 6: Long term school building targets, in line with Vision 2050 Table 7: Projected students enrolments, 2016-2020 Table 8: Financial projection 2016-2020 Table 9: Revenue Projection Table 10: Distribution of operating schools, by Districts, LLGs and Sectors, 2014 Table 11: distribution of operating schools, by Districts, Sectors and Remoteness Table 12: Boarding Primary Schools Table 13: Qualification of teachers, by sector and gender Table 14: Number of operating schools, by districts and by sector, 2014 Table 15: Student teacher ratio and teachers per school, by sector, 2014 Table 16: Student enrolment, by districts and gender, 2014 Table 17: Toilets, by sector and gender, 2013 Table 18: Students with special need by grade, 2013 Table 19: IPDP 2016-2020 deliverables Table 20: Ten year projected student enrolment 2016-2025 Table 21: District Profile of Milne Bay - 2010
Achieving Quality Education and Training | P a g e 5
Abbreviations and acronyms AAP Annual Activity Plan NSLCF National School Leadership
Competency Framework
ALESCO ALESCO payroll system NTCF National Teachers Competency Framework
BOG Board Of Governors OLA Office of Libraries and Archives
BOM Board Of Management OLPLLG Organic Law on Provincial and Local Level Government
CEA Church Education Agency OOSCI Out Of School Children Initiative
DEO District Education Officer P&C Parents and Citizens
DEP District Education Plan PARI Papua New Guinea Accessibility Remote Index
DoHERST Department of Higher Education, Research Science & Technology
PaRSS Payroll and Related Services
DPLLGA Department of Provincial and Local Level Government Affairs
PDoE Provincial Division of Education
DSIP District Support Grant PEA Provincial Education Advisor
ECCE Early Childhood Care and Education PEB Provincial Education Board
EFA Education For All PEL Provincial Education Law, Milne Bay
EFC Economic Facilitation Committee PEP Provincial Education Plan
EMIS Education Management Information System PETTC Provincial Elementary Trainer of Trainers Coordinator
FODE Flexible Open and Distance Learning PG Provincial Government
GER Gross enrolment rate PHA Provincial Health Authority, Milne Bay
GES General Education Services PILNA Pacific Islands Literacy and Numeracy Assessment
GoPNG Government of Papua New Guinea PNG Papua New Guinea
HIV/AIDS Human immunodeficiency virus/acquired immune deficiency syndrome
PSIP Provincial Service Improvement Program
ICT Information and Communications Technology PTP Provincial Training Plan, PDoE
IPDP Integrated Provincial Development Plan, Milne Bay Province
QAP Quarterly Activity Plan
Km Kina million QAR Quarterly Activity Report
LLG Local Level Government S&G Standards & Guidance, Milne Bay
LLGSIP Local-Level Government Service Improvement Program
SBC Standards-Based Curriculum
M&E Monitoring and Evaluation SBE Standards-Based Education
MBP Milne Bay Province SD Standards Division, NDoE
MIS Management Information System, Milne Bay SDG Strategic Development Goals
MOA Memorandum of Agreement SG Standards and Guidance Division, NDoE
MOU Memorandum of Understanding SLIP School Learning Improvement Plan
MPA Minimum Priority Activities SO Standards Officer
MSD Measurement Services Division, NDoE TFF Tuition Fee Free
MTDP Medium Term Development Goal TS Teaching Service, Milne Bay
NDoE National Department of Education TSA Teaching Service Act
NEFC National Economic & Fiscal Commission TSC Teaching Service Commission
NEP National Education Act TVET Technical and Vocational Education and Training
NER Net enrolment ratio UBE Universal basic education
| P a g e 6 Achieving Quality Education and Training
NES National education system WaSH Water sanitation and hygiene
NGO Non-governmental organization WSQA Whole School Quality Assessment
NQSSF National Quality School Standards Framework SWOT Strength, Weakness, Opportunities and Threats

Achieving Quality Education and Training | P a g e 7
Statement from the Governor This year 2016 sees the end of the Provincial Education Plan 2007- 2016. With the plan period coming to an end, a new Provincial Education Plan 2016 - 2020 has been put in place, which charters the Government's aspirations and strong support in education services and development in the province. In 2014, Milne Bay Provincial Government through its administration widely consulted the elites of Milne Bay at the Economic Development Forum, to charter the way forward for economic
development in the province. A major recommendation of the forum was that to enable or empower the majority of our people in the rural areas to be self-reliant and economically vibrant, the government needed to offer quality education in Milne Bay Province. The new focus of the Government in Milne Bay is to enable our people to be financially literate so that they can utilize their earnings and savings to improve their living standards and alleviate poverty. This focus calls for appropriate interventions by the Government directed towards the provision of basic human needs of water, food, health, education, communication, transportation and law and order. I am happy to see the new Provincial Education Plan 2016 - 2020 does embrace the Provincial Government initiative to continue to support technical training and education, Open University Centers, FODE and Public Library system. This will give wider opportunity to the people of Milne Bay for alternate education pathways. The plan is determined to provide pathways for both academic and technical education, which I see as being necessary for a province like ours. This plan is reflective of sound political will and support of my government with that of the people of Milne Bay Province. I must also add that Milne Bay Province acknowledges the partnership that my government has established with the national government, donor government and agencies for the implementation of this plan. As the Governor, it is my responsibility to see that this plan is supported in all forms in order to see its successful implementation. It is important that leaders in all levels of Governments including provincial, district, LLG and wards give support and provide resources to help educate our people. The plan provides for, among other things: > Access and Equity, > Quality Teacher and Teaching, > Quality Learning and responsive students > Provision and support of alternate education pathways > Strengthening of Local Management, and > Ensuring the systems are strengthened. Education is the priority of this government. My Government is aware of the huge responsibility and the cost of providing the necessary delivering quality education and training for all. The plan calls for fully committed partnerships at all levels of Government, the NGOs, the Education Agencies, the community groups, the teachers and of course the parents and students. We all must embrace the notion that EDUCATION OF A CHILD IS A COLLECTIVE RESPONSIBILITY. HON. TITUS PHILEMON, OBE, MP Governor, Milne Bay Province

| P a g e 8 Achieving Quality Education and Training
Message from Chairman It gives me great pleasure to present Milne Bay Provincial Education Plan for 2016 – 2020 to all the people in Milne Bay Province. The five (5) year Provincial Education Plan embraces the Integrated Provincial Development Plan (IPDP) vision and mission statement. The strategies and activities in the plan are structured towards the goal of "Achieving Quality Education and Training” for Milne Bay Province. While the priority of this plan is to provide conversional of nine (9) years of basic education, it
envisages a complete 13 years of quality education as the vision of the government. Furthermore, this plan provides equal opportunities for other educational pathways in TVET and FODE as a choice and not just a second chance for students who are pushed out of the system. Some academically inclined students will be selected to receive special funding to enable them to progress as far as their ability allows. Those with different talents will have opportunities through the revitalized vocational centers and restructured Distance Education system. The plan is focused on quality education and training in Milne Bay Province therefore, it equally demands private training and education providers to uphold the standard of education services provided for the people of Milne Bay. Our children need the best and deserve the opportunity to take their place in the global community. The provincial development plan for education presents a direction that is derived from the national education plan focuses on the demand of our growing school age population at both basic and post primary levels. Matching a massive growth in the restructure and expanded school system against population of school age children alone is a mammoth task compared to the capacity to finance, manage, monitor and to sustain educational progress and development. This plan can be effectively implemented to achieve its goals and objectives. This requires the support and commitment of all stakeholders. The province will support schools for additional curriculum materials, establishment and maintenance of infrastructure and counter fund Tuition Fee. School Boards are responsible for maintaining the quality of schools. The provision of educating a child in Milne Bay Province must be practiced as a shared responsibility between parents, communities, NGOs, stakeholders and governments at all levels. The spirit of partnership that enabled and sustained the continuity of our children’s education in the past by all is complemented and thus further encourage all to continue the excellent work. Finally, I commend this Plan to all our partners in providing a compatible educational service that is conducive for now and future generations. HON. GREGORY BINOKA, Chairman Education Services
Achieving Quality Education and Training | P a g e 9
Acknowledgement from the Principal Education Advisor
The Education Division through the Provincial Education Board is mandated under the Provincial Education Law 2011, to develop a provincial education plan. The development of this new Provincial Education Plan 2016 - 2020 responds directly to the National Medium Term Development Plan 2011- 2015 and Development Strategic Plan 2010 - 2030 with focus to achieve the desired targets espoused in PNG Vision 2050 and the global goals of integral human development. This Plan aligns with other national plans including the National Department of Education Plan 2015-2019, Education Sector Strategic Plan 2011-2030, Universal Basic Education
2010-2019 and the Milne Bay Provincial Integrated Provincial Development Plan 2016-2020. Milne Bay Provincial Education Plan 2016 to 2020 was formulated and put together with the support of many individuals. Therefore, the Provincial Education Board wishes to acknowledge the efforts of the Provincial Education Planning committee, the District Administrators, District Education Administrators and District and Local Level Government Representatives who have provided immense ideas, directions and have given moral support towards the development of this five year Provincial Education Plan. The Milne Bay Provincial Education Board also wishes to acknowledge the provincial education planning under the chairmanship of Mr. Makan Sale, Education Superintendent Operations for the team’s efforts in reaching out to all the electorates to discuss the vision, outcomes, strategies and the activities required to achieve goals of the Milne Bay Provincial Education Plan 2016 – 2020. Through these consultations, data and views collected were analyzed, collated and developed into this plan. Hence, it is a peoples’ plan as it reflects the views, perceptions and the aspirations of the people of Milne Bay province. The people of Milne Bay Province acknowledge the technical support rendered in the process of formulating this plan from the Policy and Planning Division of the Department of Education, especially to Ms. Sabati Mero Director Planning, Mr. Peter Lagia Corporate Planner and Mr. Kaminiel Irima Regional Planner (Southern) who were very instrumental in providing guidance to the development of this plan. We also thank Milne Bay Administration Planning Division under the leadership of Mr. Michael Viula Planning Advisor for assisting the division to provide the review report of IPDP 2011-2015. The findings from IPDP report captured the achievements of PEP 2007-2016. A special word of thank you also goes to the planners Mr. Misa Lionel and Mr. Jeffrey Yabom who provided necessary support to Mr. John Loilo, Provincial Education Planner in the write up and alignment of PEP 2016-20 and IPDP 2016-2020. The Milne Bay Provincial Education Board also received support from Church Agencies, non-Government Organizations and from the Milne Bay Provincial Administration and other stakeholders. It is not possible to name you all however, our school inspectors, district education administrators, teachers and many more who have contributed in one way or the other, we thank you all for a job well done and has made it a success for completion of this Education Plan. MR ROMA TUIDAM Principal Education Advisor Milne Bay Province
| P a g e 10 Achieving Quality Education and Training
Executive summary Despite successes and the progress in education over the past decade, much more remains to be done to improve access, retention, quality, equity and management, to address remaining challenges in education. This PEP aligns to the NEP 2015–2019 and designed to give everyone in Milne Bay, regardless of their ability, gender, or socio-economic background, an opportunity to be educated and to transform their lives, using a holistic, inclusive and integrated approach. There have been many changes in the country’s education system and policies since independence. This PEP is designed to build on past successes and challenges. This will enable us to enhance progress towards universal and high-quality education and training. The PEP is based on a logical planning framework that is categorized into six focus areas: Access and Equity
All Milne Bay children have access to 13 years of education. This should be irrespective of economic circumstances, location and gender and in a positive learning environment which is safe and hygienic.
Teachers and Teaching Well-trained and qualified teachers are in place to meet student demand. There should be enough resources, support and accommodation at schools to support quality teaching and learning.
Learning Relevant curriculum will be in place for learners to acquire skills and knowledge for a happy and healthy life. A learning assessment system will focus on improving learning.
Alternate Pathways Students will be able to choose easy-to-access pathways to attain technical training, work and life skills, and move between those and more traditional sectors.
Local Management Schools will be led by strong educational leadership and are well managed to achieve maximum student learning while being accountable to the community. Parents and wider communities are encouraged to actively support schools.
System Strengthening National, Provincial and District systems will improve their planning and operations to support schools to focus on improving student learning. Technology will be used to improve systems and access to information.
Each focus area has set of detailed activities that the province is required to undertake. The activities have associated deliverables which will contribute to achieving broader outcomes by 2020, such as more infrastructure and teachers in place and easier access to alternate pathways for the development of work and life skills. All are underpinned by a focus on improving quality. This plan outlines the roles and responsibilities of different organizations, as well as the associated timelines. It makes it clear that parents and local communities have important roles to play. To ensure that the strategies and activities are carried out and to measure their success, the PEP will monitor progress and it will be important to be flexible over the lifetime of the plan. Therefore, strategies may be
Achieving Quality Education and Training | P a g e 11
modified in the light of experience; including taking advantage of better-than-expected progress towards particular targets and outputs. Overall, this plan is also consistent with: The Papua New Guinea National Goals and Directive Principles in Vision 2050 International goals, in particular the Millennium Development Goals and the Education For All goals Recent government reforms to improve education service delivery SDGs & MTDP National Education Plan Milne Bay – Integrated Provincial Development Plan (IPDP) Community input from Districts and Local Level Government consultations District Education Plans Stakeholder inputs
The PEP set out a clear and easily-understood path towards achieving quality Learning and Training for all.
| P a g e 12 Achieving Quality Education and Training
CTIO
Achieving Quality Education and Training | P a g e 13
SECTION ONE
MILNE BAY PROVINCE CONTEXT
MILNE BAY PROVINCE CONTEXT
| P a g e 14 Achieving Quality Education and Training
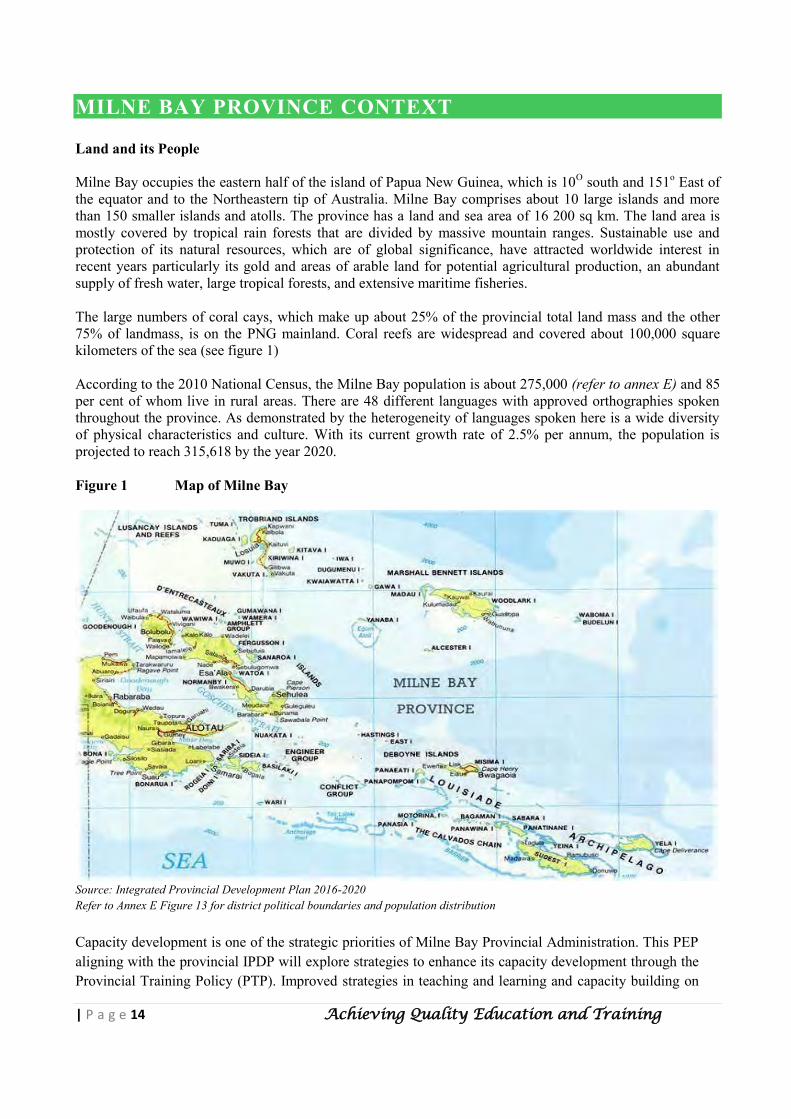
MILNE BAY PROVINCE CONTEXT Land and its People Milne Bay occupies the eastern half of the island of Papua New Guinea, which is 10O south and 151o East of the equator and to the Northeastern tip of Australia. Milne Bay comprises about 10 large islands and more than 150 smaller islands and atolls. The province has a land and sea area of 16 200 sq km. The land area is mostly covered by tropical rain forests that are divided by massive mountain ranges. Sustainable use and protection of its natural resources, which are of global significance, have attracted worldwide interest in recent years particularly its gold and areas of arable land for potential agricultural production, an abundant supply of fresh water, large tropical forests, and extensive maritime fisheries. The large numbers of coral cays, which make up about 25% of the provincial total land mass and the other 75% of landmass, is on the PNG mainland. Coral reefs are widespread and covered about 100,000 square kilometers of the sea (see figure 1) According to the 2010 National Census, the Milne Bay population is about 275,000 (refer to annex E) and 85 per cent of whom live in rural areas. There are 48 different languages with approved orthographies spoken throughout the province. As demonstrated by the heterogeneity of languages spoken here is a wide diversity of physical characteristics and culture. With its current growth rate of 2.5% per annum, the population is projected to reach 315,618 by the year 2020. Figure 1 Map of Milne Bay
Source: Integrated Provincial Development Plan 2016-2020 Refer to Annex E Figure 13 for district political boundaries and population distribution Capacity development is one of the strategic priorities of Milne Bay Provincial Administration. This PEP aligning with the provincial IPDP will explore strategies to enhance its capacity development through the Provincial Training Policy (PTP). Improved strategies in teaching and learning and capacity building on
Achieving Quality Education and Training | P a g e 15
skills, competency and quality workforce is the key that drives all private and public sector development programs successfully. Other capacities also include, sound policies and plans, monitoring and evaluation, fixed assets management and database. Broad- based Economic Development in Milne Bay is achieving economic growth through promotion of foreign and local investments to generate employment thereby raising the income per capita in the province. Milne Bay Province has already accommodated a large-scale oil palm development project that is also set to expand to the Central Province as part of the corridor planning supporting the national vision on robust economic growth. Indeed, it has huge potential to facilitate further economic development through manufacturing, agriculture and livestock development, fisheries and marine resource development, commerce and mines and forestry development. The province has established an Economic Facilitation Committee (EFC) which can play a major role in endorsing feasible and viable investments in Milne Bay. All economic development projects must be screened by the EFC to ensure that compliance and community benefits issues are satisfied. Local participation is encouraged through ‘unlocking’ land and other equity resources.
SECTION TWO EDUCATIONI MILNE BAY

| P a g e 16 Achieving Quality Education and Training
Achieving Quality Education and Training | P a g e 17
SECTION TWO
EDUCATION IN
MILNE BAY
| P a g e 18 Achieving Quality Education and Training
Education in Milne Bay The Milne Bay Provincial Government is mandated by the Organic Law on Provincial and Local Level Governments to oversee the implementation of national development policies and programs and to formulate provincial policies and programs for government functions that has been decentralized to the province (section 25 and 33 of OLPLLG). Milne Bay Provincial Administration is the implementation arm established under the Public Service (Management) Act responsible to the Milne Bay Provincial Government for the implementation of both national and provincial development policies and programs. The direction taken by the Provincial Government and its Administration is laid out in the Milne Bay Corporate Plan and embraced in the Vision, Mission and Policy Statements. This Corporate Plan provides the framework and basis to implement government policies to improve the welfare, living standards and quality of life for the people of Milne Bay. The Corporate Plan acknowledges that in order to achieve the aspirations set out in the Vision all development parties including non-government organizations, churches, communities, and individuals must stand together and actively participate in the development of the province. Milne Bay Provincial Government under its mandated functions has the responsibility to ensure that the provincial component of the national education system is established, maintained and expended. Within this context, the MBP PEP is appropriate and ultimately complements education requirements in the province. Under the Provincial Education Law 2011, administration of the provincial education which is the component of the national education system is vested in the following authorities: • The Milne Bay Provincial Executive Council • The Chairman of Social Services in Milne Bay Province • The Provincial Education Board (PEB) • The Divisional Head (Provincial Education Advisor) • The Teaching Service Commission (inclusive of power delegation to province) • The Local-Level Governments (LLGs) • The Education Agencies • The District Superintendents and • The Governing bodies of schools Provincial governments Through the provincial government, province and district administrations and PEB, the provinces have responsibility for establishing, building and maintaining schools. The province deploys teachers and employ provincial and district education officers. A provincial education subsidy in the form of Education Function Grants must be spent on operating costs and maintenance, and at least half must be spent on the districts’ minimum priority activities. The communities through schools’ governing bodies must share responsibility for infrastructure, including school buildings, teachers’ houses and ancillary facilities. Chairman for Education The Chairman is the provincial government political head responsible for the overall management of education through the Division of Education, which comprises the government institutions, church agencies and private institutions.
Achieving Quality Education and Training | P a g e 19
The Provincial Education Board (PEB) The PEB is the highest education decision-making body in Milne Bay Province, overseeing the development and functioning of the provincial education system and the impetus in the implementation of the PEP. It advises Chairman for Education, in consultation with provincial Division of Education, school boards and agencies. The Provincial Education Advisor, as head of the education division, is the statutory chairman of the PEB. The National Education Board can veto board decisions. Divisional head The head of the Division of Education is the Provincial Education Advisor. The Provincial Education Advisor also chairs the Provincial Education Board. Teaching Service Commission The Teaching Service Commission (TSC), established by an Act of Parliament, acts as the agent of the state for the employment of teachers. It oversees teachers’ terms and conditions of service, salaries, allowances and welfare. It supports the rights of teachers. There were 25 powers in the TSA decentralized or transferred to Milne Bay Provincial Education Advisor to act for and on behalf of the state agency (Teaching Service Commission) to discharge decisions. Quality learning for all I 19 Local-Level Governments Local-Level Government is the third level of government. It plays a minimal role in education but its responsibilities include the funding and maintenance of elementary and primary schools and helping districts to develop district education plans consistent with provincial education plans. Education agencies Education agencies are key partners in the delivery of education services in Milne Bay and whole of Papua New Guinea. They include faith based and private agencies with well-established networks of schools in the provinces in all education sectors. The agencies may have varied student entry criteria and teacher terms and conditions, but they are entitled to school subsidies from the government. Teachers are paid by the government, except those employed by ‘International Education Agencies’. District Education Superintendents The District Education Superintendents are the education system administrators based at the district level. The District Education Superintendents develop District Education Plans (DEP), implement and monitor in consultation with Provincial Division of Education. Governing boards of member schools Governing boards are Boards of Management (BOMs) in elementary and primary schools and Boards of Governors (BOGs) in secondary and other post-primary schools. They are the schools’ highest decision-making bodies and have financial and management powers. They also have disciplinary powers but their decisions can be vetoed by the Provincial Education Board.20 I Qua
| P a g e 20 Achieving Quality Education and Training
PROGRESS IN EDUCATION IN MILNE BAY
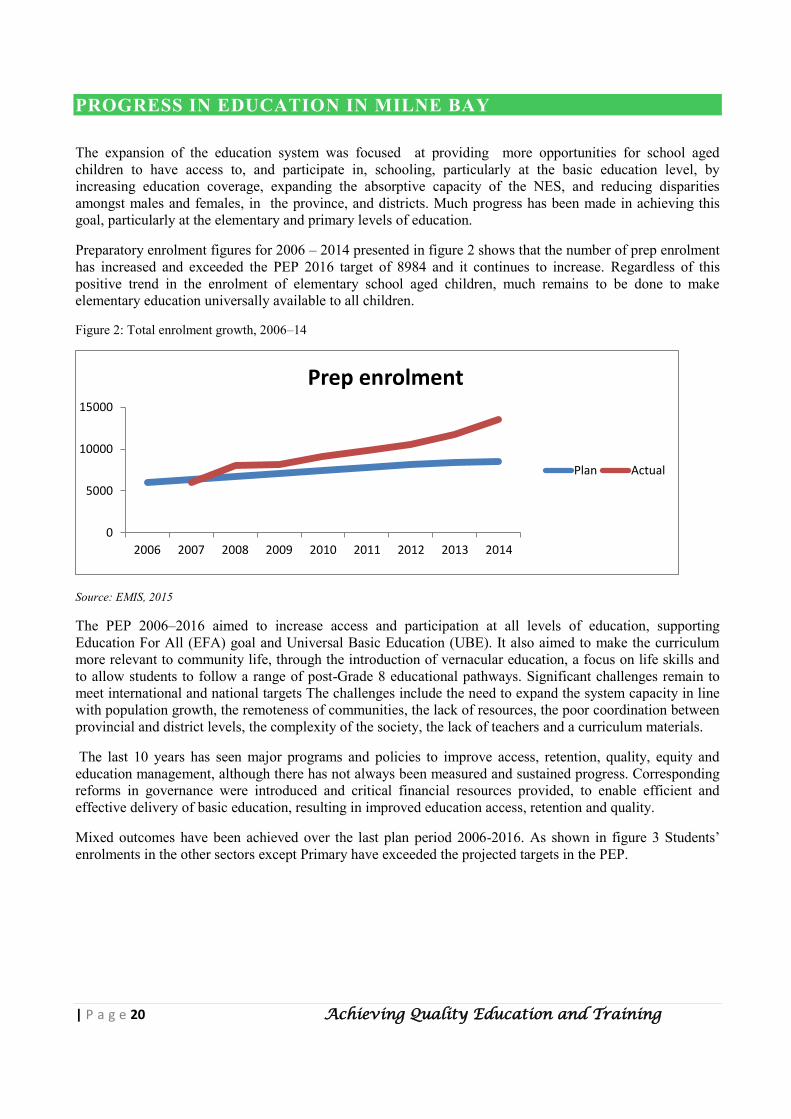
The expansion of the education system was focused at providing more opportunities for school aged children to have access to, and participate in, schooling, particularly at the basic education level, by increasing education coverage, expanding the absorptive capacity of the NES, and reducing disparities amongst males and females, in the province, and districts. Much progress has been made in achieving this goal, particularly at the elementary and primary levels of education.
Preparatory enrolment figures for 2006 – 2014 presented in figure 2 shows that the number of prep enrolment has increased and exceeded the PEP 2016 target of 8984 and it continues to increase. Regardless of this positive trend in the enrolment of elementary school aged children, much remains to be done to make elementary education universally available to all children.
Figure 2: Total enrolment growth, 2006–14
Source: EMIS, 2015
The PEP 2006–2016 aimed to increase access and participation at all levels of education, supporting Education For All (EFA) goal and Universal Basic Education (UBE). It also aimed to make the curriculum more relevant to community life, through the introduction of vernacular education, a focus on life skills and to allow students to follow a range of post-Grade 8 educational pathways. Significant challenges remain to meet international and national targets The challenges include the need to expand the system capacity in line with population growth, the remoteness of communities, the lack of resources, the poor coordination between provincial and district levels, the complexity of the society, the lack of teachers and a curriculum materials.
The last 10 years has seen major programs and policies to improve access, retention, quality, equity and education management, although there has not always been measured and sustained progress. Corresponding reforms in governance were introduced and critical financial resources provided, to enable efficient and effective delivery of basic education, resulting in improved education access, retention and quality.
Mixed outcomes have been achieved over the last plan period 2006-2016. As shown in figure 3 Students’ enrolments in the other sectors except Primary have exceeded the projected targets in the PEP.
0
5000
10000
15000
2006 2007 2008 2009 2010 2011 2012 2013 2014
Prep enrolment
Plan Actual
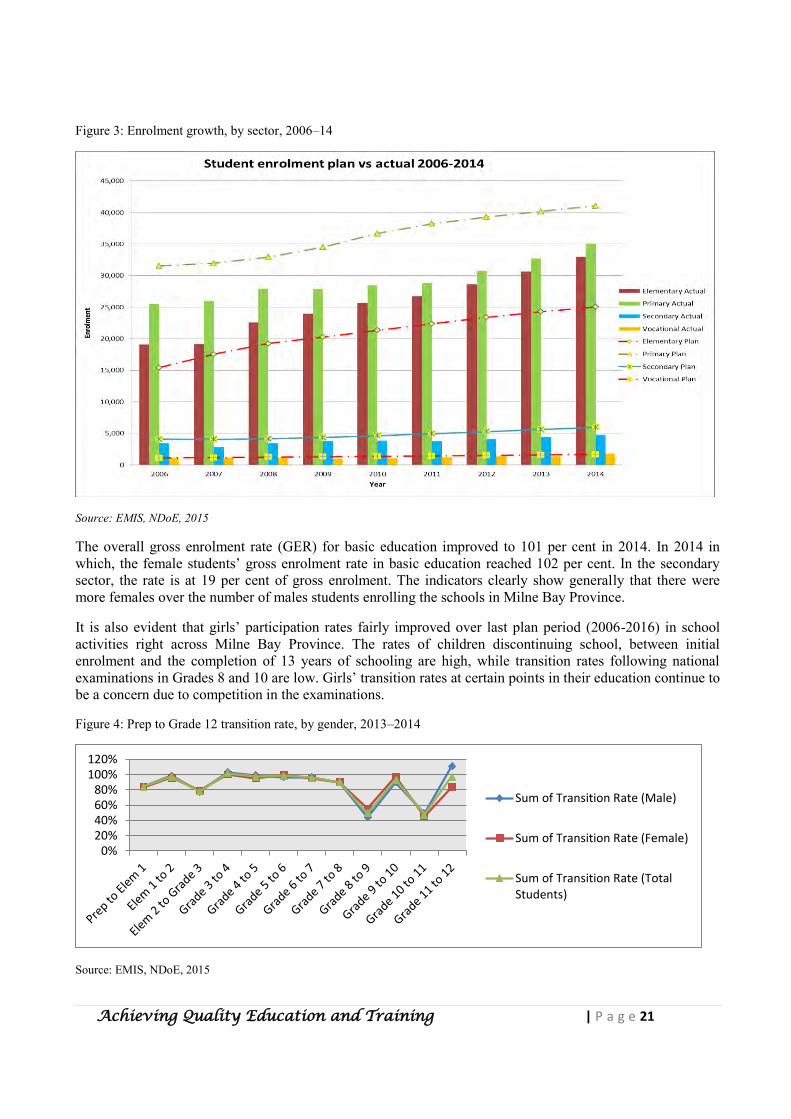
Achieving Quality Education and Training | P a g e 21
Figure 3: Enrolment growth, by sector, 2006–14
Source: EMIS, NDoE, 2015
The overall gross enrolment rate (GER) for basic education improved to 101 per cent in 2014. In 2014 in which, the female students’ gross enrolment rate in basic education reached 102 per cent. In the secondary sector, the rate is at 19 per cent of gross enrolment. The indicators clearly show generally that there were more females over the number of males students enrolling the schools in Milne Bay Province.
It is also evident that girls’ participation rates fairly improved over last plan period (2006-2016) in school activities right across Milne Bay Province. The rates of children discontinuing school, between initial enrolment and the completion of 13 years of schooling are high, while transition rates following national examinations in Grades 8 and 10 are low. Girls’ transition rates at certain points in their education continue to be a concern due to competition in the examinations.
Figure 4: Prep to Grade 12 transition rate, by gender, 2013–2014
Source: EMIS, NDoE, 2015
0%20%40%60%80%
100%120%
Sum of Transition Rate (Male)
Sum of Transition Rate (Female)
Sum of Transition Rate (TotalStudents)
| P a g e 22 Achieving Quality Education and Training
Evidence from this analysis suggests the need for a good combination of policies targeted at increasing the demand for education, especially in rural areas. The introduction of Tuition Fee Free Policy (TFF) in 2012 is one such initiative that is clearly making an impact, but more research is required to understand its potential to sustain the increase in enrolments and to improve retention and completion rates. However, one of the key lessons learnt from the current wave of reforms is that rapid expansion must go in line with measures to provide a quality education. Ensuring the education and training of quality teachers, effective deployment of teachers, provision of sufficient and appropriate infrastructure facilities, procurement and availability of essential teaching and learning resources, and the provision of sustainable professional learning are important to this endeavor.
Achieving Quality Education and Training | P a g e 23
FINANCING EDUCATION IN MILNE BAY Apart from the national TFF and service improvement program funds, Provincial Government through national budget also allocates significant amount of functional grants direct to Provincial Division of Education. Provincial Division of Education had experienced constant increases in the functional grant allocation annually. The Provincial Education Functional grant supports the general administration of education division both provincial and the district offices. The functional grant then is further allocated for the provincial schools’ subsidy component and the maintenance grants for minor works on infrastructure. Figure 5: Expenditure in Education Sector 2009 to 2015
Source: Provincial annual budget expenditure report 2009-2015 Teaching Service personal emolument cost was consistent from 2009 to 2014. The change in the government focus on tuition free education had affected the budget expenditure from 2013 to 2014. The allocation to the personnel emolument for 2015 increased drastically. The 35% increase in Personnel Emoluments (PE) budget expenditure is the direct result education revisiting to the TSC determinations. Table 1: Funding sources and allocation, by year 2007 -2014 MBP EDUCATION FUNDING, in 'Thousand Kina, 2007-2015
Year Functional Grant TSC Emoluments Leave fares SIP Total
2015 7,719,500 49,810,000 1,163,700 1,100,000 59,793,200
2014 7,433,300 32,485,900 1,163,700 4,797,800 45,880,700
2013 6,977,700 32,485,900 1,163,700 1,728,800 42,356,100
2012 4,695,100 30,647,100 1,163,700 36,505,900
2011 2,948,100 28,508,900 1,163,700 32,620,700
2010 2,248,000 26,971,500 1,051,200 30,270,700
2009 1,715,200 25,517,000 994,500 28,226,700
2008 1,452,240 23,289,100 914,900 25,656,240
2007 1,185,045 22,835,300 865,600 24,885,945
Total 36,374,185 272,550,700 9,644,700 7,626,600 326,196,185
-
10
20
30
40
50
60
2009 2010 2011 2012 2013 2014 2015
Am
ou
nts
in
Mil
lio
n K
ina
Cloumn Graph Showing Education Expenditure - 2009-2015
Functional Grants TSC PE Leave Fares PSIP
| P a g e 24 Achieving Quality Education and Training
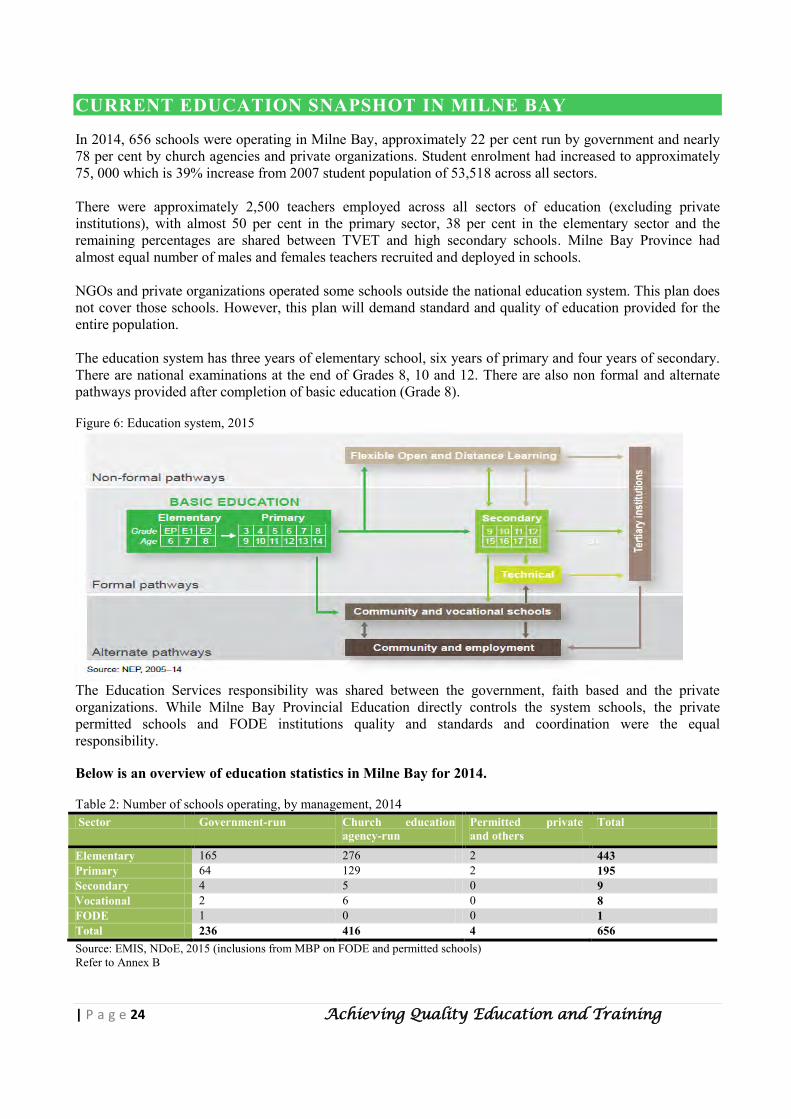
CURRENT EDUCATION SNAPSHOT IN MILNE BAY In 2014, 656 schools were operating in Milne Bay, approximately 22 per cent run by government and nearly 78 per cent by church agencies and private organizations. Student enrolment had increased to approximately 75, 000 which is 39% increase from 2007 student population of 53,518 across all sectors. There were approximately 2,500 teachers employed across all sectors of education (excluding private institutions), with almost 50 per cent in the primary sector, 38 per cent in the elementary sector and the remaining percentages are shared between TVET and high secondary schools. Milne Bay Province had almost equal number of males and females teachers recruited and deployed in schools. NGOs and private organizations operated some schools outside the national education system. This plan does not cover those schools. However, this plan will demand standard and quality of education provided for the entire population. The education system has three years of elementary school, six years of primary and four years of secondary. There are national examinations at the end of Grades 8, 10 and 12. There are also non formal and alternate pathways provided after completion of basic education (Grade 8). Figure 6: Education system, 2015
The Education Services responsibility was shared between the government, faith based and the private organizations. While Milne Bay Provincial Education directly controls the system schools, the private permitted schools and FODE institutions quality and standards and coordination were the equal responsibility. Below is an overview of education statistics in Milne Bay for 2014. Table 2: Number of schools operating, by management, 2014 Sector Government-run Church education
agency-run Permitted private and others
Total
Elementary 165 276 2 443 Primary 64 129 2 195 Secondary 4 5 0 9 Vocational 2 6 0 8 FODE 1 0 0 1 Total 236 416 4 656 Source: EMIS, NDoE, 2015 (inclusions from MBP on FODE and permitted schools) Refer to Annex B
Achieving Quality Education and Training | P a g e 25
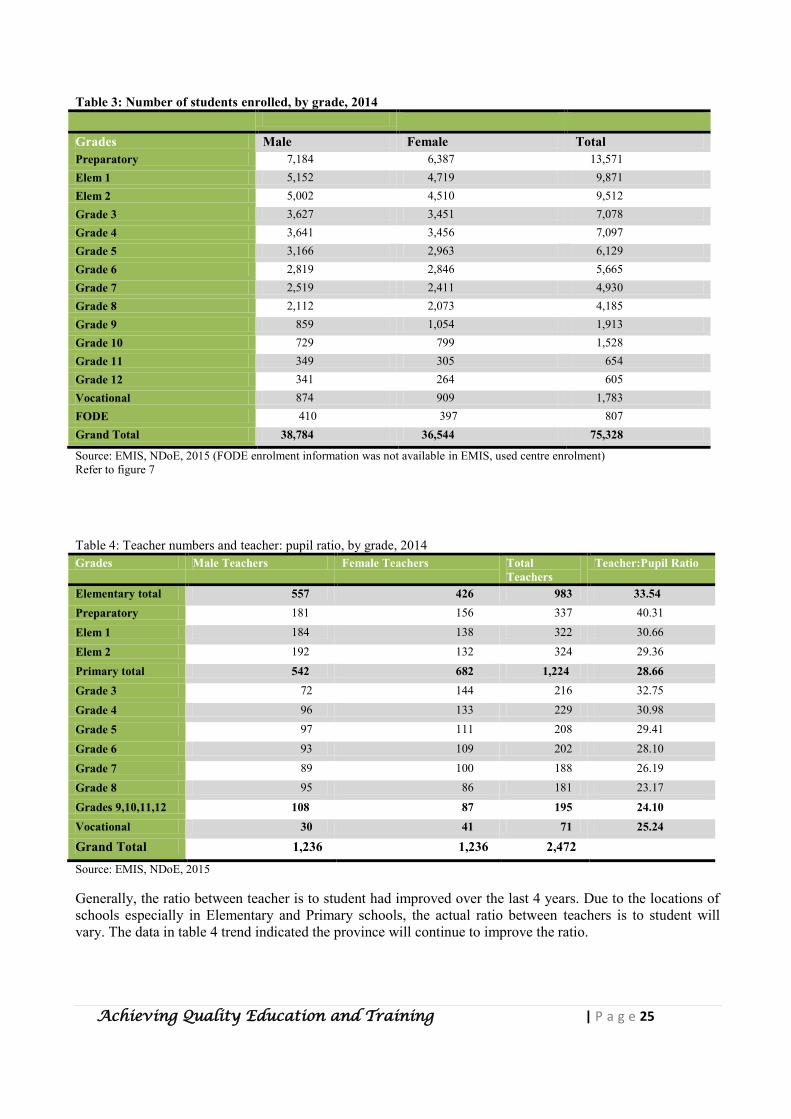
Table 3: Number of students enrolled, by grade, 2014
Grades Male Female Total Preparatory 7,184 6,387 13,571 Elem 1 5,152 4,719 9,871 Elem 2 5,002 4,510 9,512 Grade 3 3,627 3,451 7,078 Grade 4 3,641 3,456 7,097 Grade 5 3,166 2,963 6,129 Grade 6 2,819 2,846 5,665 Grade 7 2,519 2,411 4,930 Grade 8 2,112 2,073 4,185 Grade 9 859 1,054 1,913 Grade 10 729 799 1,528 Grade 11 349 305 654 Grade 12 341 264 605 Vocational 874 909 1,783 FODE 410 397 807 Grand Total 38,784 36,544 75,328
Source: EMIS, NDoE, 2015 (FODE enrolment information was not available in EMIS, used centre enrolment) Refer to figure 7 Table 4: Teacher numbers and teacher: pupil ratio, by grade, 2014 Grades Male Teachers Female Teachers Total
Teachers Teacher:Pupil Ratio
Elementary total 557 426 983 33.54 Preparatory 181 156 337 40.31
Elem 1 184 138 322 30.66
Elem 2 192 132 324 29.36 Primary total 542 682 1,224 28.66 Grade 3 72 144 216 32.75
Grade 4 96 133 229 30.98 Grade 5 97 111 208 29.41
Grade 6 93 109 202 28.10
Grade 7 89 100 188 26.19 Grade 8 95 86 181 23.17
Grades 9,10,11,12 108 87 195 24.10 Vocational 30 41 71 25.24
Grand Total 1,236 1,236 2,472
Source: EMIS, NDoE, 2015 Generally, the ratio between teacher is to student had improved over the last 4 years. Due to the locations of schools especially in Elementary and Primary schools, the actual ratio between teachers is to student will vary. The data in table 4 trend indicated the province will continue to improve the ratio.
| P a g e 26 Achieving Quality Education and Training
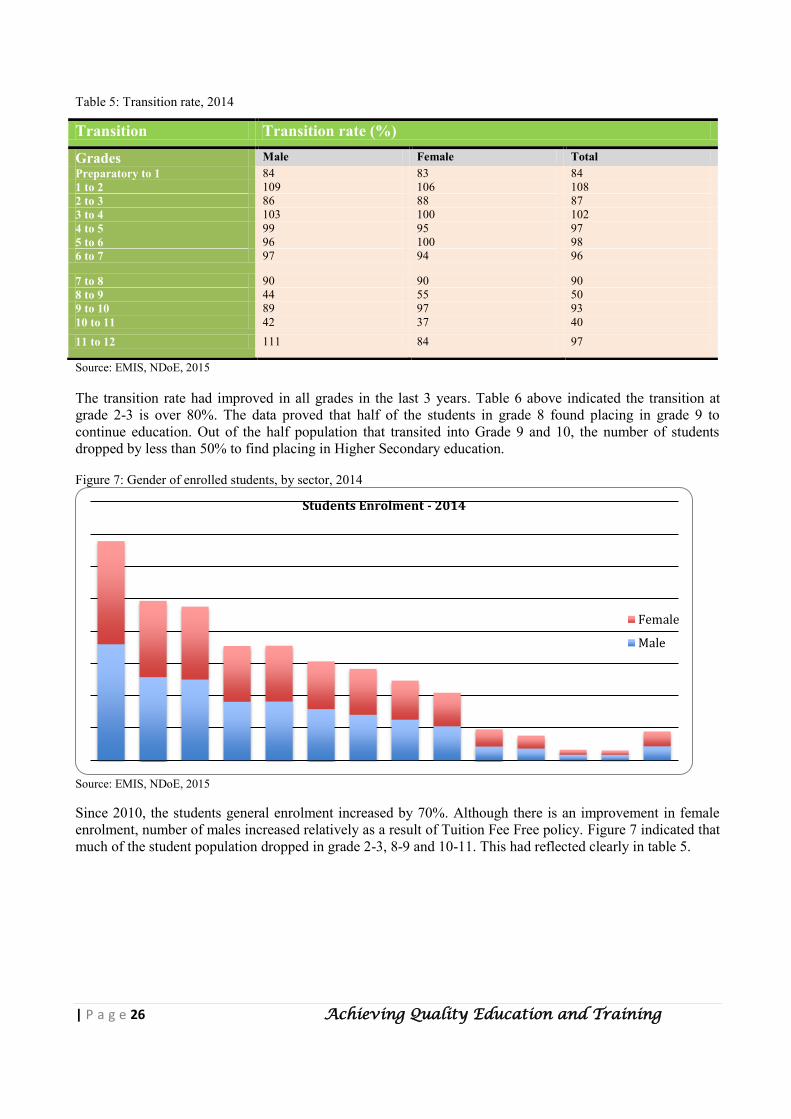
Table 5: Transition rate, 2014
Source: EMIS, NDoE, 2015 The transition rate had improved in all grades in the last 3 years. Table 6 above indicated the transition at grade 2-3 is over 80%. The data proved that half of the students in grade 8 found placing in grade 9 to continue education. Out of the half population that transited into Grade 9 and 10, the number of students dropped by less than 50% to find placing in Higher Secondary education. Figure 7: Gender of enrolled students, by sector, 2014
Source: EMIS, NDoE, 2015 Since 2010, the students general enrolment increased by 70%. Although there is an improvement in female enrolment, number of males increased relatively as a result of Tuition Fee Free policy. Figure 7 indicated that much of the student population dropped in grade 2-3, 8-9 and 10-11. This had reflected clearly in table 5.
Students Enrolment - 2014
Female
Male
Transition Transition rate (%)
Grades Male Female Total Preparatory to 1 84 83 84 1 to 2 109 106 108 2 to 3 86 88 87 3 to 4 103 100 102 4 to 5 99 95 97 5 to 6 96 100 98 6 to 7 97 94 96
7 to 8 90 90 90 8 to 9 44 55 50 9 to 10 89 97 93 10 to 11 42 37 40 11 to 12 111 84 97
Achieving Quality Education and Training | P a g e 27
SECTION THREE
PLANNING
FRAMEWORK
SECTION THREE
| P a g e 28 Achieving Quality Education and Training
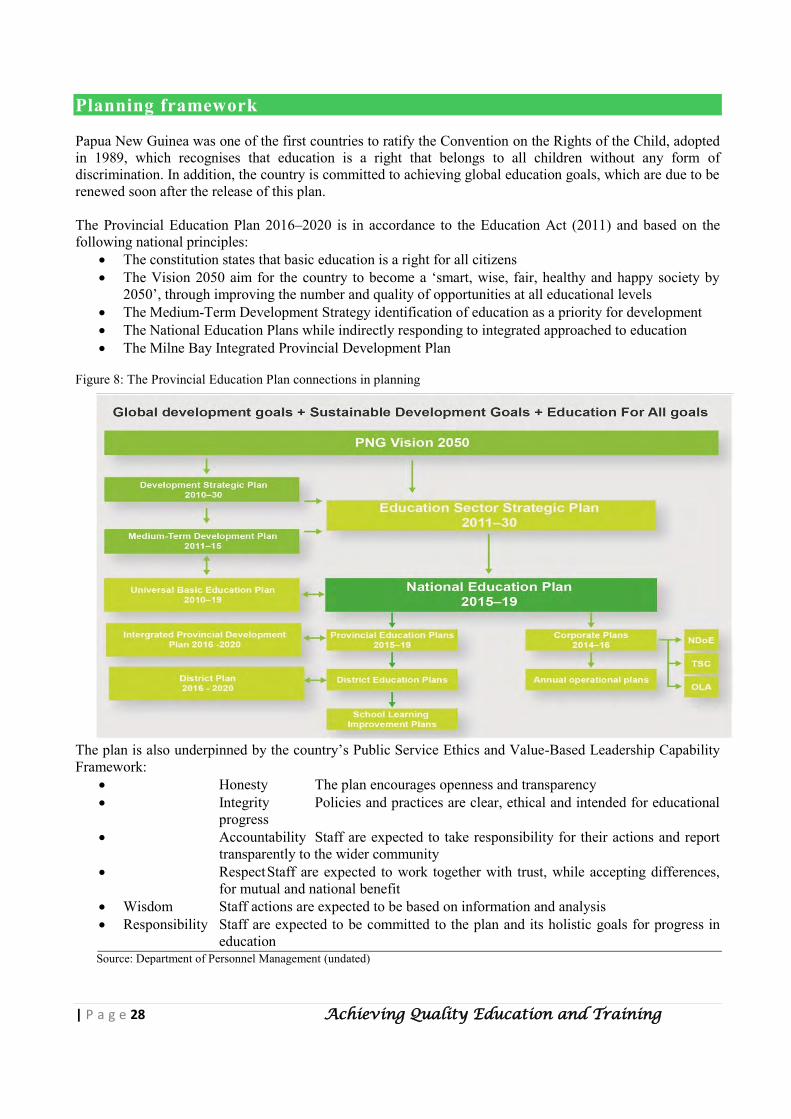
Planning framework Papua New Guinea was one of the first countries to ratify the Convention on the Rights of the Child, adopted in 1989, which recognises that education is a right that belongs to all children without any form of discrimination. In addition, the country is committed to achieving global education goals, which are due to be renewed soon after the release of this plan. The Provincial Education Plan 2016–2020 is in accordance to the Education Act (2011) and based on the following national principles:
The constitution states that basic education is a right for all citizens The Vision 2050 aim for the country to become a ‘smart, wise, fair, healthy and happy society by
2050’, through improving the number and quality of opportunities at all educational levels The Medium-Term Development Strategy identification of education as a priority for development The National Education Plans while indirectly responding to integrated approached to education The Milne Bay Integrated Provincial Development Plan
Figure 8: The Provincial Education Plan connections in planning
The plan is also underpinned by the country’s Public Service Ethics and Value-Based Leadership Capability Framework:
Honesty The plan encourages openness and transparency Integrity Policies and practices are clear, ethical and intended for educational
progress Accountability Staff are expected to take responsibility for their actions and report
transparently to the wider community Respect Staff are expected to work together with trust, while accepting differences,
for mutual and national benefit Wisdom Staff actions are expected to be based on information and analysis Responsibility Staff are expected to be committed to the plan and its holistic goals for progress in
education Source: Department of Personnel Management (undated)
Achieving Quality Education and Training | P a g e 29
The PEP provides strategic direction for an integrated approach to education in Milne Bay. It focuses on improving the quality of education for all and takes account of widespread consultation. Gender equality is a cross-cutting issue reflected across the entire plan and its implementation. The PEP 2016–2020 builds on the PEP 2007–16, IPDP 2011-2015 and the Education Sector Strategic Plan 2010–30, while complementing the Universal Basic Education (UBE) Plan 2010–19. Education Sector Strategic Plan 2010–30
Access All children complete nine years of basic education and have the opportunity for education or training beyond Grade 8
Teachers and teacher education All teachers are well trained and resourced and are accepted by the community as professionals
Curriculum All curricula are sensitive to local needs and students’ aspirations System management and planning All institutions are managed effectively and transparently and
are accountable to their local communities Technical and Vocational Education and Training A national system of public and private
institutions offering skills development courses, ranging from short to full-time, leading to diploma and technician qualifications
| P a g e 30 Achieving Quality Education and Training
Plan implementation The plan is inspirational and responsive to identified needs and challenges. To achieve quality education and training for all, an emphasis on implementing the strategies as per the timeframe in this plan is essential. To achieve optimal progress it is hoped that all implementing partners will collaborate to achieve the common direction outlined in this plan. This PEP cascades from the NEP 2015–19. As a component of the National Education System (NES), the Provincial Education Plan 2016–2020 is in accordance with the Provincial Education Law (2011) and aligned with the National Education Plan 2015-2019 strategies. Below is a summary of the roles of the many stakeholders in the crucial implementation of the NEP 2015–19. Provincial Education Board
Provide advice and guidance, set student quotas and selection criteria, approve governing body membership, impose and set school fees, approve appointments (see the Education Law)
Chairman for Education
Set provincial government’s education vision and direction, develop policies and issue directives (see the Education Law)
Provincial Education Advisor
Provide leadership in the implementation of the PEP and government policy, through Division of Education (see the Education Act)
Development partners and NGOs
Provide technical assistance and financial support, aligned to PEP
Church education agencies
Support PEP direction and adopt relevant strategies
Provincial Education Office
Create provincial and district education plans to carry out NEP responsibilities, with NDoE and provincial planning office support
Implement the PEP in accordance with Provincial Education Law Monitor and evaluate against targets in PEP Conduct annual reviews of PEP progress
District administrations
Ensure that districts meet the minimum education and infrastructure standards Provide professional and administrative support for head teachers, to improve
teaching and learning
District Development Authority
Build school infrastructure to standards Monitor education function at the districts level
Local-Level Governments
Establish and develop schools
Schools Administrators and boards implement strategies to improve quality learning for all Communities Parents and communities to support students in learning
Communities to ensure security of school premises
Achieving Quality Education and Training | P a g e 31
SECTION FOUR
THE PLAN
| P a g e 32 Achieving Quality Education and Training
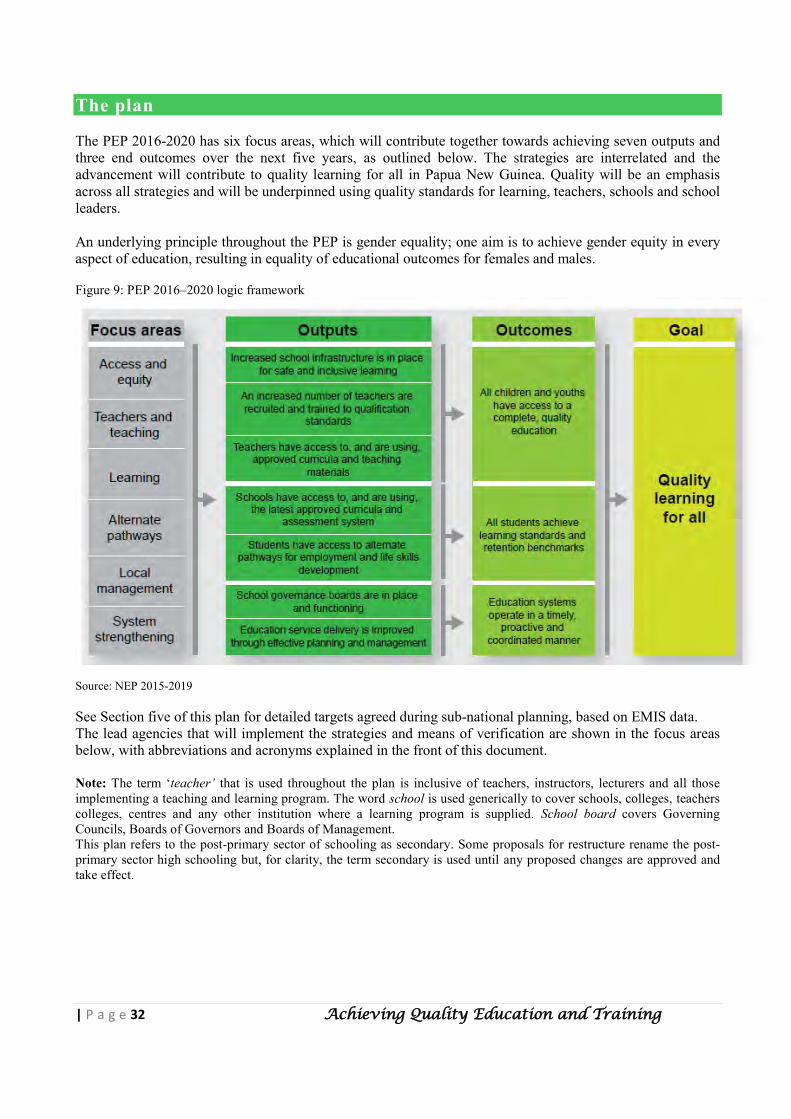
The plan The PEP 2016-2020 has six focus areas, which will contribute together towards achieving seven outputs and three end outcomes over the next five years, as outlined below. The strategies are interrelated and the advancement will contribute to quality learning for all in Papua New Guinea. Quality will be an emphasis across all strategies and will be underpinned using quality standards for learning, teachers, schools and school leaders. An underlying principle throughout the PEP is gender equality; one aim is to achieve gender equity in every aspect of education, resulting in equality of educational outcomes for females and males. Figure 9: PEP 2016–2020 logic framework
Source: NEP 2015-2019 See Section five of this plan for detailed targets agreed during sub-national planning, based on EMIS data. The lead agencies that will implement the strategies and means of verification are shown in the focus areas below, with abbreviations and acronyms explained in the front of this document. Note: The term ‘teacher’ that is used throughout the plan is inclusive of teachers, instructors, lecturers and all those implementing a teaching and learning program. The word school is used generically to cover schools, colleges, teachers colleges, centres and any other institution where a learning program is supplied. School board covers Governing Councils, Boards of Governors and Boards of Management. This plan refers to the post-primary sector of schooling as secondary. Some proposals for restructure rename the post-primary sector high schooling but, for clarity, the term secondary is used until any proposed changes are approved and take effect.
Achieving Quality Education and Training | P a g e 33
Access and Equity 2020 output targets include: 12 per cent more schools. 76 21 per cent more classrooms. 739 20 per cent of schools will have libraries. Toilet: pupil ratio will be 1:25 for girls and 1:40 for boys 80 per cent of students have access to functional water facilities 80 per cent of educational institutions have hand-washing facilities (running water and soap) More special-needs students Gross intake ratio will be 100 per cent for elementary and primary, 60 per cent for secondary
The Province will make every effort to provide access to education for all school-age children and youths. Milne Bay as a maritime province is challenged to provide access to every child in remote small communities. The province through this plan emphasizes on boarding primary schools to give fair chance of education to remote islands or communities (refer to Annex A). In line with Vision 2050 requirements there is plan for a new teachers college and two technical colleges to be established. The Province will continue to provide counter funding in the form of annual school subsidy to support National Education Tuition Fee Free (TFF) policy. The provision of school subsidy grants or materials will support the province to achieve Universal Education. The improvements in many aspects of schooling system will give all children the chance to enter at the age of six in preparatory until they reach Grade 12 or the equivalent education at the age of 18 years. The existing system barriers will be gradually removed to enable access. Associated strategies are outlined in relevant focus areas of this plan. In terms of tertiary support, the province will continue to provide partial scholarship to students who attend recognized tertiary institutions. The province in close consultation with the four districts takes an innovative approach to provide access to students in urban, rural and remote schools. Significant infrastructure includes classrooms, teachers’ houses, clean water and sanitation facilities to provide suitable learning environment that is friendly, safe and healthy for all children in Milne Bay. The province will continue to develop and improve schools infrastructure to the required standard at all levels to cater for annual increases in student enrolments. The ultimate objective of the quality education is to provide opportunity for all school aged children and youths regardless of gender, race, religion or denomination, cultural beliefs and those marginalized by the system. These are children and youths that do not have opportunity to Access and Equity. This plan outlines the options of quality education accessible to children and youths while strategizing avenues to provide more opportunity and correct pathway in education. The strategies are also aimed at establishing child friendly and inclusive learning in schools where children are located. It also gives a wide range of options for suitable alternate pathways for youth to attain basic literacy and numeracy skills. This includes those school aged children not in school or those who have never got an opportunity to be enrolled. The planned strategies will provide opportunity and avenues to re-engage children and youths. The increase in access will put pressure on the existing infrastructure in the institutions. In order to increase access for all, infrastructure targets are provided to assist with planning. The infrastructure development will accommodate for the boarding facilities and the decentralization of a primary class to elementary in very isolated areas.
| P a g e 34 Achieving Quality Education and Training
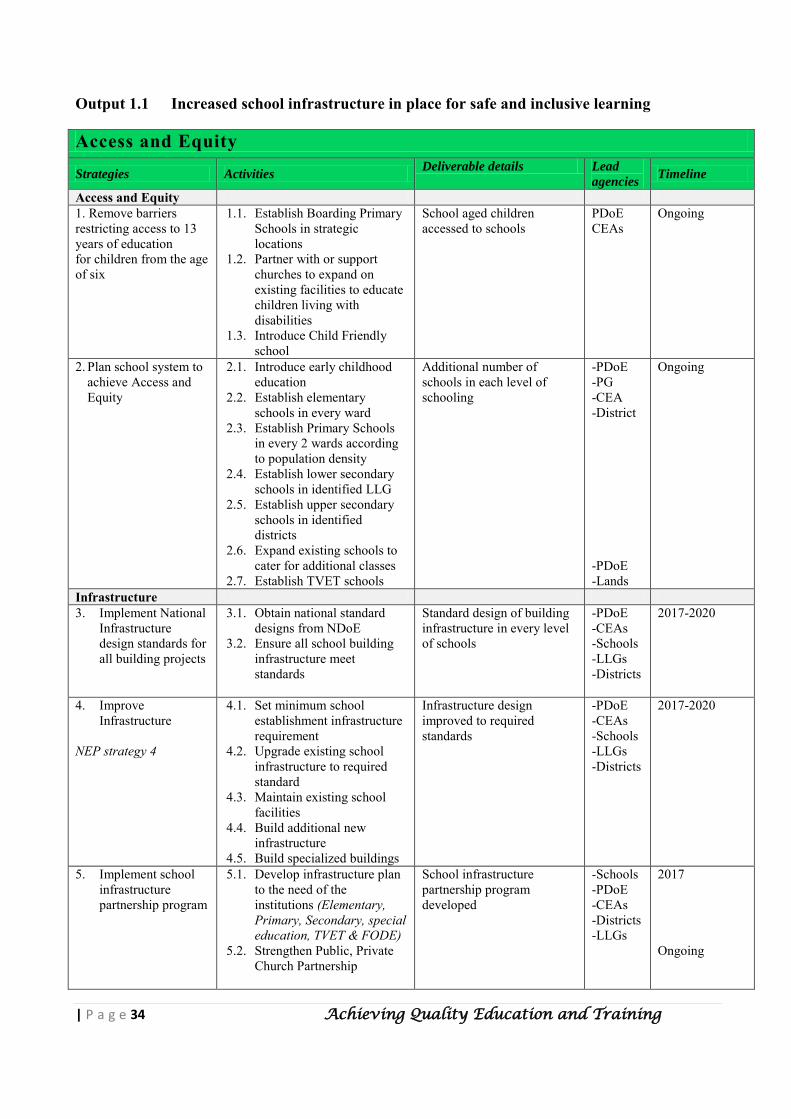
Output 1.1 Increased school infrastructure in place for safe and inclusive learning Access and Equity
Strategies Activities Deliverable details Lead
agencies Timeline
Access and Equity 1. Remove barriers restricting access to 13 years of education for children from the age of six
1.1. Establish Boarding Primary Schools in strategic locations
1.2. Partner with or support churches to expand on existing facilities to educate children living with disabilities
1.3. Introduce Child Friendly school
School aged children accessed to schools
PDoE CEAs
Ongoing
2. Plan school system to achieve Access and Equity
2.1. Introduce early childhood education
2.2. Establish elementary schools in every ward
2.3. Establish Primary Schools in every 2 wards according to population density
2.4. Establish lower secondary schools in identified LLG
2.5. Establish upper secondary schools in identified districts
2.6. Expand existing schools to cater for additional classes
2.7. Establish TVET schools
Additional number of schools in each level of schooling
-PDoE -PG -CEA -District -PDoE -Lands
Ongoing
Infrastructure 3. Implement National
Infrastructure design standards for all building projects
3.1. Obtain national standard designs from NDoE
3.2. Ensure all school building infrastructure meet standards
Standard design of building infrastructure in every level of schools
-PDoE -CEAs -Schools -LLGs -Districts
2017-2020
4. Improve Infrastructure
NEP strategy 4
4.1. Set minimum school establishment infrastructure requirement
4.2. Upgrade existing school infrastructure to required standard
4.3. Maintain existing school facilities
4.4. Build additional new infrastructure
4.5. Build specialized buildings
Infrastructure design improved to required standards
-PDoE -CEAs -Schools -LLGs -Districts
2017-2020
5. Implement school infrastructure partnership program
5.1. Develop infrastructure plan to the need of the institutions (Elementary, Primary, Secondary, special education, TVET & FODE)
5.2. Strengthen Public, Private Church Partnership
School infrastructure partnership program developed
-Schools -PDoE -CEAs -Districts -LLGs
2017 Ongoing
Achieving Quality Education and Training | P a g e 35
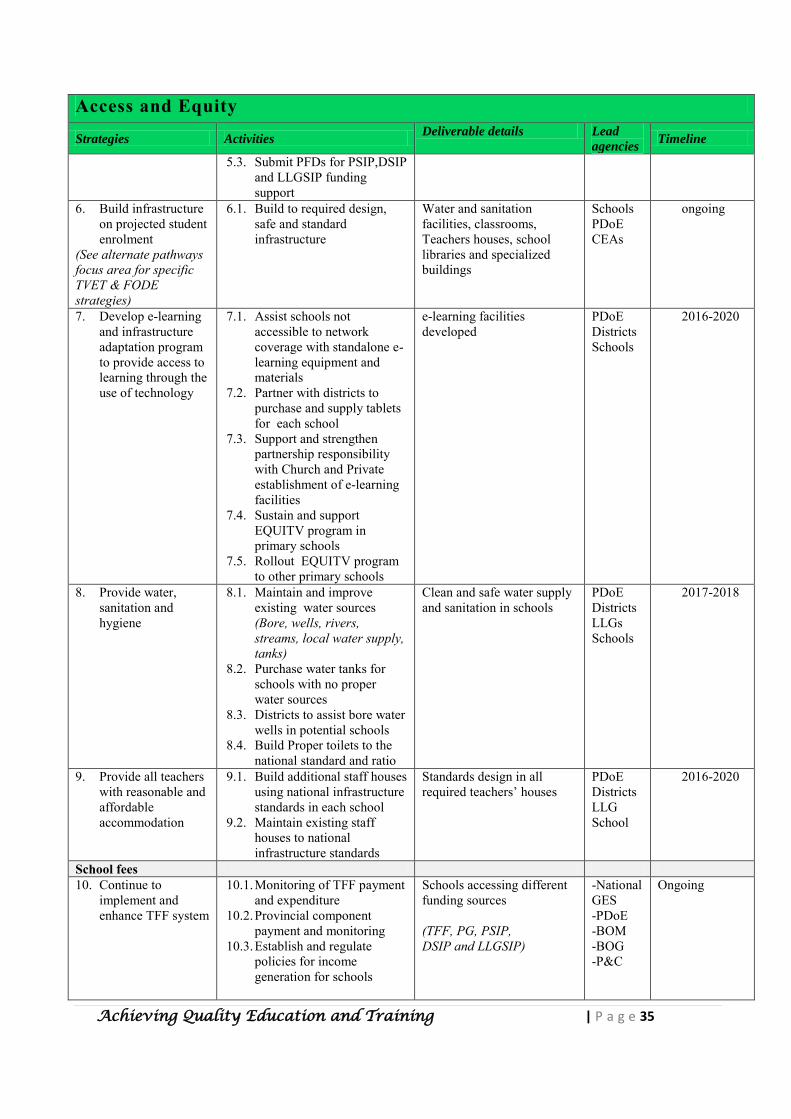
Access and Equity
Strategies Activities Deliverable details Lead
agencies Timeline
5.3. Submit PFDs for PSIP,DSIP and LLGSIP funding support
6. Build infrastructure on projected student enrolment
(See alternate pathways focus area for specific TVET & FODE strategies)
6.1. Build to required design, safe and standard infrastructure
Water and sanitation facilities, classrooms, Teachers houses, school libraries and specialized buildings
Schools PDoE CEAs
ongoing
7. Develop e-learning and infrastructure adaptation program to provide access to learning through the use of technology
7.1. Assist schools not accessible to network coverage with standalone e-learning equipment and materials
7.2. Partner with districts to purchase and supply tablets for each school
7.3. Support and strengthen partnership responsibility with Church and Private establishment of e-learning facilities
7.4. Sustain and support EQUITV program in primary schools
7.5. Rollout EQUITV program to other primary schools
e-learning facilities developed
PDoE Districts Schools
2016-2020
8. Provide water, sanitation and hygiene
8.1. Maintain and improve existing water sources (Bore, wells, rivers, streams, local water supply, tanks)
8.2. Purchase water tanks for schools with no proper water sources
8.3. Districts to assist bore water wells in potential schools
8.4. Build Proper toilets to the national standard and ratio
Clean and safe water supply and sanitation in schools
PDoE Districts LLGs Schools
2017-2018
9. Provide all teachers with reasonable and affordable accommodation
9.1. Build additional staff houses using national infrastructure standards in each school
9.2. Maintain existing staff houses to national infrastructure standards
Standards design in all required teachers’ houses
PDoE Districts LLG School
2016-2020
School fees 10. Continue to
implement and enhance TFF system
10.1. Monitoring of TFF payment and expenditure
10.2. Provincial component payment and monitoring
10.3. Establish and regulate policies for income generation for schools
Schools accessing different funding sources (TFF, PG, PSIP, DSIP and LLGSIP)
-National GES -PDoE -BOM -BOG -P&C
Ongoing
| P a g e 36 Achieving Quality Education and Training
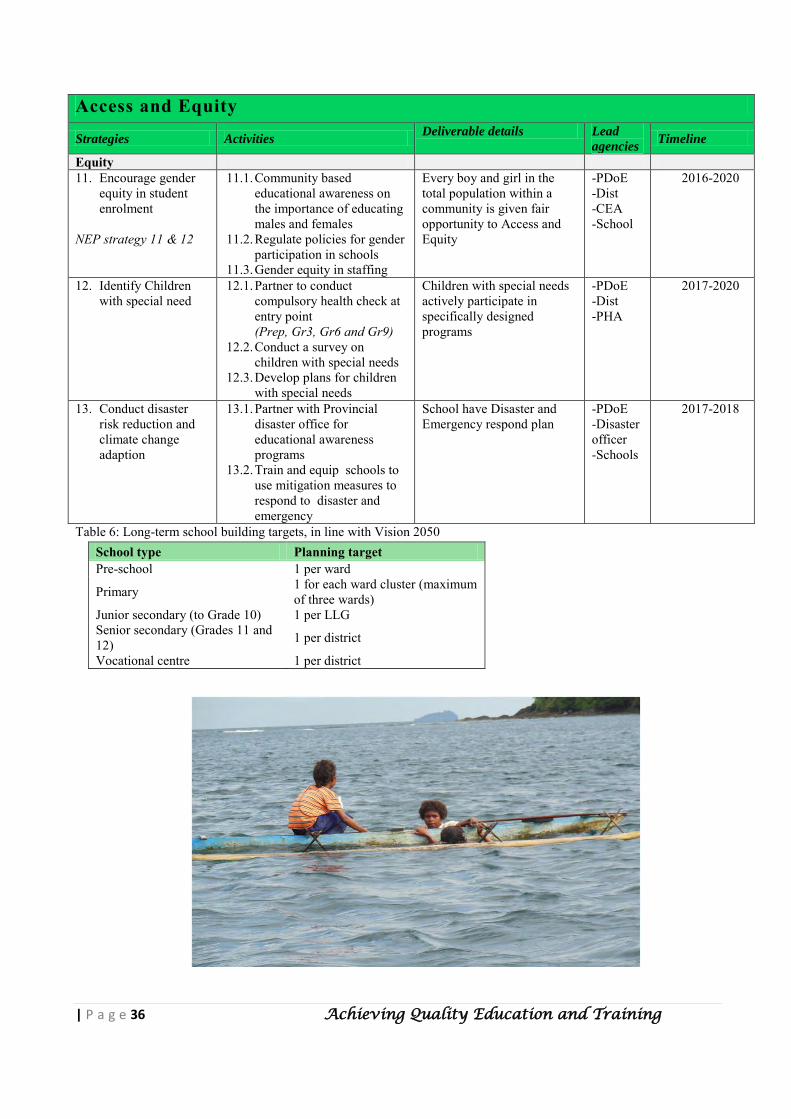
Access and Equity
Strategies Activities Deliverable details Lead
agencies Timeline
Equity 11. Encourage gender
equity in student enrolment
NEP strategy 11 & 12
11.1. Community based educational awareness on the importance of educating males and females
11.2. Regulate policies for gender participation in schools
11.3. Gender equity in staffing
Every boy and girl in the total population within a community is given fair opportunity to Access and Equity
-PDoE -Dist -CEA -School
2016-2020
12. Identify Children with special need
12.1. Partner to conduct compulsory health check at entry point (Prep, Gr3, Gr6 and Gr9)
12.2. Conduct a survey on children with special needs
12.3. Develop plans for children with special needs
Children with special needs actively participate in specifically designed programs
-PDoE -Dist -PHA
2017-2020
13. Conduct disaster risk reduction and climate change adaption
13.1. Partner with Provincial disaster office for educational awareness programs
13.2. Train and equip schools to use mitigation measures to respond to disaster and emergency
School have Disaster and Emergency respond plan
-PDoE -Disaster officer -Schools
2017-2018
Table 6: Long-term school building targets, in line with Vision 2050
School type Planning target Pre-school 1 per ward
Primary 1 for each ward cluster (maximum of three wards)
Junior secondary (to Grade 10) 1 per LLG Senior secondary (Grades 11 and 12) 1 per district
Vocational centre 1 per district
Achieving Quality Education and Training | P a g e 37
Teachers and teaching
2020 output targets include: Increased numbers of teachers with sectors’ target academic qualification 1,099 (31 per cent) more teachers 100 per cent of teachers using approved curricula 100 per cent of teachers have satisfactory access to learning materials 100 per cent of schools are adequately resourced with school materials
Quality teachers with and understanding of relevant pedagogy is critical to achieving quality learning for students.
Recruit quality teachers who are able to understand and critically apply strategic approaches in teaching and learning, and, are able to facilitate various pedagogical concepts to achieve high academic standards. Teachers have to be well trained with relevant qualifications, ensure ongoing training, and are properly equipped, resourced and supported to undertake their important role as professionals. Teachers must be well informed and supported to understand changes related to curriculum and its associated practices. As student population increases with the current policies on universal education, there is a need to ensure that there are sufficient quality teachers for all establishments in Elementary, Primary, TVET and Secondary schools.
Teachers’ contributions to a more child friendly environment are as critical as teaching itself to achieve improved learning whereby; professionalism will be highly demanded of teachers. Support regular in-service training for teachers to upgrade their professional skills and knowledge to teach. A provincial benchmarking system will be used to monitor teacher performances.
To cater for the universal education (13 years) strategy, secondary teachers must be able to teach multiple subjects while primary teachers should be equipped to teach multi-grade classes.
Along with improved teacher quality, factors such as the provision of suitable housing and the better administration of teacher registration, appointments, pay and leave fares will all significantly contribute to teachers’ professionalism and improvements in the learning environment for students.
Output 1.2 An increased number of teachers are recruited and trained to qualification standards Output 1.3 Teachers have access to, and are using, approved curricula and teaching
materials Teachers and teaching
Strategies Activities Deliverable details Lead
agencies Timeline
Pre-service training 14. Increase the number of
teachers trained, to meet increased student demand, while meeting quality standards
14.1. Recruit and train elementary teachers
14.2. Send vocational teachers to teachers college to gain teaching qualification
Qualified teachers recruited
-PDoE -Dist
2016-2020
| P a g e 38 Achieving Quality Education and Training
Teachers and teaching
Strategies Activities Deliverable details Lead
agencies Timeline
14.3. Annual teacher recruitment exercise for Primary and Secondary sector
15. Improve pre-service teacher training
15.1. Phase out mix mode elementary training
15.2. Sponsor students from disadvantage areas to teachers college
15.3. Establish primary school teachers college
Improved qualification for all teachers
-PDoE -Dist
2016
In-service training 16. Improve quality of all teachers
by implementing a National Teachers’ Competency Framework
16.1. Develop Provincial In-service plan
16.2. School Based In-service & training
16.3. Cluster base in-service & training
16.4. Combine In-service 16.5. Professional &
competency assessment
16.6. Annual induction for new teachers
16.7. Unified school based in-services and trainings programs
Provincial In-Service Plan
-PDoE -S&G -Dist
2016 Ongoing
17. Enhance teacher quality by providing support and professional learning
17.1. Provide training in use of ICT to enhance e-learning
17.2. Align and implement National Teachers Competency Frame Work (NTCF)
17.3. Upgrade teacher qualification
Improved teacher professionalism
-PDoE -MIS -Schools -NDoE
2016-2020
18. Provide specialized training for specialized subjects and education
18.1. Train required number of teachers for inclusive education
18.2. Identify and train teachers for specialized subjects in secondary schools, FODE, Early Childhood, ICT, Guidance and Counseling and trades for TVET
Well trained teachers in specialized subject areas and special education
-NDoE -PDoE -Dist
2017-2019
Achieving Quality Education and Training | P a g e 39
Teachers and teaching
Strategies Activities Deliverable details Lead
agencies Timeline
18.3. Provide sufficient specialized teaching and learning materials
19. Train and support teachers for Standards-Based Curriculum
19.1. Conduct trainings in each LLGs for basic education
19.2. Conduct combined training for high and secondary teachers
Standard Based Curriculum (SBC) is well implemented
-NDoE -PDoE -Dist
2016-17 Basic Education 2018 Lower Secondary 2019 upper Secondary & TVET
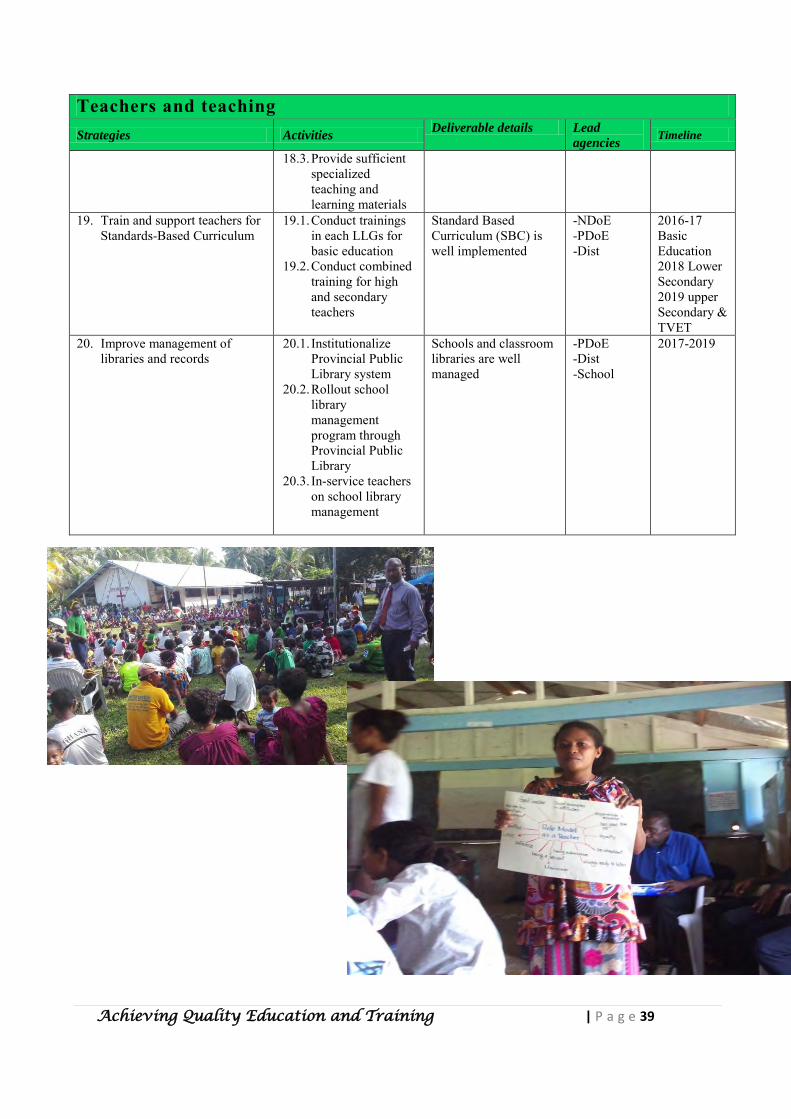
20. Improve management of libraries and records
20.1. Institutionalize Provincial Public Library system
20.2. Rollout school library management program through Provincial Public Library
20.3. In-service teachers on school library management
Schools and classroom libraries are well managed
-PDoE -Dist -School
2017-2019
| P a g e 40 Achieving Quality Education and Training
Learning
2020 output targets include: 100 per cent of schools using approved curricula (SBC) 100 per cent teachers using approved curricula (SBC) or National Qualifications Framework
materials 1:1 pupil:text book ratio 100 per cent of schools using new assessment for learning system
Improving learning requires a focus on the learner. There will be a greater emphasis on considering students holistically and appreciating the differences between individuals, as well as understanding learning both inside and outside of school. Strategies employed under the learner focus will combine with those to improve access, to provide relevant teaching and learning experiences. This focus includes formal, informal and non-formal learning. Ethical and moral values education will be introduced as part of the curriculum implementation so that students will develop a sense of respect for nature and for others. They will learn to promote and preserve their culture, practice harmonious conflict resolution strategies and become caring, conscientious and responsible citizens. Schools will become safe and free from gender-based violence and bullying. Gender equity will remain a cross-cutting issue and should be considered in all activities to ensure girls’ outcomes are equal to boys’. Disasters have detrimental effects on the fulfillment of children’s right to education. Climate change adaptation and disaster risk reduction, including mock earthquake, cyclone and water safety drills will be part of the curriculum. Students will be taught health and safety rules to reduce manmade disaster. As a major component of learning, the curriculum will provide coherent pathways for learners to acquire skills and knowledge seen by policymakers as essential for life in Milne Bay. To overcome past curriculum problems, all stakeholders will embrace the new Standards-Based Curriculum (SBC) for elementary, primary and secondary learners. SBC will continue to be rolled out with associated resources and learning materials distributed to all schools. TVET and FODE institutions will implement competency-based curriculum aligned with the National Qualifications Framework. The PDoE will explore the possibilities of e-learning initiatives to enhance teaching and learning in the provincial context while maintaining the current EQUITV programs. Libraries will remain an important component of education, by providing books to supplement curriculum materials in the institutions including setting up of e-libraries where appropriate. The province will implement assessment policy consistent to changes in examinations, to ensure that students are not prevented from progressing through education. The introduction of an assessment system to measure quality teaching and learning subsequently will determine student progress from one level to another. Any changes will ensure assessment aligns with and supports the curriculum while reflecting best national and international practice. The province will support and harness the power of the digital age with an approach that is practical and viable for enhancing traditional learning.
Achieving Quality Education and Training | P a g e 41
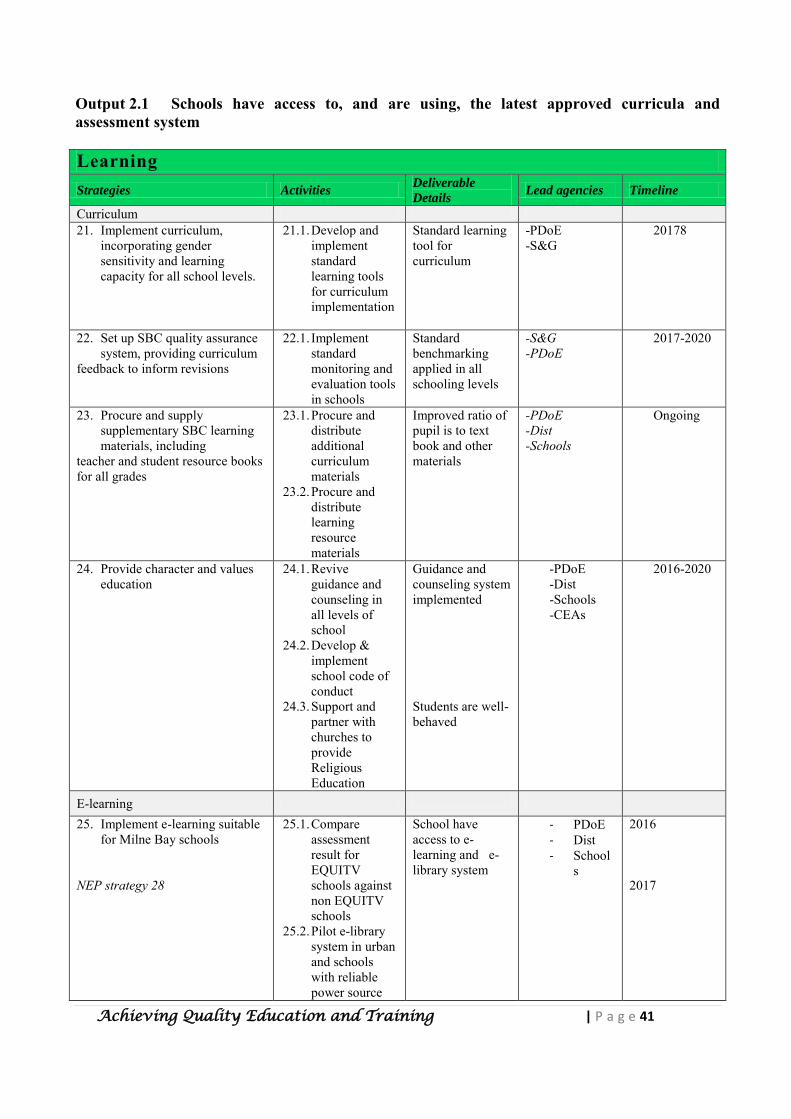
Output 2.1 Schools have access to, and are using, the latest approved curricula and assessment system Learning Strategies Activities
Deliverable
Details Lead agencies Timeline
Curriculum 21. Implement curriculum,
incorporating gender sensitivity and learning capacity for all school levels.
21.1. Develop and implement standard learning tools for curriculum implementation
Standard learning tool for curriculum
-PDoE -S&G
20178
22. Set up SBC quality assurance system, providing curriculum
feedback to inform revisions
22.1. Implement standard monitoring and evaluation tools in schools
Standard benchmarking applied in all schooling levels
-S&G -PDoE
2017-2020
23. Procure and supply supplementary SBC learning materials, including
teacher and student resource books for all grades
23.1. Procure and distribute additional curriculum materials
23.2. Procure and distribute learning resource materials
Improved ratio of pupil is to text book and other materials
-PDoE -Dist -Schools
Ongoing
24. Provide character and values education
24.1. Revive guidance and counseling in all levels of school
24.2. Develop & implement school code of conduct
24.3. Support and partner with churches to provide Religious Education
Guidance and counseling system implemented Students are well-behaved
-PDoE -Dist -Schools -CEAs
2016-2020
E-learning 25. Implement e-learning suitable
for Milne Bay schools NEP strategy 28
25.1. Compare assessment result for EQUITV schools against non EQUITV schools
25.2. Pilot e-library system in urban and schools with reliable power source
School have access to e-learning and e-library system
- PDoE - Dist - School
s
2016 2017
| P a g e 42 Achieving Quality Education and Training
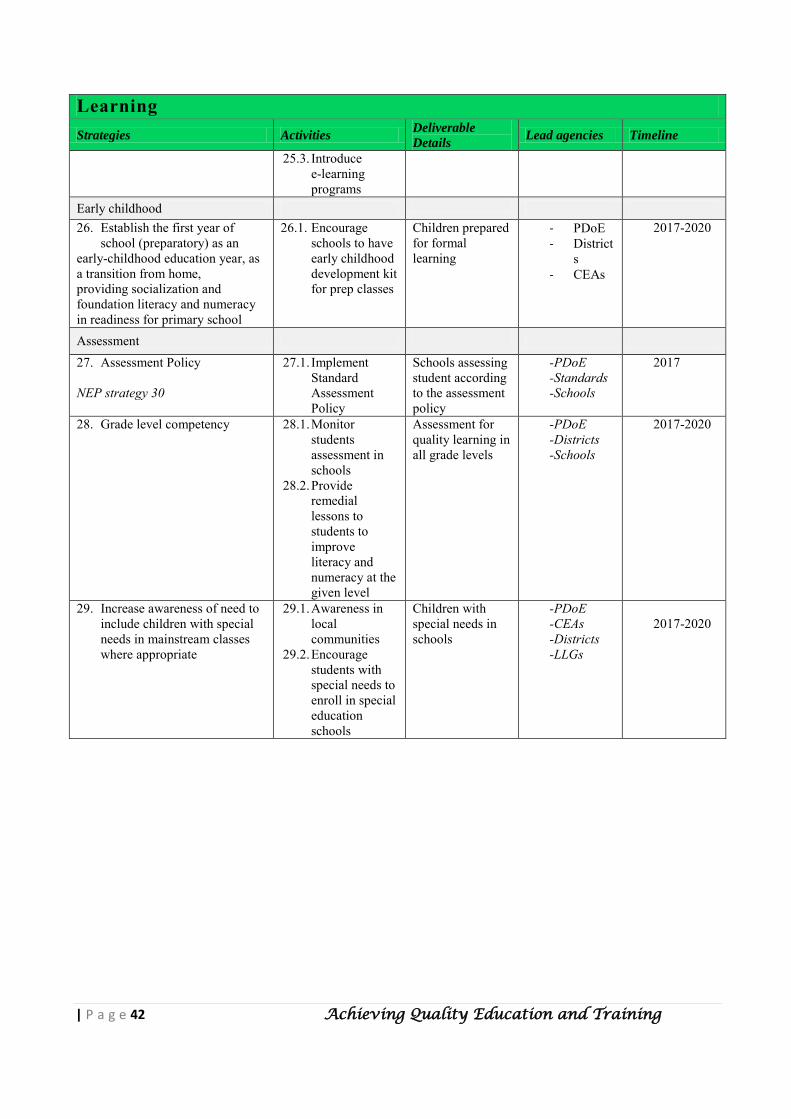
Learning Strategies Activities
Deliverable
Details Lead agencies Timeline
25.3. Introduce e-learning programs
Early childhood 26. Establish the first year of
school (preparatory) as an early-childhood education year, as a transition from home, providing socialization and foundation literacy and numeracy in readiness for primary school
26.1. Encourage schools to have early childhood development kit for prep classes
Children prepared for formal learning
- PDoE - District
s - CEAs
2017-2020
Assessment 27. Assessment Policy NEP strategy 30
27.1. Implement Standard Assessment Policy
Schools assessing student according to the assessment policy
-PDoE -Standards -Schools
2017
28. Grade level competency 28.1. Monitor students assessment in schools
28.2. Provide remedial lessons to students to improve literacy and numeracy at the given level
Assessment for quality learning in all grade levels
-PDoE -Districts -Schools
2017-2020
29. Increase awareness of need to include children with special needs in mainstream classes where appropriate
29.1. Awareness in local communities
29.2. Encourage students with special needs to enroll in special education schools
Children with special needs in schools
-PDoE -CEAs -Districts -LLGs
2017-2020
Achieving Quality Education and Training | P a g e 43
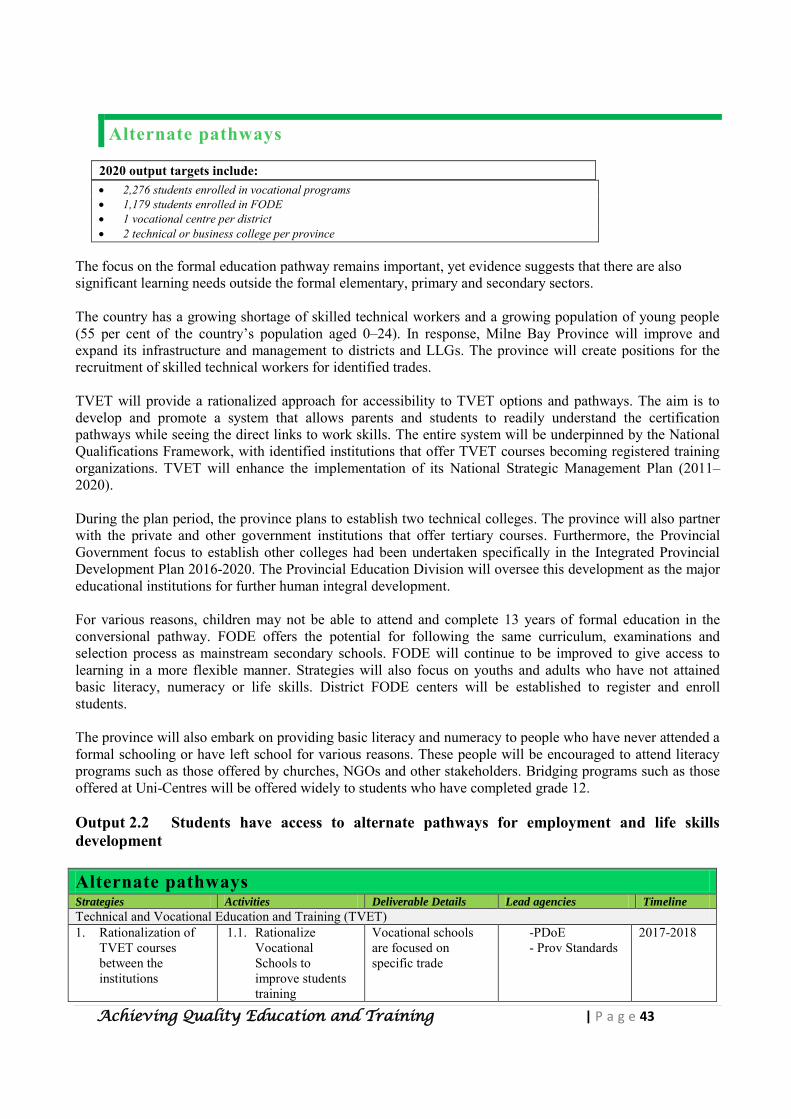
Alternate pathways
2020 output targets include: 2,276 students enrolled in vocational programs 1,179 students enrolled in FODE 1 vocational centre per district 2 technical or business college per province
The focus on the formal education pathway remains important, yet evidence suggests that there are also significant learning needs outside the formal elementary, primary and secondary sectors. The country has a growing shortage of skilled technical workers and a growing population of young people (55 per cent of the country’s population aged 0–24). In response, Milne Bay Province will improve and expand its infrastructure and management to districts and LLGs. The province will create positions for the recruitment of skilled technical workers for identified trades. TVET will provide a rationalized approach for accessibility to TVET options and pathways. The aim is to develop and promote a system that allows parents and students to readily understand the certification pathways while seeing the direct links to work skills. The entire system will be underpinned by the National Qualifications Framework, with identified institutions that offer TVET courses becoming registered training organizations. TVET will enhance the implementation of its National Strategic Management Plan (2011–2020). During the plan period, the province plans to establish two technical colleges. The province will also partner with the private and other government institutions that offer tertiary courses. Furthermore, the Provincial Government focus to establish other colleges had been undertaken specifically in the Integrated Provincial Development Plan 2016-2020. The Provincial Education Division will oversee this development as the major educational institutions for further human integral development. For various reasons, children may not be able to attend and complete 13 years of formal education in the conversional pathway. FODE offers the potential for following the same curriculum, examinations and selection process as mainstream secondary schools. FODE will continue to be improved to give access to learning in a more flexible manner. Strategies will also focus on youths and adults who have not attained basic literacy, numeracy or life skills. District FODE centers will be established to register and enroll students. The province will also embark on providing basic literacy and numeracy to people who have never attended a formal schooling or have left school for various reasons. These people will be encouraged to attend literacy programs such as those offered by churches, NGOs and other stakeholders. Bridging programs such as those offered at Uni-Centres will be offered widely to students who have completed grade 12. Output 2.2 Students have access to alternate pathways for employment and life skills development Alternate pathways Strategies Activities Deliverable Details Lead agencies Timeline
Technical and Vocational Education and Training (TVET) 1. Rationalization of
TVET courses between the institutions
1.1. Rationalize Vocational Schools to improve students training
Vocational schools are focused on specific trade
-PDoE - Prov Standards
2017-2018
| P a g e 44 Achieving Quality Education and Training
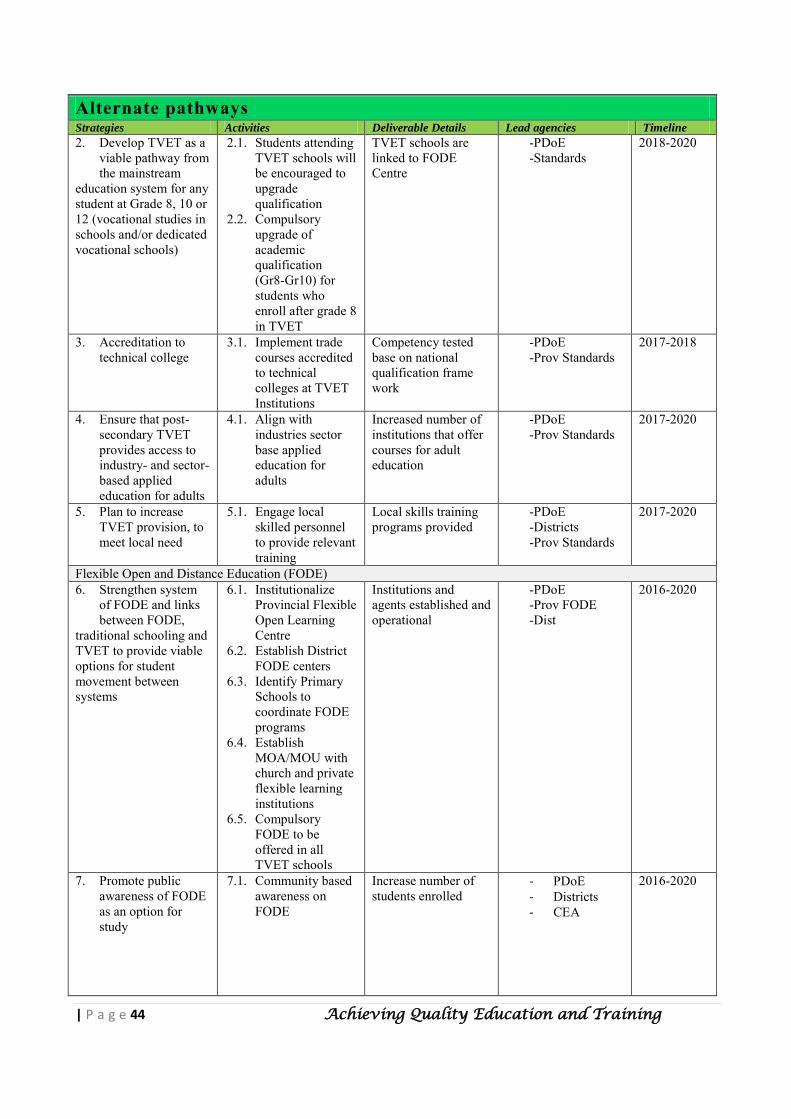
Alternate pathways Strategies Activities Deliverable Details Lead agencies Timeline
2. Develop TVET as a viable pathway from the mainstream
education system for any student at Grade 8, 10 or 12 (vocational studies in schools and/or dedicated vocational schools)
2.1. Students attending TVET schools will be encouraged to upgrade qualification
2.2. Compulsory upgrade of academic qualification (Gr8-Gr10) for students who enroll after grade 8 in TVET
TVET schools are linked to FODE Centre
-PDoE -Standards
2018-2020
3. Accreditation to technical college
3.1. Implement trade courses accredited to technical colleges at TVET Institutions
Competency tested base on national qualification frame work
-PDoE -Prov Standards
2017-2018
4. Ensure that post-secondary TVET provides access to industry- and sector-based applied education for adults
4.1. Align with industries sector base applied education for adults
Increased number of institutions that offer courses for adult education
-PDoE -Prov Standards
2017-2020
5. Plan to increase TVET provision, to meet local need
5.1. Engage local skilled personnel to provide relevant training
Local skills training programs provided
-PDoE -Districts -Prov Standards
2017-2020
Flexible Open and Distance Education (FODE) 6. Strengthen system
of FODE and links between FODE,
traditional schooling and TVET to provide viable options for student movement between systems
6.1. Institutionalize Provincial Flexible Open Learning Centre
6.2. Establish District FODE centers
6.3. Identify Primary Schools to coordinate FODE programs
6.4. Establish MOA/MOU with church and private flexible learning institutions
6.5. Compulsory FODE to be offered in all TVET schools
Institutions and agents established and operational
-PDoE -Prov FODE -Dist
2016-2020
7. Promote public awareness of FODE as an option for study
7.1. Community based awareness on FODE
Increase number of students enrolled
- PDoE - Districts - CEA
2016-2020
Achieving Quality Education and Training | P a g e 45
Alternate pathways Strategies Activities Deliverable Details Lead agencies Timeline
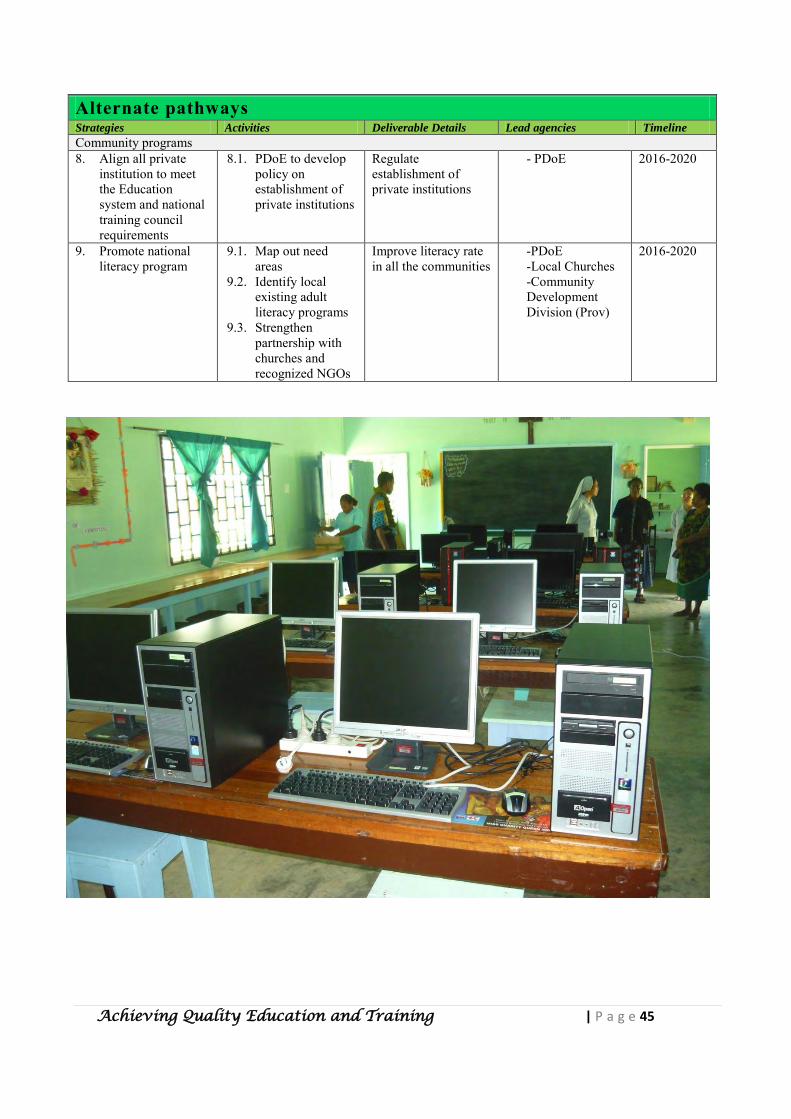
Community programs 8. Align all private
institution to meet the Education system and national training council requirements
8.1. PDoE to develop policy on establishment of private institutions
Regulate establishment of private institutions
- PDoE 2016-2020
9. Promote national literacy program
9.1. Map out need areas
9.2. Identify local existing adult literacy programs
9.3. Strengthen partnership with churches and recognized NGOs
Improve literacy rate in all the communities
-PDoE -Local Churches -Community Development Division (Prov)
2016-2020

| P a g e 46 Achieving Quality Education and Training
Local management
2020 output targets include: 100 per cent of principals have had financial management training 100 per cent of schools have governance boards 100 per cent of schools have School Learning Improvement Plans 100 per cent of school boards hold at least four meetings each year 100 per cent of schools hold minimum of four P&C meetings per year 80 per cent schools hold parent/teacher meetings 75 per cent of schools increased their National Quality Standards Index rating
Evidences have proven that well led and managed schools are those that effectively focused their funds on need-based areas resulting in better teacher support and improved student learning.
Regular training programs and effective monitoring strategies focused on improving skills and school board capacities will continue in order to meet expected provincial targets. With the introduction of National Quality School Standards Framework (NQSSF), school management performances will be measured against set standards to determine effectiveness. Necessary training programs for school leaders and their boards on areas such as Financial Management will be facilitated to ensure proper financial accountability to enhance quality learning.
Head Teachers are to be instrumental on improving development strategies as effective School Leaders and Managers. This will involve continuous action researches, effective supervisions, management and training programs to enhance competency in school leadership. Thus, the introduction of the National School Leadership Competency Framework (NSLCF) is a mechanism that will be utilised to measure the performance of school leaders.
School Boards will be supported by the Provincial Division of Education (PDoE), District Education Officers- (DEOs) and Standard Officers (SOs) to improve the standard of learning through the effective implementation of School Learning Improvement Plans (SLIP) and other regulatory instruments.
School communities will be encouraged to take ownership of their schools through parental and stakeholder collaboration. Their involvement in children’s education will support improvement strategies to enhance quality education.
Output 3.1 School governance boards are in place and functioning Local management Strategies Activities Deliverable Details Lead agencies Timeline
School leadership 10. Build leadership in schools 10.1. Rollout and
monitor school leadership and management training for the head teachers
Trained and competent schools leaders
-PDoE -CEAs -Dist
2017-2020
Achieving Quality Education and Training | P a g e 47
Local management Strategies Activities Deliverable Details Lead agencies Timeline
10.2. Training of the roles and responsibilities for BOM
11. Improve financial management of education institutions
11.1. Financial Management Training for Head Teachers and BOM
School kept proper financial records
- PDoE - Districts - Schools
Ongoing
12. Develop and implement School Learning Improvement Plans
12.1. Review and take stock of current SLIP
12.2. Support schools with no plan to develop SLIP
12.3. Develop criteria for effective SLIP
12.4. Support effective SLIP implementation
12.5. Assist schools to prepare proposals (Project Formulation Document (PFD) for Service Improvement Programs to fund school SLIP and Projects
Schools have and effectively implement SLIP
- PDoE - Districts - Schools
2017
13. Improve standard of school operation and management
13.1. Monitor board’s quarterly meetings
13.2. Monitor and ensure schools comply with education standards
Improved school governance
- Prov Standards
- PDoE
Ongoing
14. Strengthen and support behavior management systems in schools
14.1. Develop school behavior management policy
14.2. Monitor Implementation of school behavior management policy
14.3. Review school behavior management policy
14.4. Establish school based counselor
Behavior management systems in school Teacher counselors in schools
-PDoE -Districts -CEAs -Schools
2017-2018
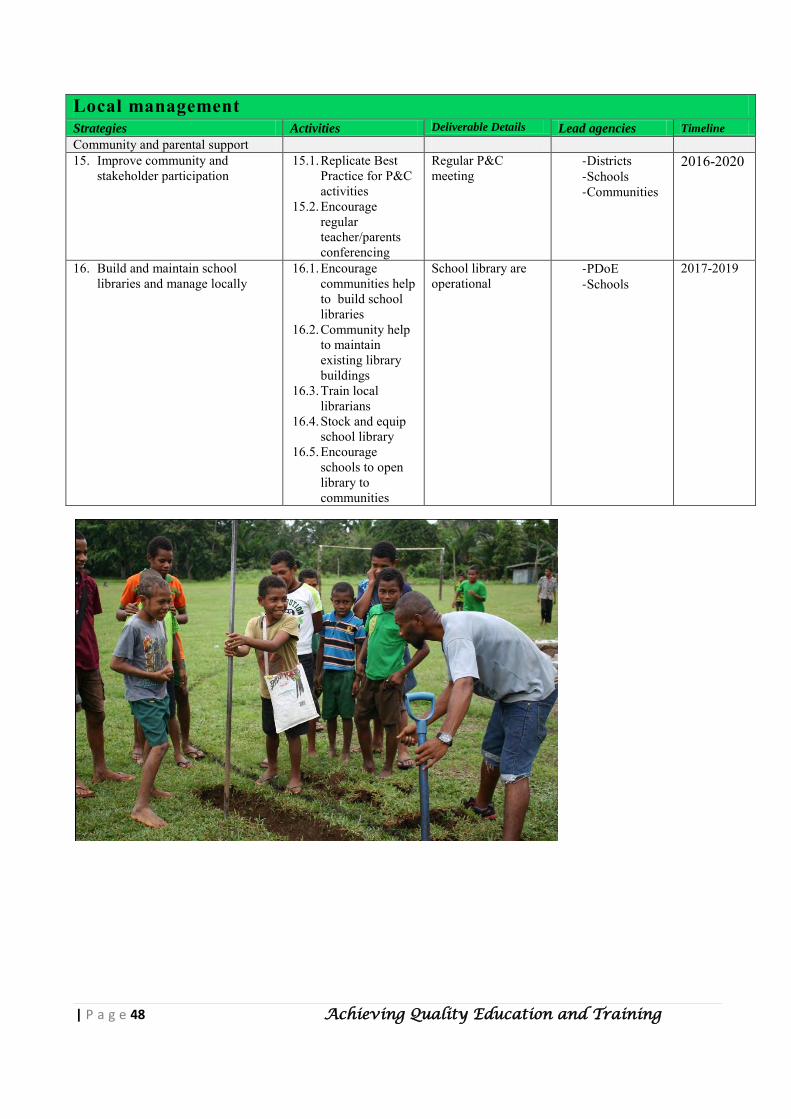
| P a g e 48 Achieving Quality Education and Training
Local management Strategies Activities Deliverable Details Lead agencies Timeline
Community and parental support 15. Improve community and
stakeholder participation 15.1. Replicate Best
Practice for P&C activities
15.2. Encourage regular teacher/parents conferencing
Regular P&C meeting
- Districts - Schools - Communities
2016-2020
16. Build and maintain school libraries and manage locally
16.1. Encourage communities help to build school libraries
16.2. Community help to maintain existing library buildings
16.3. Train local librarians
16.4. Stock and equip school library
16.5. Encourage schools to open library to communities
School library are operational
- PDoE - Schools
2017-2019
Achieving Quality Education and Training | P a g e 49
System strengthening
2020 output targets include: 100 per cent of operational schools receive TFF 100 per cent of schools submitting school census data 100 per cent of schools inspected at least once annually 100 per cent of quarterly operational and financial reports covering all budget activities
submitted on time 100 per cent of advances and allowances fully acquitted (annually) Annual report on operations submitted 30% schools submit EMIS data electronically
To achieve better learning for students, all supporting functions in the provincial and district levels must work collaboratively to attain the common goal of achieving quality education and training. A significant amount of effort is required to rationalize and improve administrative and management functions to effectively and efficiently implement and monitor service delivery.
Capacity building will give staff the competency required to manage tasks to support administrative functions both in the provincial and district levels. Thus, the procurement and distribution of resources such as funds will be managed in such a manner that accountability is well maintained and accredited to good governance by ensuring that schools receive their maximum funding to support teaching and learning, and to maintain normalcy in operations.
Improved Information Communication Technology (ICT) systems will be established both in the provincial and district headquarters for storage and easy access to valuable data and, or information. The decentralized Payroll and Related Services System (PaRSS) will be improved and sustained to reduce negative impact teachers’ salary issues in the province.
ICT has become an important medium of modern communication which operating government systems, non-government organizations and private sectors very much depend on to enhance effective communication. Therefore, all administrative processes and information systems in the province will be established using ICT mediums to allow rapid access to accurate information. Schools must be encouraged to take responsibility for the decentralised administration enabled by ICT to maintain reliable communication between schools, districts and the province.
Improved planning, budgeting and proper accountability of administration and management functions in districts and provincial levels will provide guidance to sources or access funds from the government and other development partners to implement and monitor projects. The Public Finance Management Act remains as an ordinance that will govern the control, implementation and monitoring of such to enhance proper accountability.
System strengthening requires a collaboration of efforts and networking between public and private sectors for improved service delivery. Donor agencies have always provided essential support in capacity building, and are expected to continue their technical and funding support. The education Service Improvement Programs in the district and provincial levels will continue to provide oversight of, and carry on coordination for improvement.
For effective implementation and monitoring of teachers and their attitude to work and welfare, provinces through the delegated functions of the Teaching Service Commission will continue to improve its operations through district and provincial offices to deal with professional matters, and other policy related issues.
| P a g e 50 Achieving Quality Education and Training
Output 3.2 Education service deliveries is improved through effective planning and management
System strengthening
Strategies Activities Deliverable
Detailed
Lead
agencies Timeline
Communication, connectivity and information systems 17. Improve communication
and access to information across PDoE and all levels of education
17.1. Install two way radio system and utilize available VsaT in the locality (VsaT and VHF)
17.2. CUG SIM in every school
communication between schools, districts and province
-PDoE -Districts -LLGs -CEAs
2017-2019
Planning and coordination 18. Improve planning 18.1. Train PDoE officers on using
planning tools (SWOT) 18.2. Strengthen Integrated
Planning & Budgeting system 18.3. Train head teachers on
standard planning tools (SLIP)
Integrated planning & budgeting
-PDoE -Districts
2016-2018
19. Improve policy 19.1. Strengthen policies through awareness and workshops
Education Policies implemented
-PDoE -Districts
2016-2020
20. Improve coordination 20.1. Coordinate Provincial Education Plan implementation through IPDP, District Plans and SLIP
All plans aligned -PDoE -Districts
2016-2017
21. Monitor, evaluate, report and ensure accountability
21.1. Train education officers to use monitoring and reporting templates
21.2. Regulate and schedule monitoring, evaluation and reporting to ensure accountability
21.3. Monitor schools operations though quarterly returns, annual school census and surveys
M&E system in place
-PDoE -Districts -CEAs
2016-2020
Financial management 22. Improve PDoE and
school asset management
22.1. Implement MBPA asset policy
22.2. Develop School asset management policy
22.3. Maintain fixed assets
Asset management policy in place
-PDoE -Districts -Schools
Ongoing 2018
23. Ensure all payments and account processing complies with Public Finances (Management) Act
23.1. Training on standard procurement procedures
23.2. Inspect schools financial records for compliance
Staff use standard procurement procedures
-PDoE -Districts
2016-2020
24. Create transparent centralized and streamlined procurement system
24.1. Procure through PSTB and DSTB on all major procurement
24.2. Procure goods, works and services through government standards good procurement system
Goods and Services correctly and transparently procured
-PDoE -Districts
Ongoing
Achieving Quality Education and Training | P a g e 51
System strengthening
Strategies Activities Deliverable
Detailed
Lead
agencies Timeline
25. Use single payroll system, with decentralized operation and national quality assurance
25.1. Use education decentralized system to manage payroll
25.2. Sustain Alesco system link 25.3. Train provincial education
Alesco users
Payroll system managed in the province
-PDoE 2016-2020
Human resources 26. Improve staffing,
teaching and public service
26.1. Review and propose restructure of public service positions to the need of effective education service delivery
26.2. Request public servants on short term contracts conditions for unexpected workload
26.3. Request recruitment of expatriates teachers to schools on base level
26.4. Train suitable teachers and public servants to take on management roles
26.5. Reinstate qualified teachers
Education manpower plan
-PDoE 2017-2020
27. Improve efficiency of teacher employment
27.1. Clearly indicate in the annual TSC budget the salaries and due entitlements
27.2. Effectively and efficiently manage annual teachers leave fares disbursement
27.3. Provide awards and incentives for teachers retiring, serving in remote and rural postings
27.4. Systemize and improve teachers posting
Teachers are duly rewarded correctly and recognized
-PDoE -Districts
2016-2020
28. Improve school services 28.1. Identify new schools for establishment registration
28.2. Identify additional position that need creation and abolition
28.3. Improve annual deployment of teachers
28.4. Supervise and monitor teachers’ and students’ annual resumption
28.5. Improve management of teachers’ salaries, leave fares & other entitlement
28.6. Carryout school census annually
28.7. Ensure quality supervision and visits in every remote and isolated schools
28.8. Organize annual career exposition
28.9. Investigate school land boundaries
Schools are in operation
-PDoE -Districts
2016-2020
| P a g e 52 Achieving Quality Education and Training
System strengthening
Strategies Activities Deliverable
Detailed
Lead
agencies Timeline
29. Establish provincial public libraries system, records and documents
29.1. Institutionalize provincial public library and archives system
29.2. Link to DoE ICT and OLA 29.3. Digitalize books collections 29.4. Establish computer records
A functioning Provincial public library
-PDoE 2017-2018
Achieving Quality Education and Training | P a g e 53
SECTION FIVE
MONITORING
AND EVALUATION
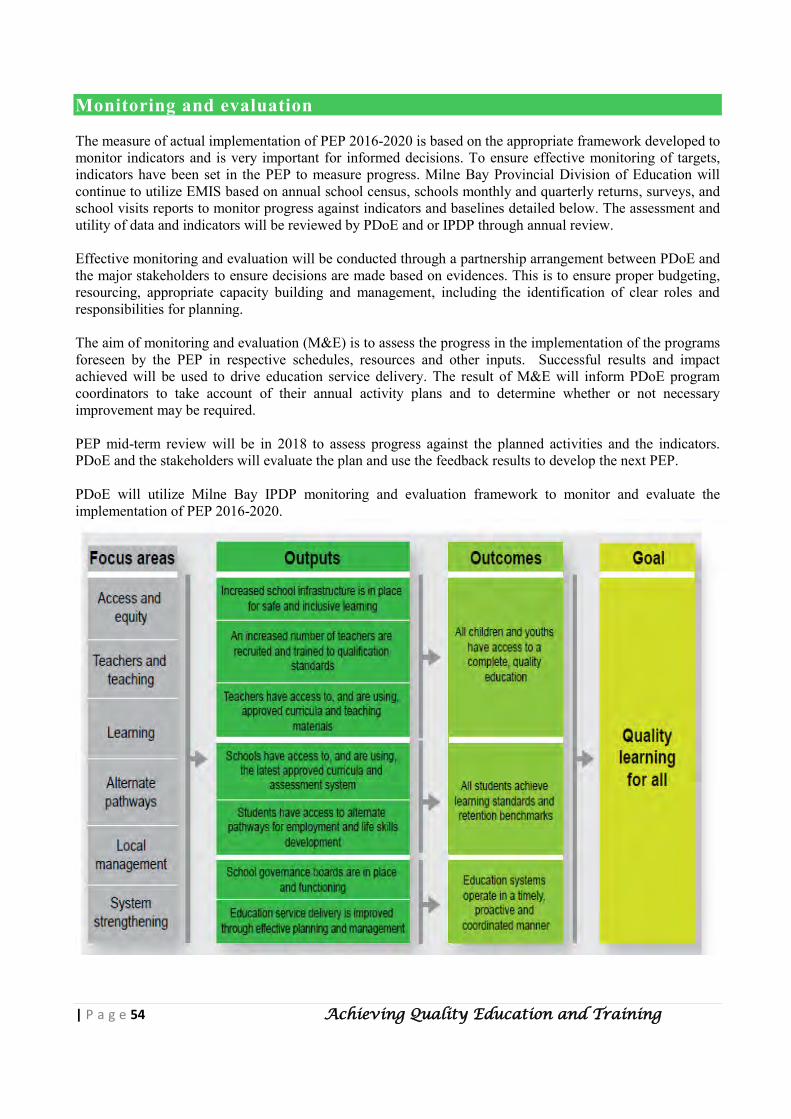
| P a g e 54 Achieving Quality Education and Training
Monitoring and evaluation The measure of actual implementation of PEP 2016-2020 is based on the appropriate framework developed to monitor indicators and is very important for informed decisions. To ensure effective monitoring of targets, indicators have been set in the PEP to measure progress. Milne Bay Provincial Division of Education will continue to utilize EMIS based on annual school census, schools monthly and quarterly returns, surveys, and school visits reports to monitor progress against indicators and baselines detailed below. The assessment and utility of data and indicators will be reviewed by PDoE and or IPDP through annual review. Effective monitoring and evaluation will be conducted through a partnership arrangement between PDoE and the major stakeholders to ensure decisions are made based on evidences. This is to ensure proper budgeting, resourcing, appropriate capacity building and management, including the identification of clear roles and responsibilities for planning. The aim of monitoring and evaluation (M&E) is to assess the progress in the implementation of the programs foreseen by the PEP in respective schedules, resources and other inputs. Successful results and impact achieved will be used to drive education service delivery. The result of M&E will inform PDoE program coordinators to take account of their annual activity plans and to determine whether or not necessary improvement may be required. PEP mid-term review will be in 2018 to assess progress against the planned activities and the indicators. PDoE and the stakeholders will evaluate the plan and use the feedback results to develop the next PEP. PDoE will utilize Milne Bay IPDP monitoring and evaluation framework to monitor and evaluate the implementation of PEP 2016-2020.
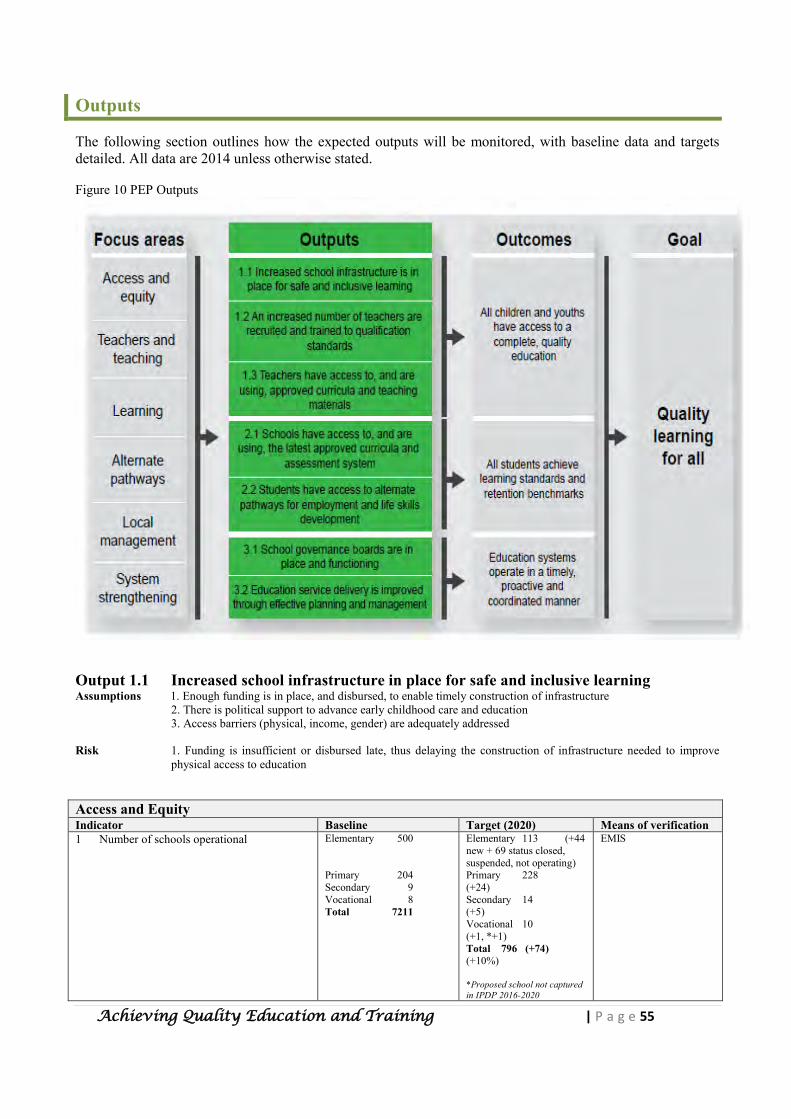
Achieving Quality Education and Training | P a g e 55
Outputs The following section outlines how the expected outputs will be monitored, with baseline data and targets detailed. All data are 2014 unless otherwise stated. Figure 10 PEP Outputs
Output 1.1 Increased school infrastructure in place for safe and inclusive learning Assumptions 1. Enough funding is in place, and disbursed, to enable timely construction of infrastructure 2. There is political support to advance early childhood care and education 3. Access barriers (physical, income, gender) are adequately addressed
Risk 1. Funding is insufficient or disbursed late, thus delaying the construction of infrastructure needed to improve physical access to education
Access and Equity Indicator Baseline Target (2020) Means of verification 1 Number of schools operational Elementary 500
Primary 204 Secondary 9 Vocational 8 Total 7211
Elementary 113 (+44 new + 69 status closed, suspended, not operating) Primary 228 (+24) Secondary 14 (+5) Vocational 10 (+1, *+1) Total 796 (+74) (+10%) *Proposed school not captured in IPDP 2016-2020
EMIS
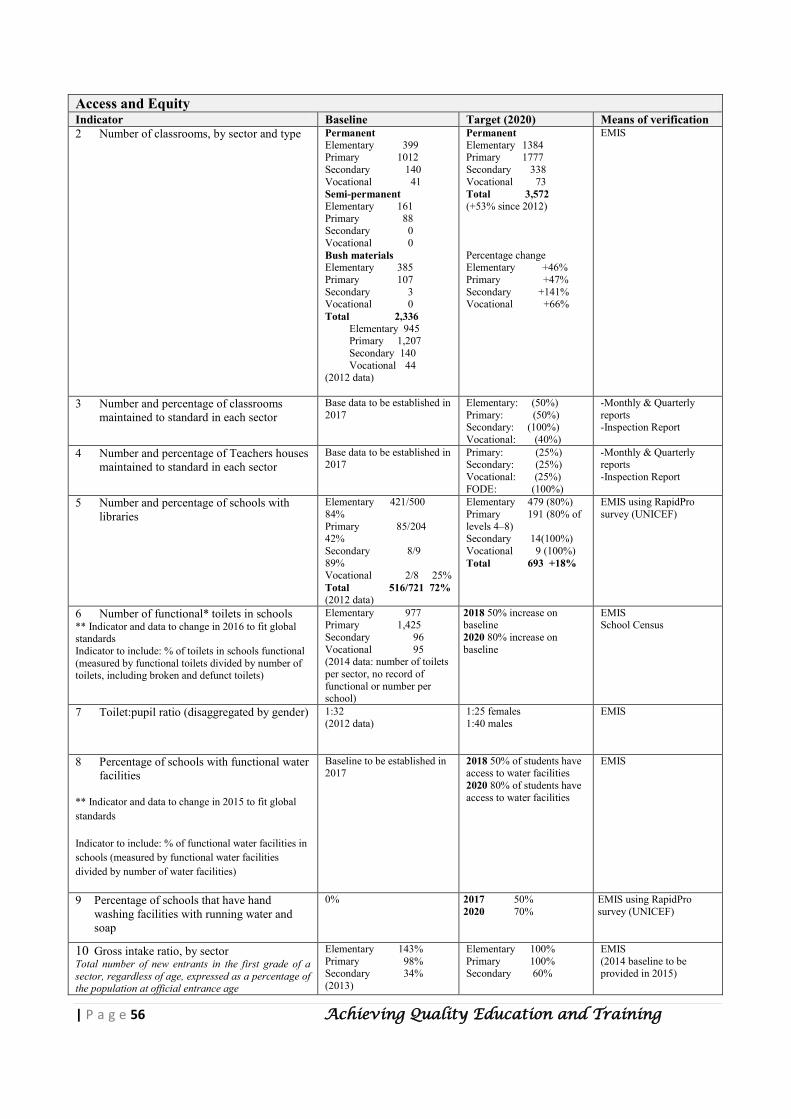
| P a g e 56 Achieving Quality Education and Training
Access and Equity Indicator Baseline Target (2020) Means of verification 2 Number of classrooms, by sector and type Permanent
Elementary 399 Primary 1012 Secondary 140 Vocational 41 Semi-permanent Elementary 161 Primary 88 Secondary 0 Vocational 0 Bush materials Elementary 385 Primary 107 Secondary 3 Vocational 0 Total 2,336 Elementary 945 Primary 1,207 Secondary 140 Vocational 44 (2012 data)
Permanent Elementary 1384 Primary 1777 Secondary 338 Vocational 73 Total 3,572 (+53% since 2012) Percentage change Elementary +46% Primary +47% Secondary +141% Vocational +66%
EMIS
3 Number and percentage of classrooms maintained to standard in each sector
Base data to be established in 2017
Elementary: (50%) Primary: (50%) Secondary: (100%) Vocational: (40%)
-Monthly & Quarterly reports -Inspection Report
4 Number and percentage of Teachers houses maintained to standard in each sector
Base data to be established in 2017
Primary: (25%) Secondary: (25%) Vocational: (25%) FODE: (100%)
-Monthly & Quarterly reports -Inspection Report
5 Number and percentage of schools with libraries
Elementary 421/500 84% Primary 85/204 42% Secondary 8/9 89% Vocational 2/8 25% Total 516/721 72% (2012 data)
Elementary 479 (80%) Primary 191 (80% of levels 4–8) Secondary 14(100%) Vocational 9 (100%) Total 693 +18%
EMIS using RapidPro survey (UNICEF)
6 Number of functional* toilets in schools ** Indicator and data to change in 2016 to fit global standards Indicator to include: % of toilets in schools functional (measured by functional toilets divided by number of toilets, including broken and defunct toilets)
Elementary 977 Primary 1,425 Secondary 96 Vocational 95 (2014 data: number of toilets per sector, no record of functional or number per school)
2018 50% increase on baseline 2020 80% increase on baseline
EMIS School Census
7 Toilet:pupil ratio (disaggregated by gender) 1:32 (2012 data)
1:25 females 1:40 males
EMIS
8 Percentage of schools with functional water facilities
** Indicator and data to change in 2015 to fit global standards
Indicator to include: % of functional water facilities in schools (measured by functional water facilities divided by number of water facilities)
Baseline to be established in 2017
2018 50% of students have access to water facilities 2020 80% of students have access to water facilities
EMIS
9 Percentage of schools that have hand washing facilities with running water and soap
0% 2017 50% 2020 70%
EMIS using RapidPro survey (UNICEF)
10 Gross intake ratio, by sector Total number of new entrants in the first grade of a sector, regardless of age, expressed as a percentage of the population at official entrance age
Elementary 143% Primary 98% Secondary 34% (2013)
Elementary 100% Primary 100% Secondary 60%
EMIS (2014 baseline to be provided in 2015)
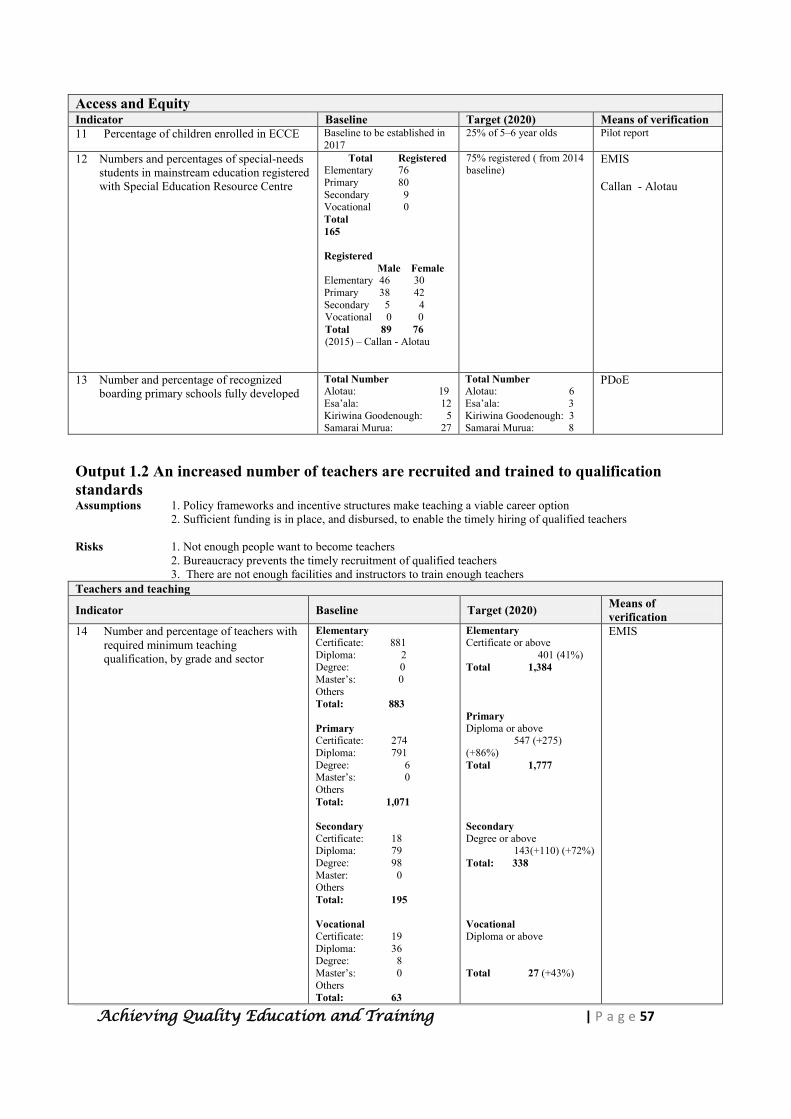
Achieving Quality Education and Training | P a g e 57
Access and Equity Indicator Baseline Target (2020) Means of verification 11 Percentage of children enrolled in ECCE Baseline to be established in
2017 25% of 5–6 year olds Pilot report
12 Numbers and percentages of special-needs students in mainstream education registered with Special Education Resource Centre
Total Registered Elementary 76 Primary 80 Secondary 9 Vocational 0 Total 165 Registered Male Female Elementary 46 30 Primary 38 42 Secondary 5 4 Vocational 0 0 Total 89 76 (2015) – Callan - Alotau
75% registered ( from 2014 baseline)
EMIS Callan - Alotau
13 Number and percentage of recognized boarding primary schools fully developed
Total Number Alotau: 19 Esa’ala: 12 Kiriwina Goodenough: 5 Samarai Murua: 27
Total Number Alotau: 6 Esa’ala: 3 Kiriwina Goodenough: 3 Samarai Murua: 8
PDoE
Output 1.2 An increased number of teachers are recruited and trained to qualification standards Assumptions 1. Policy frameworks and incentive structures make teaching a viable career option 2. Sufficient funding is in place, and disbursed, to enable the timely hiring of qualified teachers Risks 1. Not enough people want to become teachers 2. Bureaucracy prevents the timely recruitment of qualified teachers
3. There are not enough facilities and instructors to train enough teachers Teachers and teaching
Indicator Baseline Target (2020) Means of verification
14 Number and percentage of teachers with required minimum teaching qualification, by grade and sector
Elementary Certificate: 881 Diploma: 2 Degree: 0 Master’s: 0 Others Total: 883 Primary Certificate: 274 Diploma: 791 Degree: 6 Master’s: 0 Others Total: 1,071 Secondary Certificate: 18 Diploma: 79 Degree: 98 Master: 0 Others Total: 195 Vocational Certificate: 19 Diploma: 36 Degree: 8 Master’s: 0 Others Total: 63
Elementary Certificate or above 401 (41%) Total 1,384 Primary Diploma or above 547 (+275) (+86%) Total 1,777 Secondary Degree or above 143(+110) (+72%) Total: 338 Vocational Diploma or above Total 27 (+43%)
EMIS
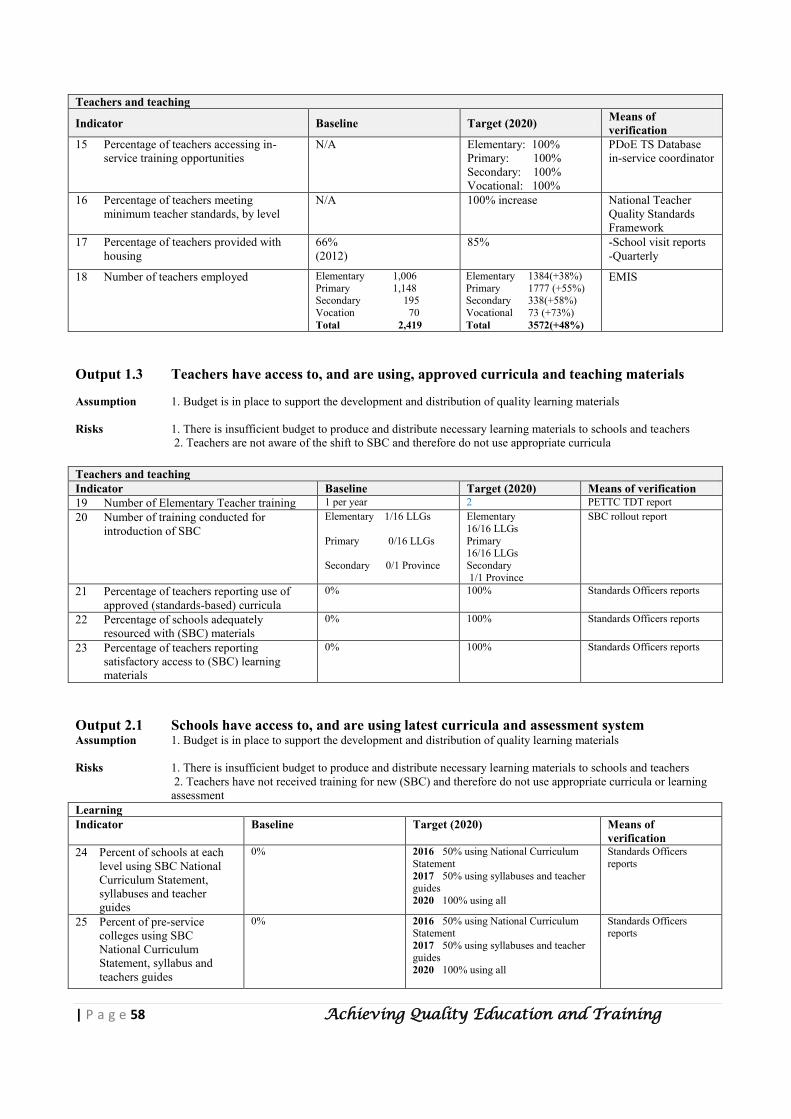
| P a g e 58 Achieving Quality Education and Training
Teachers and teaching
Indicator Baseline Target (2020) Means of verification
15 Percentage of teachers accessing in-service training opportunities
N/A Elementary: 100% Primary: 100% Secondary: 100% Vocational: 100%
PDoE TS Database in-service coordinator
16 Percentage of teachers meeting minimum teacher standards, by level
N/A 100% increase National Teacher Quality Standards Framework
17 Percentage of teachers provided with housing
66% (2012)
85% -School visit reports -Quarterly
18 Number of teachers employed Elementary 1,006 Primary 1,148 Secondary 195 Vocation 70 Total 2,419
Elementary 1384(+38%) Primary 1777 (+55%) Secondary 338(+58%) Vocational 73 (+73%) Total 3572(+48%)
EMIS
Output 1.3 Teachers have access to, and are using, approved curricula and teaching materials Assumption 1. Budget is in place to support the development and distribution of quality learning materials Risks 1. There is insufficient budget to produce and distribute necessary learning materials to schools and teachers 2. Teachers are not aware of the shift to SBC and therefore do not use appropriate curricula Teachers and teaching Indicator Baseline Target (2020) Means of verification 19 Number of Elementary Teacher training 1 per year 2 PETTC TDT report 20 Number of training conducted for
introduction of SBC Elementary 1/16 LLGs Primary 0/16 LLGs Secondary 0/1 Province
Elementary 16/16 LLGs Primary 16/16 LLGs Secondary 1/1 Province
SBC rollout report
21 Percentage of teachers reporting use of approved (standards-based) curricula
0% 100% Standards Officers reports
22 Percentage of schools adequately resourced with (SBC) materials
0% 100% Standards Officers reports
23 Percentage of teachers reporting satisfactory access to (SBC) learning materials
0% 100% Standards Officers reports
Output 2.1 Schools have access to, and are using latest curricula and assessment system Assumption 1. Budget is in place to support the development and distribution of quality learning materials Risks 1. There is insufficient budget to produce and distribute necessary learning materials to schools and teachers
2. Teachers have not received training for new (SBC) and therefore do not use appropriate curricula or learning assessment
Learning Indicator Baseline Target (2020) Means of
verification 24 Percent of schools at each
level using SBC National Curriculum Statement, syllabuses and teacher guides
0% 2016 50% using National Curriculum Statement 2017 50% using syllabuses and teacher guides 2020 100% using all
Standards Officers reports
25 Percent of pre-service colleges using SBC National Curriculum Statement, syllabus and teachers guides
0% 2016 50% using National Curriculum Statement 2017 50% using syllabuses and teacher guides 2020 100% using all
Standards Officers reports
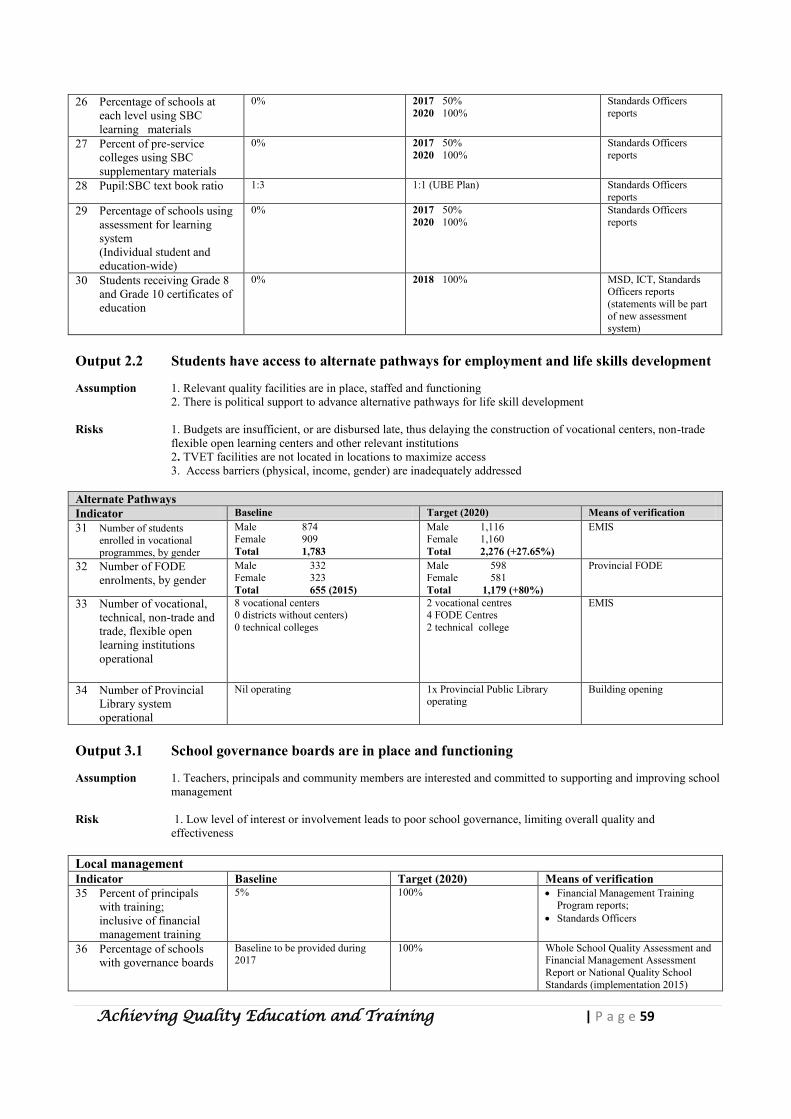
Achieving Quality Education and Training | P a g e 59
26 Percentage of schools at each level using SBC learning materials
0% 2017 50% 2020 100%
Standards Officers reports
27 Percent of pre-service colleges using SBC supplementary materials
0% 2017 50% 2020 100%
Standards Officers reports
28 Pupil:SBC text book ratio 1:3 1:1 (UBE Plan) Standards Officers reports
29 Percentage of schools using assessment for learning system (Individual student and education-wide)
0% 2017 50% 2020 100%
Standards Officers reports
30 Students receiving Grade 8 and Grade 10 certificates of education
0% 2018 100% MSD, ICT, Standards Officers reports (statements will be part of new assessment system)
Output 2.2 Students have access to alternate pathways for employment and life skills development Assumption 1. Relevant quality facilities are in place, staffed and functioning 2. There is political support to advance alternative pathways for life skill development Risks 1. Budgets are insufficient, or are disbursed late, thus delaying the construction of vocational centers, non-trade
flexible open learning centers and other relevant institutions 2. TVET facilities are not located in locations to maximize access 3. Access barriers (physical, income, gender) are inadequately addressed Alternate Pathways Indicator Baseline Target (2020) Means of verification 31 Number of students
enrolled in vocational programmes, by gender
Male 874 Female 909 Total 1,783
Male 1,116 Female 1,160 Total 2,276 (+27.65%)
EMIS
32 Number of FODE enrolments, by gender
Male 332 Female 323 Total 655 (2015)
Male 598 Female 581 Total 1,179 (+80%)
Provincial FODE
33 Number of vocational, technical, non-trade and trade, flexible open learning institutions operational
8 vocational centers 0 districts without centers) 0 technical colleges
2 vocational centres 4 FODE Centres 2 technical college
EMIS
34 Number of Provincial Library system operational
Nil operating 1x Provincial Public Library operating
Building opening
Output 3.1 School governance boards are in place and functioning Assumption 1. Teachers, principals and community members are interested and committed to supporting and improving school
management Risk 1. Low level of interest or involvement leads to poor school governance, limiting overall quality and
effectiveness Local management Indicator Baseline Target (2020) Means of verification 35 Percent of principals
with training; inclusive of financial management training
5% 100% Financial Management Training Program reports;
Standards Officers
36 Percentage of schools with governance boards
Baseline to be provided during 2017
100% Whole School Quality Assessment and Financial Management Assessment Report or National Quality School Standards (implementation 2015)
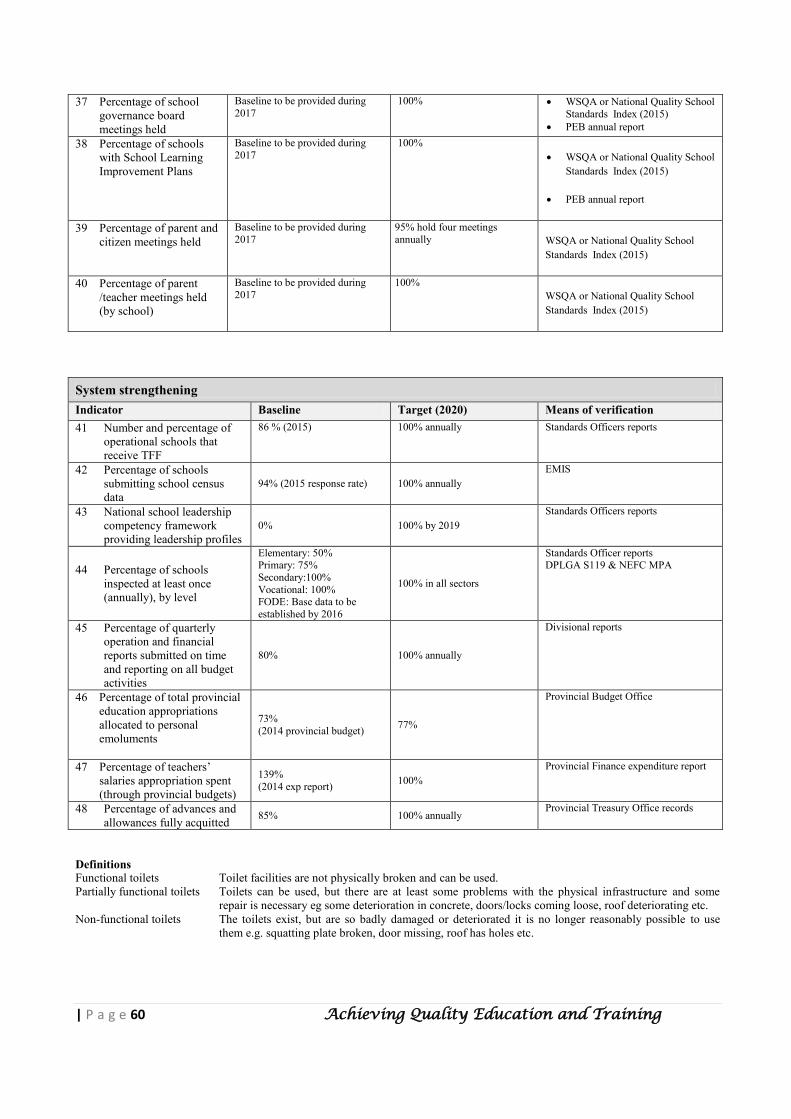
| P a g e 60 Achieving Quality Education and Training
37 Percentage of school governance board meetings held
Baseline to be provided during 2017
100% WSQA or National Quality School Standards Index (2015)
PEB annual report 38 Percentage of schools
with School Learning Improvement Plans
Baseline to be provided during 2017
100% WSQA or National Quality School
Standards Index (2015)
PEB annual report
39 Percentage of parent and citizen meetings held
Baseline to be provided during 2017
95% hold four meetings annually WSQA or National Quality School
Standards Index (2015)
40 Percentage of parent /teacher meetings held (by school)
Baseline to be provided during 2017
100% WSQA or National Quality School Standards Index (2015)
System strengthening Indicator Baseline Target (2020) Means of verification 41 Number and percentage of
operational schools that receive TFF
86 % (2015) 100% annually Standards Officers reports
42 Percentage of schools submitting school census data
94% (2015 response rate) 100% annually EMIS
43 National school leadership competency framework providing leadership profiles
0% 100% by 2019 Standards Officers reports
44 Percentage of schools inspected at least once (annually), by level
Elementary: 50% Primary: 75% Secondary:100% Vocational: 100% FODE: Base data to be established by 2016
100% in all sectors
Standards Officer reports DPLGA S119 & NEFC MPA
45 Percentage of quarterly operation and financial reports submitted on time and reporting on all budget activities
80% 100% annually
Divisional reports
46 Percentage of total provincial education appropriations allocated to personal emoluments
73% (2014 provincial budget) 77%
Provincial Budget Office
47 Percentage of teachers’ salaries appropriation spent (through provincial budgets)
139% (2014 exp report) 100%
Provincial Finance expenditure report
48 Percentage of advances and allowances fully acquitted 85% 100% annually
Provincial Treasury Office records
Definitions Functional toilets Toilet facilities are not physically broken and can be used. Partially functional toilets Toilets can be used, but there are at least some problems with the physical infrastructure and some
repair is necessary eg some deterioration in concrete, doors/locks coming loose, roof deteriorating etc. Non-functional toilets The toilets exist, but are so badly damaged or deteriorated it is no longer reasonably possible to use
them e.g. squatting plate broken, door missing, roof has holes etc.
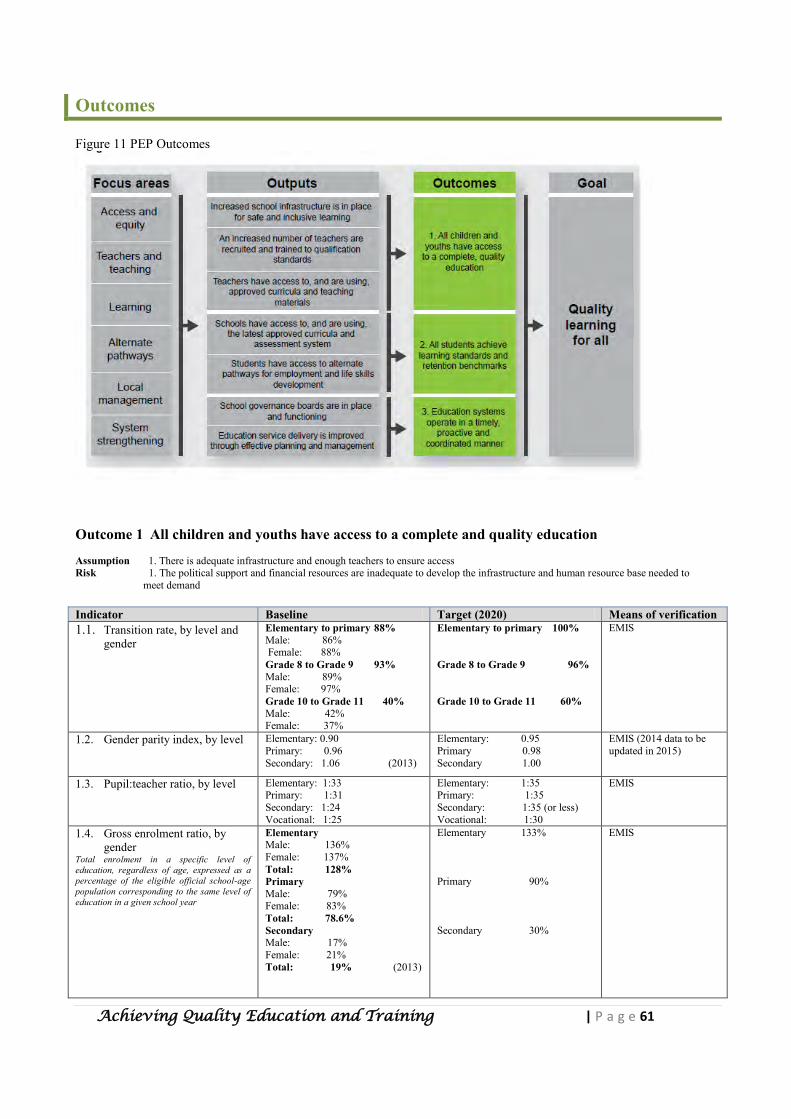
Achieving Quality Education and Training | P a g e 61
Outcomes Figure 11 PEP Outcomes
Outcome 1 All children and youths have access to a complete and quality education Assumption 1. There is adequate infrastructure and enough teachers to ensure access Risk 1. The political support and financial resources are inadequate to develop the infrastructure and human resource base needed to
meet demand Indicator Baseline Target (2020) Means of verification 1.1. Transition rate, by level and
gender Elementary to primary 88% Male: 86% Female: 88% Grade 8 to Grade 9 93% Male: 89% Female: 97% Grade 10 to Grade 11 40% Male: 42% Female: 37%
Elementary to primary 100% Grade 8 to Grade 9 96% Grade 10 to Grade 11 60%
EMIS
1.2. Gender parity index, by level Elementary: 0.90 Primary: 0.96 Secondary: 1.06 (2013)
Elementary: 0.95 Primary 0.98 Secondary 1.00
EMIS (2014 data to be updated in 2015)
1.3. Pupil:teacher ratio, by level Elementary: 1:33 Primary: 1:31 Secondary: 1:24 Vocational: 1:25
Elementary: 1:35 Primary: 1:35 Secondary: 1:35 (or less) Vocational: 1:30
EMIS
1.4. Gross enrolment ratio, by gender
Total enrolment in a specific level of education, regardless of age, expressed as a percentage of the eligible official school-age population corresponding to the same level of education in a given school year
Elementary Male: 136% Female: 137% Total: 128% Primary Male: 79% Female: 83% Total: 78.6% Secondary Male: 17% Female: 21% Total: 19% (2013)
Elementary 133% Primary 90% Secondary 30%
EMIS
| P a g e 62 Achieving Quality Education and Training
1.5. Net enrolment ratio (NER), by gender
Enrolment of the official age group for a given level of education expressed as a percentage of the corresponding population
Elementary 56.1% Primary 49% Secondary 14%
Elementary 79.3% Primary 65.9% Secondary 30%
EMIS
1.6. Completion rate by level (takes no account of students repeating grades and uses enrolment rather than graduate numbers)
Elementary 85% Primary 77% Secondary Grade 10 93% Grade12 97%
Elementary 100% Primary 100% Secondary Grade 10 100% Grade 12 100%
EMIS
1.7. Gross enrolment ratio for ECCE
Baseline to be established in 2017 by ECCE facility survey
ECCE 15% increase ECCE facility survey
1.8. Number of out-of-school children
Baseline to be established in 2017 by OOSCI survey
50% of OOSC will receive education
OOSCI baseline survey
1.9. Number and percentage of teachers meeting national performance standards
Baseline to be established in 2017 using National Quality School Standards Framework to be established in 2017
30% increase Standards Officers using National Quality School Standards Framework
Outcome 2 All students achieve learning standards and retention benchmarks Assumptions 1. Schools and other learning institutions implement SBC in line with national policy 2. Qualified teachers are in place and provide quality education that meets national standards 3. Students have access to, and use, alternate pathways for employment and life skills development Risk 1. Inadequate resources and lack of political support will delay the implementation of SBC Indicator Baseline Target (2020) Means of verification
2.1 Percentage and number youths and adults attend basic literacy program
Numeracy: (Baseline to be set in 2017) Reading” Writing:
Numeracy 55% Reading 65% Writing 25%
Youth and Adult literacy program report
2.2 Survival rate, by level and gender
Percentage of a cohort of students enrolled in the first grade of a given level or cycle of education in a given school year who are expected to reach successive grades
Elementary Preparatory to Elementary 2 Male: 91% Female: 80% Total 90% Primary Grade 3 to Grade 8 Male: 82% Female: 87% Total 84% Secondary Grade 9 to Grade 12 Male: 43% Female: 34% Total 39%
Elementary 95% Primary 90% Secondary 46%
EMIS
2.3 Graduates by level Grade 08: 3,923 Grade 10: 1,419 Grade 12: 718
Grade 08: 6,907 Grade 10: 3,793 Grade 12: 1,319
MSD, Examination & Assessment coordinator
2.4 Number and percentage of students selected to tertiary institutions annually
391/
800/1,329 (+60%)
MSD Examination report DoHERST data S119 report
Outcome 3 Education systems operate in a timely, proactive and coordinated manner Assumption 1. Governance systems (payroll, school budgets, quality assurance mechanisms, etc.) are in place and functioning to support the successful management of the education system Risk 1. Poorly functioning systems slow the delivery of funds to schools and the timely payment of staff, leading to ineffective service delivery
2. Late release of warrants Indicator Baseline Target (2020) Means of verification
3.1 Number of teachers put back on payroll by end of April annually compared with March payroll
191/312 61% 2015
100% annually
Alesco (salary office quarterly report)
3.2 Teaching position vacancies occupied before March
Baseline to be provided during 2016 100% (No vacancy in schools)
Alesco, GES, Teacher appointment
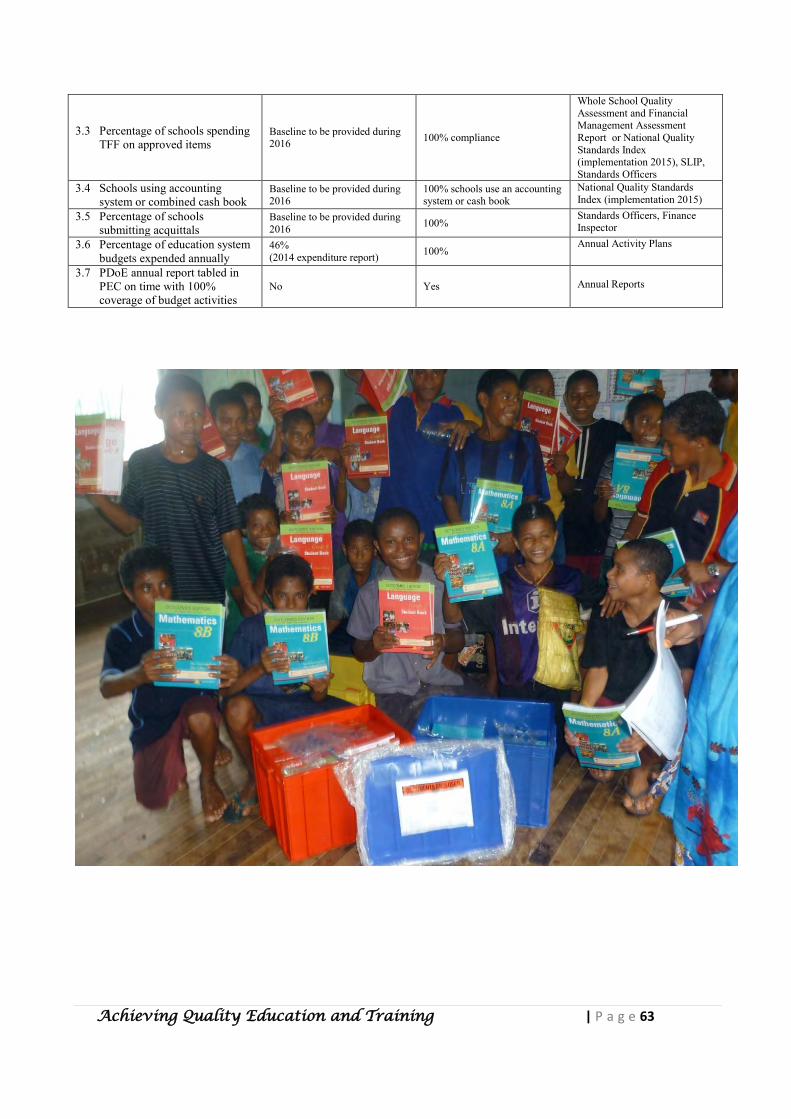
Achieving Quality Education and Training | P a g e 63
3.3 Percentage of schools spending TFF on approved items
Baseline to be provided during 2016 100% compliance
Whole School Quality Assessment and Financial Management Assessment Report or National Quality Standards Index (implementation 2015), SLIP, Standards Officers
3.4 Schools using accounting system or combined cash book
Baseline to be provided during 2016
100% schools use an accounting system or cash book
National Quality Standards Index (implementation 2015)
3.5 Percentage of schools submitting acquittals
Baseline to be provided during 2016 100%
Standards Officers, Finance Inspector
3.6 Percentage of education system budgets expended annually
46% (2014 expenditure report) 100%
Annual Activity Plans
3.7 PDoE annual report tabled in PEC on time with 100% coverage of budget activities
No Yes Annual Reports
| P a g e 64 Achieving Quality Education and Training
Achieving Quality Education and Training | P a g e 65
SECTION SIX
PROJECTIONS
AND COSTING
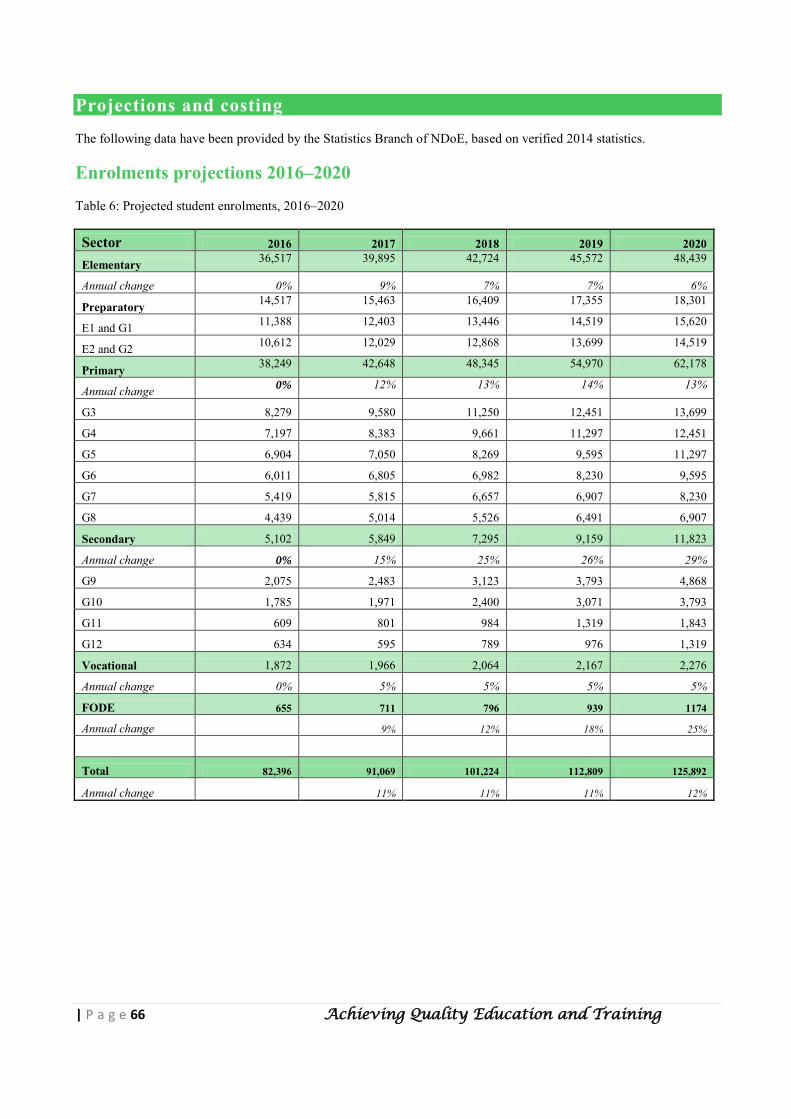
| P a g e 66 Achieving Quality Education and Training
Projections and costing The following data have been provided by the Statistics Branch of NDoE, based on verified 2014 statistics. Enrolments projections 2016–2020 Table 6: Projected student enrolments, 2016–2020
Sector 2016 2017 2018 2019 2020
Elementary 36,517 39,895 42,724 45,572 48,439
Annual change 0% 9% 7% 7% 6%
Preparatory 14,517 15,463 16,409 17,355 18,301
E1 and G1 11,388 12,403 13,446 14,519 15,620
E2 and G2 10,612 12,029 12,868 13,699 14,519
Primary 38,249 42,648 48,345 54,970 62,178
Annual change 0% 12% 13% 14% 13%
G3 8,279 9,580 11,250 12,451 13,699
G4 7,197 8,383 9,661 11,297 12,451
G5 6,904 7,050 8,269 9,595 11,297
G6 6,011 6,805 6,982 8,230 9,595
G7 5,419 5,815 6,657 6,907 8,230
G8 4,439 5,014 5,526 6,491 6,907
Secondary 5,102 5,849 7,295 9,159 11,823
Annual change 0% 15% 25% 26% 29%
G9 2,075 2,483 3,123 3,793 4,868
G10 1,785 1,971 2,400 3,071 3,793
G11 609 801 984 1,319 1,843
G12 634 595 789 976 1,319
Vocational 1,872 1,966 2,064 2,167 2,276
Annual change 0% 5% 5% 5% 5%
FODE 655 711 796 939 1174
Annual change
9% 12% 18% 25%
Total 82,396 91,069 101,224 112,809 125,892
Annual change 11% 11% 11% 12%
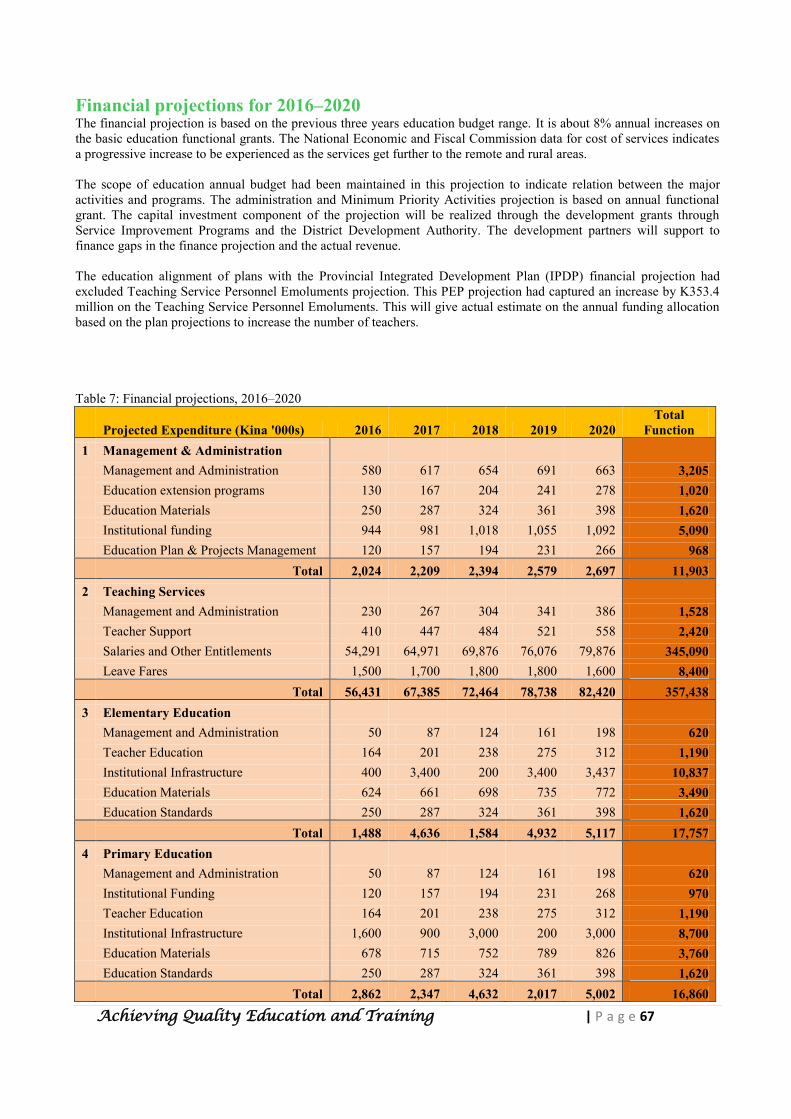
Achieving Quality Education and Training | P a g e 67
Financial projections for 2016–2020 The financial projection is based on the previous three years education budget range. It is about 8% annual increases on the basic education functional grants. The National Economic and Fiscal Commission data for cost of services indicates a progressive increase to be experienced as the services get further to the remote and rural areas. The scope of education annual budget had been maintained in this projection to indicate relation between the major activities and programs. The administration and Minimum Priority Activities projection is based on annual functional grant. The capital investment component of the projection will be realized through the development grants through Service Improvement Programs and the District Development Authority. The development partners will support to finance gaps in the finance projection and the actual revenue. The education alignment of plans with the Provincial Integrated Development Plan (IPDP) financial projection had excluded Teaching Service Personnel Emoluments projection. This PEP projection had captured an increase by K353.4 million on the Teaching Service Personnel Emoluments. This will give actual estimate on the annual funding allocation based on the plan projections to increase the number of teachers. Table 7: Financial projections, 2016–2020
Projected Expenditure (Kina '000s) 2016 2017 2018 2019 2020
Total Function
1 Management & Administration
Management and Administration 580 617 654 691 663 3,205
Education extension programs 130 167 204 241 278 1,020
Education Materials 250 287 324 361 398 1,620
Institutional funding 944 981 1,018 1,055 1,092 5,090
Education Plan & Projects Management 120 157 194 231 266 968
Total 2,024 2,209 2,394 2,579 2,697 11,903
2 Teaching Services
Management and Administration 230 267 304 341 386 1,528
Teacher Support 410 447 484 521 558 2,420
Salaries and Other Entitlements 54,291 64,971 69,876 76,076 79,876 345,090
Leave Fares 1,500 1,700 1,800 1,800 1,600 8,400
Total 56,431 67,385 72,464 78,738 82,420 357,438
3 Elementary Education
Management and Administration 50 87 124 161 198 620
Teacher Education 164 201 238 275 312 1,190
Institutional Infrastructure 400 3,400 200 3,400 3,437 10,837
Education Materials 624 661 698 735 772 3,490
Education Standards 250 287 324 361 398 1,620
Total 1,488 4,636 1,584 4,932 5,117 17,757
4 Primary Education
Management and Administration 50 87 124 161 198 620
Institutional Funding 120 157 194 231 268 970
Teacher Education 164 201 238 275 312 1,190
Institutional Infrastructure 1,600 900 3,000 200 3,000 8,700
Education Materials 678 715 752 789 826 3,760
Education Standards 250 287 324 361 398 1,620
Total 2,862 2,347 4,632 2,017 5,002 16,860
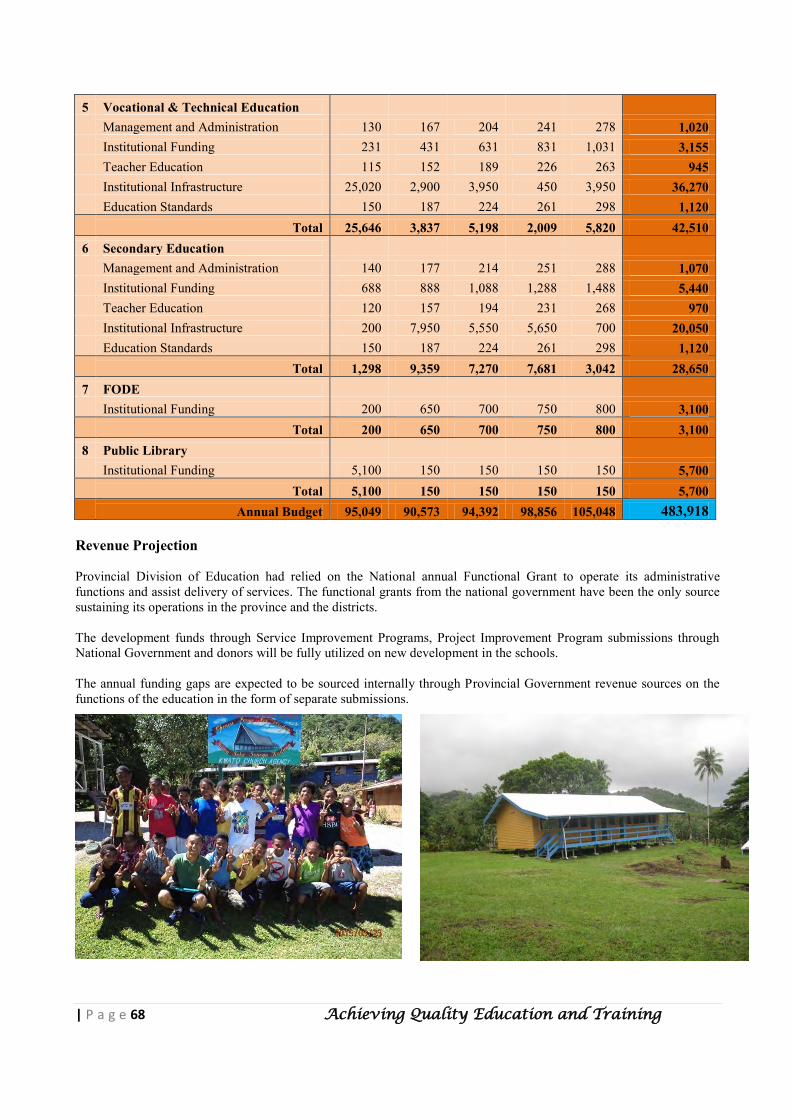
| P a g e 68 Achieving Quality Education and Training
5 Vocational & Technical Education
Management and Administration 130 167 204 241 278 1,020
Institutional Funding 231 431 631 831 1,031 3,155
Teacher Education 115 152 189 226 263 945
Institutional Infrastructure 25,020 2,900 3,950 450 3,950 36,270
Education Standards 150 187 224 261 298 1,120
Total 25,646 3,837 5,198 2,009 5,820 42,510
6 Secondary Education
Management and Administration 140 177 214 251 288 1,070
Institutional Funding 688 888 1,088 1,288 1,488 5,440
Teacher Education 120 157 194 231 268 970
Institutional Infrastructure 200 7,950 5,550 5,650 700 20,050
Education Standards 150 187 224 261 298 1,120
Total 1,298 9,359 7,270 7,681 3,042 28,650
7 FODE
Institutional Funding 200 650 700 750 800 3,100
Total 200 650 700 750 800 3,100
8 Public Library
Institutional Funding 5,100 150 150 150 150 5,700
Total 5,100 150 150 150 150 5,700
Annual Budget 95,049 90,573 94,392 98,856 105,048 483,918
Revenue Projection Provincial Division of Education had relied on the National annual Functional Grant to operate its administrative functions and assist delivery of services. The functional grants from the national government have been the only source sustaining its operations in the province and the districts. The development funds through Service Improvement Programs, Project Improvement Program submissions through National Government and donors will be fully utilized on new development in the schools. The annual funding gaps are expected to be sourced internally through Provincial Government revenue sources on the functions of the education in the form of separate submissions.
Achieving Quality Education and Training | P a g e 69
SECTION SEVEN
ANNEXES
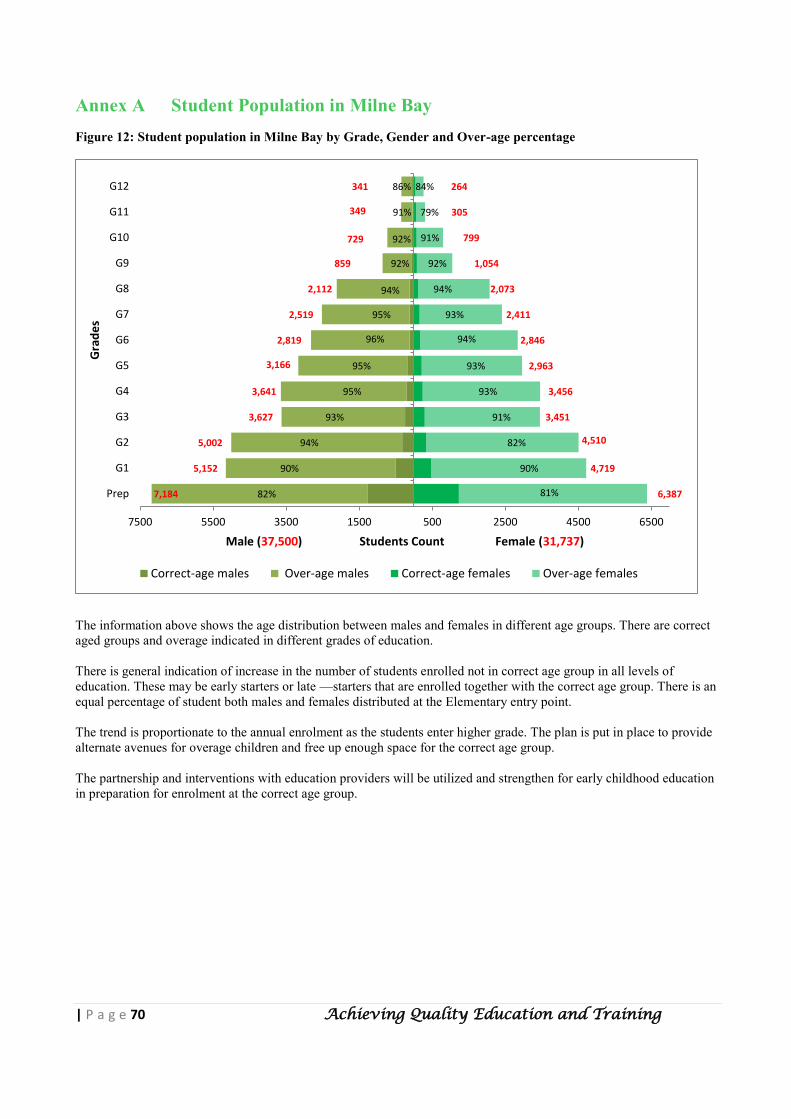
| P a g e 70 Achieving Quality Education and Training
Annex A Student Population in Milne Bay Figure 12: Student population in Milne Bay by Grade, Gender and Over-age percentage
The information above shows the age distribution between males and females in different age groups. There are correct aged groups and overage indicated in different grades of education. There is general indication of increase in the number of students enrolled not in correct age group in all levels of education. These may be early starters or late ––starters that are enrolled together with the correct age group. There is an equal percentage of student both males and females distributed at the Elementary entry point. The trend is proportionate to the annual enrolment as the students enter higher grade. The plan is put in place to provide alternate avenues for overage children and free up enough space for the correct age group. The partnership and interventions with education providers will be utilized and strengthen for early childhood education in preparation for enrolment at the correct age group.
82%
90%
94%
93%
95%
95%
96%
95%
94%
92%
92%
91%
86%
7,184
5,152
5,002
3,627
3,641
3,166
2,819
2,519
2,112
859
729
349
341
6,387
4,719
4,510
3,451
3,456
2,963
2,846
2,411
2,073
1,054
799
305
264
81%
90%
82%
91%
93%
93%
94%
93%
94%
92%
91%
79%
84%
7500 5500 3500 1500 500 2500 4500 6500
Prep
G1
G2
G3
G4
G5
G6
G7
G8
G9
G10
G11
G12
Male (37,500) Students Count Female (31,737)
Gra
de
s
Correct-age males Over-age males Correct-age females Over-age females
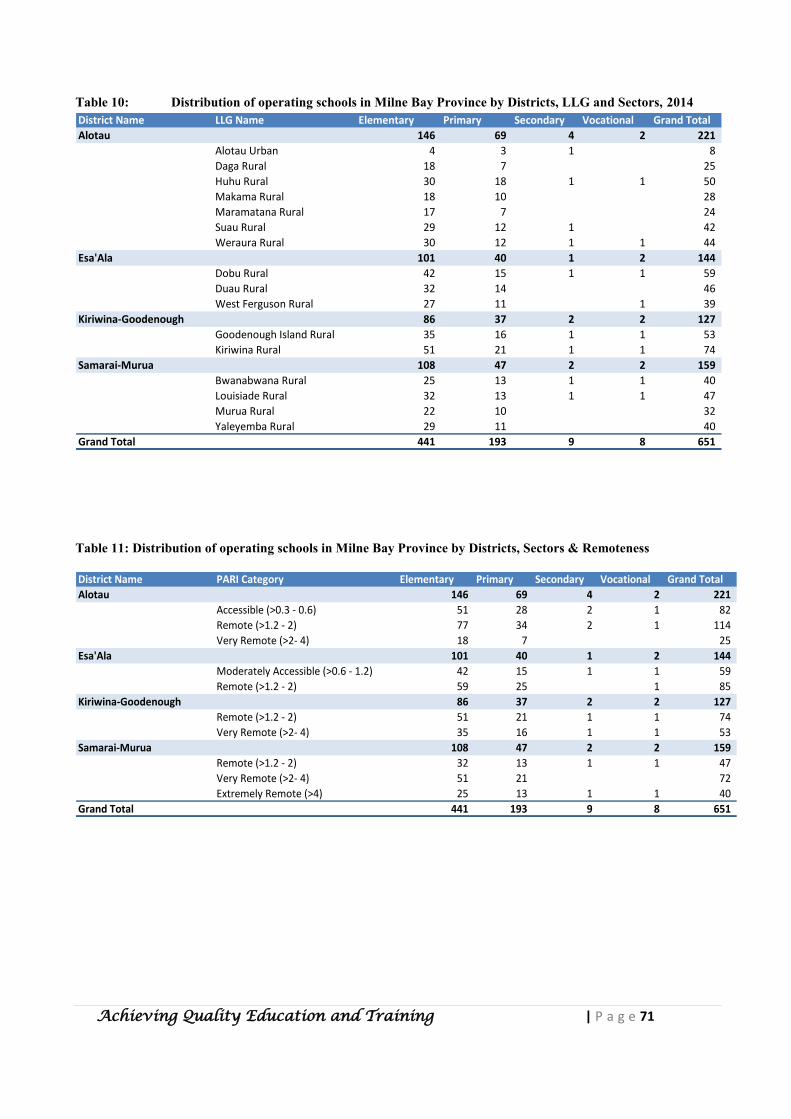
Achieving Quality Education and Training | P a g e 71
Table 10: Distribution of operating schools in Milne Bay Province by Districts, LLG and Sectors, 2014 District Name LLG Name Elementary Primary Secondary Vocational Grand Total
Alotau 146 69 4 2 221
Alotau Urban 4 3 1 8
Daga Rural 18 7 25
Huhu Rural 30 18 1 1 50
Makama Rural 18 10 28
Maramatana Rural 17 7 24
Suau Rural 29 12 1 42
Weraura Rural 30 12 1 1 44
Esa'Ala 101 40 1 2 144
Dobu Rural 42 15 1 1 59
Duau Rural 32 14 46
West Ferguson Rural 27 11 1 39
Kiriwina-Goodenough 86 37 2 2 127
Goodenough Island Rural 35 16 1 1 53
Kiriwina Rural 51 21 1 1 74
Samarai-Murua 108 47 2 2 159
Bwanabwana Rural 25 13 1 1 40
Louisiade Rural 32 13 1 1 47
Murua Rural 22 10 32
Yaleyemba Rural 29 11 40
Grand Total 441 193 9 8 651
Table 11: Distribution of operating schools in Milne Bay Province by Districts, Sectors & Remoteness
District Name PARI Category Elementary Primary Secondary Vocational Grand Total
Alotau 146 69 4 2 221
Accessible (>0.3 - 0.6) 51 28 2 1 82
Remote (>1.2 - 2) 77 34 2 1 114
Very Remote (>2- 4) 18 7 25
Esa'Ala 101 40 1 2 144
Moderately Accessible (>0.6 - 1.2) 42 15 1 1 59
Remote (>1.2 - 2) 59 25 1 85
Kiriwina-Goodenough 86 37 2 2 127
Remote (>1.2 - 2) 51 21 1 1 74
Very Remote (>2- 4) 35 16 1 1 53
Samarai-Murua 108 47 2 2 159
Remote (>1.2 - 2) 32 13 1 1 47
Very Remote (>2- 4) 51 21 72
Extremely Remote (>4) 25 13 1 1 40
Grand Total 441 193 9 8 651
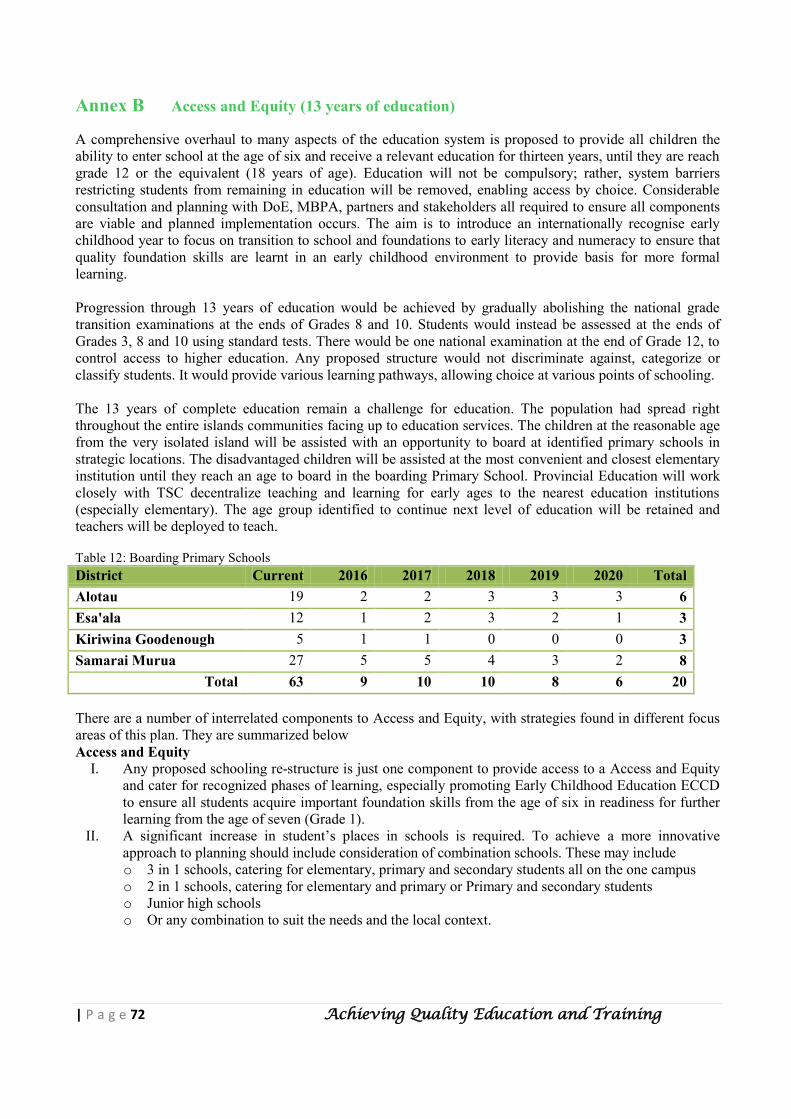
| P a g e 72 Achieving Quality Education and Training
Annex B Access and Equity (13 years of education) A comprehensive overhaul to many aspects of the education system is proposed to provide all children the ability to enter school at the age of six and receive a relevant education for thirteen years, until they are reach grade 12 or the equivalent (18 years of age). Education will not be compulsory; rather, system barriers restricting students from remaining in education will be removed, enabling access by choice. Considerable consultation and planning with DoE, MBPA, partners and stakeholders all required to ensure all components are viable and planned implementation occurs. The aim is to introduce an internationally recognise early childhood year to focus on transition to school and foundations to early literacy and numeracy to ensure that quality foundation skills are learnt in an early childhood environment to provide basis for more formal learning. Progression through 13 years of education would be achieved by gradually abolishing the national grade transition examinations at the ends of Grades 8 and 10. Students would instead be assessed at the ends of Grades 3, 8 and 10 using standard tests. There would be one national examination at the end of Grade 12, to control access to higher education. Any proposed structure would not discriminate against, categorize or classify students. It would provide various learning pathways, allowing choice at various points of schooling. The 13 years of complete education remain a challenge for education. The population had spread right throughout the entire islands communities facing up to education services. The children at the reasonable age from the very isolated island will be assisted with an opportunity to board at identified primary schools in strategic locations. The disadvantaged children will be assisted at the most convenient and closest elementary institution until they reach an age to board in the boarding Primary School. Provincial Education will work closely with TSC decentralize teaching and learning for early ages to the nearest education institutions (especially elementary). The age group identified to continue next level of education will be retained and teachers will be deployed to teach. Table 12: Boarding Primary Schools District Current 2016 2017 2018 2019 2020 Total Alotau 19 2 2 3 3 3 6 Esa'ala 12 1 2 3 2 1 3 Kiriwina Goodenough 5 1 1 0 0 0 3 Samarai Murua 27 5 5 4 3 2 8
Total 63 9 10 10 8 6 20 There are a number of interrelated components to Access and Equity, with strategies found in different focus areas of this plan. They are summarized below Access and Equity
I. Any proposed schooling re-structure is just one component to provide access to a Access and Equity and cater for recognized phases of learning, especially promoting Early Childhood Education ECCD to ensure all students acquire important foundation skills from the age of six in readiness for further learning from the age of seven (Grade 1).
II. A significant increase in student’s places in schools is required. To achieve a more innovative approach to planning should include consideration of combination schools. These may include o 3 in 1 schools, catering for elementary, primary and secondary students all on the one campus o 2 in 1 schools, catering for elementary and primary or Primary and secondary students o Junior high schools o Or any combination to suit the needs and the local context.
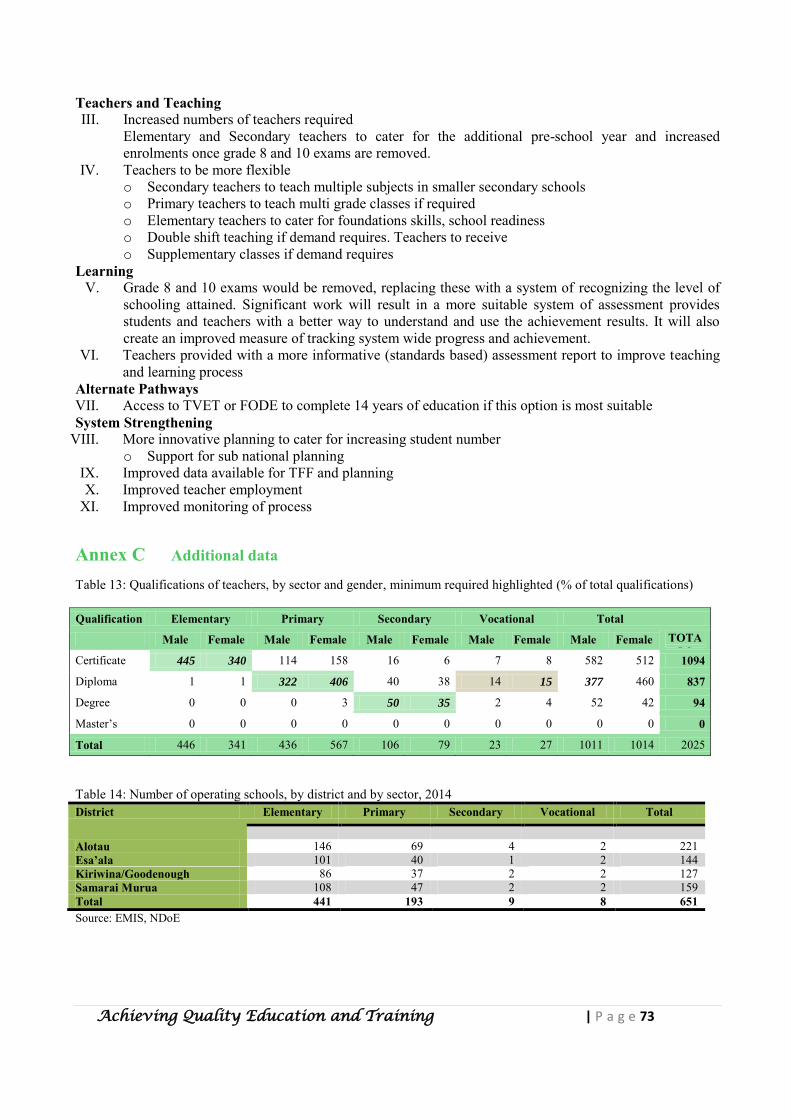
Achieving Quality Education and Training | P a g e 73
Teachers and Teaching III. Increased numbers of teachers required
Elementary and Secondary teachers to cater for the additional pre-school year and increased enrolments once grade 8 and 10 exams are removed.
IV. Teachers to be more flexible o Secondary teachers to teach multiple subjects in smaller secondary schools o Primary teachers to teach multi grade classes if required o Elementary teachers to cater for foundations skills, school readiness o Double shift teaching if demand requires. Teachers to receive o Supplementary classes if demand requires
Learning V. Grade 8 and 10 exams would be removed, replacing these with a system of recognizing the level of
schooling attained. Significant work will result in a more suitable system of assessment provides students and teachers with a better way to understand and use the achievement results. It will also create an improved measure of tracking system wide progress and achievement.
VI. Teachers provided with a more informative (standards based) assessment report to improve teaching and learning process
Alternate Pathways VII. Access to TVET or FODE to complete 14 years of education if this option is most suitable System Strengthening
VIII. More innovative planning to cater for increasing student number o Support for sub national planning
IX. Improved data available for TFF and planning X. Improved teacher employment
XI. Improved monitoring of process
Annex C Additional data Table 13: Qualifications of teachers, by sector and gender, minimum required highlighted (% of total qualifications)
Table 14: Number of operating schools, by district and by sector, 2014
District Elementary Primary Secondary Vocational Total
Alotau 146 69 4 2 221 Esa’ala 101 40 1 2 144 Kiriwina/Goodenough 86 37 2 2 127 Samarai Murua 108 47 2 2 159 Total 441 193 9 8 651 Source: EMIS, NDoE
Qualification Elementary Primary Secondary Vocational Total
Male Female Male Female Male Female Male Female Male Female TOTALS
female Certificate 445 340 114 158 16 6 7 8 582 512 1094
Diploma 1 1 322 406 40 38 14 15 377 460 837
Degree 0 0 0 3 50 35 2 4 52 42 94
Master’s 0 0 0 0 0 0 0 0 0 0 0
Total 446 341 436 567 106 79 23 27 1011 1014 2025
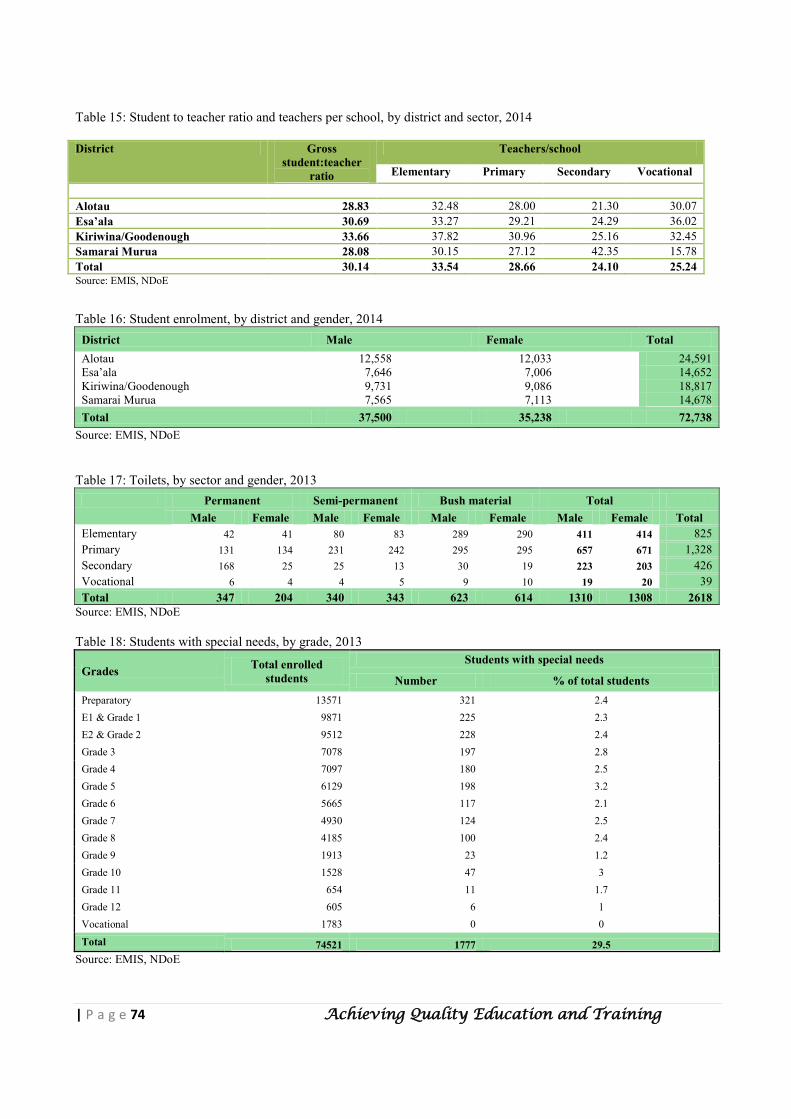
| P a g e 74 Achieving Quality Education and Training
Table 15: Student to teacher ratio and teachers per school, by district and sector, 2014 District Gross
student:teacher ratio
Teachers/school
Elementary Primary Secondary Vocational Alotau 28.83 32.48 28.00 21.30 30.07 Esa’ala 30.69 33.27 29.21 24.29 36.02 Kiriwina/Goodenough 33.66 37.82 30.96 25.16 32.45 Samarai Murua 28.08 30.15 27.12 42.35 15.78 Total 30.14 33.54 28.66 24.10 25.24 Source: EMIS, NDoE Table 16: Student enrolment, by district and gender, 2014
District Male Female Total Alotau 12,558 12,033 24,591 Esa’ala 7,646 7,006 14,652 Kiriwina/Goodenough 9,731 9,086 18,817 Samarai Murua 7,565 7,113 14,678 Total 37,500 35,238 72,738
Source: EMIS, NDoE Table 17: Toilets, by sector and gender, 2013
Permanent Semi-permanent Bush material Total
Male Female Male Female Male Female Male Female Total
Elementary 42 41 80 83 289 290 411 414 825 Primary 131 134 231 242 295 295 657 671 1,328 Secondary 168 25 25 13 30 19 223 203 426 Vocational 6 4 4 5 9 10 19 20 39 Total 347 204 340 343 623 614 1310 1308 2618
Source: EMIS, NDoE Table 18: Students with special needs, by grade, 2013
Grades Total enrolled students
Students with special needs
Number % of total students Preparatory 13571 321 2.4 E1 & Grade 1 9871 225 2.3 E2 & Grade 2 9512 228 2.4 Grade 3 7078 197 2.8 Grade 4 7097 180 2.5 Grade 5 6129 198 3.2 Grade 6 5665 117 2.1 Grade 7 4930 124 2.5 Grade 8 4185 100 2.4 Grade 9 1913 23 1.2 Grade 10 1528 47 3 Grade 11 654 11 1.7 Grade 12 605 6 1 Vocational 1783 0 0
Total 74521 1777 29.5 Source: EMIS, NDoE
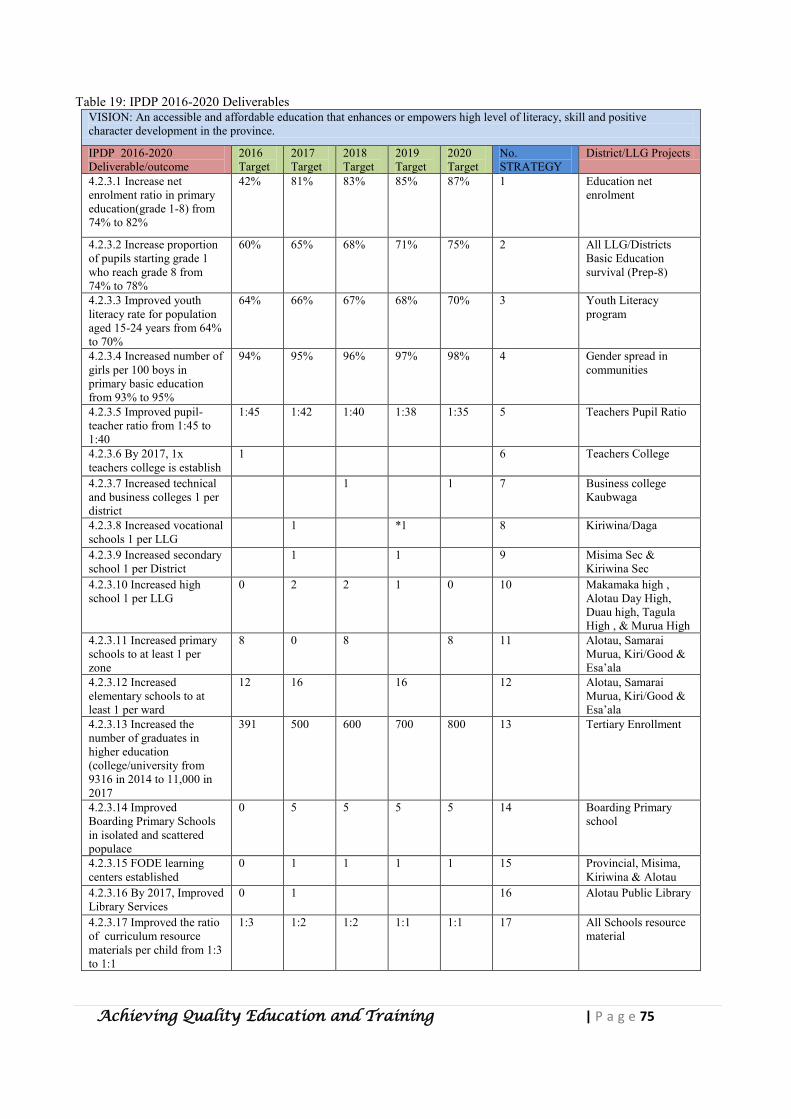
Achieving Quality Education and Training | P a g e 75
Table 19: IPDP 2016-2020 Deliverables VISION: An accessible and affordable education that enhances or empowers high level of literacy, skill and positive character development in the province.
IPDP 2016-2020 Deliverable/outcome
2016 Target
2017 Target
2018 Target
2019 Target
2020 Target
No. STRATEGY
District/LLG Projects
4.2.3.1 Increase net enrolment ratio in primary education(grade 1-8) from 74% to 82%
42% 81% 83% 85% 87% 1 Education net enrolment
4.2.3.2 Increase proportion of pupils starting grade 1 who reach grade 8 from 74% to 78%
60% 65% 68% 71% 75% 2 All LLG/Districts Basic Education survival (Prep-8)
4.2.3.3 Improved youth literacy rate for population aged 15-24 years from 64% to 70%
64% 66% 67% 68% 70% 3 Youth Literacy program
4.2.3.4 Increased number of girls per 100 boys in primary basic education from 93% to 95%
94% 95% 96% 97% 98% 4 Gender spread in communities
4.2.3.5 Improved pupil-teacher ratio from 1:45 to 1:40
1:45 1:42 1:40 1:38 1:35 5 Teachers Pupil Ratio
4.2.3.6 By 2017, 1x teachers college is establish
1 6 Teachers College
4.2.3.7 Increased technical and business colleges 1 per district
1 1 7 Business college Kaubwaga
4.2.3.8 Increased vocational schools 1 per LLG
1 *1 8 Kiriwina/Daga
4.2.3.9 Increased secondary school 1 per District
1 1 9 Misima Sec & Kiriwina Sec
4.2.3.10 Increased high school 1 per LLG
0 2 2 1 0 10 Makamaka high , Alotau Day High, Duau high, Tagula High , & Murua High
4.2.3.11 Increased primary schools to at least 1 per zone
8 0 8 8 11 Alotau, Samarai Murua, Kiri/Good & Esa’ala
4.2.3.12 Increased elementary schools to at least 1 per ward
12 16 16 12 Alotau, Samarai Murua, Kiri/Good & Esa’ala
4.2.3.13 Increased the number of graduates in higher education (college/university from 9316 in 2014 to 11,000 in 2017
391 500 600 700 800 13 Tertiary Enrollment
4.2.3.14 Improved Boarding Primary Schools in isolated and scattered populace
0 5 5 5 5 14 Boarding Primary school
4.2.3.15 FODE learning centers established
0 1 1 1 1 15 Provincial, Misima, Kiriwina & Alotau
4.2.3.16 By 2017, Improved Library Services
0 1
16 Alotau Public Library
4.2.3.17 Improved the ratio of curriculum resource materials per child from 1:3 to 1:1
1:3 1:2 1:2 1:1 1:1 17 All Schools resource material
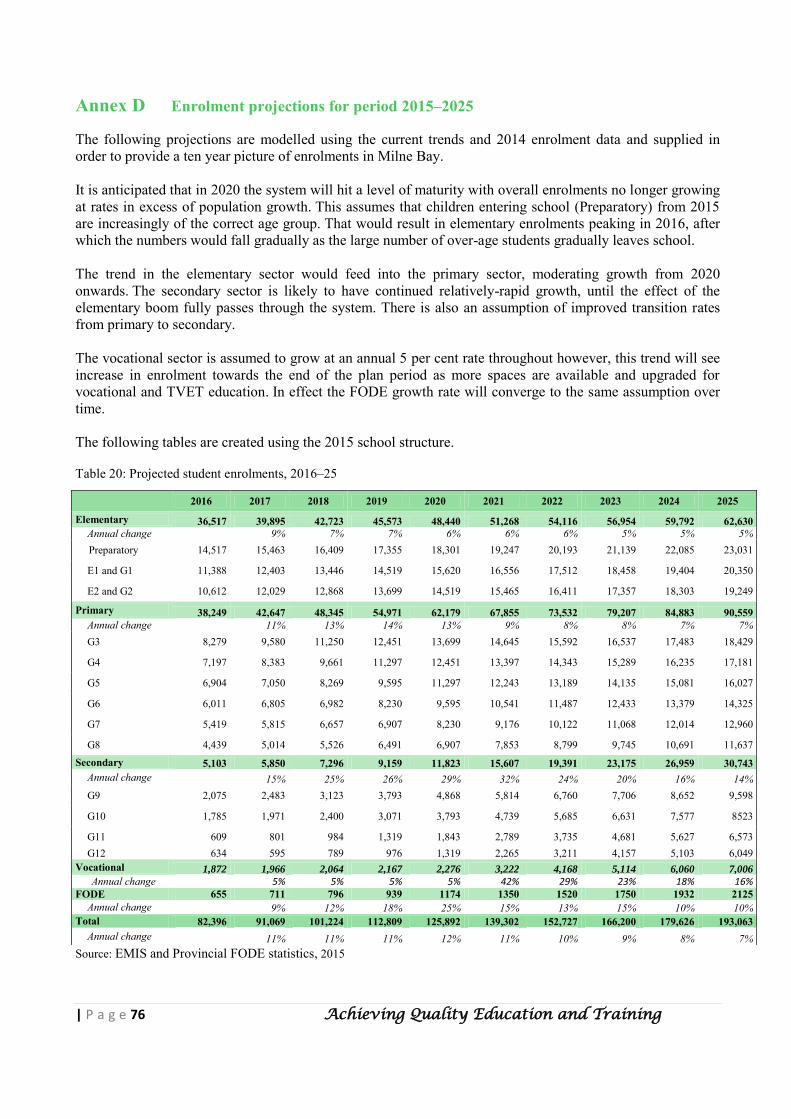
| P a g e 76 Achieving Quality Education and Training
Annex D Enrolment projections for period 2015–2025 The following projections are modelled using the current trends and 2014 enrolment data and supplied in order to provide a ten year picture of enrolments in Milne Bay. It is anticipated that in 2020 the system will hit a level of maturity with overall enrolments no longer growing at rates in excess of population growth. This assumes that children entering school (Preparatory) from 2015 are increasingly of the correct age group. That would result in elementary enrolments peaking in 2016, after which the numbers would fall gradually as the large number of over-age students gradually leaves school. The trend in the elementary sector would feed into the primary sector, moderating growth from 2020 onwards. The secondary sector is likely to have continued relatively-rapid growth, until the effect of the elementary boom fully passes through the system. There is also an assumption of improved transition rates from primary to secondary. The vocational sector is assumed to grow at an annual 5 per cent rate throughout however, this trend will see increase in enrolment towards the end of the plan period as more spaces are available and upgraded for vocational and TVET education. In effect the FODE growth rate will converge to the same assumption over time. The following tables are created using the 2015 school structure. Table 20: Projected student enrolments, 2016–25
Source: EMIS and Provincial FODE statistics, 2015
2016 2017 2018 2019 2020 2021 2022 2023 2024 2025
Elementary 36,517 39,895 42,723 45,573 48,440 51,268 54,116 56,954 59,792 62,630 Annual change 9% 7% 7% 6% 6% 6% 5% 5% 5% Preparatory 14,517 15,463 16,409 17,355 18,301 19,247 20,193 21,139 22,085 23,031
E1 and G1 11,388 12,403 13,446 14,519 15,620 16,556 17,512 18,458 19,404 20,350
E2 and G2 10,612 12,029 12,868 13,699 14,519 15,465 16,411 17,357 18,303 19,249
Primary 38,249 42,647 48,345 54,971 62,179 67,855 73,532 79,207 84,883 90,559 Annual change 11% 13% 14% 13% 9% 8% 8% 7% 7% G3 8,279 9,580 11,250 12,451 13,699 14,645 15,592 16,537 17,483 18,429
G4 7,197 8,383 9,661 11,297 12,451 13,397 14,343 15,289 16,235 17,181
G5 6,904 7,050 8,269 9,595 11,297 12,243 13,189 14,135 15,081 16,027
G6 6,011 6,805 6,982 8,230 9,595 10,541 11,487 12,433 13,379 14,325
G7 5,419 5,815 6,657 6,907 8,230 9,176 10,122 11,068 12,014 12,960
G8 4,439 5,014 5,526 6,491 6,907 7,853 8,799 9,745 10,691 11,637
Secondary 5,103 5,850 7,296 9,159 11,823 15,607 19,391 23,175 26,959 30,743 Annual change 15% 25% 26% 29% 32% 24% 20% 16% 14% G9 2,075 2,483 3,123 3,793 4,868 5,814 6,760 7,706 8,652 9,598
G10 1,785 1,971 2,400 3,071 3,793 4,739 5,685 6,631 7,577 8523
G11 609 801 984 1,319 1,843 2,789 3,735 4,681 5,627 6,573 G12 634 595 789 976 1,319 2,265 3,211 4,157 5,103 6,049 Vocational 1,872 1,966 2,064 2,167 2,276 3,222 4,168 5,114 6,060 7,006
Annual change 5% 5% 5% 5% 42% 29% 23% 18% 16% FODE 655 711 796 939 1174 1350 1520 1750 1932 2125 Annual change 9% 12% 18% 25% 15% 13% 15% 10% 10% Total 82,396 91,069 101,224 112,809 125,892 139,302 152,727 166,200 179,626 193,063 Annual change 11% 11% 11% 12% 11% 10% 9% 8% 7%
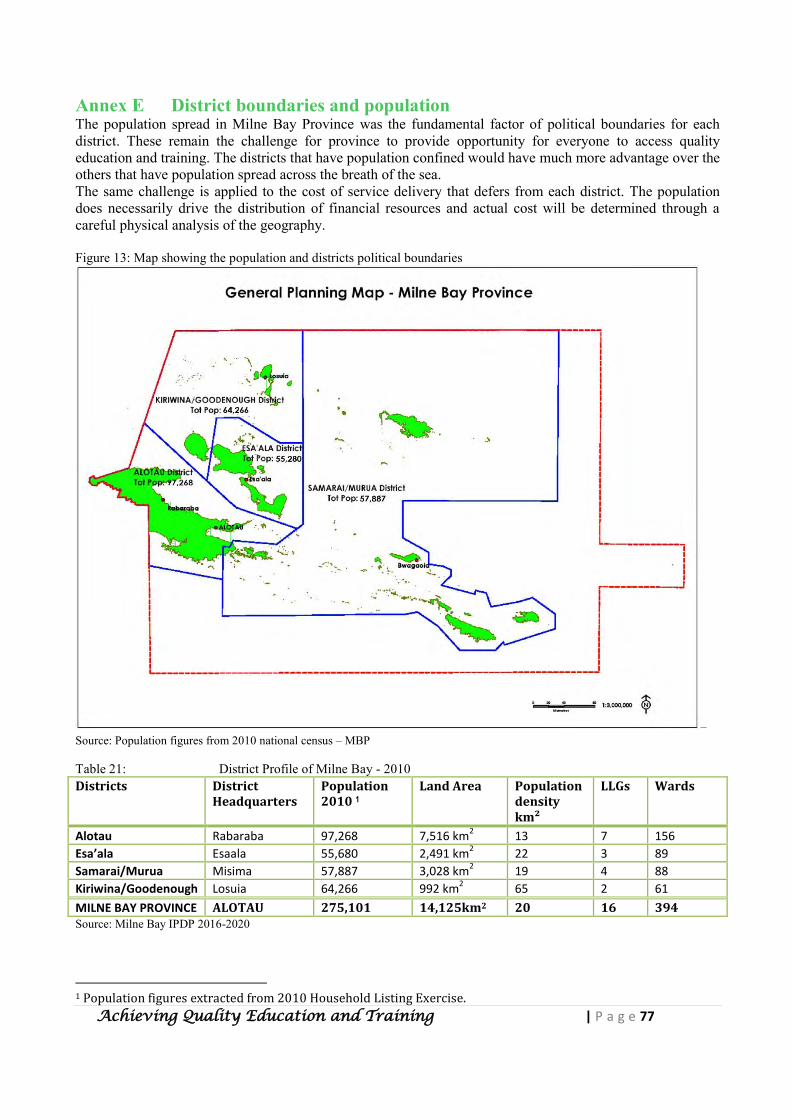
Achieving Quality Education and Training | P a g e 77
Annex E District boundaries and population The population spread in Milne Bay Province was the fundamental factor of political boundaries for each district. These remain the challenge for province to provide opportunity for everyone to access quality education and training. The districts that have population confined would have much more advantage over the others that have population spread across the breath of the sea. The same challenge is applied to the cost of service delivery that defers from each district. The population does necessarily drive the distribution of financial resources and actual cost will be determined through a careful physical analysis of the geography. Figure 13: Map showing the population and districts political boundaries
– Source: Population figures from 2010 national census – MBP Table 21: District Profile of Milne Bay - 2010 Districts District
Headquarters Population 2010 1
Land Area Population density km²
LLGs Wards
Alotau Rabaraba 97,268 7,516 km2 13 7 156
Esa’ala Esaala 55,680 2,491 km2 22 3 89
Samarai/Murua Misima 57,887 3,028 km2 19 4 88
Kiriwina/Goodenough Losuia 64,266 992 km2 65 2 61
MILNE BAY PROVINCE ALOTAU 275,101 14,125km2 20 16 394 Source: Milne Bay IPDP 2016-2020
1 Population figures extracted from 2010 Household Listing Exercise.
| P a g e 78 Achieving Quality Education and Training
Reference materials Milne Bay Provincial Education Law 2011
Integrated Provincial Development Plan (2011-2015) 2015 review report
Integrated Provincial Development Plan (2016-2020) deliverables alignment
Milne Bay Provincial Budget documents 2009-2015 (Functional Grant & Development Grant)
Provincial Education Plan 2007-2016 review report 2015
Milne Bay Provincial Education Profile 2014
Department of Education, National Education Plan 2015-2019
Department of National Planning & Monitoring (2010) PNG Medium Term Development Plan 2011 – 2015
Government of Papua New Guinea National Strategic Taskforce (2009) Papua New Guinea Vision 2050