
MILLIMAN CLIENT REPORT Survival of Medicare Fee-for...
25
MILLIMAN CLIENT REPORT Survival of Medicare Fee-for-Service Chemotherapy Patients by Site of Care November 2017 Pamela M. Pelizzari, MPH Bruce Pyenson, FSA, MAAA Senior Healthcare Consultant Principal and Consulting Actuary Christine Ferro David Rotter, PhD Healthcare Analytics Consultant Healthcare Data Analyst Sean Pittinger Actuarial Analyst Commissioned by the Alliance of Dedicated Cancer Centers
Transcript of MILLIMAN CLIENT REPORT Survival of Medicare Fee-for...

MILLIMAN CLIENT REPORT
Survival of Medicare Fee-for-Service Chemotherapy Patients by Site of Care November 2017
Pamela M. Pelizzari, MPH Bruce Pyenson, FSA, MAAA Senior Healthcare Consultant Principal and Consulting Actuary
Christine Ferro David Rotter, PhD Healthcare Analytics Consultant Healthcare Data Analyst
Sean Pittinger Actuarial Analyst Commissioned by the Alliance of Dedicated Cancer Centers


MILLIMAN CLIENT REPORT
Table of Contents EXECUTIVE SUMMARY ............................................................................................................ 1
BACKGROUND .......................................................................................................................... 3
FINDINGS ................................................................................................................................... 5
PATIENT SEVERITY .............................................................................................................. 5
SURVIVAL .............................................................................................................................. 7
IMPLICATIONS ........................................................................................................................ 10
LIMITATIONS ........................................................................................................................... 11
SOURCES AND METHODOLOGY .......................................................................................... 12
DATA .................................................................................................................................... 12
DETAILED METHODOLOGY ............................................................................................... 12
Actively Treated for Cancer ........................................................................................... 12
Cancer Type .................................................................................................................. 13
Eligibility Requirements ................................................................................................. 14
Site of Care ................................................................................................................... 14
3M® CRG Treatment Level ........................................................................................... 16
REFERENCES ......................................................................................................................... 21

pg. 1 December 2017
Executive Summary Cancer is the second leading cause of death in the United States.1 Because of the large number of cancer diagnoses and deaths each year, studies of cancer survival are of interest to physicians, patients, and health services researchers alike. Prior studies on cancer patients have examined survival based on treatment in one particular type of facility, but few compare outcomes across multiple cancer treatment facility types simultaneously.2,3
This report compares the 36-month survival by treatment facility type for 46,762 Medicare fee-for-service patients treated with physician-administered cancer chemotherapy for breast, colon, lung, ovarian, pancreatic, or prostate cancer. The report compares prospective payment system (PPS)-exempt cancer hospitals to three other facility types: National Cancer Institute (NCI)-designated cancer centers, teaching hospitals, and all other hospitals.
This paper describes the following major findings:
x Patients treated at PPS-exempt cancer hospitals have lower risk of dying within 36 months than patients treated at other types of hospitals by 17% to 33%.
Across all cancer types examined, differences in survival at PPS-exempt cancer hospitals as compared to other facility types were statistically significant. When examining survival outcomes by cancer type, this remained true for 4 of the 6 cancer types analyzed. We find that patients under active treatment at PPS-exempt cancer hospitals have statistically significant better all-cause survival compared to patients treated at other sites of care.
x The risk adjustment mechanism employed in this study identifies relevant cost differences among patients.
We risk adjust patients using the Clinical Risk Groups (CRGs) developed by 3M®, which are intended to describe the extent and progression of the disease (with a higher treatment level indicating a higher degree of treatment difficulty).4 The average cost per month survived varies significantly by CRG treatment level, which supports the use of this risk adjustment metric.
x PPS-exempt cancer hospitals treat sicker patients than other types of hospitals (as defined by patients’ CRG levels).
Patients treated in PPS-exempt cancer hospitals were, on average, sicker than those patients treated in other settings, when measured using the percent of episodes in a higher treatment level. Among the sample of patients treated in PPS-exempt cancer hospitals, 64% were in the two highest levels of treatment compared to 56%-58% of patients for the other three sites of care.
As with any economic or actuarial analysis, it is not possible to capture all factors that may be significant. These findings represent survival outcomes for only 36 months, which may not be indicative of longer term cancer-related mortality. Furthermore, findings should be interpreted cautiously as survival is one of many metrics for the quality of care. While administrative claims

pg. 2 December 2017
data is a powerful tool to research cancer treatment outcomes, such data does not include important clinical factors such as cancer stage or tumor histology.
Because we present average data based on national databases, the findings should be interpreted carefully before they are applied to any particular situation. The data examined lacks information on carrier or durable medical equipment (DME) claims, thereby limiting the ability to analyze carrier or DME costs and utilization and restricting this analysis to hospital-based chemotherapy episodes. We included chemotherapy covered under Medicare Part A and Part B, but not Part D (oral chemotherapy) due to data limitations.
This report was commissioned by the Alliance of Dedicated Cancer Centers (ADCC), an organization with 11 member institutions whose sole mission is treating cancer patients. The ADCC advocates for the greatest possible access to their centers for all patients, and its member institutions are all exempt from payment under the typical inpatient prospective payment system used to pay for services provided to Medicare fee-for-service beneficiaries. The findings and conclusions reflect the opinion of the authors; Milliman does not endorse any policy. Findings for particular populations and for different time periods will vary from these findings. Bruce Pyenson is a member of the American Academy of Actuaries and meets its qualifications for this work.

pg. 3 December 2017
Background Cancer is the second leading cause of death in the United States1 and accounted for 21.6% of all deaths in 2015. In 2016, there were an estimated 1.685 million new cases of cancer and 595,690 cancer deaths.5 Survival and other treatment outcomes are a key consideration when cancer patients select a treatment center upon diagnosis.6 A national survey reports that 94% of cancer patients regard good treatment results as “extremely” or “very” important in their selection of treatment facility. 7 It can be difficult for patients to find this information when they are considering the many different settings in which they can receive cancer treatment – in order for survival statistics to be defensible and relevant, they must take into account the substantial variation in the types of patients who are being measured. Prior outcomes studies on cancer patients have examined survival based on treatment in one particular type of facility, but few compare outcomes across multiple cancer treatment facility types simultaneously.2,3
Type of treatment facility might play a role in survival outcomes among patients with cancer, with literature stating that facilities treating a higher volume of cancer patients and offering specialized treatment are associated with better survival outcomes.8,9,10 One study of Medicare beneficiaries diagnosed with advanced head and neck cancers indicated near statistically significant better survival at facilities treating a large portion of advanced head and neck cancer patients as compared to facilities treating a small volume of patients for the same disease.9 An additional study found statistically significant better five-year survival for non-Hodgkin lymphoma patients when treated at teaching hospitals as compared to other types of community facilities and also when treated by higher volume hospitals compared to lower volume hospitals.11
While common sense dictates that facilities exclusively dedicated to the treatment of cancer will generally be high volume in terms of their cancer patients, other teaching hospitals also treat a significant share of patients with cancer. For this analysis, we compared survival in PPS-exempt cancer hospitals to survival in three other distinct types of treatment facilities. All four of these facility types are defined below:
x Prospective Payment System–Exempt Cancer Hospitals: Hospitals that are excluded from the prospective payment system (PPS) that is typically used by the Centers for Medicare and Medicaid Services (CMS) to pay for inpatient services.12 PPS-exempt cancer hospitals were designated beginning in 1983. At that time, congress designated eight cancer centers to be exempt from the newly-created inpatient prospective payment system (IPPS). This has since expanded to 11 facilities.13
x National Cancer Institute (NCI)-designated Comprehensive Cancer Centers: Hospitals (other than PPS-exempt cancer hospitals) that are designated as comprehensive cancer centers which receive support from the National Cancer Institute for cancer research and which care for patients directly.14
x Teaching Hospitals: Hospitals (other than PPS-exempt cancer hospitals and NCI-designated comprehensive cancer centers) that have active residency programs, defined based on their receipt of indirect medical education (IME) payments from CMS.

pg. 4 December 2017
x All Other Hospitals: Any hospital that does not meet any of the three criteria above.
The objective of this analysis is to report three-year survival outcomes for Medicare Fee-for-service patients being treated for breast, colon, lung, ovarian, pancreatic, or prostate cancer with physician-administered chemotherapy between 2010 and 2011. For this analysis, we used the Medicare 100% and 5% Limited Data Set (LDS) files, which include details on claims paid by Medicare on behalf of beneficiaries eligible for Part A and Part B. We risk adjust patients using the Clinical Risk Groups (CRGs) developed by 3M®, which has been examined as an analytic tool for cancer studies using claims data when stage is not available.15 For more details on our methodology, see the Methodology and Data Sources section.

pg. 5 December 2017
Findings
PATIENT SEVERITY
While clinical characteristics such as stage of cancer, presence of metastases, and gene expression are important factors when determining the severity of cancer,16,17,18 this level of detail is not typically available in administrative claims data. To account for patient severity across sites of care, we use the Clinical Risk Group (CRG) risk adjustment model developed by 3M®, which assigns severity levels to individual patients based on their claims data.
We analyzed average per-patient cost differences across all cancers and sites of care for each CRG treatment level. Figure 1 provides a distribution of average Medicare allowed cost (amounts paid by both Medicare and the patient combined) per month survived. Medicare fees change over time and vary by region and facility. Costs in Figure 1 have been converted to nationwide average fee levels for 2016. This conversion allows for geographic- and facility-neutral comparison that indicates differences in utilization while compensating for disparities in payment structure.
FIGURE 1: AVERAGE COST PER MONTH SURVIVED BY TREATMENT LEVEL
Source: Milliman analysis of the Medicare 100% and 5% limited data sets for 2010-2014
The increasing cost with CRG treatment level is consistent with expectations of higher cost for patients with higher severity. PPS-exempt cancer hospitals have a more severe mix of patients when compared to other sites, with a higher portion of patients in CRG treatment levels 3 and 4 than the other sites. Figure 2 presents a distribution of episodes by CRG treatment level across
$4,299 $4,571
$7,273
$9,538
$0
$2,000
$4,000
$6,000
$8,000
$10,000
$12,000
1 2 3 4
2016
N
ATI
ON
WID
E A
VER
AG
E A
LLO
WED
CRG TREATMENT LEVEL

pg. 6 December 2017
all cancers for each site of care. Differences in the distribution by site are statistically significant (p<.05).
FIGURE 2: DISTRIBUTION OF CRG TREATMENT LEVEL BY CARE SETTING
PPS-EXEMPT TEACHING HOSPITAL NCI OTHER
HOSPITAL TOTAL
CRG Treatment Level N % N % N % N % N % p*
Treatment Level 1 443 11% 3,592 17% 659 17% 2,599 16% 7,293 16%
Treatment Level 2 1,072 26% 5,932 27% 917 24% 4,738 28% 12,659 27%
Treatment Level 3 1,883 46% 7,756 36% 1,502 39% 6,054 36% 17,195 37%
Treatment Level 4 735 18% 4,407 20% 728 19% 3,255 20% 9,125 20%
Total 4,133 100% 21,687 100% 3,806 100% 16,646 100% 46,272 100% <.0001
*P-value from Chi-squared analysis. Does not adjust for varying cancer type mixes across care settings. Source: Milliman analysis of the Medicare 100% and 5% limited data sets for 2010-2014
Based on the findings from this analysis, we find the CRGs an appropriate explanatory variable for patients. As such, we move forward with using CRGs as a risk adjustment mechanism.
pg. 7 December 2017
SURVIVAL
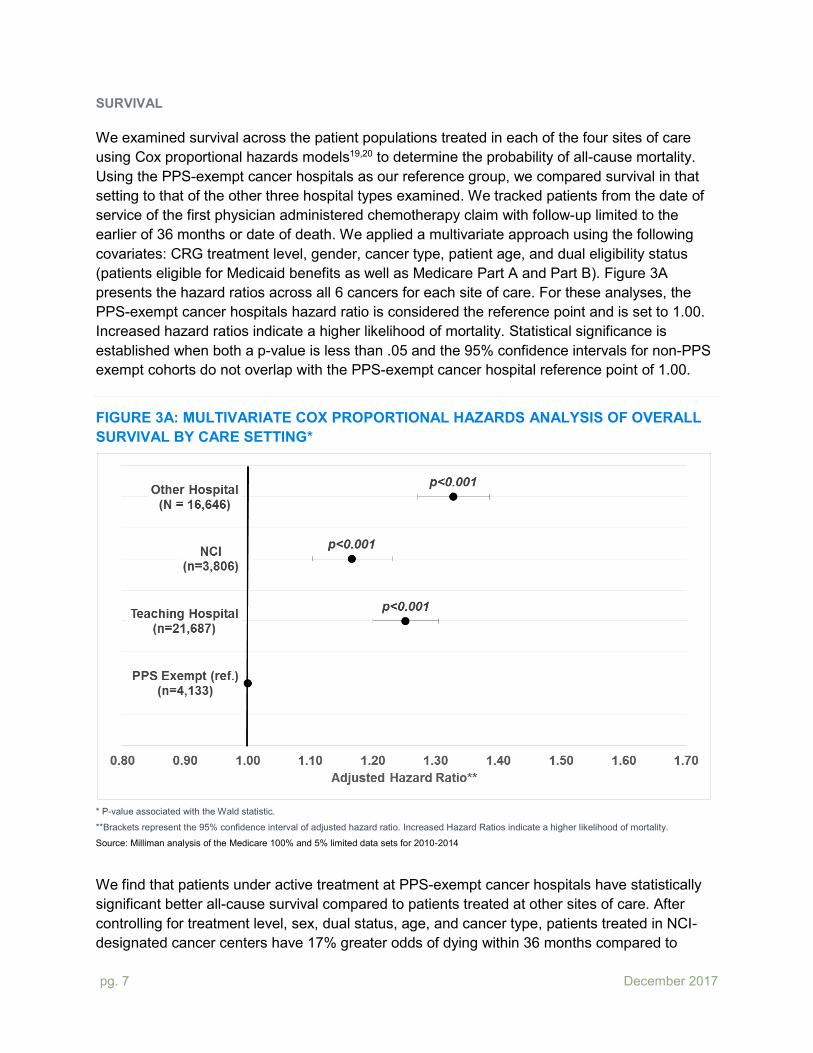
We examined survival across the patient populations treated in each of the four sites of care using Cox proportional hazards models19,20 to determine the probability of all-cause mortality. Using the PPS-exempt cancer hospitals as our reference group, we compared survival in that setting to that of the other three hospital types examined. We tracked patients from the date of service of the first physician administered chemotherapy claim with follow-up limited to the earlier of 36 months or date of death. We applied a multivariate approach using the following covariates: CRG treatment level, gender, cancer type, patient age, and dual eligibility status (patients eligible for Medicaid benefits as well as Medicare Part A and Part B). Figure 3A presents the hazard ratios across all 6 cancers for each site of care. For these analyses, the PPS-exempt cancer hospitals hazard ratio is considered the reference point and is set to 1.00. Increased hazard ratios indicate a higher likelihood of mortality. Statistical significance is established when both a p-value is less than .05 and the 95% confidence intervals for non-PPS exempt cohorts do not overlap with the PPS-exempt cancer hospital reference point of 1.00.
FIGURE 3A: MULTIVARIATE COX PROPORTIONAL HAZARDS ANALYSIS OF OVERALL SURVIVAL BY CARE SETTING*
* P-value associated with the Wald statistic.
**Brackets represent the 95% confidence interval of adjusted hazard ratio. Increased Hazard Ratios indicate a higher likelihood of mortality.
Source: Milliman analysis of the Medicare 100% and 5% limited data sets for 2010-2014
We find that patients under active treatment at PPS-exempt cancer hospitals have statistically significant better all-cause survival compared to patients treated at other sites of care. After controlling for treatment level, sex, dual status, age, and cancer type, patients treated in NCI-designated cancer centers have 17% greater odds of dying within 36 months compared to

pg. 8 December 2017
patients treated in PPS-exempt cancer centers. Likewise, patients treated in teaching hospitals and other hospitals have 25% and 33% greater odds of dying, respectively.
Survival by cancer type (Figure 3B) was generally similar to the overall population results. We found that episodes treated in PPS-exempt cancer hospitals have higher survival with statistical significance for breast, colon, lung, and pancreatic cancers.
FIGURE 3B: MULTIVARIATE COX PROPORTIONAL HAZARDS ANALYSIS OF OVERALL SURVIVAL BY CARE SETTING AND CANCER
BREAST
OVARIAN
COLON
PANCREATIC
LUNG
PROSTATE
* P-value associated with the Wald statistic.
**Brackets represent the 95% confidence interval of adjusted hazard ratio. Increased Hazard Ratios indicate a higher likelihood of mortality.

pg. 9 December 2017
Source: Milliman analysis of the Medicare 100% and 5% limited data sets for 2010-2014
After adjusting for patient severity, patients treated in PPS-exempt cancer hospitals with breast, colon, lung, and pancreatic cancers had higher survival which was significant (hazard ratios with both p<.05 and non-overlapping confidence intervals). Noting a wide variation in survival outcomes as indicated by the calculated 95% confidence intervals, breast cancer patients treated at teaching hospitals, NCI-designated cancer centers, and other hospitals reported 14%, 21%, and 17% respectively higher odds of death as compared to those treated by PPS-exempt cancer centers. The difference for colon cancer was more pronounced reporting 29%, 41%, and 25% increased odds of death when compared to the PPS-exempt cohort. Calculations for lung and pancreatic cancers reported less variability, and indicated PPS-exempt cancer centers as the leader in survival outcomes by as much as 32% for lung and 49% for pancreatic. For patients with ovarian and prostate cancers, survival was not different for patients treated in PPS-exempt cancer hospitals as compared to other sites.

pg. 10 December 2017
Implications
A newly diagnosed cancer patient will value reporting of survival outcomes when selecting a treatment facility. Cancer patients are a highly diverse group, with variation in terms of cancer type, stage, and complexity. Our analysis finds that different types of facilities have variation in the severity mix of their patients, and as such risk adjustment plays a critical role comparing survival outcomes across sites of care.
This analysis provides evidence that Medicare FFS cancer patients receiving physician administered chemotherapy at PPS-exempt cancer hospitals may experience improved odds of survival compared to patients treated at other hospital types. While our analysis was for only 6 cancer types, the cancers we examined include the most important cancers from the standpoint of mortality and incidence.
This study provides compelling information, but it is not a complete story. Because cancer therapies are changing, in the future readers will want to see the analysis using updated data. In addition, many chemotherapy patients are covered by commercial insurance. These patients tend to be younger than the patients examined in this study, and the fee-levels are both higher and structured differently than Medicare’s. Treatment modalities other than chemotherapy are important for cancer patients, and the study could be extended to those patients. Finally, as additional data sources become available, we believe it will soon be possible to bring into the analysis patients who receive chemotherapy in physician offices.

pg. 11 December 2017
Limitations
As with any economic or actuarial analysis, it is not possible to capture all factors that may be significant. Because we present average data based on the 2010-2014 Medicare 5% and 100% Limited Data Set (LDS), which are national databases, the findings should be interpreted carefully before they are applied to any particular situation. We included chemotherapy covered under Medicare Part A and Part B, but not Part D (oral chemotherapy) due to data limitations.
Chemotherapy is often provided in a physician’s office. Due to data limitations, patients who received their chemotherapy exclusively within a physician office were not included in this analysis. Additionally, it is possible that some episodes that were attributed to a hospital in this analysis actually included some physician office based chemotherapy, which was not identified due to the lack of physician claims in the 100% LDS. Based on our analysis of episodes that overlapped between the 5% and 100% LDS, we believe this only affected a small minority (approximately 0.3%) of cases. Physician office based episodes of care could be identified using the CMS 5% LDS, but because of the difference in claims availability, the assignment of CRGs for risk adjustment purposes was not comparable to episodes of care identified in the 100% LDS. Please refer to the Methodology section of this paper for more details.
While administrative claims data is a powerful tool to research cancer treatment outcomes, such data does not include important clinical factors such as cancer stage or tumor markers. Cancer patients represent a wide spectrum of severity, type, stage, and receive varying treatments. Survival rates can reflect a “lead time bias” where patients diagnosed early have better outcomes than those diagnosed at advanced stages.21 We employed the 3M® Clinical Risk Groups (CRGs) to measure and adjust for cancer acuity. This analysis demonstrates that the CRGs stratify patients into groups with significant differences in cost, which is consistent with the performance expectations of a prospective risk adjuster for cost. Because CRG assignment was based on the 100% LDS, we are likely missing some claims for cancer treatments occurring in physician offices or paid under the DME fee schedule. We have accounted for this issue by only including CRGs that indicate active treatment for cancer, but this limitation may still bias our results towards lower acuity CRGs.
These findings represent survival outcomes for only 36 months, which may not be indicative of longer term cancer-related mortality.
Our analysis included Medicare fee-for-service cancer patients initializing chemotherapy treatment in 2010 or 2011. Analysis of different time periods or populations, such as non-Medicare populations, may yield different results. The latest year analyzed in this report is 2014 and does not reflect advances in cancer treatments after that time. Oral chemotherapy covered under Part D, which is growing in importance, was not included in this analysis.

pg. 12 December 2017
Sources and Methodology
DATA
Medicare 5% and 100% Limited Data Set (LDS)
These are limited data sets containing Medicare paid claims generated by fee-for-service Medicare beneficiaries within the time period. Information includes county of residence, diagnosis codes, procedure codes, DRG codes, site of service information, beneficiary age, eligibility status and an indicator for HMO enrollment. Member identification codes are consistent from year to year and allow for multiyear longitudinal studies. The Medicare 100% sample data does not include carrier, DME, or Part D prescription drug data. The Medicare 5% sample additionally includes carrier and DME for a statistically-balanced sample of Medicare fee-for-service beneficiaries. We used 2009-2014 data for this analysis.
Due to the lack of carrier and DMEPOS claims in the Medicare 100% sample, claims data from the Medicare 5% sample was used to estimate the additional utilization that physician and DME claims contributed to episodes. The subset of episodes with overlapping claims data in both the Medicare 5% and 100% samples was used to develop per member per month gross up factors that were then applied to all episodes to estimate total utilization.
DETAILED METHODOLOGY
Identification of Study Population
Actively Treated for Cancer We identify patients who are actively being treated for cancer with chemotherapy infusions, beginning their treatment in either 2010 or 2011. We defined actively treated patients as reporting two or more claims with chemotherapy drug HCPCS codes occurring within six months of each other. Beneficiaries receiving chemotherapy were required to have a 12 month “clean period” (no chemotherapy) prior to the initiating chemotherapy claim to begin an episode of care.
The date of service of the first physician administered chemotherapy code in either 2010 or 2011 was designated as the episode start date. HCPCS codes used to identify chemotherapy are detailed below.

pg. 13 December 2017
TABLE 1: CHEMOTHERAPY HCPCS CODES A9543 C9292 J9019 J9055 J9110 J9200 J9226 J9280 J9328 J9600
A9545 C9295 J9020 J9060 J9120 J9201 J9228 J9290 J9330 J9999
C9021 C9296 J9025 J9062 J9130 J9202 J9230 J9291 J9340 Q2017
C9025 C9297 J9027 J9065 J9140 J9206 J9245 J9293 J9350 Q2043
C9027 C9442 J9031 J9070 J9150 J9207 J9250 J9299 J9351 Q2048
C9131 C9449 J9032 J9080 J9151 J9208 J9260 J9300 J9354 Q2049
C9257 C9453 J9033 J9090 J9155 J9211 J9261 J9301 J9355
C9259 C9455 J9035 J9091 J9160 J9212 J9262 J9302 J9357
C9260 J0202 J9039 J9092 J9165 J9213 J9263 J9303 J9360
C9265 J0894 J9040 J9093 J9170 J9214 J9264 J9305 J9370
C9273 J9000 J9041 J9094 J9171 J9215 J9265 J9306 J9371
C9276 J9001 J9042 J9095 J9178 J9216 J9266 J9307 J9375
C9280 J9002 J9043 J9096 J9179 J9217 J9267 J9308 J9380
C9284 J9010 J9045 J9097 J9181 J9218 J9268 J9310 J9390
C9287 J9015 J9047 J9098 J9185 J9219 J9270 J9315 J9395
C9289 J9017 J9050 J9100 J9190 J9225 J9271 J9320 J9400
Cancer Type Chemotherapy patients were required to be diagnosed with a cancer of interest to be included in the study. Cancers of interest included breast, colon, lung, ovarian, pancreatic, and prostate. Claims incurred in the 12 months prior to and six months following the episode start date were reviewed. A patient was determined to be diagnosed with a cancer if they reported the cancer’s diagnosis code in any position on either one or more inpatient, observation, or chemotherapy administration visits or two or more emergency department, non-acute inpatient, or outpatient claims on different dates of service. Patients identified for more than one cancer of interest were removed from this analysis.

pg. 14 December 2017
TABLE 2: IDENTIFICATION CODES CLAIM TYPE CODE TYPE VALUES
BREAST CANCER DIAGNOSIS CODE 174.XX, 233.0
COLON CANCER DIAGNOSIS CODE 153.XX
LUNG CANCER DIAGNOSIS CODE 162.XX
OVARIAN CANCER DIAGNOSIS CODE 183.0
PANCREATIC CANCER DIAGNOSIS CODE 157.XX
PROSTATE CANCER DIAGNOSIS CODE 185.XX
OUTPATIENT CLAIMS CPT CODE 99201-99205, 99211-99215, 99241-99245, 99341-99345, 99347-99350, 99384-99387, 99394-99397, 99401-99404, 99411, 99412, 99420, 99429, 99455, 99456
OUTPATIENT CLAIMS REVENUE CODE 051X, 0520-0523, 0526-0529, 057X-059X, 082X-085X, 088X, 0982, 0983
NON-ACUTE INPATIENT CLAIMS CPT CODE 99304-99310, 99315, 99316, 99318, 99324-99328, 99334-99337
NON-ACUTE INPATIENT CLAIMS REVENUE CODE 0118, 0128, 0138, 0148, 0158, 019X, 0524, 0525, 055X, 066X
ACUTE INPATIENT CLAIMS CPT CODE 99221-99223, 99231-99233, 99238, 99239, 99251, 99255, 99291
ACUTE INPATIENT CLAIMS REVENUE CODE 010X, 0110-0114, 0119, 0120-0124, 0129, 0130-0134, 0139, 0140-0144, 0149, 0150-0154, 0159, 016X, 020X, 021X, 072X, 080X, 0987
OBSERVATION CLAIMS CPT CODE 99217-99220, 99224-99226
EMERGENCY DEPARTMENT CLAIMS CPT CODE 99281-99285
EMERGENCY DEPARTMENT CLAIMS REVENUE CODE 0450-0452,0456,0459, 0981
CHEMOTHERAPY ADMINISTRATION CPT CODE 96401, 96402, 96405, 96406, 96410, 96411, 96413, 96415, 96416, 96417, 96420, 96422, 96423, 96425, 96440, 96445, 96446, 96450, 96542, 96549
Eligibility Requirements Beneficiaries were excluded from the study if they met any of the following conditions:
x Beneficiaries reporting a Medicare eligibility status for the ESRD program at any point in 2009-2014.
x Lack of continuous Part A and B, non-HMO (Medicare Advantage) coverage during any part of the analysis period – 12 months preceding the episode start date through 36 months following (or until date of death if earlier).
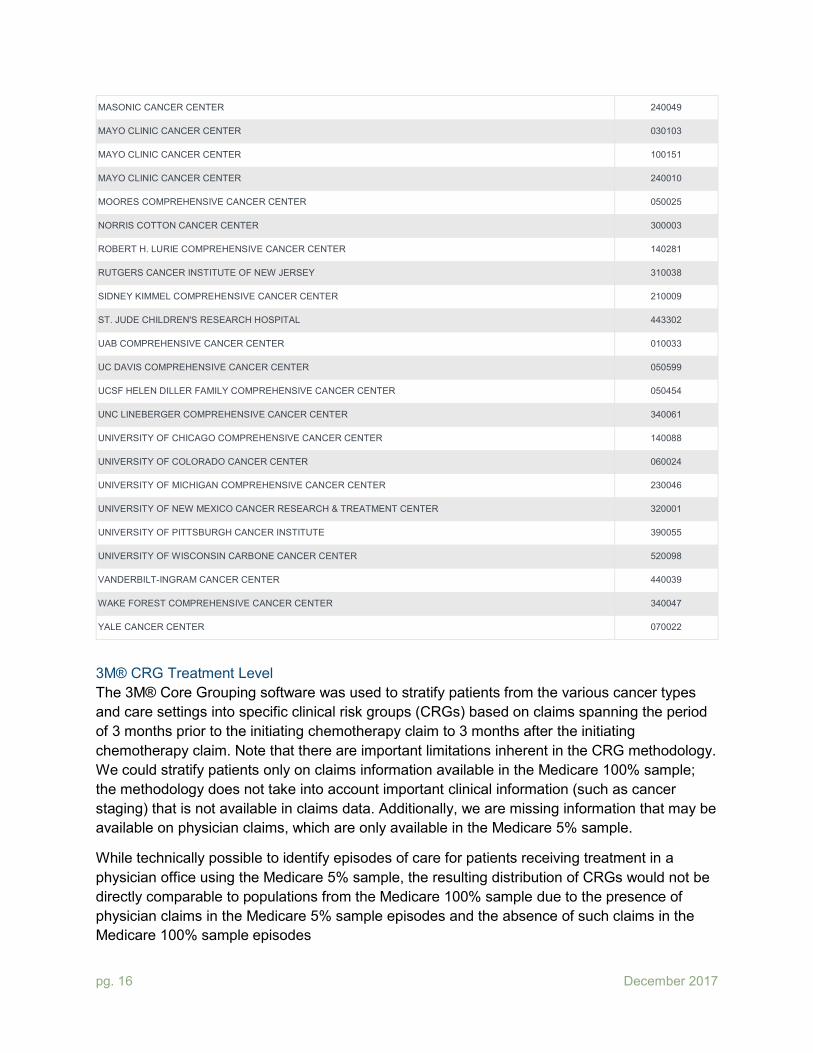
Site of Care Episodes of care were then assigned to one of four cohorts based on site of chemotherapy treatment using the following hierarchy: PPS-exempt cancer hospitals, NCI-designated comprehensive cancer centers, teaching hospitals, and other hospitals. PPS-exempt cancer hospitals and NCI-designated comprehensive cancer centers were identified by CMS Certification Number (CCN), as shown in Tables 3 and 4. Note that while the NCI designates several types of facilities, our category contains only those NCI-designated facilities which were designated as comprehensive cancer centers (45 facilities).22 Nine of the 45 facilities were included in our PPS-exempt cohort and the remaining 36 were included as NCI-designated comprehensive cancer centers. Teaching hospitals were identified using the inpatient

pg. 15 December 2017
prospective payment system (IPPS) public use impact files from CMS.gov.23,24 All remaining hospitals were assigned to the “other hospital” cohort. Patients were included in the care setting where more than 50% of infused chemotherapy services in the first six months following the episode start date were incurred.
TABLE 3: PPS-EXEMPT CANCER HOSPITALS CANCER CENTER CCN
AMERICAN ONCOLOGIC HOSPITAL (FOX CHASE) 390196
AUTHUR G. JAMES CANCER HOSPITAL AND RESEARCH INSTITUTE 360242
CITY OF HOPE NATIONAL MEDICAL CENTER 050146
DANA-FARBER CANCER INSTITUTE 220162
H. LEE MOFFITT CANCER CENTER & RESEARCH INSTITUTE HOSPITAL 100271
MEMORIAL HOSPITAL FOR CANCER AND ALLIED DISEASE 330154
ROSWELL PARK MEMORIAL INSTITUTE 330354
SEATTLE CANCER CARE ALLIANCE 500138
SYLVESTER COMPREHENSIVE CANCER CENTER 100079
THE UNIVERSITY OF TEXAS M.D. ANDERSON CANCER CENTER 450076
USC KENNETH NORRIS JR. CANCER HOSPITAL 050660
TABLE 4: NCI-DESIGNATED COMPREHENSIVE CANCER CENTERS CANCER CENTER CCN
ABRAMSON CANCER CENTER 390111
ALVIN J. SITEMAN CANCER CENTER 260032
ARIZONA CANCER CENTER 030064
BARBARA ANN KARMANOS CANCER INSTITUTE 230297
CASE COMPREHENSIVE CANCER CENTER 360137
CHAO FAMILY COMPREHENSIVE CANCER CENTER 050348
DAN L DUNCAN COMPREHENSIVE CANCER CENTER (BEN TAUB GENERAL HOSPITAL) 450289
DAN L DUNCAN COMPREHENSIVE CANCER CENTER (TEXAS CHILDREN'S HOSPITAL) 453304
DUKE CANCER INSTITUTE 340030
FRED HUTCHINSON / UNIVERSITY OF WASHINGTON CANCER CONSORTIUM 500008
GEORGETOWN LOMBARDI COMPREHENSIVE CANCER CENTER 090004
HAROLD C. SIMMONS COMPREHENSIVE CANCER CENTER 450044
HERBERT IRVING COMPREHENSIVE CANCER CENTER 330101
HOLDEN COMPREHENSIVE CANCER CENTER 160058
HUNTSMAN CANCER INSTITUTE 460009
JONSSON COMPREHENSIVE CANCER CENTER 050262
pg. 16 December 2017
MASONIC CANCER CENTER 240049
MAYO CLINIC CANCER CENTER 030103
MAYO CLINIC CANCER CENTER 100151
MAYO CLINIC CANCER CENTER 240010
MOORES COMPREHENSIVE CANCER CENTER 050025
NORRIS COTTON CANCER CENTER 300003
ROBERT H. LURIE COMPREHENSIVE CANCER CENTER 140281
RUTGERS CANCER INSTITUTE OF NEW JERSEY 310038
SIDNEY KIMMEL COMPREHENSIVE CANCER CENTER 210009
ST. JUDE CHILDREN'S RESEARCH HOSPITAL 443302
UAB COMPREHENSIVE CANCER CENTER 010033
UC DAVIS COMPREHENSIVE CANCER CENTER 050599
UCSF HELEN DILLER FAMILY COMPREHENSIVE CANCER CENTER 050454
UNC LINEBERGER COMPREHENSIVE CANCER CENTER 340061
UNIVERSITY OF CHICAGO COMPREHENSIVE CANCER CENTER 140088
UNIVERSITY OF COLORADO CANCER CENTER 060024
UNIVERSITY OF MICHIGAN COMPREHENSIVE CANCER CENTER 230046
UNIVERSITY OF NEW MEXICO CANCER RESEARCH & TREATMENT CENTER 320001
UNIVERSITY OF PITTSBURGH CANCER INSTITUTE 390055
UNIVERSITY OF WISCONSIN CARBONE CANCER CENTER 520098
VANDERBILT-INGRAM CANCER CENTER 440039
WAKE FOREST COMPREHENSIVE CANCER CENTER 340047
YALE CANCER CENTER 070022
3M® CRG Treatment Level The 3M® Core Grouping software was used to stratify patients from the various cancer types and care settings into specific clinical risk groups (CRGs) based on claims spanning the period of 3 months prior to the initiating chemotherapy claim to 3 months after the initiating chemotherapy claim. Note that there are important limitations inherent in the CRG methodology. We could stratify patients only on claims information available in the Medicare 100% sample; the methodology does not take into account important clinical information (such as cancer staging) that is not available in claims data. Additionally, we are missing information that may be available on physician claims, which are only available in the Medicare 5% sample.
While technically possible to identify episodes of care for patients receiving treatment in a physician office using the Medicare 5% sample, the resulting distribution of CRGs would not be directly comparable to populations from the Medicare 100% sample due to the presence of physician claims in the Medicare 5% sample episodes and the absence of such claims in the Medicare 100% sample episodes

pg. 17 December 2017
The adjusted prospective CRG was used in this analysis and was assigned based on claims found in the 100% Sample. Patients were included in the study if they were assigned to an actively treated CRG that corresponded to their cancer of diagnosis. The specific CRGs are listed in Table 5 below.
TABLE 5: UNDER ACTIVE TREATMENT ADJUSTED PROSPECTIVE CRGS
CANCER TYPE
ADJUSTED PROSPECTIVE
CRG
CRG TREATMENT
LEVEL DESCRIPTION
BREAST 86621
86622
86623
86624
1
2
3
4
BREAST MALIGNANCY – UNDER ACTIVE TREATMENT LEVEL – 1
BREAST MALIGNANCY – UNDER ACTIVE TREATMENT LEVEL – 2
BREAST MALIGNANCY – UNDER ACTIVE TREATMENT LEVEL – 3
BREAST MALIGNANCY – UNDER ACTIVE TREATMENT LEVEL – 4
COLON 86571
86572
86573
86574
1
2
3
4
COLON MALIGNANCY – UNDER ACTIVE TREATMENT LEVEL – 1
COLON MALIGNANCY – UNDER ACTIVE TREATMENT LEVEL – 2
COLON MALIGNANCY – UNDER ACTIVE TREATMENT LEVEL – 3
COLON MALIGNANCY – UNDER ACTIVE TREATMENT LEVEL – 4
LUNG 86471
86472
86473
86474
1
2
3
4
LUNG MALIGNANCY – UNDER ACTIVE TREATMENT LEVEL – 1
LUNG MALIGNANCY – UNDER ACTIVE TREATMENT LEVEL – 2
LUNG MALIGNANCY – UNDER ACTIVE TREATMENT LEVEL – 3
LUNG MALIGNANCY – UNDER ACTIVE TREATMENT LEVEL – 4
OVARIAN 86501
86502
86503
86504
1
2
3
4
OVARIAN MALIGNANCY – UNDER ACTIVE TREATMENT LEVEL – 1
OVARIAN MALIGNANCY – UNDER ACTIVE TREATMENT LEVEL – 2
OVARIAN MALIGNANCY – UNDER ACTIVE TREATMENT LEVEL – 3
OVARIAN MALIGNANCY – UNDER ACTIVE TREATMENT LEVEL – 4
PANCREATIC 86481
86482
86483
86484
1
2
3
4
PANCREATIC MALIGNANCY – UNDER ACTIVE TREATMENT LEVEL – 1
PANCREATIC MALIGNANCY – UNDER ACTIVE TREATMENT LEVEL – 2
PANCREATIC MALIGNANCY – UNDER ACTIVE TREATMENT LEVEL – 3
PANCREATIC MALIGNANCY – UNDER ACTIVE TREATMENT LEVEL – 4
PROSTATE 86631
86632
86633
86634
1
2
3
4
PROSTATE MALIGNANCY – UNDER ACTIVE TREATMENT LEVEL – 1
PROSTATE MALIGNANCY – UNDER ACTIVE TREATMENT LEVEL – 2
PROSTATE MALIGNANCY – UNDER ACTIVE TREATMENT LEVEL – 3
PROSTATE MALIGNANCY – UNDER ACTIVE TREATMENT LEVEL – 4
Table 6 below shows patient counts at various points in the patient screening process. The final study population is 46,272 patients.
TABLE 6: STUDY POPULATION WATERFALL ANALYSIS DATA SCREEN PATIENT COUNT
PATIENTS ACTIVELY TREATED WITH CHEMOTHERAPY INFUSIONS1 209,216
PATIENTS DIAGNOSED WITH A CANCER OF INTEREST2 112,434
PATIENTS PASSING ELIGIBILITY REQUIREMENTS3 74,199
PATIENTS WITH 50% OR MORE OF THEIR CHEMOTHERAPY TREATMENT OCCURRING IN A SITE OF CARE COHORT 74,156

pg. 18 December 2017
PATIENTS ASSIGNED TO AN ACTIVE TREATMENT 3M® CRG 46,272
1Patients reporting two chemotherapy infusion claims within 6 months of each other and a 12 month clean period of no chemotherapy prior to the initiating chemotherapy claim. 2Cancers of interest include breast, colon, lung, ovarian, pancreatic, and prostate cancer. 3ESRD patients were excluded from the analysis. Patients were also required to have continuous, Part A and B, non-HMO coverage beginning 12 months prior to the initiating chemotherapy claim through the date of death or 36 months (whichever comes first).
The baseline patient demographic characteristics were compared by Pearson chi-squared tests. Age at diagnosis was categorized by generating quartiles based on the distribution within the study cohort.
TABLE 7: BASELINE DEMOGRAPHICS OF THE STUDY POPULATION
PPS-EXEMPT TEACHING HOSPITAL
NCI OTHER HOSPITAL TOTAL
N % N % N % N % N % P1
TOTAL 4,133 100% 21,687 100% 3,806 100% 16,646 100% 46,272 100% -
CANCER TYPE
BREAST 904 22% 4,712 22% 752 20% 3,602 22% 9,970 22% <.0001
COLON 512 12% 2,707 12% 318 8% 2,342 14% 5,879 13%
LUNG 1,462 35% 8,555 39% 1,281 34% 7,241 44% 18,539 40%
OVARIAN 456 11% 2,611 12% 629 17% 1,260 8% 4,956 11%
PANCREATIC 665 16% 2,285 11% 659 17% 1,494 9% 5,103 11%
PROSTATE 134 3% 817 4% 167 4% 707 4% 1,825 4%
CRG TREATMENT LEVEL
1 443 11% 3,592 17% 659 17% 2,599 16% 7,293 16% <.0001
2 1,072 26% 5,932 27% 917 24% 4,738 28% 12,659 27%
3 1,883 46% 7,756 36% 1,502 39% 6,054 36% 17,195 37%
4 735 18% 4,407 20% 728 19% 3,255 20% 9,125 20%
GENDER
MALE 1,444 35% 8,012 37% 1,330 35% 6,690 40% 17,476 38% <.0001
FEMALE 2,689 65% 13,675 63% 2,476 65% 9,956 60% 28,796 62%
DUAL STATUS2
NO 3,592 87% 17,620 81% 3,252 85% 13,624 82% 38,088 82% <.0001
YES 541 13% 4,067 19% 554 15% 3,022 18% 8,184 18%
AGE AT DIAGNOSIS
<67 852 21% 5,348 25% 880 23% 3,914 24% 10,994 24% <.0001
67-71 1,131 27% 5,163 24% 986 26% 3,991 24% 11,271 24%
71-76 1,113 27% 5,402 25% 982 26% 4,147 25% 11,644 25%
76+ 1,037 25% 5,774 27% 958 25% 4,594 28% 12,363 27%
DIED 2,619 63% 14,327 66% 2,557 67% 11,363 68% 30,866 67% <.0001
1P-value from Chi-Squared test which tests if the proportion of patients from each care setting are different from each other. A value <0.05 is considered significant to disprove the null hypothesis; the null hypothesis is that the proportions are not different. 2Patients eligible for Medicaid benefits as well as Medicare Part A and Part B.

pg. 19 December 2017
2016 Nationwide Cost Development
Allowed amounts were repriced to the Medicare 2016 fee schedule and adjusted to a nationwide basis using the Milliman Medicare Repricer. Due to certain limitations with the repricer, other methods were used to remove the effect of wage index adjustments and trend dollars to 2016 for claims not adjusted by the repricer.
x Inpatient - The provider wage index was adjusted to account for labor share and removed from the allowed amount. In addition, capital amounts were adjusted separately using the capital geographic adjustment factor corresponding to the provider CBSA. Adjusted allowed amounts were then trended to 2016 using market basket updates published by CMS.
x Outpatient - The provider wage index was adjusted to account for the labor share and removed from the allowed amount. This amount was then trended to 2016 using market basket updates published by CMS. For claims where a provider wage index was not available, the rural CBSA wage index associated with the first two digits of the CCN was used.
x Home Health and Hospice - The urban CBSA wage index associated with the CCN was removed and allowed amount were trended to 2016 using market basket updates published by CMS. In the case that no urban CBSA wage index was found, the first two digits on the CCN were used to map to a rural CBSA wage index.
x Skilled Nursing Facility - The first two digits on the CCN were used to map to a rural CBSA wage index. The wage index was adjusted to account for the labor share and removed. Dollars were then trended to 2016 using market basket updates published by CMS.
x Physician - Nationwide amounts for the most prevalent HCPCS were found using the CMS physician fee schedule. For the remaining claims, the geographical adjustment factor (GAF) associated with the SSA county code of the patient's residence was removed from the allowed amount. Dollars were then trended to 2016 using the Medicare Economic Index.
x Durable Medical Equipment - Due to the complexity of nationwide DME costs, the only adjustment made to these claims was trending the original allowed amounts to 2016 using the Medicare Economic Index.
Development of Multivariate Cox Proportional Hazard Models
The primary outcome of this study was overall survival. Overall survival was defined as the time from the initial episode start date to date of death. Patients who were still alive at 36 months were censored. Cox proportional-hazard regression models were constructed to examine differences in mortality among provider types. Departures from the proportional hazards assumption were assessed based on examination of the Schoenfeld residuals.25 Multivariate cox proportional hazard models were constructed for all cancers (combined) and for each cancer site separately. For all cancers, covariates in the model included CRG treatment level, sex, dual flag status, age, and cancer site. For models for individual cancers, covariates in the models include CRG treatment level, sex (where applicable), dual flag status, and age. In all

pg. 20 December 2017
models, indicator variables were created for all categories of each covariate to allow for statistical adjustment. Statistical significance was set at two-sided P < 0.05. For visualization purposes, the adjusted effects of provider type on mortality were displayed using forest plots. Analyses were carried out using SAS® Version 9.4 (Cary, NC, USA).
Milliman is among the world’s largest providers of actuarial and related products and services. The firm has consulting practices in life insurance and financial services, property & casualty insurance, healthcare, and employee benefits. Founded in 1947, Milliman is an independent firm with offices in major cities around the globe.
milliman.com
CONTACT
Pamela Pelizzari [email protected]
Christine Ferro [email protected]
Bruce Pyenson [email protected]
Sean Pittinger [email protected]
David Rotter [email protected]

pg. 21 December 2017
References
1 Heron, M., & Anderson, R. N. (2016). Changes in the leading cause of death: recent patterns in heart disease and cancer mortality. Cancer, 400(500,000), 600-000. 2 Birkmeyer NJ, Goodney PP, Stukel TA, et al. Do cancer centers designated by the National Cancer Institute have better surgical outcomes? Cancer. 2005; 103(3):435-441.
3 Ayanian JZ, Weissman JS. Teaching Hospitals and Quality of Care: A Review of the
Literature. The Milbank Quarterly. 2002;80(3):569-593. doi:10.1111/1468-0009.00023.
4 3M™ Clinical Risk Grouping (CRG) Classification System Methodology Overview. 3M Health Care Academy, n.d. Web. Software version 2.0. 35-36.
5 Siegel, R. L., Miller, K. D. and Jemal, A. (2016), Cancer statistics, 2016. CA: A Cancer Journal for Clinicians, 66: 7–30. doi:10.3322/caac.21332
6 Stoto MA. Population Health Measurement: Applying Performance Measurement
Concepts in Population Health Settings. eGEMs. 2014;2(4):1132. doi:10.13063/2327-9214.1132.
7 Cancer Treatment Centers of America. (2015) 2015 National Cancer Experience: A Study of Patients and Caregivers [Press Release]. Retrieved from http://www.cancercenter.com/press- center/press-releases/ctca/2015/09/National- Cancer-Experience Survey/~/media/ 9C20BACEB7FA4CD5BDAF7CDE492464E8.ashx
8 Bruce E. Hillner, Thomas J. Smith, and Christopher E. Desch. Hospital and Physician
Volume or Specialization and Outcomes in Cancer Treatment: Importance in Quality of Cancer Care. Journal of Clinical Oncology 2000 18:11, 2327-2340
9 Sharma, A., Schwartz, S. M. and Méndez, E. (2013), Hospital volume is associated with survival but not multimodality therapy in Medicare patients with advanced head and neck cancer. Cancer, 119: 1845–1852. doi:10.1002/cncr.27976
10 Impact of facility volume on therapy and survival for locally advanced cervical cancer. (2013, December 12). Retrieved November 06, 2017, from http://www.sciencedirect.com/science/article/pii/S0090825813013772 11 Go, R. S., Al-Hamadani, M., Shah, N. D., et al (2016), Influence of the treatment facility volume on the survival of patients with non-Hodgkin lymphoma. Cancer, 122: 2552– 2559. doi:10.1002/cncr.30038
12 PPS_Exc_Cancer_Hosp.asp. (2016, February 04). Retrieved November 06, 2017, from https://www.cms.gov/Medicare/Medicare-Fee-for-Service-Payment/AcuteInpatientPPS/ PPS_Exc_Cancer_Hospasp.html 13 See the Balanced Budget Act of 1997, Pub. L. No. 105-33, § 4418, 111 Stat. 251, 408
and the Consolidated Appropriations Act, 2001, Pub. L. No. 106-554, § 1(a) (4) [App. D, div. B, tit. 1, § 152(a)], 114 Stat. 2763, 2763A-251 (both provisions codified as amended at 42 U.S.C. § 1395ww (d)(1)(B)(v)).

pg. 22 December 2017
14 NCI Dictionary of Cancer Terms. (n.d.). Retrieved November 06, 2017, from https://www.cancer.gov/publications/dictionaries/cancer-terms?cdrid=523437 15 Pfister DG, Rubin DM, Elkin EB, et al. Risk Adjusting Survival Outcomes in Hospitals That Treat Patients With Cancer Without Information on Cancer Stage. JAMA Oncol. 2015; 1(9):1303–1310. doi:10.1001/jamaoncol.2015.3151 16 An Outcome Prediction Model for Patients with Clear Cell Renal Cell Carcinoma Treated with Radical Nephrectomy Based on Tumor Stage, Size, Grade and Necrosis: The Sign
Score FRANK, IGOR et al. The Journal of Urology, Volume 168, Issue 6, 2395 – 2400
17 Gene expression correlates of clinical prostate cancer behavior Singh, Dinesh et al. Cancer Cell , Volume 1 , Issue 2 , 203 – 209
18 Solid Renal Tumors: An Analysis of Pathological Features Related to Tumor Size FRANK, IGOR et al. The Journal of Urology, Volume 170, Issue 6, 2217 – 2220 https://doi.org/10.1097/01.ju.0000095475.12515.5e
19 S. Loi, S. Michiels, R. Salgado, et al; Tumor infiltrating lymphocytes are prognostic in triple negative breast cancer and predictive for trastuzumab benefit in early breast cancer: results from the FinHER trial, Annals of Oncology, Volume 25, Issue 8, 1 August 2014, Pages 1544–1550, https://doi.org/10.1093/annonc/mdu112
20 Prudence A. Francis, M.D., Meredith M. Regan, et al. Ph.D., for the SOFT Investigators and the International Breast Cancer Study Group* N Engl J Med 2015; 372:436-446 January 29, 2015 DOI: 10.1056/NEJMoa1412379
21 "Which Is the Best Method for Measuring Improvements in Cancer Care? Mortality Rates versus Survival Rates." Peterson-Kaiser Health System Tracker. N.P., n.d. Web. 03 Nov. 2017. doi:https://www.healthsystemtracker.org/brief/which-is-the-best-method-for- measuring-improvements-in-cancer-care-mortality-rates-versus-survival-rates/#item-start
22 Cancer Center List - OCCWebApp 2.1.0. Cancercenterscancergov. 2016. Available at: https://cancercenters.cancer.gov/Center/CCList. Accessed June 24, 2016 23 Historical Impact Files for FY 1994 through Present. (2012, August 01). Retrieved November 06, 2017, from https://www.cms.gov/Medicare/Medicare-Fee-for-Service- Payment/AcuteInpatientPPS/Historical-Impact-Files-for-FY-1994-through-Present.html
24 FY-2014-IPPS-Final-Rule-CMS-1599-F-Data-Files. (2014, January 28). Retrieved November 06, 2017, from https://www.cms.gov/Medicare/Medicare-Fee-for-Service- Payment/AcuteinpatientPPS/ FY-2014-IPPS-Final-Rule-Home-Page-Items/FY-2014- IPPS-Final-Rule-CMS-1599-F-Data-Files.html
25 Grambsch, P. M., & Therneau, T. M. (1995). Amendments and Corrections: Proportional Hazards Tests and Diagnostics Based on Weighted Residuals. Biometrika, 82(3), 668. doi:10.2307/2337547


