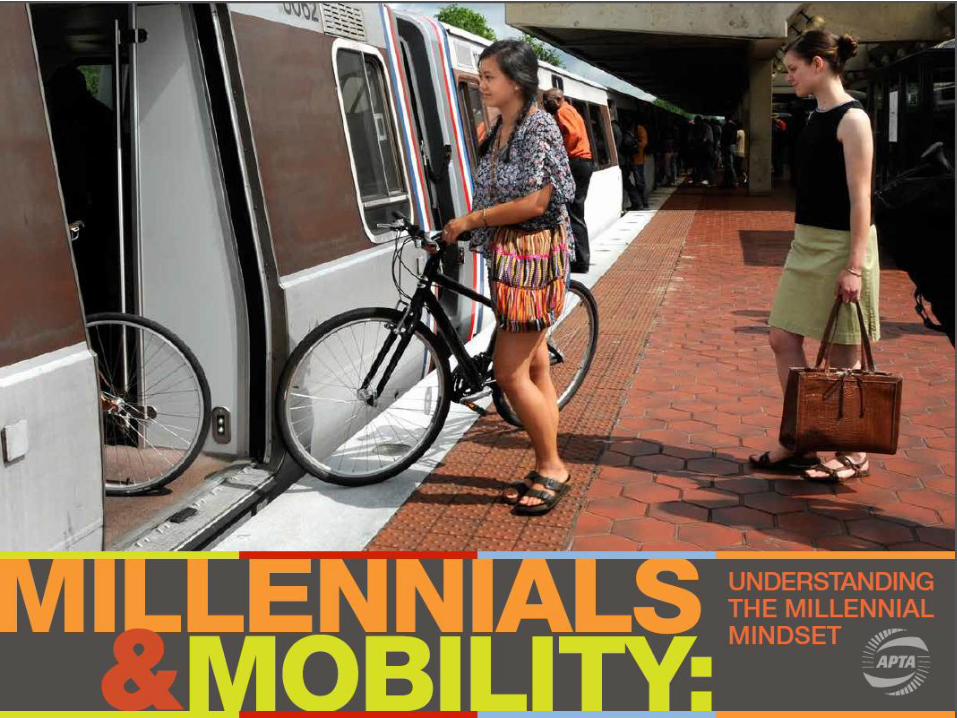
Millennials & Mobility: Understanding the Millennial … · Key Findings (continued) 4 Public...
47
1
Transcript of Millennials & Mobility: Understanding the Millennial … · Key Findings (continued) 4 Public...
1
Executive Summary
2
The Millennial Generation, those born between 1982 and 2003, is the largest
and most diverse generation in American history. According to Millennial
Makeover, a seminal volume on generational change, 40% of Millennials are African American, Latino, Asian or racially-mixed compared to only 25% of the
next two older generations. Millennials are also living through times of economic dislocation and
technological change. History shows that the combination of technological
change, such as the advent of smartphone technology, television, or radio; combined with macro forces that shape behaviors, such as the Great Recession,
the Great Depression, or World War II can lead to societal change that can last generations.
It is in this context that Millennials, with their relative propensity for urban lifestyle
components (whether they live in cities or in suburbs), dexterity with technology, while starting careers during economically constrained times can leave a lasting
impact on society. In fact, they are already driving trends.
Executive Summary (continued)
3
As has been noted in a number of reports, including US PIRG’s report, “A New
Direction: Our Changing Relationship With Driving and the Implications for
America’s Future”, rates of driving is down in the US, and Millennials are leading the trend. This APTA/TCRP report seeks to further understand the mindsets
behind the trends and understand their implications for public transportation in the United States. This study utilizes a mixture of in-depth interviews in five cities and a survey of 1,000 people in six cities that are representative of the types of
cities Millennials find attractive.
Key Findings
Millennials are multimodal, they choose the best transportation mode
(driving, transit, bike, or walk) based on the trip they are planning to take.
Communities that attract Millennials have a multitude of transportation
choices, as proven by Millennial hotspots, popular zip codes where
residents have self-selected into a multi-modal lifestyle.
Key Findings (continued)
4
Public transportation options are considered the best for digital socializing and
among the most likely to connect the user with their communities. Transit also
allows Millennials to work as they travel, a trend noted by 40% of those polled.
These benefits of public transit need to be fully leveraged by the industry, as they
provide a clear competitive advantage.
Reasons and motivations for transportation choices are pragmatic, with
46% stating that a need to save money drives their choices; 46% also note
convenience, 44% want exercise, and 35% say they live in a community
where it just makes more sense to use transit.
Millennials would like to see in the next ten years: 1) 61% more reliable systems, 2) 55% real-time updates, 3) 55% Wi-Fi or 3G/4G wherever they go, 4) 44% a more user-friendly and intuitive travel experience. Fully leveraging technology, through real-time transit applications that connect users with community amenities, through smartphone fare payment, and the provision of WiFi and 3G/4G, will allow transit users to be more spontaneous, thus addressing the key competitive advantage of the car.

5
STUDY
OVERVIEW
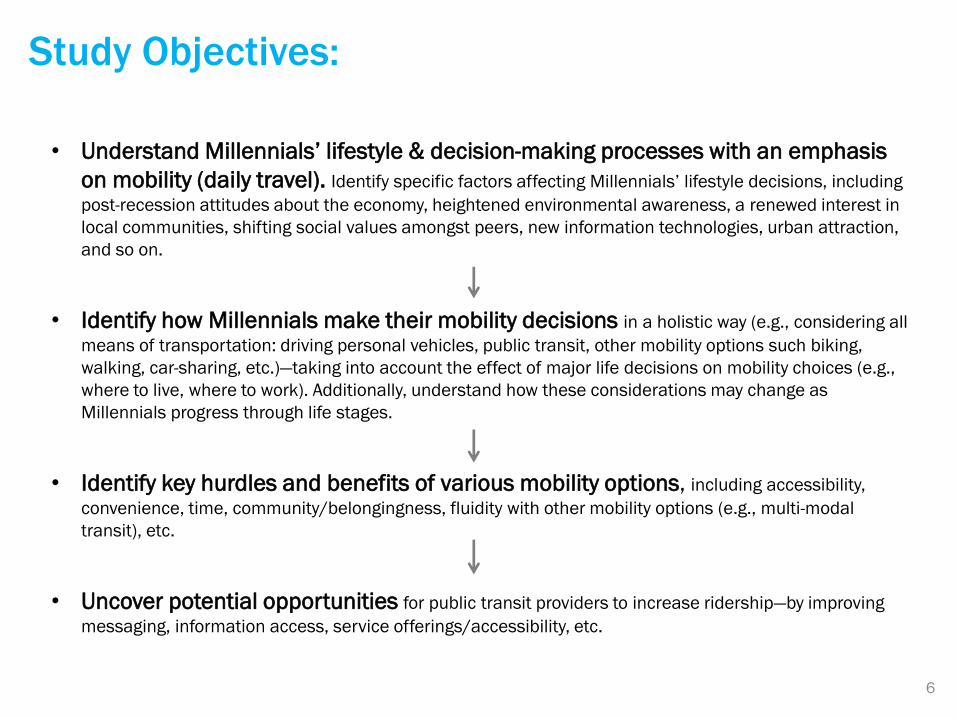
• Understand Millennials’ lifestyle & decision-making processes with an emphasis
on mobility (daily travel). Identify specific factors affecting Millennials’ lifestyle decisions, including
post-recession attitudes about the economy, heightened environmental awareness, a renewed interest in
local communities, shifting social values amongst peers, new information technologies, urban attraction,
and so on.
• Identify how Millennials make their mobility decisions in a holistic way (e.g., considering all
means of transportation: driving personal vehicles, public transit, other mobility options such biking,
walking, car-sharing, etc.)—taking into account the effect of major life decisions on mobility choices (e.g.,
where to live, where to work). Additionally, understand how these considerations may change as
Millennials progress through life stages.
• Identify key hurdles and benefits of various mobility options, including accessibility,
convenience, time, community/belongingness, fluidity with other mobility options (e.g., multi-modal
transit), etc.
• Uncover potential opportunities for public transit providers to increase ridership—by improving
messaging, information access, service offerings/accessibility, etc.
6
Study Objectives:
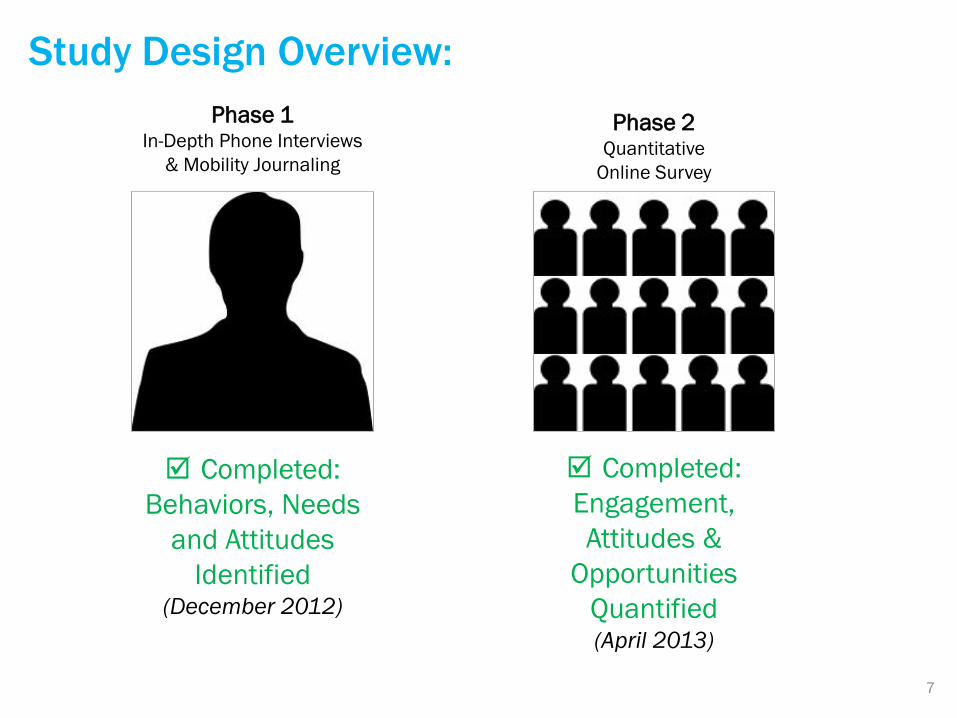
Phase 1 In-Depth Phone Interviews
& Mobility Journaling
Phase 2 Quantitative
Online Survey
Completed:
Behaviors, Needs
and Attitudes
Identified (December 2012)
Completed:
Engagement,
Attitudes &
Opportunities
Quantified (April 2013)
Study Design Overview:
7
?
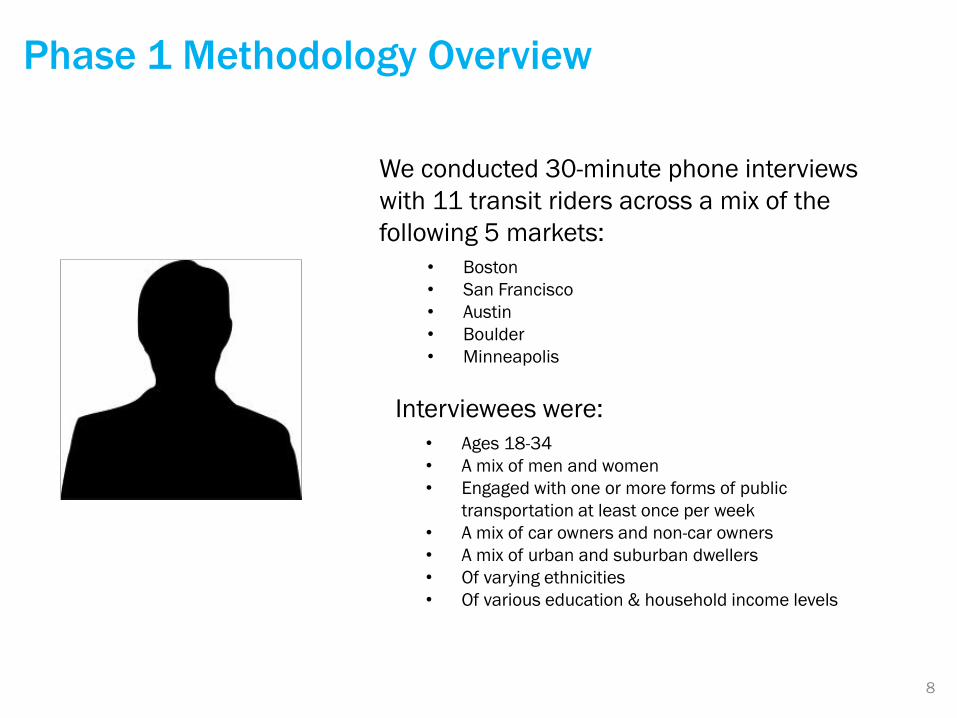
We conducted 30-minute phone interviews
with 11 transit riders across a mix of the
following 5 markets:
• Boston
• San Francisco
• Austin
• Boulder
• Minneapolis
Interviewees were:
• Ages 18-34
• A mix of men and women
• Engaged with one or more forms of public
transportation at least once per week
• A mix of car owners and non-car owners
• A mix of urban and suburban dwellers
• Of varying ethnicities
• Of various education & household income levels
8
Phase 1 Methodology Overview
9
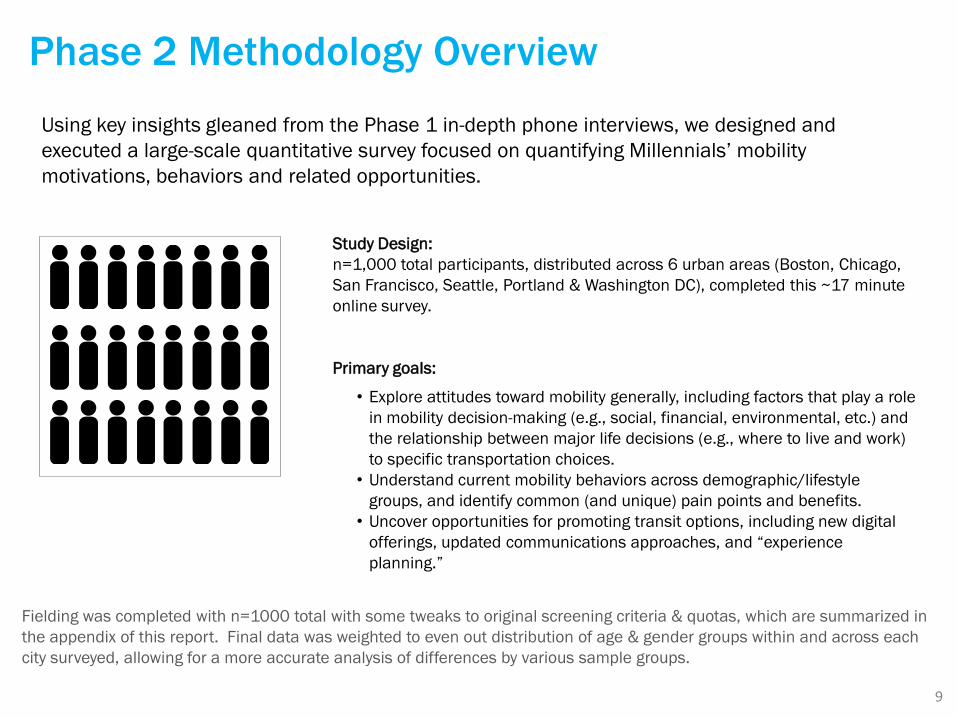
Study Design:
n=1,000 total participants, distributed across 6 urban areas (Boston, Chicago,
San Francisco, Seattle, Portland & Washington DC), completed this ~17 minute
online survey.
Primary goals:
• Explore attitudes toward mobility generally, including factors that play a role
in mobility decision-making (e.g., social, financial, environmental, etc.) and
the relationship between major life decisions (e.g., where to live and work)
to specific transportation choices.
• Understand current mobility behaviors across demographic/lifestyle
groups, and identify common (and unique) pain points and benefits.
• Uncover opportunities for promoting transit options, including new digital
offerings, updated communications approaches, and “experience
planning.”
Using key insights gleaned from the Phase 1 in-depth phone interviews, we designed and
executed a large-scale quantitative survey focused on quantifying Millennials’ mobility
motivations, behaviors and related opportunities.
Fielding was completed with n=1000 total with some tweaks to original screening criteria & quotas, which are summarized in
the appendix of this report. Final data was weighted to even out distribution of age & gender groups within and across each
city surveyed, allowing for a more accurate analysis of differences by various sample groups.
Phase 2 Methodology Overview
Context for this document:
This study, sampling & report was designed to:
Speak with Millennials living within or just outside of urban centers who are
using public transit & other transportation options,
Understand Millennial mindsets around their living & transportation choices –
and look at self-reported behaviors, observed trends & changes from their
perspective or thinking,
Provide a summary of observations from collected data & suggest potential
opportunity areas for public transit to meet emerging needs, fill gaps in present
offerings, or inform future strategies for better serving or “speaking” with this
group.
10
11
Mobility Option
Awareness, Engagement,
Motivations, Barriers
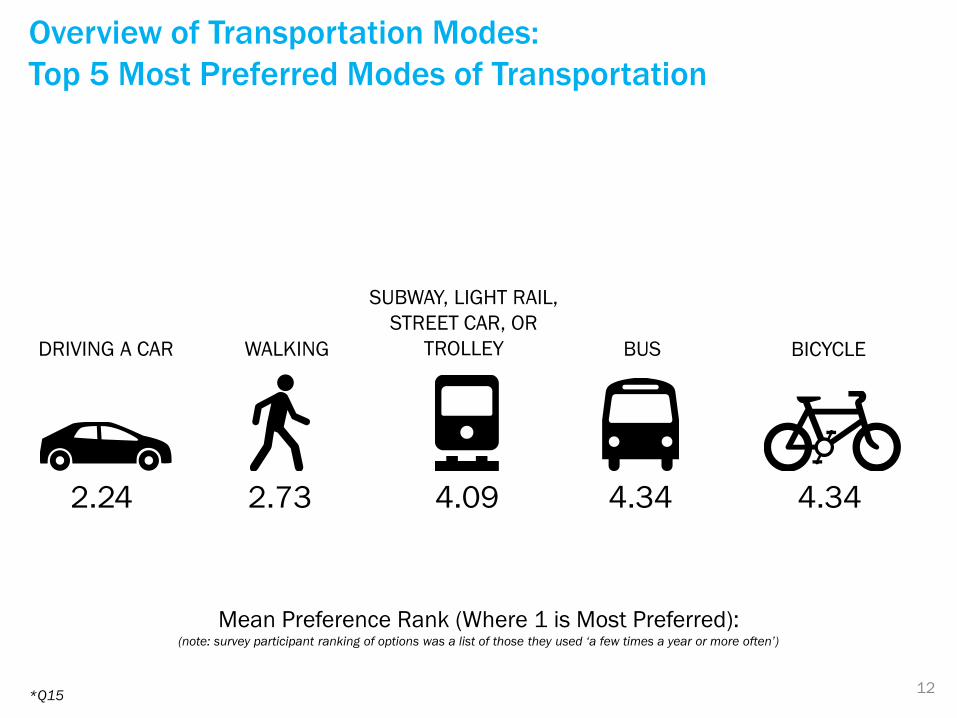
Overview of Transportation Modes:
Top 5 Most Preferred Modes of Transportation
12
2.24 2.73 4.09 4.34 4.34
DRIVING A CAR WALKING
SUBWAY, LIGHT RAIL,
STREET CAR, OR
TROLLEY BUS BICYCLE
*Q15
Mean Preference Rank (Where 1 is Most Preferred): (note: survey participant ranking of options was a list of those they used ‘a few times a year or more often’)
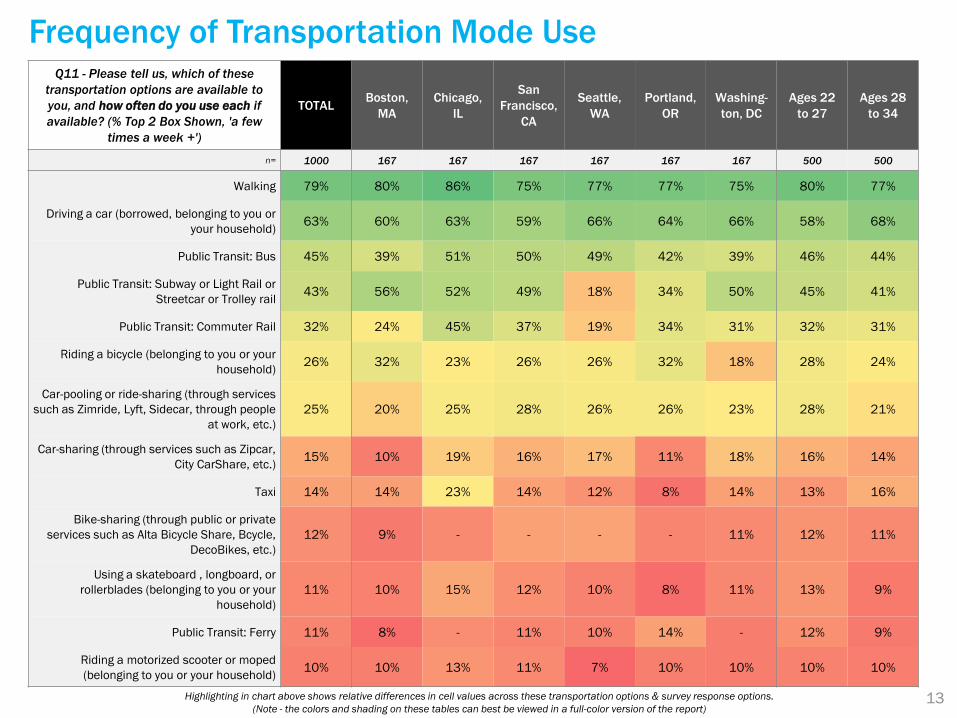
Frequency of Transportation Mode Use Q11 - Please tell us, which of these
transportation options are available to
you, and how often do you use each if
available? (% Top 2 Box Shown, 'a few
times a week +')
TOTAL Boston,
MA
Chicago,
IL
San
Francisco,
CA
Seattle,
WA
Portland,
OR
Washing-
ton, DC
Ages 22
to 27
Ages 28
to 34
n= 1000 167 167 167 167 167 167 500 500
Walking 79% 80% 86% 75% 77% 77% 75% 80% 77%
Driving a car (borrowed, belonging to you or
your household) 63% 60% 63% 59% 66% 64% 66% 58% 68%
Public Transit: Bus 45% 39% 51% 50% 49% 42% 39% 46% 44%
Public Transit: Subway or Light Rail or
Streetcar or Trolley rail 43% 56% 52% 49% 18% 34% 50% 45% 41%
Public Transit: Commuter Rail 32% 24% 45% 37% 19% 34% 31% 32% 31%
Riding a bicycle (belonging to you or your
household) 26% 32% 23% 26% 26% 32% 18% 28% 24%
Car-pooling or ride-sharing (through services
such as Zimride, Lyft, Sidecar, through people
at work, etc.)
25% 20% 25% 28% 26% 26% 23% 28% 21%
Car-sharing (through services such as Zipcar,
City CarShare, etc.) 15% 10% 19% 16% 17% 11% 18% 16% 14%
Taxi 14% 14% 23% 14% 12% 8% 14% 13% 16%
Bike-sharing (through public or private
services such as Alta Bicycle Share, Bcycle,
DecoBikes, etc.)
12% 9% - - - - 11% 12% 11%
Using a skateboard , longboard, or
rollerblades (belonging to you or your
household)
11% 10% 15% 12% 10% 8% 11% 13% 9%
Public Transit: Ferry 11% 8% - 11% 10% 14% - 12% 9%
Riding a motorized scooter or moped
(belonging to you or your household) 10% 10% 13% 11% 7% 10% 10% 10% 10%
13 Highlighting in chart above shows relative differences in cell values across these transportation options & survey response options.
(Note - the colors and shading on these tables can best be viewed in a full-color version of the report)
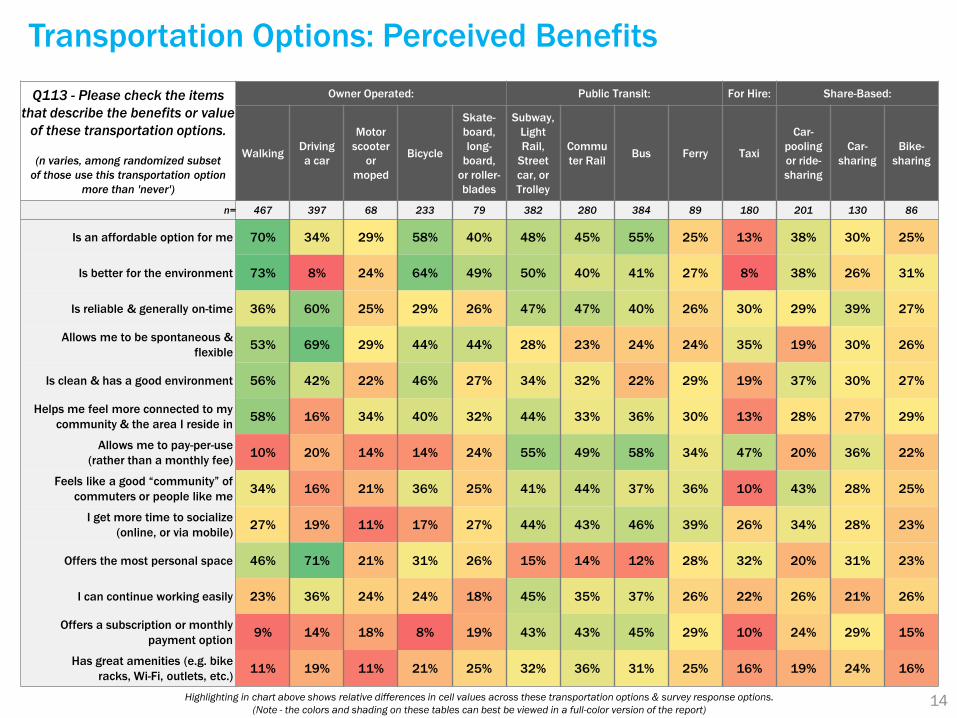
Transportation Options: Perceived Benefits
14 Highlighting in chart above shows relative differences in cell values across these transportation options & survey response options.
(Note - the colors and shading on these tables can best be viewed in a full-color version of the report)
Q113 - Please check the items
that describe the benefits or value
of these transportation options.
(n varies, among randomized subset
of those use this transportation option
more than 'never')
Owner Operated: Public Transit: For Hire: Share-Based:
Walking Driving
a car
Motor
scooter
or
moped
Bicycle
Skate-
board,
long-
board,
or roller-
blades
Subway,
Light
Rail,
Street
car, or
Trolley
Commu
ter Rail Bus Ferry Taxi
Car-
pooling
or ride-
sharing
Car-
sharing
Bike-
sharing
n= 467 397 68 233 79 382 280 384 89 180 201 130 86
Is an affordable option for me 70% 34% 29% 58% 40% 48% 45% 55% 25% 13% 38% 30% 25%
Is better for the environment 73% 8% 24% 64% 49% 50% 40% 41% 27% 8% 38% 26% 31%
Is reliable & generally on-time 36% 60% 25% 29% 26% 47% 47% 40% 26% 30% 29% 39% 27%
Allows me to be spontaneous &
flexible 53% 69% 29% 44% 44% 28% 23% 24% 24% 35% 19% 30% 26%
Is clean & has a good environment 56% 42% 22% 46% 27% 34% 32% 22% 29% 19% 37% 30% 27%
Helps me feel more connected to my
community & the area I reside in 58% 16% 34% 40% 32% 44% 33% 36% 30% 13% 28% 27% 29%
Allows me to pay-per-use
(rather than a monthly fee) 10% 20% 14% 14% 24% 55% 49% 58% 34% 47% 20% 36% 22%
Feels like a good “community” of
commuters or people like me 34% 16% 21% 36% 25% 41% 44% 37% 36% 10% 43% 28% 25%
I get more time to socialize
(online, or via mobile) 27% 19% 11% 17% 27% 44% 43% 46% 39% 26% 34% 28% 23%
Offers the most personal space 46% 71% 21% 31% 26% 15% 14% 12% 28% 32% 20% 31% 23%
I can continue working easily 23% 36% 24% 24% 18% 45% 35% 37% 26% 22% 26% 21% 26%
Offers a subscription or monthly
payment option 9% 14% 18% 8% 19% 43% 43% 45% 29% 10% 24% 29% 15%
Has great amenities (e.g. bike
racks, Wi-Fi, outlets, etc.) 11% 19% 11% 21% 25% 32% 36% 31% 25% 16% 19% 24% 16%
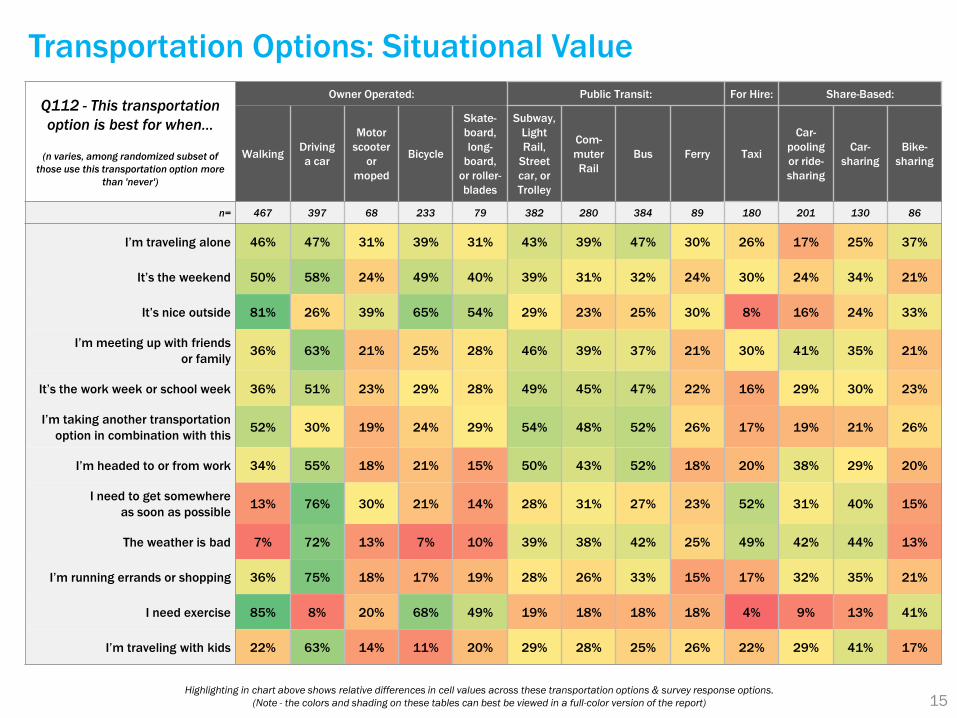
Transportation Options: Situational Value
15 Highlighting in chart above shows relative differences in cell values across these transportation options & survey response options.
(Note - the colors and shading on these tables can best be viewed in a full-color version of the report)
Q112 - This transportation
option is best for when…
(n varies, among randomized subset of
those use this transportation option more
than 'never')
Owner Operated: Public Transit: For Hire: Share-Based:
Walking Driving
a car
Motor
scooter
or
moped
Bicycle
Skate-
board,
long-
board,
or roller-
blades
Subway,
Light
Rail,
Street
car, or
Trolley
Com-
muter
Rail
Bus Ferry Taxi
Car-
pooling
or ride-
sharing
Car-
sharing
Bike-
sharing
n= 467 397 68 233 79 382 280 384 89 180 201 130 86
I’m traveling alone 46% 47% 31% 39% 31% 43% 39% 47% 30% 26% 17% 25% 37%
It’s the weekend 50% 58% 24% 49% 40% 39% 31% 32% 24% 30% 24% 34% 21%
It’s nice outside 81% 26% 39% 65% 54% 29% 23% 25% 30% 8% 16% 24% 33%
I’m meeting up with friends
or family 36% 63% 21% 25% 28% 46% 39% 37% 21% 30% 41% 35% 21%
It’s the work week or school week 36% 51% 23% 29% 28% 49% 45% 47% 22% 16% 29% 30% 23%
I’m taking another transportation
option in combination with this 52% 30% 19% 24% 29% 54% 48% 52% 26% 17% 19% 21% 26%
I’m headed to or from work 34% 55% 18% 21% 15% 50% 43% 52% 18% 20% 38% 29% 20%
I need to get somewhere
as soon as possible 13% 76% 30% 21% 14% 28% 31% 27% 23% 52% 31% 40% 15%
The weather is bad 7% 72% 13% 7% 10% 39% 38% 42% 25% 49% 42% 44% 13%
I’m running errands or shopping 36% 75% 18% 17% 19% 28% 26% 33% 15% 17% 32% 35% 21%
I need exercise 85% 8% 20% 68% 49% 19% 18% 18% 18% 4% 9% 13% 41%
I’m traveling with kids 22% 63% 14% 11% 20% 29% 28% 25% 26% 22% 29% 41% 17%
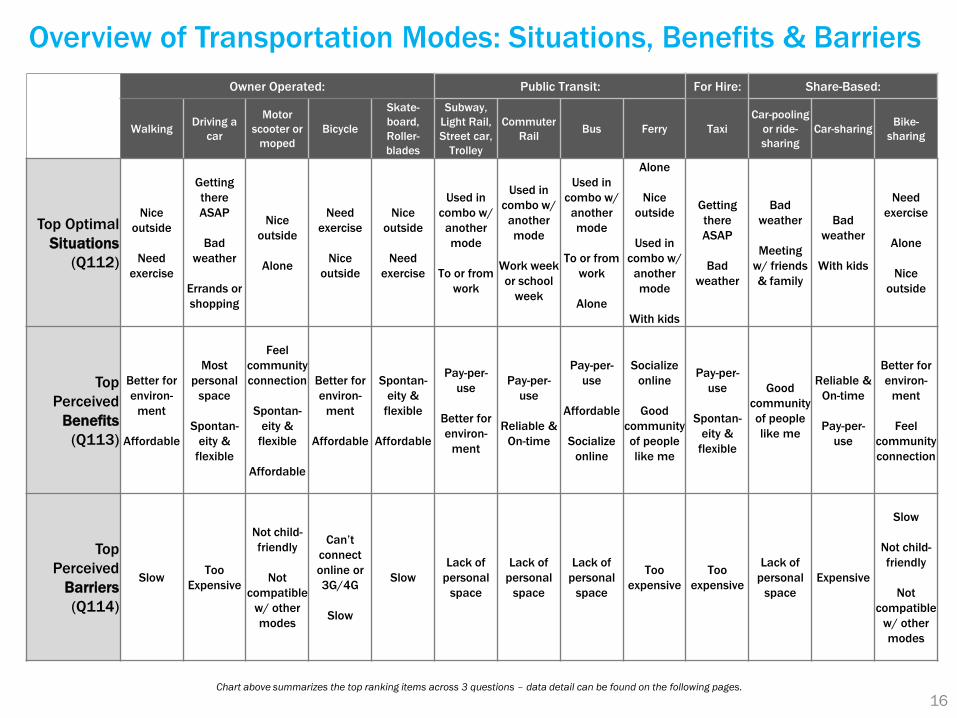
Overview of Transportation Modes: Situations, Benefits & Barriers
16 Chart above summarizes the top ranking items across 3 questions – data detail can be found on the following pages.
Owner Operated: Public Transit: For Hire: Share-Based:
Walking Driving a
car
Motor
scooter or
moped
Bicycle
Skate-
board,
Roller-
blades
Subway,
Light Rail,
Street car,
Trolley
Commuter
Rail Bus Ferry Taxi
Car-pooling
or ride-
sharing
Car-sharing Bike-
sharing
Top Optimal
Situations
(Q112)
Nice
outside
Need
exercise
Getting
there
ASAP
Bad
weather
Errands or
shopping
Nice
outside
Alone
Need
exercise
Nice
outside
Nice
outside
Need
exercise
Used in
combo w/
another
mode
To or from
work
Used in
combo w/
another
mode
Work week
or school
week
Used in
combo w/
another
mode
To or from
work
Alone
Alone
Nice
outside
Used in
combo w/
another
mode
With kids
Getting
there
ASAP
Bad
weather
Bad
weather
Meeting
w/ friends
& family
Bad
weather
With kids
Need
exercise
Alone
Nice
outside
Top
Perceived
Benefits
(Q113)
Better for
environ-
ment
Affordable
Most
personal
space
Spontan-
eity &
flexible
Feel
community
connection
Spontan-
eity &
flexible
Affordable
Better for
environ-
ment
Affordable
Spontan-
eity &
flexible
Affordable
Pay-per-
use
Better for
environ-
ment
Pay-per-
use
Reliable &
On-time
Pay-per-
use
Affordable
Socialize
online
Socialize
online
Good
community
of people
like me
Pay-per-
use
Spontan-
eity &
flexible
Good
community
of people
like me
Reliable &
On-time
Pay-per-
use
Better for
environ-
ment
Feel
community
connection
Top
Perceived
Barriers
(Q114)
Slow Too
Expensive
Not child-
friendly
Not
compatible
w/ other
modes
Can’t
connect
online or
3G/4G
Slow
Slow
Lack of
personal
space
Lack of
personal
space
Lack of
personal
space
Too
expensive
Too
expensive
Lack of
personal
space
Expensive
Slow
Not child-
friendly
Not
compatible
w/ other
modes
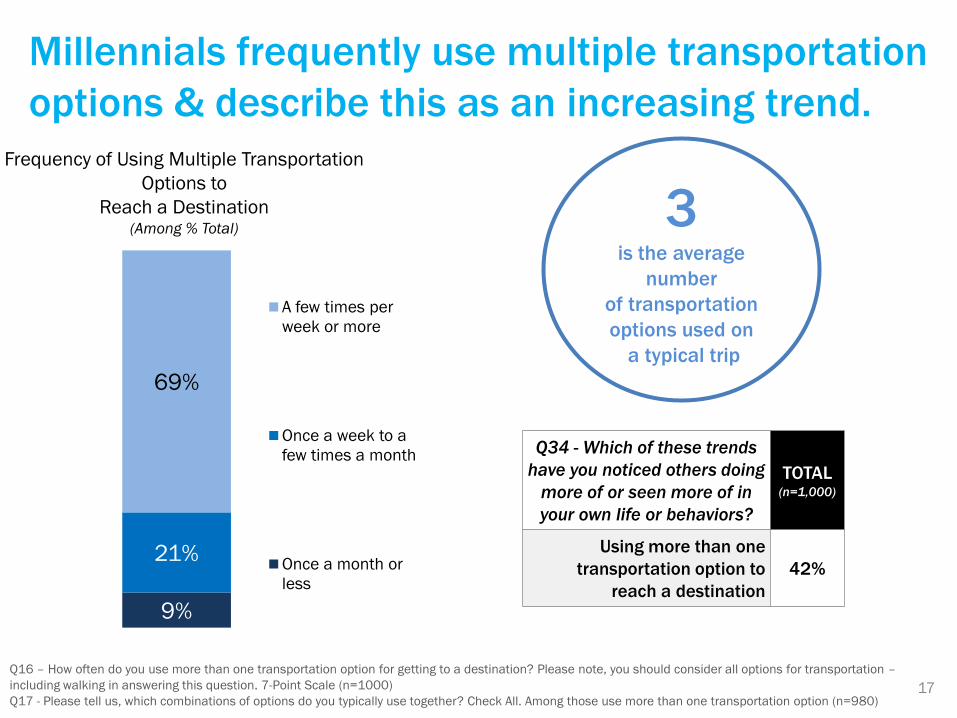
Millennials frequently use multiple transportation
options & describe this as an increasing trend.
9%
21%
69%
A few times per
week or more
Once a week to a
few times a month
Once a month or
less
17
Frequency of Using Multiple Transportation
Options to
Reach a Destination (Among % Total)
Q16 – How often do you use more than one transportation option for getting to a destination? Please note, you should consider all options for transportation –
including walking in answering this question. 7-Point Scale (n=1000)
Q17 - Please tell us, which combinations of options do you typically use together? Check All. Among those use more than one transportation option (n=980)
3 is the average
number
of transportation
options used on
a typical trip
Q34 - Which of these trends
have you noticed others doing
more of or seen more of in
your own life or behaviors?
TOTAL (n=1,000)
Using more than one
transportation option to
reach a destination
42%
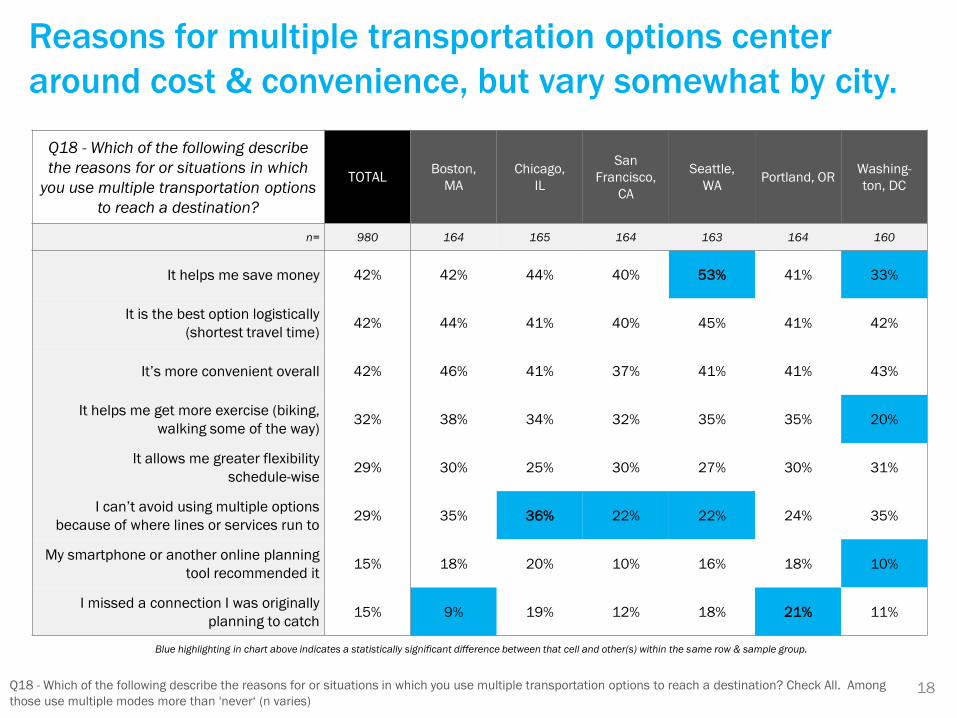
Reasons for multiple transportation options center
around cost & convenience, but vary somewhat by city.
Q18 - Which of the following describe
the reasons for or situations in which
you use multiple transportation options
to reach a destination?
TOTAL Boston,
MA
Chicago,
IL
San
Francisco,
CA
Seattle,
WA Portland, OR
Washing-
ton, DC
n= 980 164 165 164 163 164 160
It helps me save money 42% 42% 44% 40% 53% 41% 33%
It is the best option logistically
(shortest travel time) 42% 44% 41% 40% 45% 41% 42%
It’s more convenient overall 42% 46% 41% 37% 41% 41% 43%
It helps me get more exercise (biking,
walking some of the way) 32% 38% 34% 32% 35% 35% 20%
It allows me greater flexibility
schedule-wise 29% 30% 25% 30% 27% 30% 31%
I can’t avoid using multiple options
because of where lines or services run to 29% 35% 36% 22% 22% 24% 35%
My smartphone or another online planning
tool recommended it 15% 18% 20% 10% 16% 18% 10%
I missed a connection I was originally
planning to catch 15% 9% 19% 12% 18% 21% 11%
18 Q18 - Which of the following describe the reasons for or situations in which you use multiple transportation options to reach a destination? Check All. Among
those use multiple modes more than 'never‘ (n varies)
Blue highlighting in chart above indicates a statistically significant difference between that cell and other(s) within the same row & sample group.
19
Lifestyle Factors
& Choices that
Impact Mobility
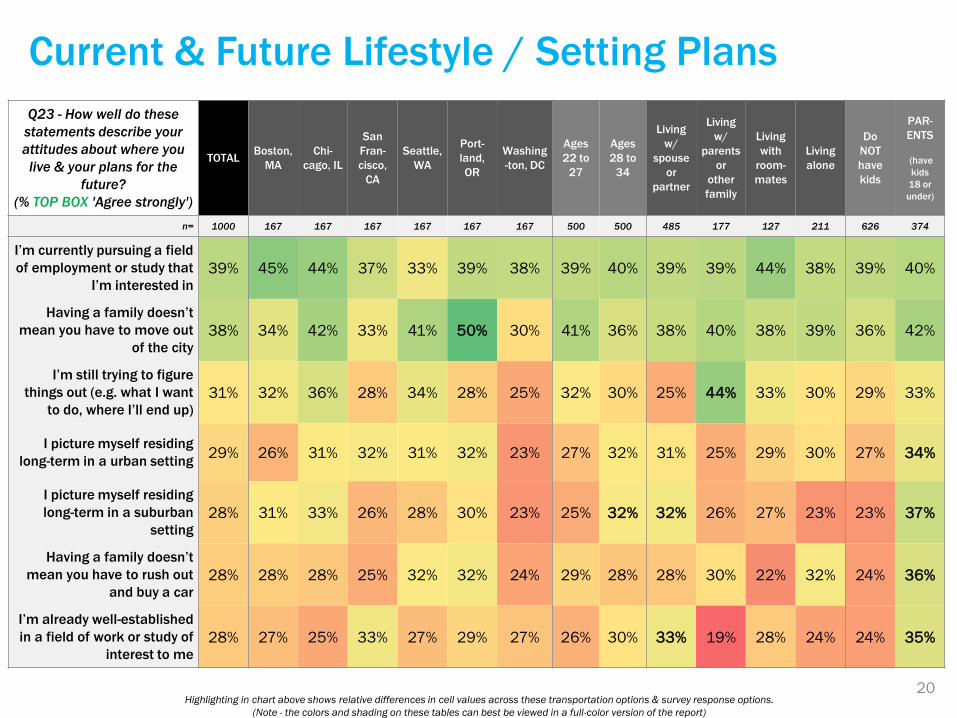
Current & Future Lifestyle / Setting Plans
Q23 - How well do these
statements describe your
attitudes about where you
live & your plans for the
future?
(% TOP BOX 'Agree strongly')
TOTAL Boston,
MA
Chi-
cago, IL
San
Fran-
cisco,
CA
Seattle,
WA
Port-
land,
OR
Washing
-ton, DC
Ages
22 to
27
Ages
28 to
34
Living
w/
spouse
or
partner
Living
w/
parents
or
other
family
Living
with
room-
mates
Living
alone
Do
NOT
have
kids
PAR-
ENTS
(have
kids
18 or
under)
n= 1000 167 167 167 167 167 167 500 500 485 177 127 211 626 374
I’m currently pursuing a field
of employment or study that
I’m interested in
39% 45% 44% 37% 33% 39% 38% 39% 40% 39% 39% 44% 38% 39% 40%
Having a family doesn’t
mean you have to move out
of the city
38% 34% 42% 33% 41% 50% 30% 41% 36% 38% 40% 38% 39% 36% 42%
I’m still trying to figure
things out (e.g. what I want
to do, where I’ll end up)
31% 32% 36% 28% 34% 28% 25% 32% 30% 25% 44% 33% 30% 29% 33%
I picture myself residing
long-term in a urban setting 29% 26% 31% 32% 31% 32% 23% 27% 32% 31% 25% 29% 30% 27% 34%
I picture myself residing
long-term in a suburban
setting
28% 31% 33% 26% 28% 30% 23% 25% 32% 32% 26% 27% 23% 23% 37%
Having a family doesn’t
mean you have to rush out
and buy a car
28% 28% 28% 25% 32% 32% 24% 29% 28% 28% 30% 22% 32% 24% 36%
I’m already well-established
in a field of work or study of
interest to me
28% 27% 25% 33% 27% 29% 27% 26% 30% 33% 19% 28% 24% 24% 35%
20 Highlighting in chart above shows relative differences in cell values across these transportation options & survey response options.
(Note - the colors and shading on these tables can best be viewed in a full-color version of the report)
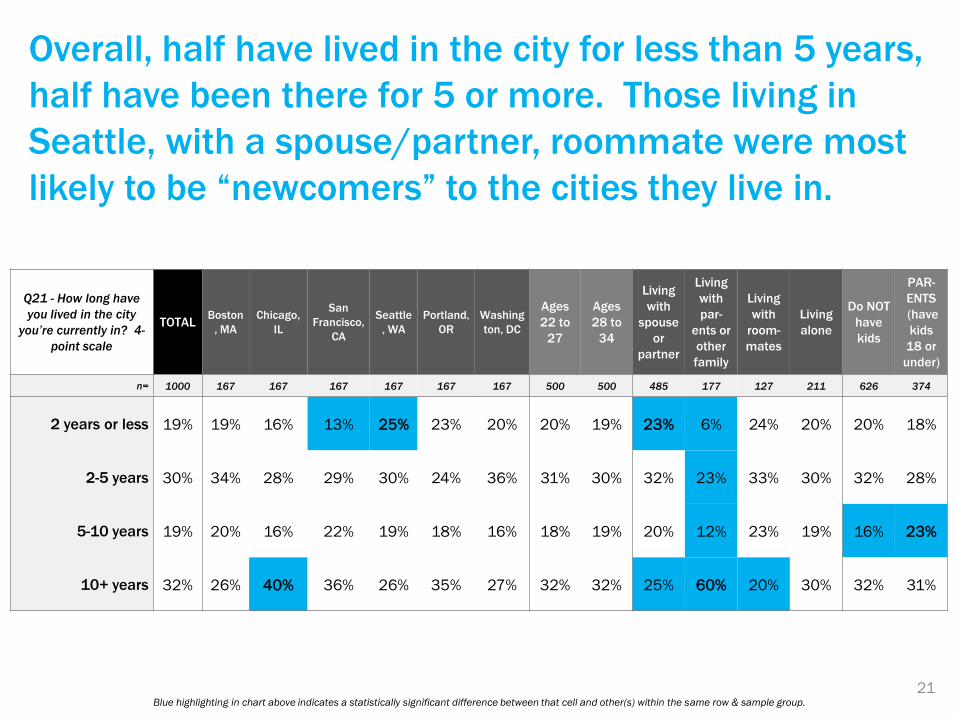
Overall, half have lived in the city for less than 5 years,
half have been there for 5 or more. Those living in
Seattle, with a spouse/partner, roommate were most
likely to be “newcomers” to the cities they live in.
21 Blue highlighting in chart above indicates a statistically significant difference between that cell and other(s) within the same row & sample group.
Q21 - How long have
you lived in the city
you’re currently in? 4-
point scale
TOTAL Boston
, MA
Chicago,
IL
San
Francisco,
CA
Seattle
, WA
Portland,
OR
Washing
ton, DC
Ages
22 to
27
Ages
28 to
34
Living
with
spouse
or
partner
Living
with
par-
ents or
other
family
Living
with
room-
mates
Living
alone
Do NOT
have
kids
PAR-
ENTS
(have
kids
18 or
under)
n= 1000 167 167 167 167 167 167 500 500 485 177 127 211 626 374
2 years or less 19% 19% 16% 13% 25% 23% 20% 20% 19% 23% 6% 24% 20% 20% 18%
2-5 years 30% 34% 28% 29% 30% 24% 36% 31% 30% 32% 23% 33% 30% 32% 28%
5-10 years 19% 20% 16% 22% 19% 18% 16% 18% 19% 20% 12% 23% 19% 16% 23%
10+ years 32% 26% 40% 36% 26% 35% 27% 32% 32% 25% 60% 20% 30% 32% 31%
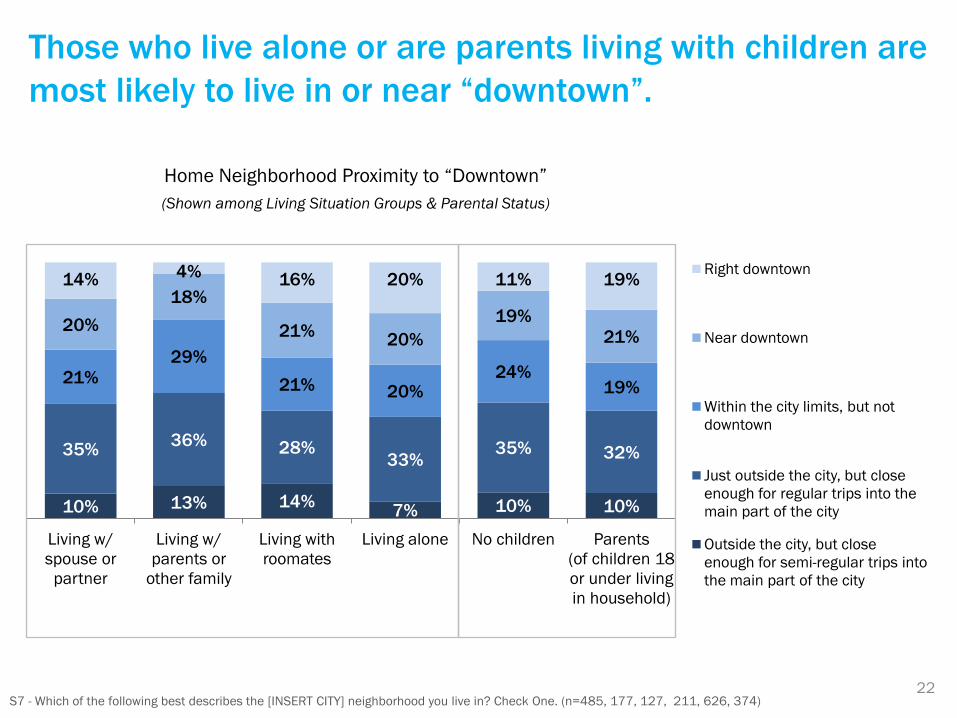
Those who live alone or are parents living with children are
most likely to live in or near “downtown”.
22
10% 13% 14% 7% 10% 10%
35% 36% 28%
33% 35% 32%
21% 29%
21% 20% 24%
19%
20%
18%
21% 20%
19%
21%
14% 4% 16% 20% 11% 19%
Living w/
spouse or
partner
Living w/
parents or
other family
Living with
roomates
Living alone No children Parents
(of children 18
or under living
in household)
Right downtown
Near downtown
Within the city limits, but not
downtown
Just outside the city, but close
enough for regular trips into the
main part of the city
Outside the city, but close
enough for semi-regular trips into
the main part of the city
Home Neighborhood Proximity to “Downtown”
(Shown among Living Situation Groups & Parental Status)
S7 - Which of the following best describes the [INSERT CITY] neighborhood you live in? Check One. (n=485, 177, 127, 211, 626, 374)
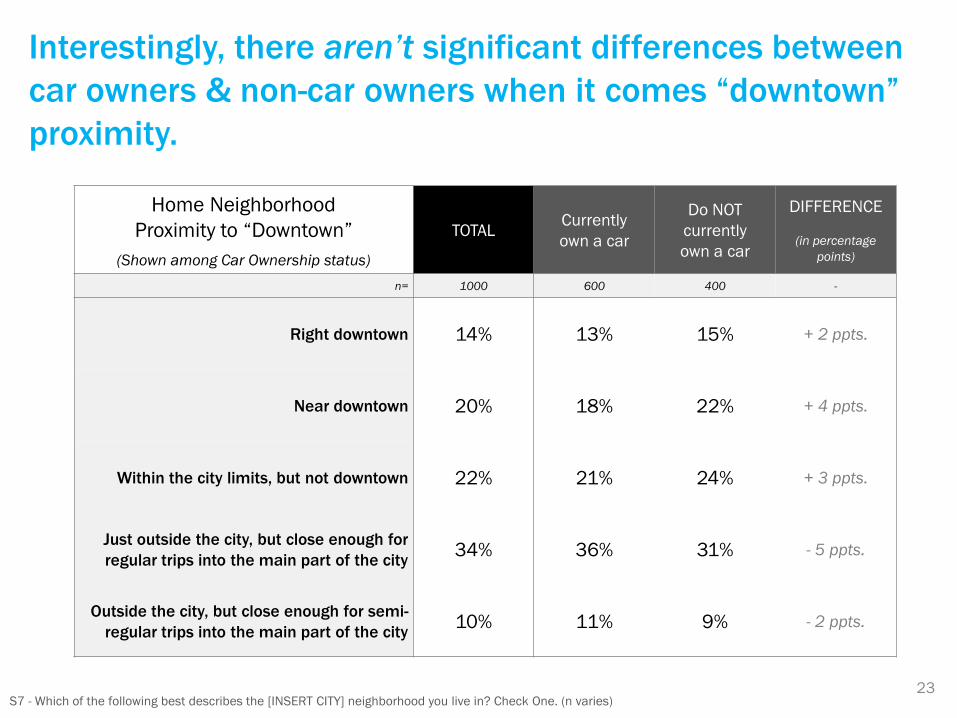
Interestingly, there aren’t significant differences between
car owners & non-car owners when it comes “downtown”
proximity.
Home Neighborhood
Proximity to “Downtown”
(Shown among Car Ownership status)
TOTAL Currently
own a car
Do NOT
currently
own a car
DIFFERENCE
(in percentage
points)
n= 1000 600 400 -
Right downtown 14% 13% 15% + 2 ppts.
Near downtown 20% 18% 22% + 4 ppts.
Within the city limits, but not downtown 22% 21% 24% + 3 ppts.
Just outside the city, but close enough for
regular trips into the main part of the city 34% 36% 31% - 5 ppts.
Outside the city, but close enough for semi-
regular trips into the main part of the city 10% 11% 9% - 2 ppts.
23 S7 - Which of the following best describes the [INSERT CITY] neighborhood you live in? Check One. (n varies)
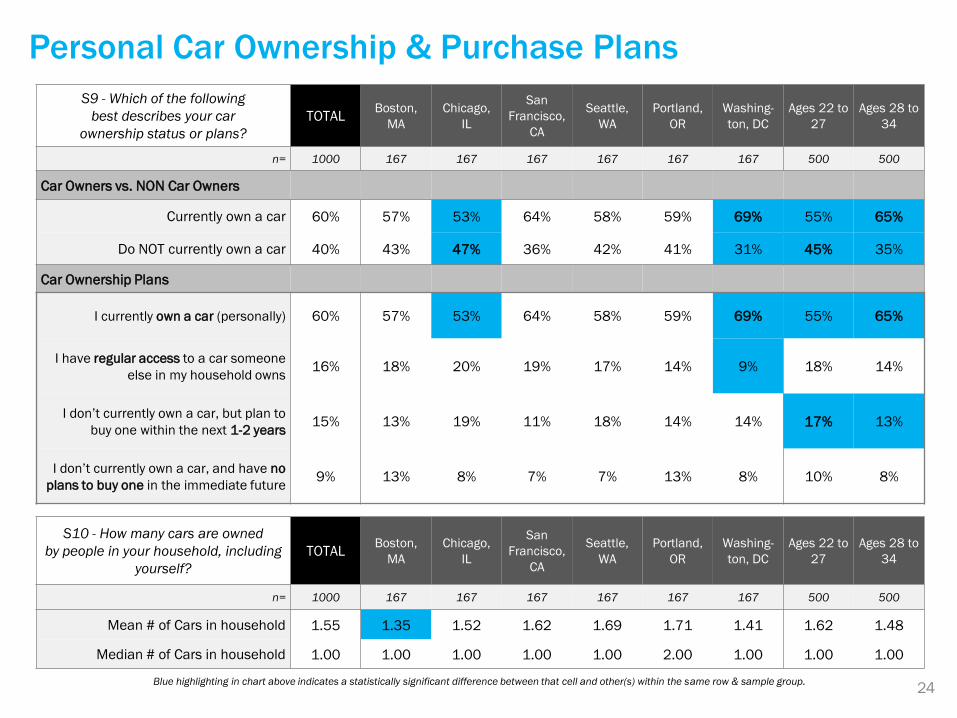
Personal Car Ownership & Purchase Plans
S9 - Which of the following
best describes your car
ownership status or plans?
TOTAL Boston,
MA
Chicago,
IL
San
Francisco,
CA
Seattle,
WA
Portland,
OR
Washing-
ton, DC
Ages 22 to
27
Ages 28 to
34
n= 1000 167 167 167 167 167 167 500 500
Car Owners vs. NON Car Owners
Currently own a car 60% 57% 53% 64% 58% 59% 69% 55% 65%
Do NOT currently own a car 40% 43% 47% 36% 42% 41% 31% 45% 35%
Car Ownership Plans
I currently own a car (personally) 60% 57% 53% 64% 58% 59% 69% 55% 65%
I have regular access to a car someone
else in my household owns 16% 18% 20% 19% 17% 14% 9% 18% 14%
I don’t currently own a car, but plan to
buy one within the next 1-2 years 15% 13% 19% 11% 18% 14% 14% 17% 13%
I don’t currently own a car, and have no
plans to buy one in the immediate future 9% 13% 8% 7% 7% 13% 8% 10% 8%
24
S10 - How many cars are owned
by people in your household, including
yourself?
TOTAL Boston,
MA
Chicago,
IL
San
Francisco,
CA
Seattle,
WA
Portland,
OR
Washing-
ton, DC
Ages 22 to
27
Ages 28 to
34
n= 1000 167 167 167 167 167 167 500 500
Mean # of Cars in household 1.55 1.35 1.52 1.62 1.69 1.71 1.41 1.62 1.48
Median # of Cars in household 1.00 1.00 1.00 1.00 1.00 2.00 1.00 1.00 1.00
Blue highlighting in chart above indicates a statistically significant difference between that cell and other(s) within the same row & sample group.
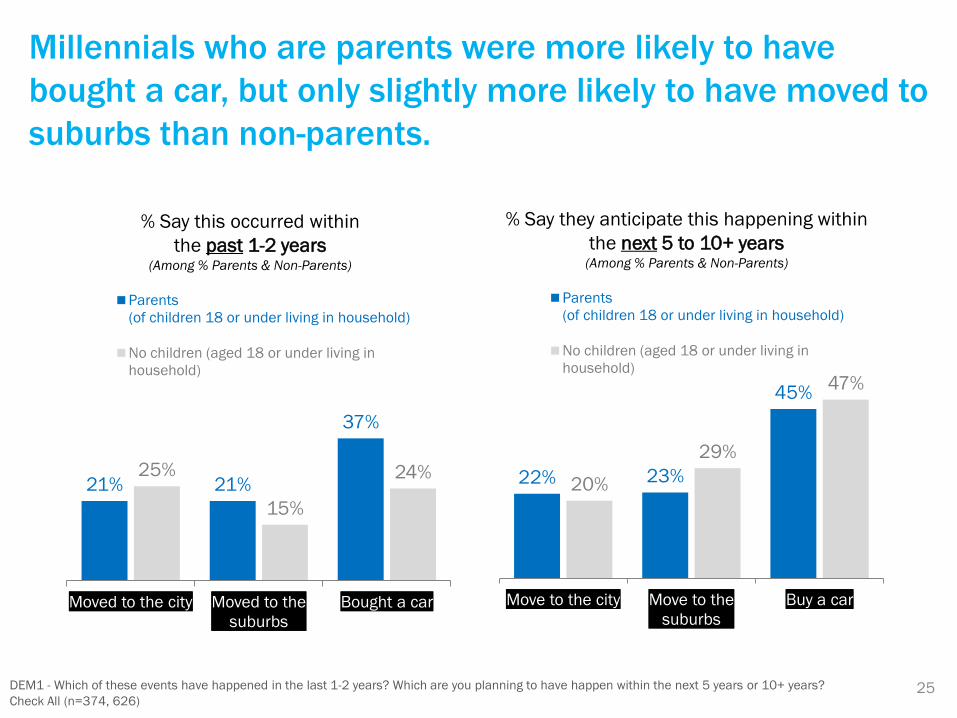
Millennials who are parents were more likely to have
bought a car, but only slightly more likely to have moved to
suburbs than non-parents.
25
21% 21%
37%
25%
15%
24%
Moved to the city Moved to the
suburbs
Bought a car
Parents
(of children 18 or under living in household)
No children (aged 18 or under living in
household)
% Say this occurred within
the past 1-2 years (Among % Parents & Non-Parents)
DEM1 - Which of these events have happened in the last 1-2 years? Which are you planning to have happen within the next 5 years or 10+ years?
Check All (n=374, 626)
22% 23%
45%
20%
29%
47%
Move to the city Move to the
suburbs
Buy a car
Parents
(of children 18 or under living in household)
No children (aged 18 or under living in
household)
% Say they anticipate this happening within
the next 5 to 10+ years (Among % Parents & Non-Parents)
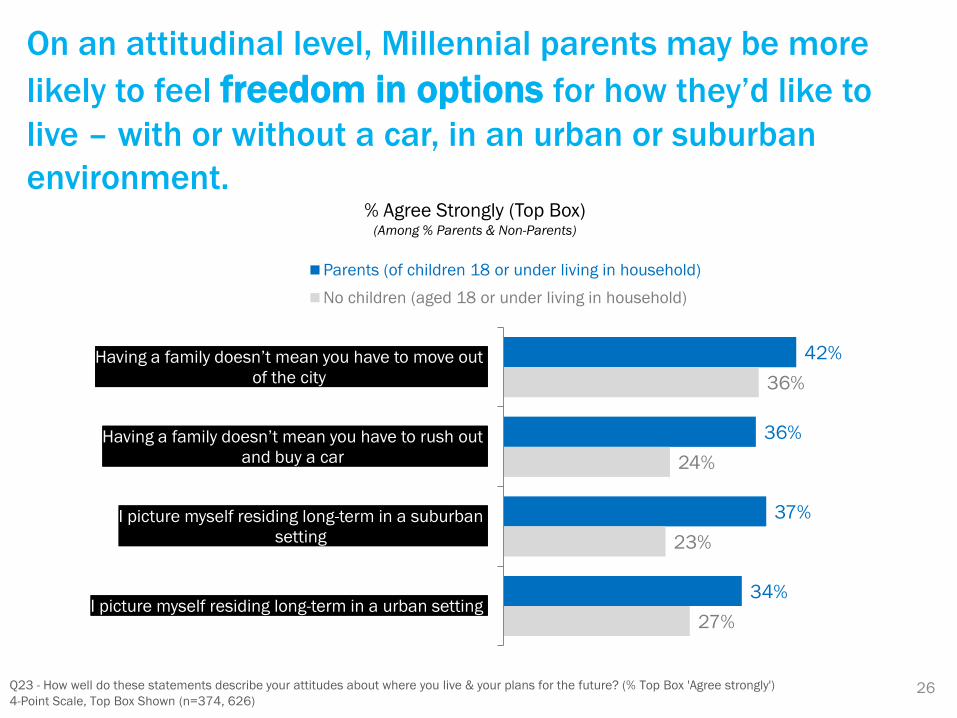
On an attitudinal level, Millennial parents may be more
likely to feel freedom in options for how they’d like to
live – with or without a car, in an urban or suburban
environment.
26 Q23 - How well do these statements describe your attitudes about where you live & your plans for the future? (% Top Box 'Agree strongly')
4-Point Scale, Top Box Shown (n=374, 626)
42%
36%
37%
34%
36%
24%
23%
27%
Having a family doesn’t mean you have to move out
of the city
Having a family doesn’t mean you have to rush out
and buy a car
I picture myself residing long-term in a suburban
setting
I picture myself residing long-term in a urban setting
Parents (of children 18 or under living in household)
No children (aged 18 or under living in household)
% Agree Strongly (Top Box) (Among % Parents & Non-Parents)

Millennial parents may be more likely to “opt-in” to car
ownership – as part of a multi-modal strategy to have
options for getting around.
Q16 - How often do you use more than
one transportation option for getting to a
destination?
Parents (have kids
under 18
living in
household)
Do NOT
have kids
n= 374 626
% Use more than one transportation
option for getting to a destination daily 43% 33%
S10 - How many cars are owned by
people in your household, including
yourself?
Parents (have kids
under 18
living in
household)
Do NOT
have kids
n= 374 626
Mean # of cars owned in household 1.70 1.46
Q19 - Which of these describe how your
car fits into your transportation routine?
(Asked among car owners)
Parents (have kids
under 18
living in
household)
Do NOT
have kids
n= 253 347
I can’t get to the places I need to without
a car (at least some of the time) 27% 36%
27 Blue highlighting in charts above indicates a statistically significant difference between that cell and other(s) within the same row & sample group.
Millennial parents are more
likely to be using multiple
transportation options on a
daily basis.
They’re more likely to have
multiple cars in their
household, but interestingly,
among car owners, Millennial
parents were less likely to feel
they have to have a car to get to
the places they need to.
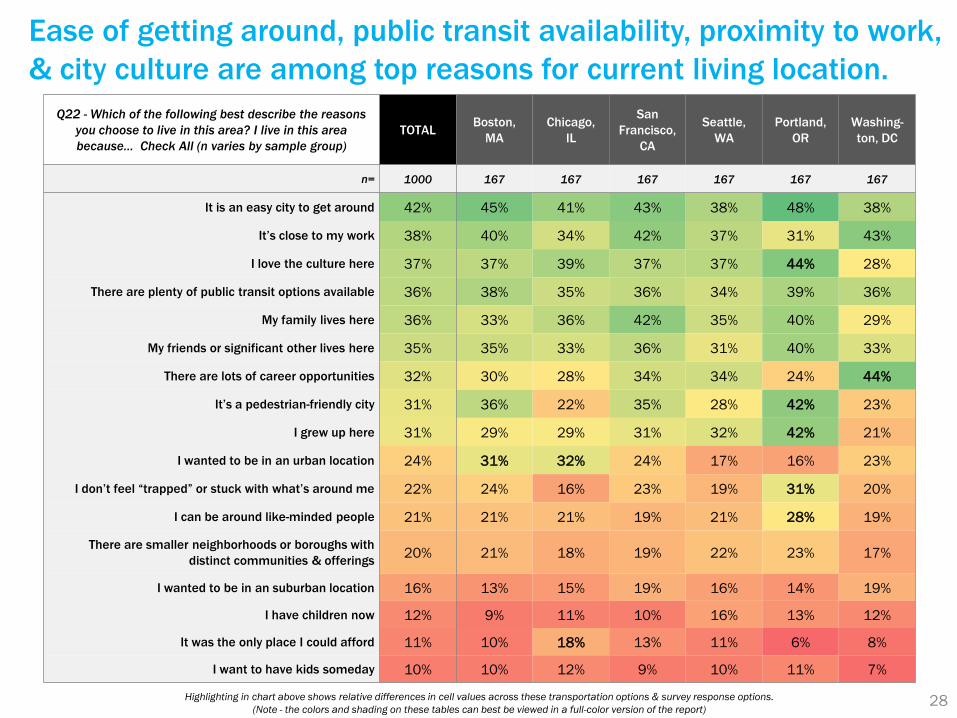
Q22 - Which of the following best describe the reasons
you choose to live in this area? I live in this area
because… Check All (n varies by sample group)
TOTAL Boston,
MA
Chicago,
IL
San
Francisco,
CA
Seattle,
WA
Portland,
OR
Washing-
ton, DC
n= 1000 167 167 167 167 167 167
It is an easy city to get around 42% 45% 41% 43% 38% 48% 38%
It’s close to my work 38% 40% 34% 42% 37% 31% 43%
I love the culture here 37% 37% 39% 37% 37% 44% 28%
There are plenty of public transit options available 36% 38% 35% 36% 34% 39% 36%
My family lives here 36% 33% 36% 42% 35% 40% 29%
My friends or significant other lives here 35% 35% 33% 36% 31% 40% 33%
There are lots of career opportunities 32% 30% 28% 34% 34% 24% 44%
It’s a pedestrian-friendly city 31% 36% 22% 35% 28% 42% 23%
I grew up here 31% 29% 29% 31% 32% 42% 21%
I wanted to be in an urban location 24% 31% 32% 24% 17% 16% 23%
I don’t feel “trapped” or stuck with what’s around me 22% 24% 16% 23% 19% 31% 20%
I can be around like-minded people 21% 21% 21% 19% 21% 28% 19%
There are smaller neighborhoods or boroughs with
distinct communities & offerings 20% 21% 18% 19% 22% 23% 17%
I wanted to be in an suburban location 16% 13% 15% 19% 16% 14% 19%
I have children now 12% 9% 11% 10% 16% 13% 12%
It was the only place I could afford 11% 10% 18% 13% 11% 6% 8%
I want to have kids someday 10% 10% 12% 9% 10% 11% 7%
28 Highlighting in chart above shows relative differences in cell values across these transportation options & survey response options.
(Note - the colors and shading on these tables can best be viewed in a full-color version of the report)
Ease of getting around, public transit availability, proximity to work,
& city culture are among top reasons for current living location.

Millennials living with roommates were most likely group to describe mobility-
related options as reason for living where they do.
29 Highlighting in chart above shows relative differences in cell values across these transportation options & survey response options.
(Note - the colors and shading on these tables can best be viewed in a full-color version of the report)
Q22 - Which of the following best describe the reasons you
choose to live in this area? I live in this area because…
Check All (n varies by sample group)
Living w/
spouse
or
partner
Living w/
parents
or other
family
Living
with
room-
mates
Living
alone
n= 485 177 127 211
It is an easy city to get around 39% 45% 51% 42%
It’s close to my work 37% 30% 44% 42%
I love the culture here 41% 32% 37% 32%
There are plenty of public transit options available 36% 36% 38% 37%
My family lives here 32% 64% 26% 29%
My friends or significant other lives here 39% 37% 38% 21%
There are lots of career opportunities 33% 25% 37% 33%
It’s a pedestrian-friendly city 29% 26% 42% 33%
I grew up here 24% 59% 24% 27%
I wanted to be in an urban location 24% 21% 31% 22%
I don’t feel “trapped” or stuck with what’s around me 22% 19% 27% 24%
I can be around like-minded people 24% 18% 26% 16%
There are smaller neighborhoods or boroughs
with distinct communities & offerings 22% 16% 21% 16%
I wanted to be in an suburban location 19% 12% 12% 13%
I have children now 19% 7% 3% 4%
It was the only place I could afford 10% 16% 8% 11%
I want to have kids someday 13% 9% 5% 6%
Those living with a spouse or
partner were most likely to say
loving the city culture & their
significant other were reasons
for living in their current
location.
Those living with family
unsurprisingly described
growing up, family ties &
money as reasons for living
where they do now.
Those living with roommates
were the most likely group to
cite the city’s transportation-
related attributes &
pedestrian-friendliness as
reasons for their current living
location.
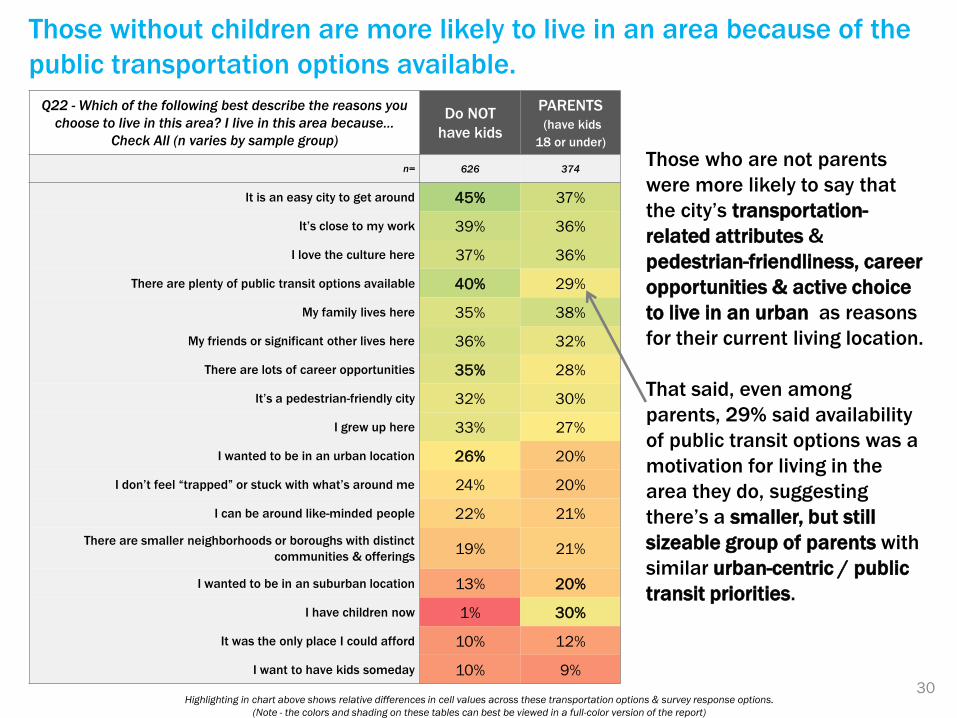
Those without children are more likely to live in an area because of the
public transportation options available.
30 Highlighting in chart above shows relative differences in cell values across these transportation options & survey response options.
(Note - the colors and shading on these tables can best be viewed in a full-color version of the report)
Q22 - Which of the following best describe the reasons you
choose to live in this area? I live in this area because…
Check All (n varies by sample group)
Do NOT
have kids
PARENTS
(have kids
18 or under)
n= 626 374
It is an easy city to get around 45% 37%
It’s close to my work 39% 36%
I love the culture here 37% 36%
There are plenty of public transit options available 40% 29%
My family lives here 35% 38%
My friends or significant other lives here 36% 32%
There are lots of career opportunities 35% 28%
It’s a pedestrian-friendly city 32% 30%
I grew up here 33% 27%
I wanted to be in an urban location 26% 20%
I don’t feel “trapped” or stuck with what’s around me 24% 20%
I can be around like-minded people 22% 21%
There are smaller neighborhoods or boroughs with distinct
communities & offerings 19% 21%
I wanted to be in an suburban location 13% 20%
I have children now 1% 30%
It was the only place I could afford 10% 12%
I want to have kids someday 10% 9%
Those who are not parents
were more likely to say that
the city’s transportation-
related attributes &
pedestrian-friendliness, career
opportunities & active choice
to live in an urban as reasons
for their current living location.
That said, even among
parents, 29% said availability
of public transit options was a
motivation for living in the
area they do, suggesting
there’s a smaller, but still
sizeable group of parents with
similar urban-centric / public
transit priorities.
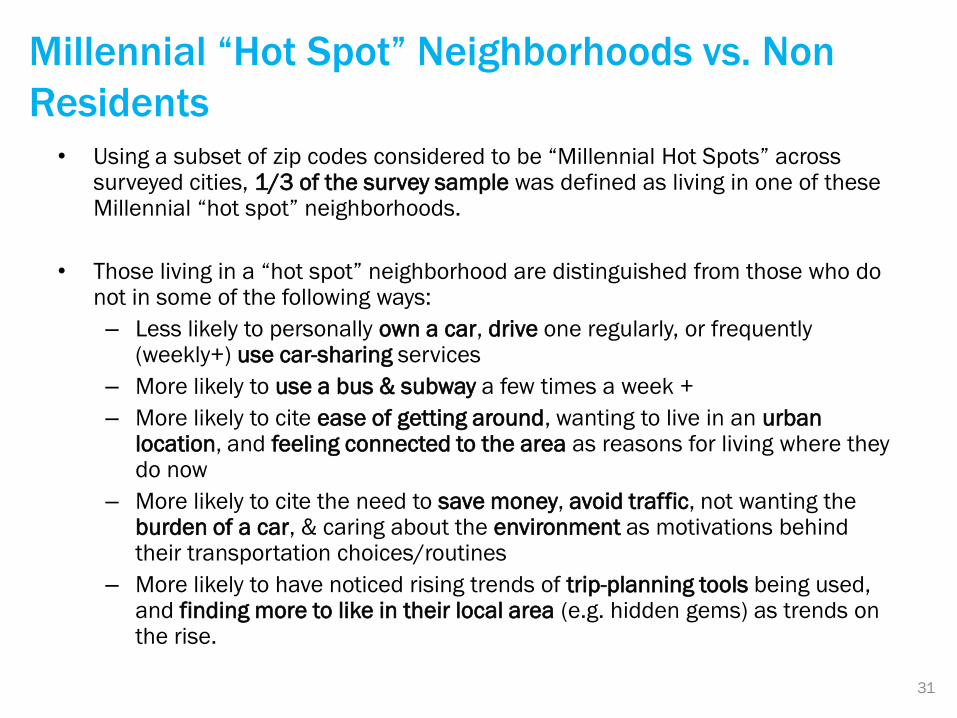
Millennial “Hot Spot” Neighborhoods vs. Non
Residents
• Using a subset of zip codes considered to be “Millennial Hot Spots” across surveyed cities, 1/3 of the survey sample was defined as living in one of these Millennial “hot spot” neighborhoods.
• Those living in a “hot spot” neighborhood are distinguished from those who do not in some of the following ways:
– Less likely to personally own a car, drive one regularly, or frequently (weekly+) use car-sharing services
– More likely to use a bus & subway a few times a week +
– More likely to cite ease of getting around, wanting to live in an urban location, and feeling connected to the area as reasons for living where they do now
– More likely to cite the need to save money, avoid traffic, not wanting the burden of a car, & caring about the environment as motivations behind their transportation choices/routines
– More likely to have noticed rising trends of trip-planning tools being used, and finding more to like in their local area (e.g. hidden gems) as trends on the rise.
31
32
Transportation
Trends & Motivations
Transportation Trends: ENVIRONMENTAL CONSIDERATIONS
33
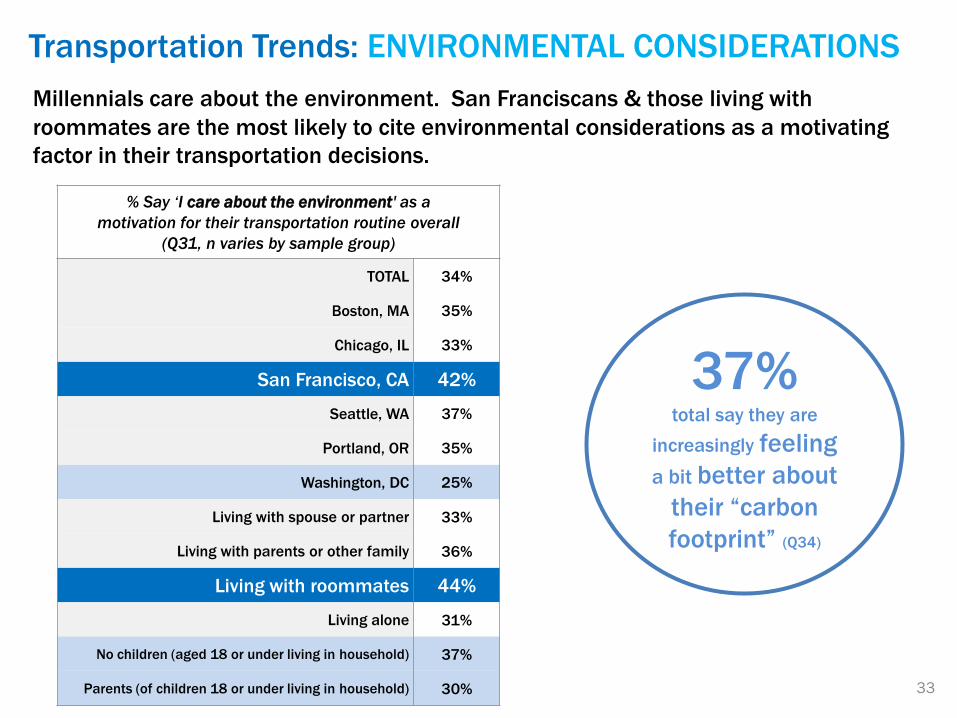
Millennials care about the environment. San Franciscans & those living with
roommates are the most likely to cite environmental considerations as a motivating
factor in their transportation decisions.
% Say ‘I care about the environment' as a
motivation for their transportation routine overall
(Q31, n varies by sample group)
TOTAL 34%
Boston, MA 35%
Chicago, IL 33%
San Francisco, CA 42%
Seattle, WA 37%
Portland, OR 35%
Washington, DC 25%
Living with spouse or partner 33%
Living with parents or other family 36%
Living with roommates 44%
Living alone 31%
No children (aged 18 or under living in household) 37%
Parents (of children 18 or under living in household) 30%
37% total say they are
increasingly feeling
a bit better about
their “carbon
footprint” (Q34)

Transportation Trends: ENVIRONMENTAL CONSIDERATIONS
34
The attribute of being “better for the environment,” was a top-ranking
perceived benefit for walking, biking, skate boarding, subway/light rail, as
well as bike-sharing.
% Say 'is better for the environment' as a benefit for
this transportation option (Q113, n varies by mode)
Walking 73%
Bicycle (Owned) 64%
Public Transit: Subway, Light Rail,
Streetcar, or Trolley 50%
Skateboard, longboard, or rollerblades 49%
Public Transit: Bus 41%
Public Transit: Commuter Rail 40%
Car-pooling or ride-sharing 38%
Bike-sharing 31%
Public Transit: Ferry 27%
Car-sharing 26%
Motor scooter or moped 24%
Taxi 8%
Driving a car (Owned) 8%
“Our generation grew up
knowing all about the
effects on the environment
that cars can have, so
we've grown up with an
attitude of wanting to do
our part for the earth -
something that we can
easily do with public
transit and not with cars”
Highlighting in chart above shows relative differences in cell values across these transportation options & survey response options.
(Note - the colors and shading on these tables can best be viewed in a full-color version of the report)
Transportation Trends: ENVIRONMENTAL CONSIDERATIONS
35
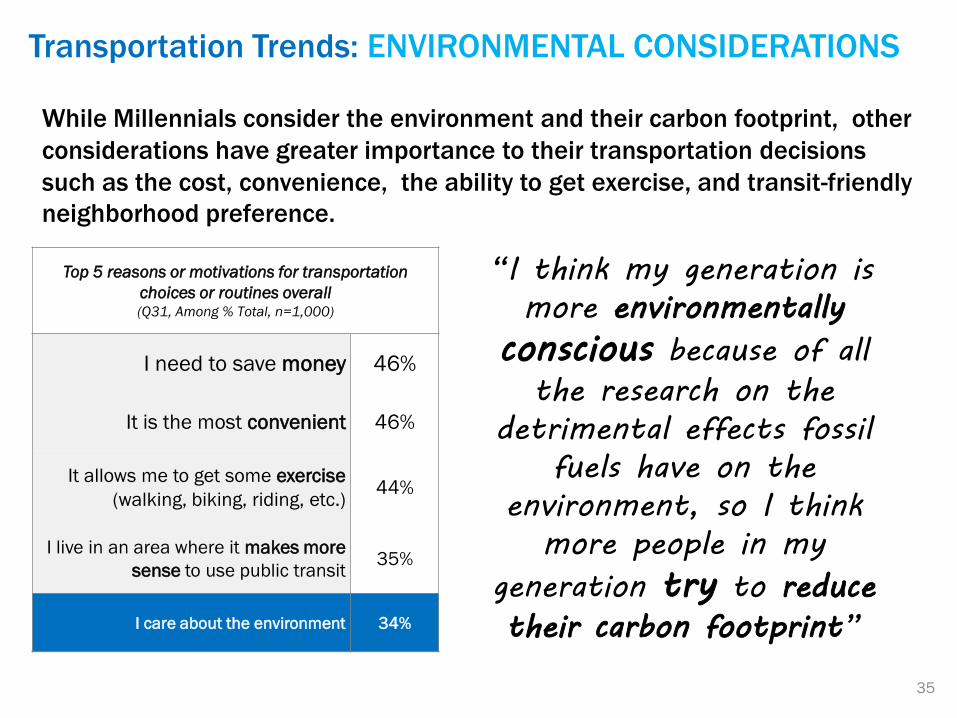
While Millennials consider the environment and their carbon footprint, other
considerations have greater importance to their transportation decisions
such as the cost, convenience, the ability to get exercise, and transit-friendly
neighborhood preference.
Top 5 reasons or motivations for transportation
choices or routines overall (Q31, Among % Total, n=1,000)
I need to save money 46%
It is the most convenient 46%
It allows me to get some exercise
(walking, biking, riding, etc.) 44%
I live in an area where it makes more
sense to use public transit 35%
I care about the environment 34%
“I think my generation is
more environmentally
conscious because of all the research on the
detrimental effects fossil
fuels have on the
environment, so I think
more people in my
generation try to reduce their carbon footprint”
Transportation Trends: SHARE-BASED OPTIONS
36
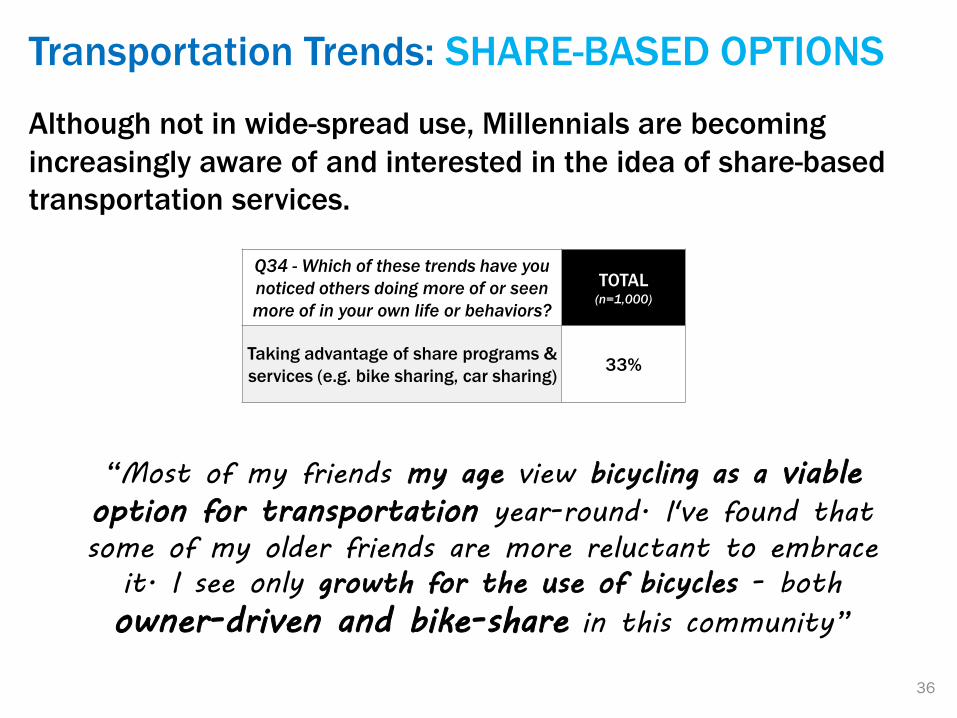
Although not in wide-spread use, Millennials are becoming
increasingly aware of and interested in the idea of share-based
transportation services.
Q34 - Which of these trends have you
noticed others doing more of or seen
more of in your own life or behaviors?
TOTAL (n=1,000)
Taking advantage of share programs &
services (e.g. bike sharing, car sharing) 33%
“Most of my friends my age view bicycling as a viable
option for transportation year-round. I've found that some of my older friends are more reluctant to embrace
it. I see only growth for the use of bicycles - both
owner-driven and bike-share in this community”
Transportation Trends:
WORKING ANYWHERE, AT ANYTIME
37
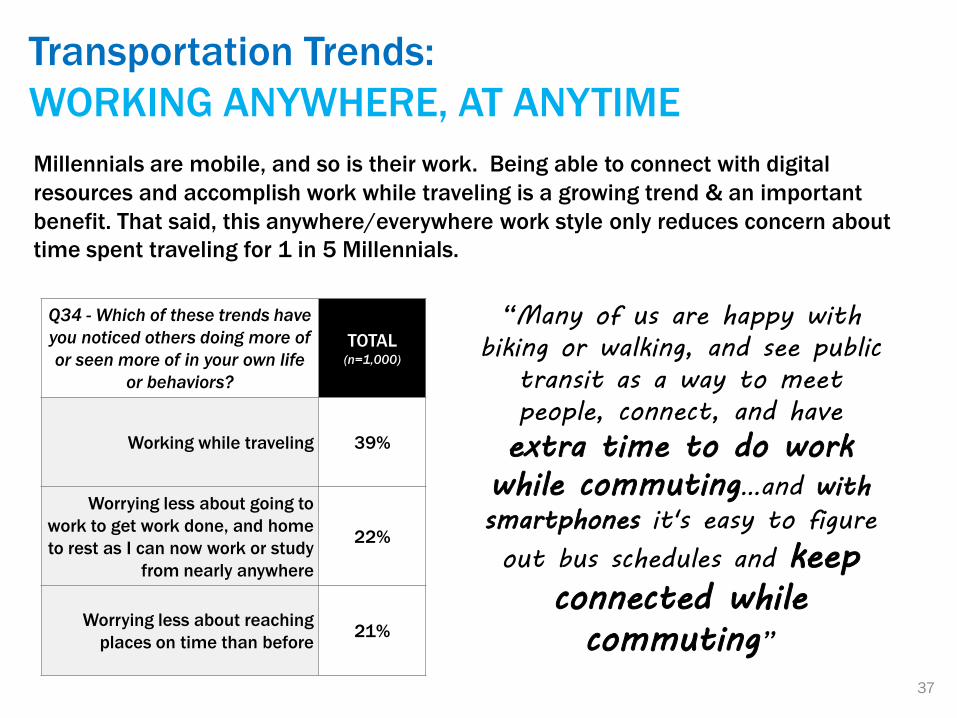
Millennials are mobile, and so is their work. Being able to connect with digital
resources and accomplish work while traveling is a growing trend & an important
benefit. That said, this anywhere/everywhere work style only reduces concern about
time spent traveling for 1 in 5 Millennials.
Q34 - Which of these trends have
you noticed others doing more of
or seen more of in your own life
or behaviors?
TOTAL (n=1,000)
Working while traveling 39%
Worrying less about going to
work to get work done, and home
to rest as I can now work or study
from nearly anywhere
22%
Worrying less about reaching
places on time than before 21%
“Many of us are happy with
biking or walking, and see public
transit as a way to meet
people, connect, and have
extra time to do work
while commuting…and with
smartphones it's easy to figure
out bus schedules and keep
connected while
commuting”
Transportation Trends: SOCIAL & COMMUNITY
CONNECTIONS (ONLINE & OFFLINE)
38
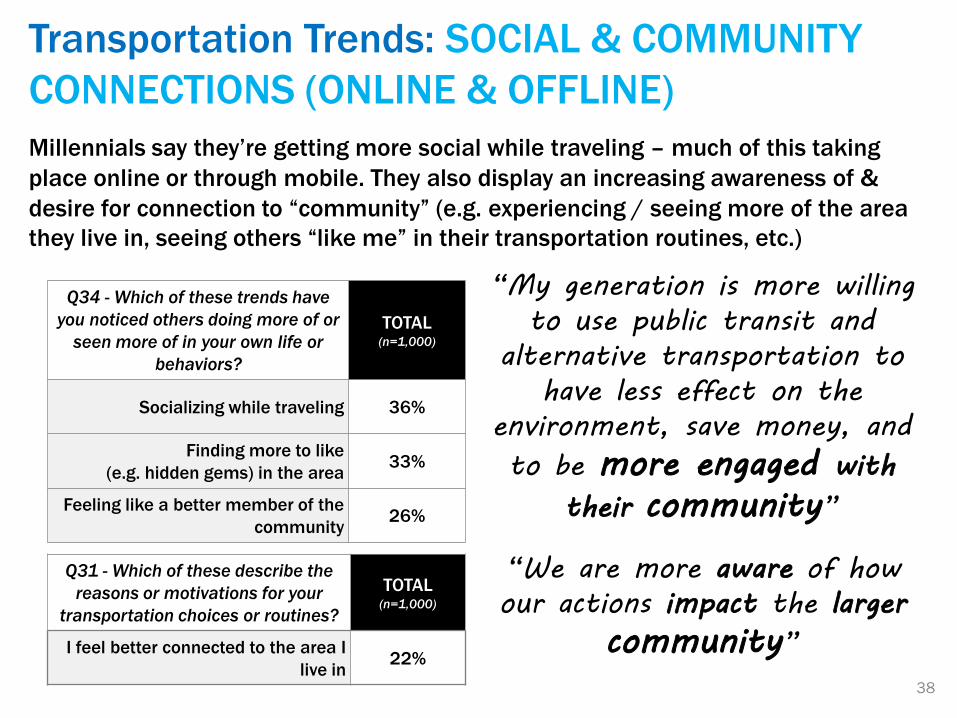
Millennials say they’re getting more social while traveling – much of this taking
place online or through mobile. They also display an increasing awareness of &
desire for connection to “community” (e.g. experiencing / seeing more of the area
they live in, seeing others “like me” in their transportation routines, etc.)
Q34 - Which of these trends have
you noticed others doing more of or
seen more of in your own life or
behaviors?
TOTAL (n=1,000)
Socializing while traveling 36%
Finding more to like
(e.g. hidden gems) in the area 33%
Feeling like a better member of the
community 26%
“We are more aware of how
our actions impact the larger
community”
“My generation is more willing
to use public transit and
alternative transportation to
have less effect on the
environment, save money, and
to be more engaged with
their community”
Q31 - Which of these describe the
reasons or motivations for your
transportation choices or routines?
TOTAL (n=1,000)
I feel better connected to the area I
live in 22%
Transportation Trends: SOCIAL & COMMUNITY
CONNECTIONS (ONLINE & OFFLINE)
39
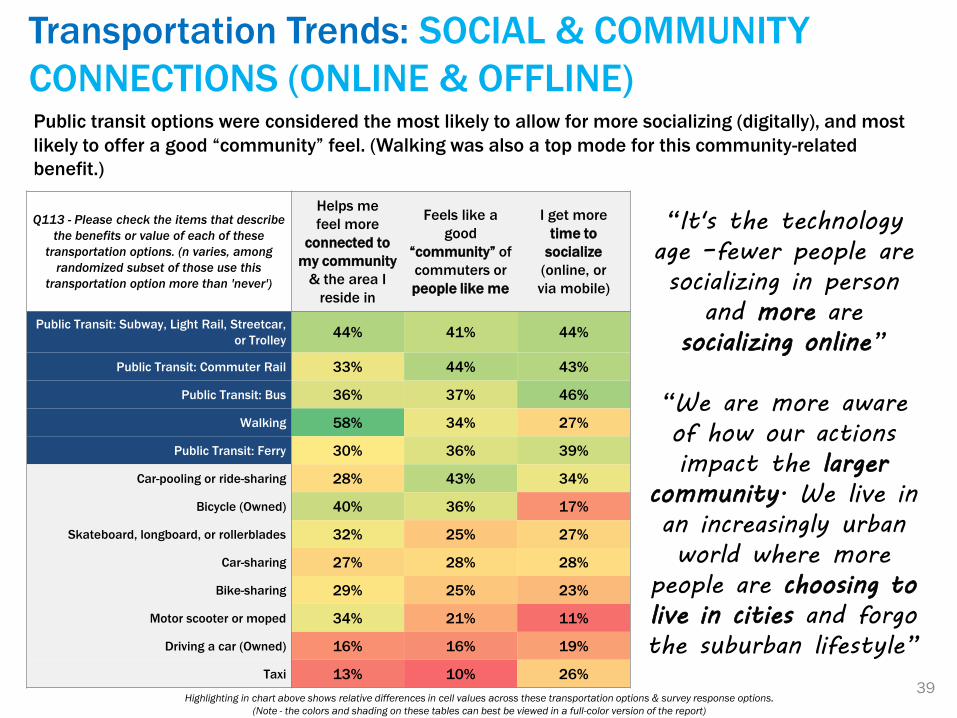
Public transit options were considered the most likely to allow for more socializing (digitally), and most
likely to offer a good “community” feel. (Walking was also a top mode for this community-related
benefit.)
Q113 - Please check the items that describe
the benefits or value of each of these
transportation options. (n varies, among
randomized subset of those use this
transportation option more than 'never')
Helps me
feel more
connected to
my community
& the area I
reside in
Feels like a
good
“community” of
commuters or
people like me
I get more
time to
socialize
(online, or
via mobile)
Public Transit: Subway, Light Rail, Streetcar,
or Trolley 44% 41% 44%
Public Transit: Commuter Rail 33% 44% 43%
Public Transit: Bus 36% 37% 46%
Walking 58% 34% 27%
Public Transit: Ferry 30% 36% 39%
Car-pooling or ride-sharing 28% 43% 34%
Bicycle (Owned) 40% 36% 17%
Skateboard, longboard, or rollerblades 32% 25% 27%
Car-sharing 27% 28% 28%
Bike-sharing 29% 25% 23%
Motor scooter or moped 34% 21% 11%
Driving a car (Owned) 16% 16% 19%
Taxi 13% 10% 26%
“It's the technology
age –fewer people are
socializing in person
and more are
socializing online”
“We are more aware
of how our actions
impact the larger
community. We live in
an increasingly urban
world where more
people are choosing to
live in cities and forgo
the suburban lifestyle”
Highlighting in chart above shows relative differences in cell values across these transportation options & survey response options.
(Note - the colors and shading on these tables can best be viewed in a full-color version of the report)
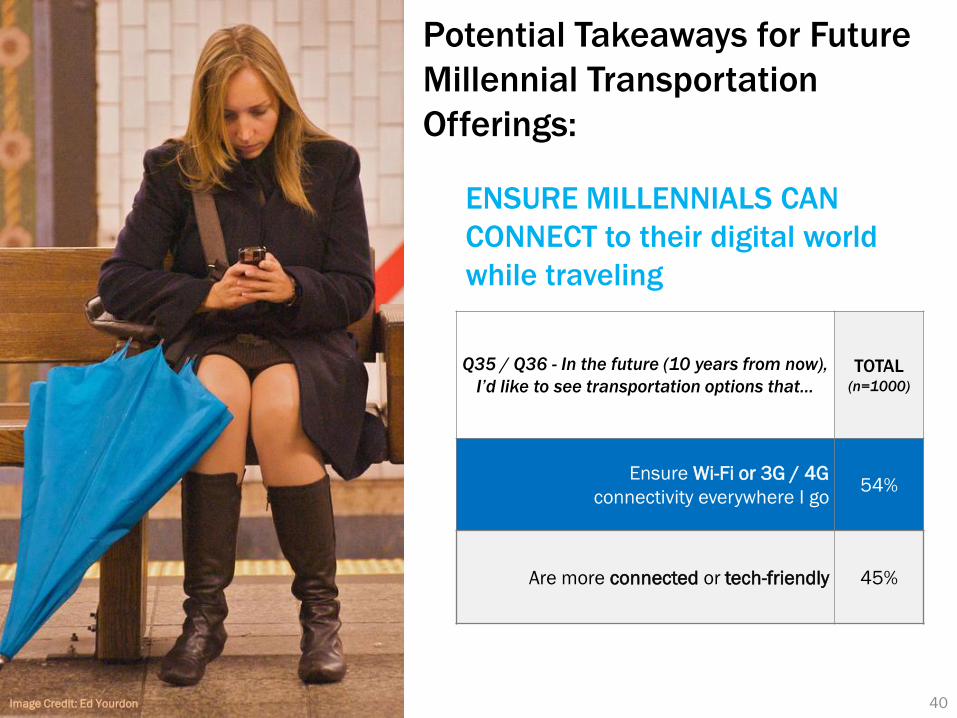
Potential Takeaways for Future
Millennial Transportation
Offerings:
40
ENSURE MILLENNIALS CAN
CONNECT to their digital world
while traveling
Q35 / Q36 - In the future (10 years from now),
I’d like to see transportation options that… TOTAL
(n=1000)
Ensure Wi-Fi or 3G / 4G
connectivity everywhere I go 54%
Are more connected or tech-friendly 45%
Image Credit: Ed Yourdon
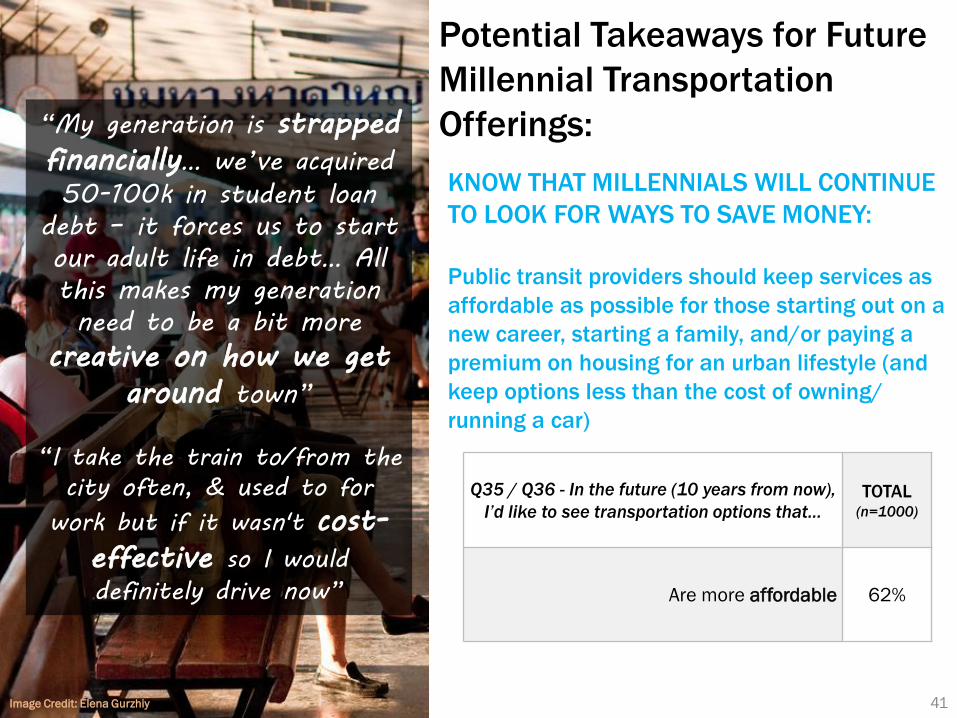
Image Credit: Elena Gurzhiy
Potential Takeaways for Future
Millennial Transportation
Offerings:
41
KNOW THAT MILLENNIALS WILL CONTINUE
TO LOOK FOR WAYS TO SAVE MONEY:
Public transit providers should keep services as
affordable as possible for those starting out on a
new career, starting a family, and/or paying a
premium on housing for an urban lifestyle (and
keep options less than the cost of owning/
running a car)
Q35 / Q36 - In the future (10 years from now),
I’d like to see transportation options that… TOTAL
(n=1000)
Are more affordable 62%
“My generation is strapped
financially… we’ve acquired
50-100k in student loan
debt – it forces us to start
our adult life in debt… All
this makes my generation
need to be a bit more
creative on how we get
around town”
“I take the train to/from the
city often, & used to for
work but if it wasn't cost-
effective so I would
definitely drive now”
Potential Takeaways for Future
Millennial Transportation
Offerings:
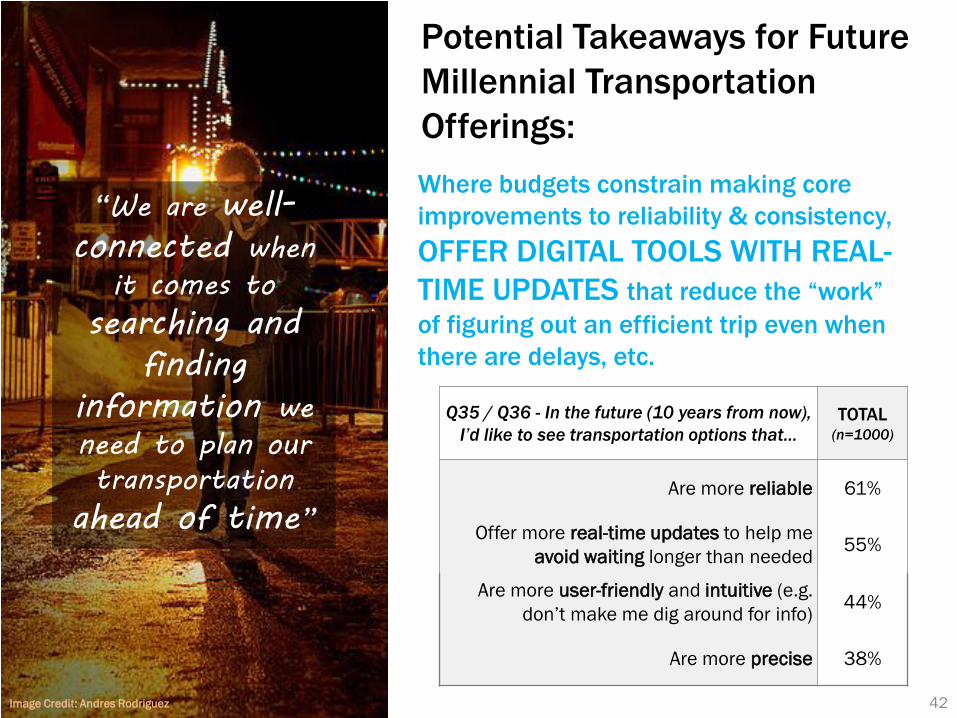
42
Where budgets constrain making core
improvements to reliability & consistency,
OFFER DIGITAL TOOLS WITH REAL-
TIME UPDATES that reduce the “work”
of figuring out an efficient trip even when
there are delays, etc.
Q35 / Q36 - In the future (10 years from now),
I’d like to see transportation options that… TOTAL
(n=1000)
Are more reliable 61%
Offer more real-time updates to help me
avoid waiting longer than needed 55%
Are more user-friendly and intuitive (e.g.
don’t make me dig around for info) 44%
Are more precise 38%
Image Credit: Andres Rodriguez
“We are well-
connected when
it comes to
searching and
finding
information we
need to plan our
transportation
ahead of time”
Potential Takeaways for Future
Millennial Transportation Offerings:
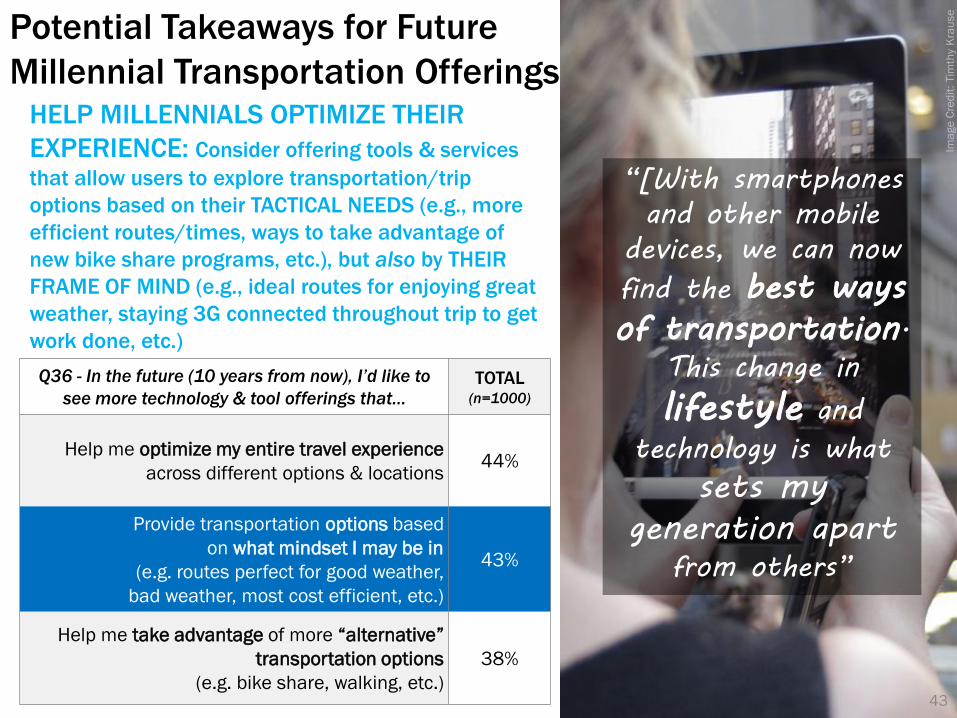
43
HELP MILLENNIALS OPTIMIZE THEIR
EXPERIENCE: Consider offering tools & services
that allow users to explore transportation/trip
options based on their TACTICAL NEEDS (e.g., more
efficient routes/times, ways to take advantage of
new bike share programs, etc.), but also by THEIR
FRAME OF MIND (e.g., ideal routes for enjoying great
weather, staying 3G connected throughout trip to get
work done, etc.)
Q36 - In the future (10 years from now), I’d like to
see more technology & tool offerings that… TOTAL
(n=1000)
Help me optimize my entire travel experience
across different options & locations 44%
Provide transportation options based
on what mindset I may be in
(e.g. routes perfect for good weather,
bad weather, most cost efficient, etc.)
43%
Help me take advantage of more “alternative”
transportation options
(e.g. bike share, walking, etc.)
38%
43
Ima
ge
Cre
dit
: Tim
thy
Kra
use
“[With smartphones
and other mobile
devices, we can now
find the best ways
of transportation. This change in
lifestyle and technology is what
sets my
generation apart from others”
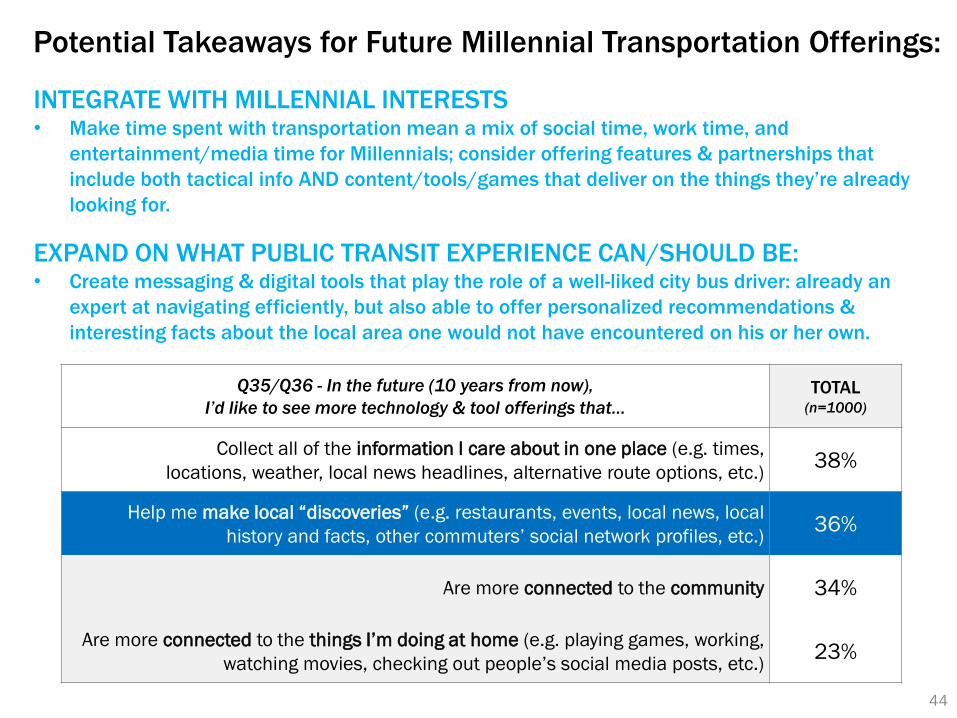
Potential Takeaways for Future Millennial Transportation Offerings:
44
INTEGRATE WITH MILLENNIAL INTERESTS • Make time spent with transportation mean a mix of social time, work time, and
entertainment/media time for Millennials; consider offering features & partnerships that
include both tactical info AND content/tools/games that deliver on the things they’re already
looking for.
EXPAND ON WHAT PUBLIC TRANSIT EXPERIENCE CAN/SHOULD BE: • Create messaging & digital tools that play the role of a well-liked city bus driver: already an
expert at navigating efficiently, but also able to offer personalized recommendations &
interesting facts about the local area one would not have encountered on his or her own.
Q35/Q36 - In the future (10 years from now),
I’d like to see more technology & tool offerings that… TOTAL
(n=1000)
Collect all of the information I care about in one place (e.g. times,
locations, weather, local news headlines, alternative route options, etc.) 38%
Help me make local “discoveries” (e.g. restaurants, events, local news, local
history and facts, other commuters’ social network profiles, etc.) 36%
Are more connected to the community 34%
Are more connected to the things I’m doing at home (e.g. playing games, working,
watching movies, checking out people’s social media posts, etc.) 23%
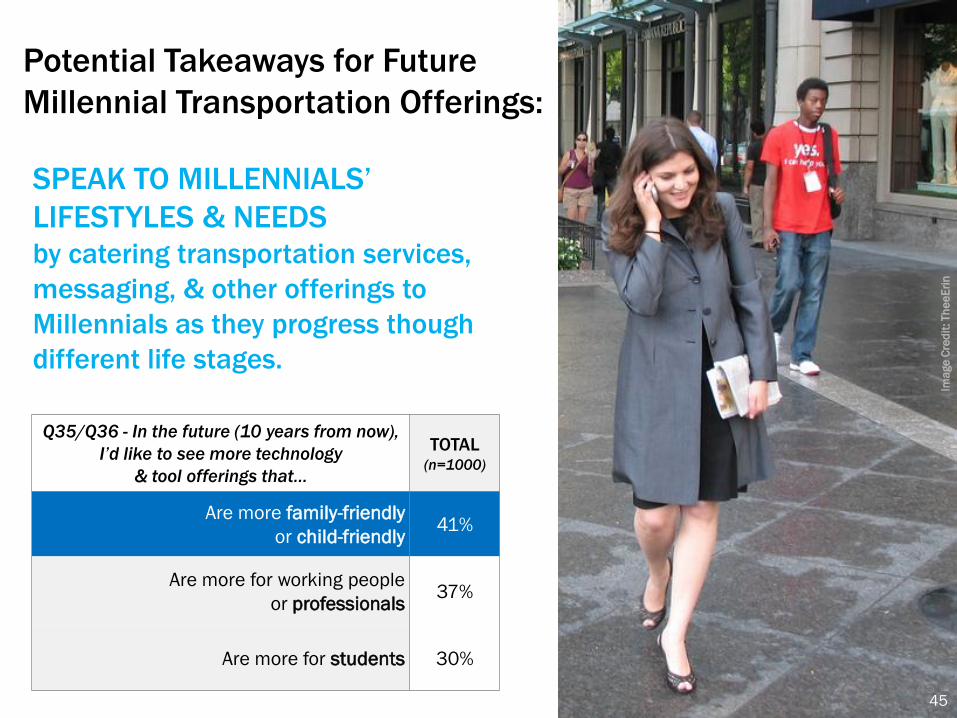
Potential Takeaways for Future
Millennial Transportation Offerings:
Q35/Q36 - In the future (10 years from now),
I’d like to see more technology
& tool offerings that…
TOTAL (n=1000)
Are more family-friendly
or child-friendly 41%
Are more for working people
or professionals 37%
Are more for students 30%
45
SPEAK TO MILLENNIALS’
LIFESTYLES & NEEDS
by catering transportation services,
messaging, & other offerings to
Millennials as they progress though
different life stages.
45
Ima
ge
Cre
dit
: Th
ee
Eri
n
Acknowledgements
46
Disclaimer The opinions and conclusions expressed or implied are those of the research agency that performed the research and are not
necessarily those of the Transportation Research Board or its sponsoring agencies. This report has not been reviewed or accepted by
the Transportation Research Board Executive Committee or the Governing Board of the National Research Council.
This study was conducted for the American Public Transportation Association (APTA), with funding provided through the Transit
Cooperative Research Program (TCRP) Project J-11, Quick-Response Research on Long-Term Strategic Issues.
The TCRP is sponsored by the Federal Transit Administration (FTA); directed by the Transit Development Corporation, the education
and research arm of the APTA; and administered by The National Academies, through the Transportation Research Board. Project J-
11 is intended to fund quick response studies on behalf of the TCRP Oversight and Project Selection (TOPS) Committee, the FTA, and
the APTA and its committees.
The work was guided by a project panel with representatives from several national and state transportation research and planning
organizations, private consultants, and the American Public Transit Association (APTA).
Neela Sakaria and Natalie Stehfest of Latitude Research (the contractor) would like to acknowledge and thank the many respondents
and interviewees who provided data and information about their transportation behaviors, attitudes & desires for future
transportation offerings. Additionally, our deep appreciation goes to the project panel members and Dianne Schwager, the Senior
Program Officer for this project, for their detailed review of study documents and thoughtful feedback.

For more information, contact the American Public Transportation Association
(202) 496-4887/[email protected]