Milkfish aquaculture in the Pacific : potential for the ...
62
ISSN 1683-7568 A q u a c u l t u r e S e c t i o n for the Secretariat of the Pacific Community, Aquaculture Section Noumea, New Caledonia April 2004 MILKFISH AQUACULTURE IN THE PACIFIC: POTENTIAL FOR THE TUNA LONGLINE FISHERY BAIT MARKET SPC Aquaculture Technical Papers BY William J. FitzGerald, Jr.
Transcript of Milkfish aquaculture in the Pacific : potential for the ...
ISSN 1683-7568
A q u a c u l t u r e S e c t i o n
for the Secretariat of the Pacific Community,Aquaculture Section
Noumea, New Caledonia
April 2004
MILKFISH AQUACULTURE IN THE PACIFIC:
POTENTIAL FOR THE TUNA LONGLINE FISHERY
BAIT MARKET
SPC Aquaculture Technical Papers
BYWilliam J. FitzGerald, Jr.

ISSN 1683-7568
MILKFISH AQUACULTURE IN THE PACIFIC:
POTENTIAL FOR THE TUNA LONGLINE FISHERY BAIT MARKET
byWilliam J. FitzGerald, Jr.
Secretariat of the Pacific Community Aquaculture Section
Noumea, New CaledoniaApril 2004

2
© Copyright Secretariat of the Pacific Community, 2004
All rights for commercial / for profit reproduction or translation, in any form, reserved. SPCauthorises the partial reproduction or translation of this material for scientific, educational orresearch purposes, provided that SPC and the source document are properly acknowledged.Permission to reproduce the document and/or translate in whole, in any form, whether for com-mercial / for profit or non-profit purposes, must be requested in writing. Original SPC artworkmay not be altered or separately published without permission.
Original text: English
Secretariat of the Pacific CommunityBP D598848 Noumea CedexNew CaledoniaTel: 687 26.20.00Fax: 687 26.38.18Email: [email protected]://www.spc.int
Secretariat of the Pacific Community Cataloguing-in-publication data
FitzGerald, William J.
Milkfish aquaculture in the Pacific : potential for the tuna longline fishery bait market / byWilliam J. FitzGerald(Aquaculture Technical Papers / Secretariat of the Pacific Community)1. Milkfish – Oceania. 2. Tuna industry – Economic aspects. 3. Baitfish fisheries – Oceania.I. Title. II. Secretariat of the Pacific Community. III. Series.
639.3755 AACR2Agdex Pacific Islands 493/803ISBN 982-00-0024-6ISSN 1683-7568
This publication may be cited as:FitzGerald, William J. 2004. Milkfish aquaculture in the Pacific : potential for the tuna longlinefishery bait market. Noumea, New Caledonia: Secretariat of the Pacific Community.
Printed at SPC Headquarters,Noumea, New Caledonia

TABLE OF CONTENTS
INTRODUCTION . . . . . . . . . . . . . . . . . . . . . . . . . . . . . . . . . . . . . . . . . . . . . . . . . . . . . . . . . . . . . . .1
STATUS OF MILKFISH AQUACULTURE IN THE SPC PACIFIC ISLANDS . . . . . . . . . . . . . . . . .1
TUNA LONGLINE FISHERY OVERVIEW IN THE REGION . . . . . . . . . . . . . . . . . . . . . . . . . . . . .5
ASSESSMENT OF THE MARKET DEMAND FOR MILKFISH AS BAITFISH . . . . . . . . . . . . . . .10MILKFISH AS TUNA BAITFISH . . . . . . . . . . . . . . . . . . . . . . . . . . . . . . . . . . . . . . . . . . . . . . . . .11EFFECTIVENESS OF LIVE MILKFISH AS BAIT . . . . . . . . . . . . . . . . . . . . . . . . . . . . . . . . . . . .12ALTERNATIVE BAITS . . . . . . . . . . . . . . . . . . . . . . . . . . . . . . . . . . . . . . . . . . . . . . . . . . . . . . . . .15BAIT DEMAND . . . . . . . . . . . . . . . . . . . . . . . . . . . . . . . . . . . . . . . . . . . . . . . . . . . . . . . . . . . . . .15OPERATIONAL COSTS OF TUNA LONGLINE VESSELS . . . . . . . . . . . . . . . . . . . . . . . . . . . . .19
FINANCIAL ANALYSIS EXTENSIVE VS. INTENSIVE MILKFISH AQUACULTURE . . . . . . . . .21
CULTURE METHODS . . . . . . . . . . . . . . . . . . . . . . . . . . . . . . . . . . . . . . . . . . . . . . . . . . . . . . . . .21FINANCIAL ANALYSIS OF MILKFISH CULTURE AS BAIT . . . . . . . . . . . . . . . . . . . . . . . . . . .23HATCHERY FRY PRODUCTION . . . . . . . . . . . . . . . . . . . . . . . . . . . . . . . . . . . . . . . . . . . . . . . . .26
POTENTIAL NICHE MARKETS . . . . . . . . . . . . . . . . . . . . . . . . . . . . . . . . . . . . . . . . . . . . . . . . . .30
FUTURE TRENDS FOR MILKFISH AQUACULTURE IN THE PACIFIC . . . . . . . . . . . . . . . . . .34
CONCLUSIONS . . . . . . . . . . . . . . . . . . . . . . . . . . . . . . . . . . . . . . . . . . . . . . . . . . . . . . . . . . . . . . .36
ACKNOWLEDGEMENTS . . . . . . . . . . . . . . . . . . . . . . . . . . . . . . . . . . . . . . . . . . . . . . . . . . . . . . .37
LITERATURE CITED . . . . . . . . . . . . . . . . . . . . . . . . . . . . . . . . . . . . . . . . . . . . . . . . . . . . . . . . . . .37
APPENDIXES . . . . . . . . . . . . . . . . . . . . . . . . . . . . . . . . . . . . . . . . . . . . . . . . . . . . . . . . . . . . . . . . .47
APPENDIX 1. TERMS OF REFERENCE: . . . . . . . . . . . . . . . . . . . . . . . . . . . . . . . . . . . . . . . . .47
APPENDIX 2. SUMMARY OF COUNTRY RESPONSES . . . . . . . . . . . . . . . . . . . . . . . . . . . . .48
APPENDIX 3. TUNA LONGLINE VESSELS AND CATCH IN THE WESTERN CENTRAL
PACIFIC. . . . . . . . . . . . . . . . . . . . . . . . . . . . . . . . . . . . . . . . . . . . . . . . . . . . . . .52
APPENDIX 4. ASSUMPTIONS FOR CALCULATION OF BREAK-EVEN POINT TO OFFSET ADDITIONAL COST OF LIVE MILKFISH . . . . . . . . . . . . . . . . . . . .53
APPENDIX 5. ASSESSMENT & PLANNING MILKFISH AQUACULTURE . . . . . . . . . . . . . .54
APPENDIX 6. NARRATIVE OF FINANCIAL & ECONOMIC ANALYSIS: MILKFISH IN SPC REGION . . . . . . . . . . . . . . . . . . . . . . . . . . . . . . . . . . . . . . . . . . . . . . . . . . .56
APPENDIX 7. FINANCIAL ANALYSIS OF CULTURE METHODS FOR MILKFISH . . . . . . .61
APPENDIX 8. EVALUATION PROCESS OF ESTABLISHING A COMMERCIAL BAITFISH
FARM . . . . . . . . . . . . . . . . . . . . . . . . . . . . . . . . . . . . . . . . . . . . . . . . . . . . . . . . .62
APPENDIX 9. PROCESS IN ESTABLISHING A COMMERCIAL AQUACULTURE
OPERATION . . . . . . . . . . . . . . . . . . . . . . . . . . . . . . . . . . . . . . . . . . . . . . . . . . .64
APPENDIX 10. INTERNET SITES FOR SUPPLIERS OF FROZEN MILKFISH BAIT. . . . . . . .65
3

4
LIST OF TABLES
Table 1 2002 (except where noted *) domestic island tuna longline vessels, catch (MT) and CPUE (fish/100 hooks) (Lawson, 2003). 5
Table 2 Taiwan tuna longline fleet in the Pacific (David Chang, personal communication2003). 8
Table 3 Alternative bait comparison 15
Table 4 Assumptions used in estimation of regional tuna longline bait. 16
Table 5 Estimation of bait demand in SPC Region (excluding Indonesia, Philippines, Australia Domestic, and Japan Coastal from the SPC WCPO data) calculated by two methods based on data from the SPC Tuna Fishery Yearbook (Lawson 2003). 16
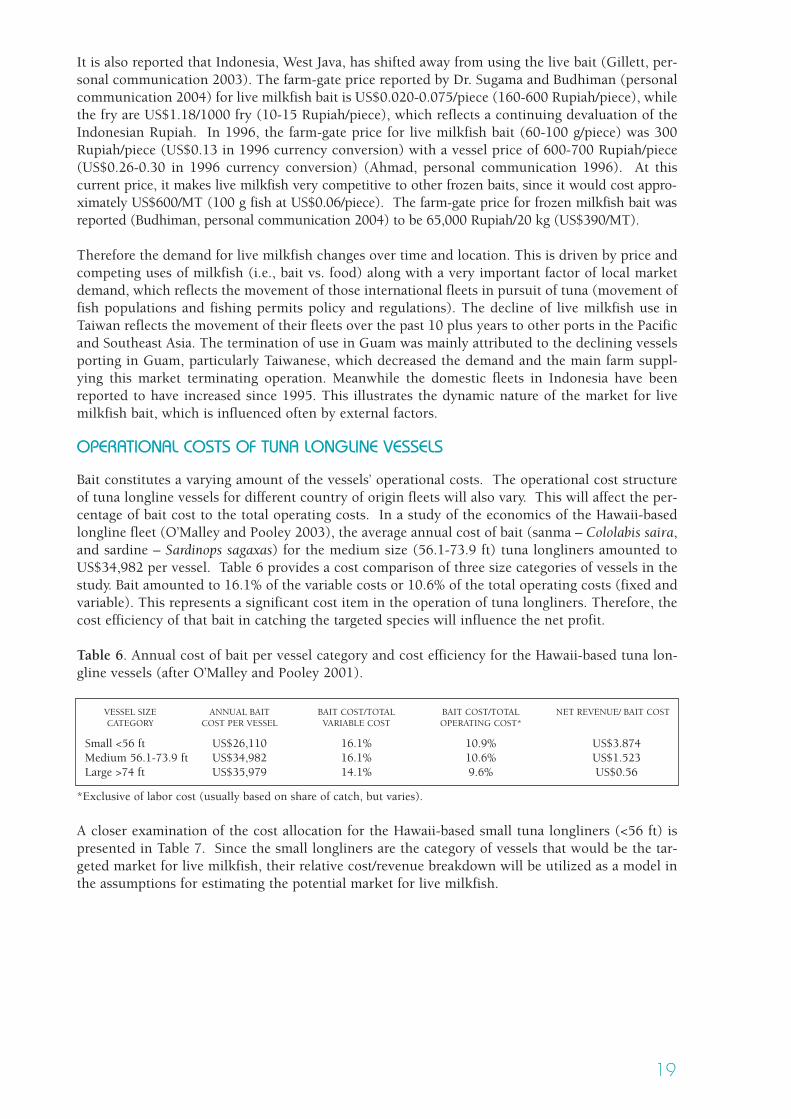
Table 6 Annual cost of bait per vessel category and cost efficiency for the Hawaii-based tuna longline vessels (after O’Malley and Pooley 2001). 19
Table 7 Hawaii-based small vessel size category (<56 ft) tuna longline costs in US$ (O’Malley and Pooley 2003). 19
Table 8 Operational characteristics of Hawaii-based small vessel category (<56 ft) of tuna longliners (O’Malley and Pooley 2003). 20
Table 9 Milkfish culture methods and production (after Lee and Banno 1990; Agbayani 2000). 22
Table 10 Summary of financial analysis for different milkfish culture methods for one-hectare area (US$) 23
Table 11 Production cost distribution for milkfish farms producing for the tuna longline bait market compared to milkfish production for food fish (Lee 1983). 24
Table 12 Cage culture of milkfish (food fish 3.5/kg) comparison of costs and area (Lopez, unpublished). Exchange rate based on 100 Philippine Peso = US$1.79(January 2004). 25
Table 13 Comparison of hatchery production costs (in US$) for fry from intensive and semi-intensive methods in Taiwan (Lee et al. 1997). 27
Table 14 Oceanic Institute, Hawaii, hatchery costs (in US$) for Pacific Threadfin (Polydactylus sexfilis) (Lotus et al. 2003). 28
Table 15 Frozen milkfish bait price (in US$) from Indonesia delivered to ports around thePacific (January 2004). Minimum order 40 ft. FCL (26 MT) in 10 kg box units. 33
LIST OF FIGURES
Fig. 1 Active tuna longline vessels (all nations) in the SPC region and the tuna catch over the period 1970-2002.
Fig. 2 Specially equipped live milkfish bait transport truck.
Fig. 3 Milkfish being loaded from the transport truck to bait well of a Taiwanese longlinerported in Guam.
Fig. 4 Break-even CPUE (catch as a percentage of hooks deployed) to offset additional cost of substituting 100% of the bait with live milkfish compared to that for frozenbait.
Fig. 5 Milkfish fry production and hatchery components.
Fig. 6 Annual total milkfish production from the three major producer countries (FAOYearbook 2001).
Fig. 3 Milkfish being loaded from the transport truck to bait well of a Taiwanese longliner ported in Guam.

INTRODUCTION
The Secretariat of the Pacific Community (SPC) initiated a study to assess the market potential ofmilkfish (Chanos chanos) and its culture for tuna longline bait in the region. The aim of this con-sultancy was to provide a regional assessment of the commercial viability for milkfish aquacultureto supply the baitfish market and other potential niche markets. The Terms of Reference for thestudy are included as Appendix 1.
The study addresses a component of the SPC 2002 Aquaculture Action Plan that sets direction forSPC’s regional aquaculture programmes. The goal of the Plan is to diversify economic activity thatwill benefit the region and lead to sustainable aquaculture development in the region and that con-siders social, economic and environmental factors.
STATUS OF MILKFISH AQUACULTURE IN THE SPC PACIFIC ISLANDS
Milkfish occur throughout the Indo-Pacific in tropical and subtropical waters with a distributionextending from the Red Sea and southeastern Africa to Mexico. They occur near coasts with fryentering lagoons, estuaries, mangroves, and nearshore waters. Their distribution is mainly limitedto waters with temperatures greater than 20ºC. With this wide distribution, there are geographicvariations reported with about nine major populations. Based on electrophoretic data there wasreported to be three distinct groups in the 1) Philippine, 2) equatorial Pacific (Palau, Kiribati,Fanning, Christmas Island) and 3) Tahiti and Hawaii (Winans 1980, 1985). Even within theHawaiian Islands there is reported to be a high level of endemism with the population around Oahudifferent from populations around Hawaiian Islands 320 miles away (Smith 1978; Winans 1980).
Milkfish is one of the most important aquaculture species in Indonesia, Philippines, and Taiwan.The cultivation of milkfish is reported to extend back over 700 years in Indonesia. It also has a longhistory of cultivation in many of the Pacific Islands. Characteristics of milkfish lends itself as anexcellent species for aquaculture, with wide environmental tolerances, abundant natural fry thatmigrate into coastal estuary areas, omnivorous with feeding behavior at a low trophic level, andrapid growth. In addition, the life history is well documented with hatchery technology well deve-loped that can use natural spawns or artificially induced spawns. The euryhaline characteristic ofthe species has allowed for its cultivation in a wide range of aquatic environments from inland fres-hwater lakes to ocean cages. Furthermore, it is tolerant to crowding, and is disease resistant. Thisprovides great flexibility in the cultivation of this species, which allows it to be adapted to almostany environmental situation in the SPC member countries.
Milkfish culture in the SPC Pacific Islands is limited to only a few islands currently culturing orhave a project in progress to culture milkfish. These islands mainly consist of Kiribati, Fiji, FrenchPolynesia, Guam, and Nauru. There have been some past attempts in FSM (Pohnpei and Yap),Palau, and Tonga. Recent reviews of the status of aquaculture in the SPC islands have been con-ducted as part of an effort by SPC to address the regional issues concerning aquaculture develop-ment (Adams et al. 2001; SPC 2002, 2003; Evans et al. 2003). Tanaka et al. (1990) conducted aregional workshop on milkfish culture in the Pacific, which included the status of milkfish culturein the SPC Islands.
A number of attempts have been made by governments and the private sector at aquaculture in theSPC region; however, only a few have proven profitable. The most notable are pearl culture mainlyin French Polynesia to shrimp in New Caledonia and Guam (includes products of milkfish, catfish,and other minor products) along with a mixture of success and failure in Fiji. There are also a fewsmall commercial aquaculture production farms among some other islands. In addition, there isproduction of seaweed in Kiribati.
5

6
Kiribati milkfish project for bait culture started in 1971 to supplement live bait for the pole-and-line fishery (Teroroko 1984; Garcia-Franco 1995; Wainwright and Dalley 1980; Tekinaiti 1990).There is limited use of fresh/frozen milkfish by the Fisheries Division’s longline vessels (SPC 2000).Production of baitfish in Kiribati dropped to insignificant amounts in 1996, but had been decliningsince 1986 with reduction and eventual termination of the pole and line tuna fleet, which was theprimary consumer of the bait in Kiribati. Even though milkfish in Kiribati is a valued food fish, thecurrent market for milkfish as a food fish is saturated locally. It is difficult to compete price wiseagainst other fishery products. This saturation of the local market makes it necessary to moreaggressively seek potential export markets to expand the market for the farm’s milkfish products.There is limited export of milkfish from Kiritimati (Christmas Island) to Hawaii (Preston 1992) forthe Filipino market along with exports that recently restarted (2002) to Nauru (from Tarawa ponds)are the only exploited export markets. The value added processing of smoked milkfish as an addi-tional product for the market assists in capturing a different market segment; however, at thecurrent AU$5.00/kg it is below the cost of the fresh product plus the expense of processing. It wasestimated that the product should be sold for AU$6.71/kg to cover the fresh fish (AU$2.50/kg price)and processing (Trachet 1989). There has been some discussion about focusing on live baitfish pro-duction for the Japanese longline fleet in Kiribati’s EEZ (Fisheries Division - MNRD Annual Report,1998); however, that has not materialized to date. The alternative is to find a suitable species to cul-tivate that could compliment the milkfish production.
Milkfish production at Kiribati’s Government operated Temaiku Farm on Tarawa has been relativelylow over its approximate 25 years of operation. This low production has been a point of study innumerous technical reports and assessments by various International organizations,government/private cooperative programs, and the Fisheries Division of the Ministry of NaturalResources Development over the years. Despite some optimistic projections of potential production(as high as 4,523 kg/ha/yr; Juario et. al. 1986a, 1986b) based on limited trials, the farm’s annual pro-duction remains within the range of 90 to 200 kg/ha/yr. In comparison to similar extensive systemin Taiwan, production ranges from 1,800 – 2,500 kg/ha/yr (Lee and Banno 1990). Utilizing the"lablab" method of extensive culture, which is similar to that utilized at the Temaiku Farm, thePhilippines averages 600-800 kg/ha/yr (Lee and Banno 1990). Extensive milkfish farms inIndonesia are somewhat lower, but averages range from 50 to 500 kg/ha/yr. The ponds at Temaikufall within the lower range of production of extensive ponds in Indonesia; even though, they didreach a high of 408 kg/ha/yr in 1986. Therefore, realistic production capacity given the constraintsof physical and actual operations along with variables of the market for milkfish (highly volatilebaitfish market); it would be expected that production will continue to fall within the range of 150-200 kg/ha/yr as it has over the past 10 years. Economic analysis of milkfish ponds on Tarawa hasbeen carried out previously (Uwate 1990, 1986; Uwate et al. 1986; Uwate and Teroroko 1986;Pollard 1988). The previous economic analysis of the Tarawa Temaiku Farm milkfish operationwere conducted for the years 1982, 83, 85, and 87 and found the operation did not break-even andhad a net loss of up to AU$76,348 (1987).
In Pohnpei, FSM, a private project to culture milkfish started in 1997. It intended to produce milk-fish for the live tuna longline bait market (mainly Taiwanese vessels porting in Pohnpei). However,the longline fleets were reluctant to purchase the product due to the relatively high price and thecost of converting bait wells to accommodate live bait on the domestic vessels (National FisheriesPolicy Study 1999). The farm had operational problems with production and marketing of the pro-duct. The farm has since stopped operation (Linsey 2002). A shortage of industry skills includingaquaculture, processing and marketing has been noted as a general problem in inshore fisheriesdevelopment (Anonymous-D, Undated).
Samoa (Western) has proposed a milkfish baitfish aquaculture project to partially replace importsof frozen baits for the domestic tuna longline fishery (Trade & Investment Promotion Unit 2000).This includes a preliminary economic analysis of milkfish baitfish production to serve 300 smalllongline vessels that are crewed by 1,000 fishermen utilizing the following criteria. The albacoreexport value from this fishery is reported to be more than WST$30 million (US$10,604,454).

Current bait requirement for the longline fisheries is 600 MT/year (frozen pilchards/sardines),which is imported at a cost of WST$1.5 million (US$530,223) and sold to the fishery at WST$5million (US$1,767,409). The imported cost per piece is WST$0.12 (US$0.04) with a vessel price ofWST$0.40/piece (US$0.14). The targeted price for the live milkfish is WST$0.60/piece (US$0.21).The cultivation of milkfish would be in earthen ponds (4-ha). Their objective is to capture appro-ximately 30% of the total bait market with a production of 3.5 million pieces. Fry are proposed tobe imported from Taiwan. Their projected annual return on the proposed 4-ha farm isWST$253,000 to 284,000 (US$89,431-100,389) after the first 2-years of operation. However, thegrow-out production criteria and pricing used in the projections are optimistic.
American Samoa recently received a grant through the Native American Act for US$77,000 to deve-lop a community-based aquaculture project that will partially focus on milkfish as live bait for thelocal tuna longline industry (Gabbard 2001). An unreleased FAO study of potential milkfish cul-ture in Palau was done in 2001. Fry are collected from the wild. There are two small milkfish ope-rations in Palau (Koror and Peleliu); however, there is no interest in milkfish farming in Ngchesar,Ngatpang, and Angaur (Isamu 2003). Early assessments of milkfish culture in French Polynesia(Tokoragi 1976; Brown 1976) indicated abundance of wild fry stock and the potential for expandedculture in natural ponds and construction of extensive areas of ponds. Penrhyn, Cook Islands,milkfish ponds are generally privately owned and are cultured mainly for special celebrations (SPCUndated). Milkfish is prized in Nauru as a food fish and has a history of being cultured up to theearly 1970’s when introduced tilapia (1960’s) became a problem that hampered milkfish production.An eradication program was initiated in 1979 by UNDP and FAO (Ranoemihardje 1981). Naururecently (2002) started importing fry from Tarawa for grow-out. Prior to that they imported cultu-red fresh milkfish from Tarawa and Guam.
A FAO study examined the potential of milkfish farming in Fiji (Dela Cruz 1997). It provided apreliminary fry assessment and recommendation for cultivation methods. The Fiji Islands Trade &Investment Bureau (Anonymous-C 2001) has done an investment opportunity in milkfish farmingprofile that targets production for tuna live bait. In 1999, 44.5 MT of milkfish bait was harvestedfor the tuna longline fleet (40 vessels). They were targeting live bait for the local market and fro-zen bait as an export product. Live milkfish bait was sold at US$1.15/kg, which is lower than thedomestic Taiwan price for live milkfish bait. Fiji has a proposed community based milkfish farmingproject, which is for small scale production of milkfish as bait for bottom fishing initially and lateras food and then bait for tuna fishing (Tanaka, personal communication).
Guam has been culturing milkfish since the early 1970’s. Commercial farms continue to culturemilkfish as a food product for the domestic fresh fish market where it competes with frozen importsfrom the Philippines and Taiwan. Production in recent years has decreased with high quality lowpriced blast frozen product from Taiwan. The decline in market share started in the early 1990’swhen Taiwan experienced major shrimp disease problems. Shrimp pond production in Taiwan waspartially shifted to milkfish and exports increased into the Guam market. Production of milkfishfor the tuna longline bait market initiated in the early 1990’s (FitzGerald 1995, 1996) reaching apeak in the mid-90’s and has since ended in the 2001-2002 period (Lim, personal communication2004).
Information on the current status and past experience with culturing milkfish, the Islands’ expe-rience at using milkfish as bait, along with the current bait used by tuna longline fleets porting inthe respective islands was requested of all SPC Island members. The majority of the islands res-ponded and in those cases where there was no response information was obtained from other sour-ces where possible. The responses are summarized in Appendix 2.
7

TUNA LONGLINE FISHERY OVERVIEW IN THE REGION
Fisheries serve as the major natural resource in most of the SPC Islands with commercial fisheriesa major economic activity and foreign exchange earner in some of the islands. This has been mostimpacted by the growth of foreign industrial fishing fleets in the region over the past 50-years. Thishas been particularly noticeable for longline fleets in the past 25-years, which has been driven bythe sashimi market. Dalzell et al. (1996) cites less than 7% of the region’s tuna is caught by PacificIsland vessels with only 25% of the region’s catch processed within the Islands. Gillett (2003) iden-tifies the Pacific Island domestic fishing fleets consisting of 14 pole-and-line vessels, 40 purse sei-ners, and 495 longliners. Table 1 provides information on the domestic tuna longline vessels andcatches for 2002 by Island country. Hampton and Williams (2003) note the recent significant chan-ges in the longline fisheries in the past 20-years with a change in targeting practices of fishing dee-per in the 1980’s to catch bigeye tuna to obtain the higher price of bigeye tuna compared to yellow-fin. In the 1990’s there was a gradual development of domestic fleets in the Pacific Islands (Samoa,Fiji, French Polynesia, New Caledonia and Solomon Islands) with albacore the main targeted spe-cies. They also noted the entrance and subsequent decline of the smaller sashimi longliners ofTaiwan and mainland China based in Micronesia during the past decade. This latter point and theshift in targeting to bigeye tuna is of particular impact on the live milkfish market as tuna longlinebait, since these are the vessels that are the main users of live milkfish. The shift towards bigeyeand away from targeting yellowfin also impacts on the potential live bait market; since live bait isprimarily used in the shallower sets that target yellowfin. Furthermore, it should be noted fromTable 1 that the majority (56%) of the tuna catch by domestic island tuna longline vessels is alba-core. The effectiveness of live bait over frozen for albacore has not been documented anecdotallyor from trials as it has for yellowfin with the exception of a very limited trial by NMFS (Ostrowskiet al. 1999). Their limited trial indicated a preference for live bait by albacore.
Table 1. 2002 (except where noted *) domestic island tuna longline vessels, catch (MT) and CPUE(fish/100 hooks) (Lawson, 2003).
The number of tuna longline vessels actively fishing in the Western and Central Pacific Ocean hasincreased 33% over the 32-year period since 1970 (Figure 1 and Appendix 3). This number of ves-sels fluctuates year to year (slight decrease of 0.87% in the most recent 5-year period); however, thecurrent level is considered to represent a relatively mature industry with further significant regio-nal expansion unlikely. The management and conservation of the resource for future generationswill form an upper limit. The composition of the fleets may change over time with country of ori-gin comparative costs varying and impacting the competitiveness of fleets along with the shift inlocation of fishing resources around the Pacific by foreign fleets and technological changes.
8
SPC MEMBER LONGLINERS ALBACORE TUNA FINE TUNAISLANDS COUNTRIES ACTIVE TUNA BIG EYE YELLOW
Catch CPUE Catch CPUE Catch CPUE Catch CPUE
American Samoa 60 5,944 2.58 196 0.09 484 0.15 7,112 3.7Cook Islands 16 879 2.75 66 0.16 49 0.12 1,118 3.57Federated States 25 0 0 658 0.39 167 0.09 865 0.51of MicronesiaFiji 101 8,026 1.52 853 0.11 2,027 0.24 16,472 2.32French Polynesia 54 4,557 1.59 649 0.16 507 0.12 7,402 2.65Kiribati* 1 0 0 0 0 0 0 0 0Marshall Islands* 4 0 0 13 18 32New Caledonia 25 1,165 1.45 189 0.09 572 0.4 2,211 2.3Papua New Guinea 50 136 0.14 324 0.25 1,738 1.13 3,819 2.36Samoa 114 4,360 2.64 153 0.09 388 0.2 5,359 3.53Solomon Islands 8 115 370 371 870Tonga 35 1,199 1.1 219 0.14 262 0.2 1,957 1.72Vanuatu 13 225 1.64 20 0.09 107 0.4 428 2.76TOTAL 506 26,606 3,710 6,690 47,645
TOTAL

Figure 1. Active tuna longline vessels (all nations) in the SPC region and the tuna catch over theperiod 1970-2002.
The major fleets in the SPC region are foreign vessels mainly from Taiwan, Korea, Japan, and China.Some of the SPC regional countries have a sizeable domestic based fleet. These consist of Samoa,Fiji, American Samoa, French Polynesia, Papua New Guinea, Tonga, with smaller fleets inFederated States of Micronesia, New Caledonia, Cook Islands, Vanuatu, Solomon Islands, andMarshall Islands as noted in Table 1. Of the fleets in the region, the Taiwanese vessels have been themost active in utilizing live milkfish as bait. Frozen milkfish as bait is used by all of the foreign fle-ets to a varying extent. There are three kinds of Taiwanese longliners operating in the Pacific region(David Chang, personal communication 2003). They are distinguished by size, equipment, targetedspecies/product, and the type of bait they use.
• Small tuna longliners or fresh tuna longliners – usually use frozen squid and milkfish (fro-zen and live) and spotted chub mackerel as bait. It is estimated that about 3,500 tons of fro-zen squid and 1,000 tons of milkfish (frozen and live) are used per year.
• Traditional tuna longliners or Albacore longliners – usually use frozen saury and frozensardines as bait. Albacore longliners use around 10,000 tons of frozen saury and 2,000-3,000 tons of sardines per year.
• Ultra low temperature longliner – usually use sardines, mackerel scad, frozen milkfish,spotted chub mackerel and squid as bait. They use more than 15,000 tons of bait per yearconsisting of 10,000 tons of squid and 500-700 tons of frozen milkfish.
Taiwan tuna longliners consume at least a total of 25,000 MT of bait per year (various types ofbait). Table 2 summarizes the use of types of baits by the vessel categories of the Taiwanese fleetsin the Pacific.
9
0
1 000
2 000
3 000
4 000
5 000
6 000
1970 1975 1980 1985 1990 1995 2000
Year
Nu
mb
er
of
Ac
tiv
e V
es
se
ls
0
20 000
40 000
60 000
80 000
100 000
120 000
Lo
ng
line
Cat
ch (
ton
nes
)
Active VesselsAlbacoreBig-eyeYellowfin

Ves
sel
Nu
mbe
r of
A
vera
ge #
A
vera
ge #
A
ctu
al f
ish
ing
Len
gth
of
each
Ty
pe o
f ba
itSi
ze o
f ba
itA
vera
ge
Qu
anti
ty o
f ba
it/
cate
gory
vess
els
oper
atin
g of
hoo
ks/s
ets
of s
ets/
trip
days
per
tri
pfi
shin
g tr
ip(s
ourc
e)pr
ice
of b
ait
Ves
sel
cate
gory
/YR
in t
he
Pac
ific
*
Smal
l 15
0-20
01,
500-
1,60
08-
208-
2020
-40
days
Squ
id, S
pott
ed
Squ
id 4
8 pi
eces
/10k
g;
Squ
id U
S$1,
000
3,50
0 to
ns
of f
roze
nlo
ngl
iner
sch
ub
mac
kere
l,Sa
ury
110
-130
pie
ces/
10kg
; -1
,200
/mto
n;
squ
id a
nd
500-
600
and
Mil
kfis
hM
ilkf
ish
-Fro
zen
M
ilkf
ish
-Fro
zen
to
ns
of m
ilkf
ish
(fro
zen
& l
ive)
45-5
0 pi
eces
/10
kg
US$
800-
1,00
0(f
roze
n),
an
d(I
ndo
nes
ia);
/m
ton
400-
500
ton
s of
20
-22
Mil
kfis
hM
ilkf
ish
-Liv
e m
ilkf
ish
(li
ve)
met
ers
Liv
e 16
7-25
0 pi
eces
/10
kg
US$
0.20
-0.2
5/ar
e u
sed
per
in l
engt
h(l
ocal
ly s
ourc
ed)
piec
e or
US$
2,50
0ye
arC
hu
b m
acke
rel
45-5
0-4
,000
/mto
n;
piec
es/1
0kg
Ch
ub
mac
kere
l (D
omes
tic-
Taiw
an, C
hin
a);
US$
600-
700/
mto
n(C
hin
a), U
S$80
0-1
,000
.mto
n(d
omes
tic)
;
Trad
itio
nal
/ 40
-50
4,00
0-4,
400
120-
180
4-6
mon
ths
6-8
mon
ths
Sau
ry a
nd
Sau
ry 1
10-1
30
Sau
ry U
S$1,
000
10,0
00 t
ons
of
Alb
acor
e Sa
rdin
espi
eces
/10k
g;-1
,000
/mto
nfr
ozen
sau
rySa
rdin
e 50
-60
piec
es/5
kg(d
omes
tic
sou
rce)
and
2,00
0-(S
outh
Afr
ica,
USA
, Mex
ico)
US$
1,10
0-1,
200
3,00
0 to
ns
of
40-4
5 /m
ton
(Ja
pan
sa
rdin
es p
er y
ear
met
ers
sou
rce)
; Sar
din
e in
len
gth
U
S$90
0-1,
000;
ton
Ult
ra L
ow
60-7
02,
200-
2,50
018
0-24
06-
8 m
onth
s9-
12 m
onth
sSa
rdin
es,
Squ
id 4
8 pi
eces
/10
kg;
Squ
id U
S$1,
000
Mor
e th
an 1
5,00
0L
ongl
iner
sm
acke
rel
scad
,C
hu
b m
acke
rel
45-5
0-1
,200
/mto
n;
ton
s af
bai
t pe
rfr
ozen
mil
kfis
hpi
eces
/10k
g (D
omes
tic-
mac
kere
l sc
adye
ar c
onsi
stin
g of
50-5
5 sp
otte
d ch
ub
Taiw
an, C
hin
a); S
ardi
ne
US$
1;30
0-1,
500
10,0
00 t
ons
of
met
ers
mac
kere
l an
d50
-60
piec
es/5
kg/m
ton
, Sar
din
esq
uid
, 4,5
00-5
,000
in l
engt
hsq
uid
(Sou
th A
fric
a, U
SA, M
exic
o);
US$
900-
,000
mto
nm
ton
s sa
rdin
es/
Mac
kere
l sc
ad 6
0-70
pie
ces
Ch
ub
mac
kere
lm
acke
rel,
and
500-
/10k
g (I
ndo
nes
aa a
nd
US$
600-
700/
mto
n70
0 to
ns
of f
roze
n
Vie
tnam
); M
ilfi
sh-F
roze
n(C
hin
a), U
S$80
0m
ilkf
ish
45-5
0 pi
eces
/10k
g-1
,000
. mto
n(I
ndo
nes
ia);
(dom
esti
c);
10
Tabl
e 2.
Tai
wan
tu
na
lon
glin
e fl
eet
in t
he
Pac
ific
(D
avid
Ch
ang,
per
son
al c
omm
un
icat
ion
200
3).
*th
ere
is a
n u
nkn
own
nu
mbe
r o
f “f
lag
of c
onve
nie
nce
” tu
na
lon
glin
ers
incl
udi
ng
all
type
s of
tu
na
lon
glin
ers
oper
ated
by
Taiw
anes
e in
th
e P
acif
ic

Japanese tuna longliners (50-100 GT) utilize frozen baits and average 35-45 MT of bait per vesselper year. They use sets of 2,200-2,500 hooks, 15-day trips, and approximately 15 trips per year (M.Honda – FFA, personal communication).
Bait is an important component of tuna longline vessels’ operation. The bait must be readily avai-lable, an effective bait for the targeted species of tuna, and economical. The dependence on cat-ching bait for fisheries such as the pole-and-line tuna fishery required often a major expenditure oftime and cost (Gopalakrishnan 1976). It also has had a negative impact on some of the targetedwild bait species. Most bait for current tuna longline operations in the Pacific Islands is importedfrozen from a number of sources including, Taiwan, South Africa, New Zealand, Australia,Philippines, Vietnam, and the US. Desirable characteristics of bait for tuna longline fishery inclu-de the following (Yuen 1977; Smith 1977).
• Size• Color• Effective catch rate of targeted species• Low cost• Consistent and reliable availability in quantity required
Factors affecting tuna longline catch ability is summarized by Bach, et al. (2003).
• Bait type and quality• Soaking time• Fishing effort at the operational level• Trophic level of the environment• Maximum fishing depth or the strategy of the gear deployed according to the fishing ground
The pole-and-line fishery typically uses live bait. Characteristics of desirable bait by this fishery areidentified as follows (FAO 1983; Gopalakrishnan 1976).
• Survival in bait tanks (resistance to handling)• Easy handling by the chummer• Favorable behavior when chummed – habit of returning to the vessel’s side and not diving
deep when attacked by tuna• Size as related to the tuna encountered – 5 to 10 cm in length• Body form• Color and color pattern• Adequate luster• Quick action• Fishermen acceptance• Availability
11

ASSESSMENT OF THE MARKET DEMAND FOR MILKFISH AS BAITFISH
The potential benefits to the SPC Islands of milkfish aquaculture as a bait include increased econo-mic activity that utilizes endemic natural resources to provide employment opportunities, diversi-fication of economic activity, increased foreign exchange (either through savings on imported baitsor export of the product on foreign longline vessels), while enhancing off-shore capture fishery pro-duction per unit effort. It has the potential of benefiting the further development of both fisheriesand aquaculture industries. In addition, it can assist in conserving populations of natural wild baitsfrom over exploitation in the waters of the SPC region.
MILKFISH AS TUNA BAITFISH
Three basic areas identified by Hester (1974) for the aquaculture of tuna baits (pole-and-line or lon-gline), whether the bait use is as live or dead bait, consist of acceptability of the bait, production insufficient quantities to support a fleet of vessels, and to produce it at a competitive cost. Milkfishhave proven over time to successfully address these hurdles as an aquaculture produced bait. Someof the attributes of milkfish as live bait include the following.
• Wide tolerance to environmental conditions,• Hardy and tolerant to crowding,• Survive well the hooking process so that recovered bait from sets are often alive and can be reused,• Indigenous species to Indo-Pacific,• Established aquaculture technology for grow-out methods and fry production, and• Improvement in tuna catch rate (mainly yellowfin tuna).
Live milkfish have been mainly used by Taiwanese vessels. However, Indonesian and Philippinelongliners also use live milkfish occasionally. Figures 2 and 3 show the transport and loading pro-cess of live milkfish on a tuna longliner ported in Guam. In Indonesia, they are often transportedin sealed plastic bags filled with water and oxygen. The decision to use live milkfish over alternati-ve bait is dependent on a number of factors. The key factors include the following.
• Attitude and experience of the vessel captain with live baits.• Capability of vessel to hold live bait.• Consistent availability of live milkfish.• Quality of the live milkfish (size, health, pre-acclimated to saltwater).
• Price of the live milkfish compared to other alternative baits.Figure 2. Specially equipped live milkfish bait transport truck.
13

Figure 3. Milkfish being loaded from the transport truck to bait well of a Taiwanese longliner ported in Guam.
Live milkfish that are used for tuna longline bait are usually 12-15 cm in length (approx. 40-60g/piece); however, they are used up to 100 g in size. Indonesian vessels tend to use a larger size 14-16 cm (60-100 g/piece) live milkfish bait for their tuna longliners. Live milkfish is more effectiveat catching tuna, particularly yellowfin tuna, when compared to other standard baits including fro-zen milkfish. It is reported that the catch will be up to double (100% increase) with live milkfishover that of other standard baits (David Chang, personal communication 2003). The price can bea deterrent in the use of live milkfish. For example, in Taiwan the cost is usually US$0.20 -0.25/piece, which means one ton of live milkfish would cost up to US$4,000-6,000, but is usuallyreduced to US$2,500-4,000 in quantity (David Chang, personal communication 2003). However,one ton of frozen milkfish (70/80 pieces/10 kg) is about US$700-900 depending on the marketsupply in Taiwan.
Live milkfish bait is mainly used by the smaller class of Taiwanese longliners. However, all size ves-sels use frozen milkfish as part of the baits utilized. The size of milkfish bait varies by whether itis used as live bait or frozen, price, and preference of vessel captains. For frozen milkfish,Taiwanese captains prefer a size of 150-200g/piece, but will accept 125-150 g/piece when the priceon the larger size is high. Japanese captains prefer a size 100-120 g/piece for the frozen milkfish.
Live milkfish is rarely used as the sole bait in a set. Live bait is normally dispersed with frozen bait(various types) at a varying ratio of 20-40% live bait. This live bait is normally used on the hooksnearest the floats (shallower) as described by FitzGerald (1996). This provides the increased effec-tiveness in CPUE, while lowering total bait cost.
EFFECTIVENESS OF LIVE MILKFISH AS BAIT
Live milkfish as tuna bait has been documented in numerous studies (Samarakoon, 1972;Ostrowksi et al. 1999; Ostrowski 1999; Okuhara 2000), but most information is anecdotal frompractical experience in the use of the bait by mainly Taiwanese tuna longliner captains, but alsoIndonesian and Filipino longliners. Lee and Bano (1990) cite a 4-7% CPUE with the use of livemilkfish as tuna longline bait. This represents a 200-400% increase in catch over that obtained byfrozen baits.
A limited trial comparing live milkfish versus frozen squid as tuna longline bait (Ostrowski et al.1999; Ostrowski 1999), resulted in a 64% increase in catch with the use of live milkfish over thesquid when the longline set employed one third of the bait as milkfish grouped at either the begin-ning, middle, or end of the line. This would indicate a 31% increase that the presence of live milk-fish improves the overall catch even on the non-milkfish portion of the set. However, this increasewas 116% over sets that used squid only. This affect has been noted previously (FitzGerald 1996).In another limited series of trials of the effectiveness of live milkfish as tuna longline bait
14

(Ostrowski 1999), a comparison of live milkfish and dead sanma (US$18/10kg box 120g fish) wasmade. Initial results indicated a 2.6 times higher (260%) catch rate than sanma. The findings alsonoted a preference for the live bait by yellowfin and albacore, while the targeted bigeye displayedno preference. The Hawaii private longline vessel owner that participated in the trial commentedon the exceptional hardiness of the live milkfish bait (Cook, personal communication). The livebait was often reused, since they were still in good condition after sets to depths of approximately156 m. Some of the difficulty in the use of the live bait was identified as shore side problems oftransporting the bait from the farm to the boat. He indicated dockside tanks or better transportsystem would be needed. The reluctance of captains to try new bait over the commonly used baits(sardine @ US$14/10 kg and sanma @ US$18/10 kg) and the lack of live bait wells on most Hawaiibased longline vessels discouraged further use of the live bait and trials. The experience of fisher-men was noted by Sharma and Leung (1999) as a strong contributing factor in the longline vessels'technical efficiency.
A brief study of the catch efficiency of using live milkfish compared to frozen jack mackerel as lon-gline tuna bait was conducted by the Fishery Experiment Station of Kagoshima (Okuhara 2000).The catch results were 3 bigeye and 3 longfin tunas caught using 1,825 frozen jack mackerel, whilethe use of 117 live milkfish (20 cm length) caught 7 bigeye and 6 longfin tunas plus 5 other spe-cies (not specified). This gives a hook rate using frozen jack mackerel of 0.33%, which is belowindustry standard (1-3%). Live milkfish produced a hook rate of 15.4% (including by-catch or11.1% for targeted tuna), which is substantially higher than the industry standard. Even though,this was a limited trial without controls and replication the results further confirm the substantialcatch advantage of live milkfish. It should be noted that the live milkfish were larger (20 cm) com-pared to the size normally used by Taiwan fleets (12-15 cm or 40-60 g).
Targeted tuna species are characterized by tuna longliners fishing at different depths, with modera-te depths of 100-250 m targeting albacore and yellowfin while deeper depths of 250-400 m targetbigeye tuna (Harramoto 1976; Boggs, 1992). This influences bait selection, since the live milkfishis used only for the moderate depths. As previously mentioned, there has been shift in the targetedspecies (deeper sets) to a greater proportion of the catch being bigeye than yellowfin, since bigeyeare usually higher priced.
Use of fresh/frozen milkfish (80-100 g/fish) as tuna longline bait has been documented in trials con-ducted in Kiribati (Sokimi et al. 2001). Milkfish were shown to be an effective bait with CPUE forthe combined sets of 0.95%. Wellington (in Sokimi et al. 2001) found fresh milkfish to have a betterCPUE than frozen milkfish; however, saury was superior by a factor of two over the dead milkfish.
Making assumptions on the average size of primary species of tuna caught (yellowfin and bigeye),their average price, hooks per set, number of sets per trip, size of frozen bait, size of live milkfish,cost of frozen bait, and cost of live milkfish, estimations can be made of the increase in catch requi-red to offset the price difference between live milkfish bait and that of an alternative frozen bait(Appendix 4). Figure 4 provides a break-even point chart utilizing these assumptions showing fiveCPUE scenarios with the CPUE point to compensate for the additional cost of live milkfish overthat of frozen bait. The percent increase in the CPUE to offset the total substitution of live milk-fish for frozen bait ranges from 7.1-16.6%, which is well within the reported percentage increase intotal catch when live milkfish are used. As previously mentioned, in the practical use of live bait,it is usually a mixture of frozen and live bait that produces the reported increases in catch. Takingthis into consideration, it would reduce the use of live bait to 20-40% of the total bait used(FitzGerald 1996). This would reduce the actual cost of utilizing live bait. Incorporating that intothe calculation, it would reduce the percent increase in CPUE needed to offset the portion of thetotal bait utilized as live milkfish to 1.4-6.7%. This is with the assumption that there is no reuse ofbait, which in practical use is often done with the live milkfish. Reuse of live milkfish would redu-ce the bait requirement per trip and subsequently the cost.
15

Figure 4. Break-even CPUE (catch as a percentage of hooks deployed) to offset additional cost ofsubstituting 100% of the bait with live milkfish compared to that for frozen bait.
ALTERNATIVE BAITS
A comparison of commercially available competitive baits to that of milkfish are listed in Table 3with specifics on size and price along with general application for species of tuna. Price of live milk-fish will be a major determinant of its use by tuna longline vessels as bait. It will have to be reaso-nably competitive to alternative baits. Live milkfish does have the advantage of a higher catch ratethan other baits so this will allow for a certain premium in price over other baits. However, this ismainly applicable to the catch of yellowfin tuna. Therefore, when bigeye is the targeted tuna spe-cies a premium will not be paid, since it is not the preferred bait.
Table 3. Alternative bait comparison.
Note: The frozen milkfish high price is based on the farm gate price in Kiribati.
16
0.75%
1.00%
1.25%
1.50%
1.75%
0.87%
1.12%
1.37%
1.62%
1.87%
0.00%
0.20%
0.40%
0.60%
0.80%
1.00%
1.20%
1.40%
1.60%
1.80%
2.00%
1 2 3 4 5
CPUE SCENARIO
CPU
E
CPUE With F rozenBait
CPUE to Cover CostDifference in LiveMilkfish
BAIT SPECIES ACCEPTABLE PRICE PRICE APPLICATION FORSIZE RANGE Per MT Per Piece SPECIES OF TUNA
Live Chanos chanos 40-60 g/piece US$4,200-5,000 US$0.20-0.25 Mainly Yellowfin, used Milkfish bigeye secondary:
in shallow sets. Can be used for albacore
Frozen Chanos chanos 100-200 g/piece US$800-1,000 US$0.08-0.20 Yellowfin, bigeye, albacoreMilkfish
Squid Teuthoidae (order) 175-225 g/piece US$1,000-1,200 US$0.18-0.27 Yellowfin, bigeye, albacore
Spotted Chub Scomber 200-225 g/piece US$600-1,000 US$0.12-0.23 Yellowfin, bigeye, albacoreMackerel australasicus
Mackerel Decapterus 140-170 g/piece US$1,300-1,500 US$0.18-0.26 Yellowfin, bigeye, albacoreScad; macarellus,Muro-aji D. maruadsi
Iwashi Sardina 120 g/piece US$990 US$0.10-0.12 Yellowfin, bigeye, albacorepilchardus
Sardines Sardina sp., 80-110 g/piece US$900-1,100 US$0.07-0.12 Yellowfin, bigeye, albacoreSardinella sp., Sardinops sp
Sanma Cololabis saira 120 g/piece US$1,800 US$0.21-0.22 Yellowfin, bigeye, albacore
Sauri Cololabis sp. 80-90 g/piece US$2,883 US$0.23-0.25 Yellowfin, bigeye, albacore

There has been some work done on developing artificial baits for tuna longline fishing (Januma etal. 1999; Januma et al. 2003). It has a poorer catch rate than traditional natural baits, but it repre-sents a potential option in the future, if the catch rate can be improved.
BAIT DEMAND
The market demand for bait in the SPC region is substantial. The current supply is mainly fromoutside the region. Therefore, the replacement of a portion of these imports with production fromregional countries would provide potential economic benefits to the region.
The estimation of the demand for bait from the tuna longline fishery can be calculated a couple ofways utilizing known data along with making some assumptions (Table 4). The most direct appro-ach is determining the average number of hooks/set, number of sets per trip, and the number oftrips/year. This value multiplied by the number of active vessels operating in the region would pro-vide the number of pieces of bait required (assuming one bait per hook and no reuse of bait).Another method would be utilizing the catch data, average size by fish (species specific), and thehook rate. Utilizing the two methods, the conservative demand in the Western Central Pacific Ocean(WCPO) is estimated at 567 to 914 million pieces of bait or 56,743 MT to 91,368 MT (assuming ave-rage bait size of 100 g/fish) for 2002. The estimated values (Table 5) for the approximate SPC Regionarea within the WCPO are 486 to 693 million pieces of bait or 48,638 MT to 69,264 MT for 2002.
Table 4. Assumptions used in estimation of regional tuna longline bait.
Table 5. Estimation of bait demand in SPC region (excluding Indonesia, Philippines, AustraliaDomestic, and Japan Coastal from the SPC WCPO data) calculated by two methods based on data fromthe SPC Tuna Fishery Yearbook (Lawson 2003).
17
ASSUMPTION USED FOR ESTIMATION OF BAIT DEMANDASSUMPTIONS
Average Weight per Fish (all species - AWAF 30Hook rate (percent) HR 1,25%Hook per set HS 1500Number of Sets per Trip ST 10Trips per Year TY 12Bait Size/fish (g) BS 100
METHOD 1 - BASED ON CATCH METHOD 2 - BASED ONVESSEL OPERATION
(Catch x 1000)/AverageSPC TUNA YEARBOOK DATA Weight per fish)/HR Vessels x HS x ST x TY
ESTIMATION OF BAIT DEMAND ESTIMATION OF BAIT DEMAND(PIECES) (PIECES)
TOTAL MT ESTIMATEDCATCH OF BAIT
TUNA ESTIMATED ESTIMATED DEMAND(Albacore, TOTAL BAIT WEIGHT OF FOR ESTIMATED
NUMBER OF Big-eye, DEMAND PER BAIT LONGLINERS WEIGHT OF BAITYEAR VESSELS yellowfin) YEAR (MTONS) PER YEAR (MTONS)
1990 2,730 141,975 378,600,000 37,860 491,400,000 49,1401991 2,411 114,145 304,386,667 30,439 433,980,000 43,3981992 3,565 142,643 380,381,333 38,038 641,700,000 64,1701993 3,964 133,364 355,637,333 35,564 713,520,000 71,3521994 4,200 156,657 417,752,000 41,775 756,000,000 75,6001995 4,031 143,622 382,992,000 38,299 725,580,000 72,5581996 3,584 130,643 348,381,333 34,838 645,120,000 64,5121997 3,982 139,696 372,522,667 37,252 716,760,000 71,6761998 3,813 155,991 415,976,000 41,598 686,340,000 68,6341999 3,744 138,880 370,346,667 37,035 673,920,000 67,3922000 3,700 151,859 404,957,333 40,496 666,000,000 66,6002001 3,815 158,995 423,986,667 42,399 686,700,000 68,6702002 3,848 182,392 486,378,667 48,638 692,640,000 69,264

The demand for live milkfish as bait for the tuna longline fleets has been reported to be decreasingin recent years in Taiwan. Taiwan based longline fleets has decreased their usage of live milkfishby 20-30% in the past 5-years (David Chang, personal communication). Lee (1983) indicated thatthe demand for milkfish as bait in Taiwan was leveling off in the early 1980’s, which constrainedfurther growth in the industry. The shift in fleet resources to other locations in the Pacific has con-tributed to the decline in live milkfish use in Taiwan. In addition, the high comparative price oflive milkfish plus the added handling has made the live bait less attractive despite the improvedcatch rate. The tuna longline fleets porting in Guam no longer utilize live milkfish from the domes-tic aquaculture industry (Harris, personal communication 2003; Camacho and Lim, personal com-munication 2003). The Guam fleets stopped purchasing the live bait in 2001-2002. The main farmthat was supplying the milkfish, which was a subsidiary of a tuna longline agent, switched produc-tion to tilapia and marine shrimp; however, the parent owner of the farm has since decided to closethe farm at the end of 2003. Some of the reasons provided for this decline in the use of live milk-fish as bait are as follows:
• The decline in longliners porting in Guam (increase in fuel prices and new policies on immigration).
• Relocation of fleets around the Pacific (particularly the Taiwan fleets).• Price of bait compared to other bait options.• Reliable and consistent supply was not always available.• Prevalence of yellowfin in the catch with use of milkfish live bait (prefer bigeye).• Decline in Japanese economy (reducing the market size and price for high end fresh tuna).• Problems with restrictions in fishing permits that have impacted operational efficiency and
costs forcing vessel captains to reduce expenditures (e.g., bait cost).
Naamin (1993) noted a tendency of a fishing strategy shift by the Taiwanese 50 GT longliners fromusing live milkfish bait targeting yellowfin tuna to the use of frozen bait targeting bigeye tuna.During the period of 1990-92, Naamin (1993) reported that most of the Taiwanese longliners anda few Japanese longliners of the 50 GT category in Indonesia tended to use live milkfish as bait withyellowfin as the targeted tuna. The catch consisted of 80-90% of yellowfin (20-40 kg). Since 1993this has been changing to vessels using frozen bait (e.g., milkfish, scad, and squid) that targetedbigeye tuna (40-60 kg).
Milkfish fingerling production in Taiwan during 1991 was allocated 46% to baitfish and 54% togrow-out for the market size food fish (approx. 250-300 g). The Taiwan fingerling demand for deep-sea fisheries was estimated at 50-60 million (Lee, 1991). This allocation has dropped to the current25-30% of production going to bait (Chang, personal communication 2004). The reasons providedfor this drop in the allocation from the Taiwan milkfish fingerling production was mainly attribu-ted to a greater porting by the Taiwanese small tuna longliners (those that traditionally use themilkfish live bait) in Southeast Asian ports (e.g., Bali, Jakarta in Indonesia, and Davao in thePhilippines) over the past 10 years where they purchased the live milkfish bait. This along with theshift away from yellowfin to bigeye tuna was the main reason for the lower demand for live milk-fish in Taiwan. The Philippine tuna longline fleets also utilize live milkfish (Eleserio, personal com-munications 2004). The total annual bait demand is estimated at 1,500 MT and valued at US$1.64million (Eleserio, personal communications 2004).
The demand for live milkfish bait by tuna longliners in Indonesia has been reported to be increa-sing (Sugama, personal communication; Budhiman, personal communication). According to Dr.Sugama and Budhiman (personal communication 2004), live milkfish comprises 50-70% of all thebait used by tuna longliners in Indonesia. Studies (Pranowo et al. 1997; Rachmansyah et al.Undated; Anonymous–E,1996) on the production of milkfish as bait for the Indonesian tuna lon-gline fishery discussed the specifics of production and marketing. The size used (15-18 cm, 50-100g/piece) tends to be larger than that commonly used by Taiwanese vessels elsewhere. There is a pre-ference for live milkfish in Eastern Indonesia, specifically Bali and Eastern Java. Western Java (e.g.,Jakarta area) has lower frequency of use for live milkfish as bait. This was partially attributed to ahigher valuation of milkfish as a food fish in Western Java compared to that of Bali and Eastern Java.
18
It is also reported that Indonesia, West Java, has shifted away from using the live bait (Gillett, per-sonal communication 2003). The farm-gate price reported by Dr. Sugama and Budhiman (personalcommunication 2004) for live milkfish bait is US$0.020-0.075/piece (160-600 Rupiah/piece), whilethe fry are US$1.18/1000 fry (10-15 Rupiah/piece), which reflects a continuing devaluation of theIndonesian Rupiah. In 1996, the farm-gate price for live milkfish bait (60-100 g/piece) was 300Rupiah/piece (US$0.13 in 1996 currency conversion) with a vessel price of 600-700 Rupiah/piece(US$0.26-0.30 in 1996 currency conversion) (Ahmad, personal communication 1996). At thiscurrent price, it makes live milkfish very competitive to other frozen baits, since it would cost appro-ximately US$600/MT (100 g fish at US$0.06/piece). The farm-gate price for frozen milkfish bait wasreported (Budhiman, personal communication 2004) to be 65,000 Rupiah/20 kg (US$390/MT).
Therefore the demand for live milkfish changes over time and location. This is driven by price andcompeting uses of milkfish (i.e., bait vs. food) along with a very important factor of local marketdemand, which reflects the movement of those international fleets in pursuit of tuna (movement offish populations and fishing permits policy and regulations). The decline of live milkfish use inTaiwan reflects the movement of their fleets over the past 10 plus years to other ports in the Pacificand Southeast Asia. The termination of use in Guam was mainly attributed to the declining vesselsporting in Guam, particularly Taiwanese, which decreased the demand and the main farm suppl-ying this market terminating operation. Meanwhile the domestic fleets in Indonesia have beenreported to have increased since 1995. This illustrates the dynamic nature of the market for livemilkfish bait, which is influenced often by external factors.
OPERATIONAL COSTS OF TUNA LONGLINE VESSELS
Bait constitutes a varying amount of the vessels’ operational costs. The operational cost structureof tuna longline vessels for different country of origin fleets will also vary. This will affect the per-centage of bait cost to the total operating costs. In a study of the economics of the Hawaii-basedlongline fleet (O’Malley and Pooley 2003), the average annual cost of bait (sanma – Cololabis saira,and sardine – Sardinops sagaxas) for the medium size (56.1-73.9 ft) tuna longliners amounted toUS$34,982 per vessel. Table 6 provides a cost comparison of three size categories of vessels in thestudy. Bait amounted to 16.1% of the variable costs or 10.6% of the total operating costs (fixed andvariable). This represents a significant cost item in the operation of tuna longliners. Therefore, thecost efficiency of that bait in catching the targeted species will influence the net profit.
Table 6. Annual cost of bait per vessel category and cost efficiency for the Hawaii-based tuna lon-gline vessels (after O’Malley and Pooley 2001).
*Exclusive of labor cost (usually based on share of catch, but varies).
A closer examination of the cost allocation for the Hawaii-based small tuna longliners (<56 ft) ispresented in Table 7. Since the small longliners are the category of vessels that would be the tar-geted market for live milkfish, their relative cost/revenue breakdown will be utilized as a model inthe assumptions for estimating the potential market for live milkfish.
19
VESSEL SIZE ANNUAL BAIT BAIT COST/TOTAL BAIT COST/TOTAL NET REVENUE/ BAIT COSTCATEGORY COST PER VESSEL VARIABLE COST OPERATING COST*
Small <56 ft US$26,110 16.1% 10.9% US$3.874Medium 56.1-73.9 ft US$34,982 16.1% 10.6% US$1.523Large >74 ft US$35,979 14.1% 9.6% US$0.56

Table 7. Hawaii-based small vessel size category (<56 ft) tuna longline costs in US$ (O’Malley andPooley 2003).
* Average number of trips/vessels were 12/yr
The operational characteristics of the Hawaii-based small vessel category are presented in Table 8.Given the number of hooks/set, sets/trip, and trips/yr the average annual demand for bait wouldbe up to 233,500 pieces/yr. However, a percentage of the bait can potentially be reused in subse-quent sets. This can range from 10% to 30%. Therefore, the actual estimated demand would be163,450 to 210,150 per vessel per year. At current (January 2004) bait prices in Hawaii (sardine120 pieces/10 kg @ US$1,400/MT, sanma 120 pieces/10 kg @ US$1,800/MT) the bait cost per yearwould be as high as US$24,518-31,522 for sanma, while for live milkfish at US$0.25/piece theannual bait cost would be US$40,863-52,538. With the risk adverse nature and reluctance tochange fishing practices, the nearly doubling in the price of bait for live milkfish would representa major disincentive for vessel captains unfamiliar with the bait.
Table 8. Operational characteristics of Hawaii-based small vessel category (<56 ft) of tuna longli-ners (O’Malley and Pooley 2003).
20
REVENUE & COST AVERAGE ANNUAL PERCENTAGE AVE RAGE REVENUE &ITEM COST/VESSEL OF TOTAL COST COST PER TRIP*
GROSS REVENUE $502,740 $41,895
Fixed CostsCapital costs $16,151 3.78% $1,346Insurance $23,318 5.46% $1,943Bookkeeping/Accounting $1,903 0.45% $159Mooring $4,854 1.14% $405Overhaul $3,640 0.85% $303Dry dock $4,333 1.01% $361Other repairs $16,151 3.78% $1,346Misc. costs $6,719 1.57% $560Subtotal $77,069 $6,422
LaborEstimated for captain/crew $187,685 43.93% $15,640
Variable CostsFuel $24,585 5.75% $2,049Oil $1,264 0.30% $105Ice $9,224 2.16% $769Bait $26,110 6.11% $2,176Provisions $11,064 2.59% $922Gear resupply $14,199 3.32% $1,183Daily maintenance $8,349 1.95% $696Fish processing $1,100 0.26% $92Communications $25,704 6.02% $2,142Sales $40,924 9.58% $3,410Subtotal $162,523 $13,544
TOTAL COSTS $427,277 100.00% $35,606
NET REVENUE $75,463 $6,289
OPERATIONAL CHARACTERISTICS AVERAGE NUMBER
Number of trips/yr 12Number of sets/trip 11Number of hooks/float 29Number of hooks/set 1,769

In comparison to the Hawaii based longline fleet, Taiwan longliners have a different operating costwith approximately 33% allocated to bait cost. This higher percentage of operating cost assignedto bait compared to the Hawaiian fleet provides a greater incentive to identify an effective bait toimprove CPUE, while keeping the net revenue to bait cost as high as possible. The captain wouldbe more sensitive to the further increase in bait cost, since it already comprises a large portion ofthe operating costs. According to a study four years ago in Taiwan (David Chang, personal com-munication), the total operating cost per trip was approximately US$30,000 for an 80 GT vessel.Of this amount, fuel cost was US$7,000, ship maintenance, depreciation, and provisions amountedto US$4,000-5,000, crew salary of US$8,000-9,000, and bait was approximately US$10,000.Therefore, the cost structure and specifically the percentage allocated to bait varies among fleets andwill have an impact on their bait purchase decisions.
21

FINANCIAL ANALYSIS EXTENSIVE VS. INTENSIVE MILKFISH AQUACULTURE
It is critical that a well informed decision making process is applied to all phases in the develop-ment of aquaculture activities as with all businesses. For practitioners of aquaculture, informeddecisions are even more crucial due to exogenous factors (e.g., disease, unfavorable environmentalconditions that cause mortalities or facility damage, etc.) that increase risk in bioproduction. Tofacilitate the decision making, a thorough step-by-step process is recommended. Appendix 5 pro-vides a flowchart of these steps. This is critical to the proper evaluation of a proposed developmentwith the determination of its economic viability.
CULTURE METHODS
Development of successful production of a product will depend on a country’s comparative advan-tages in comparison to other producers of the same or similar product. The advantages and disad-vantages of aquaculture development in general within the region have been documented (Bell andGervis 1999; Macawais-Ele 2001). The comparative advantages and disadvantages for milkfish pro-duction in the SPC Region are as follows.
Comparative Advantages
• Low cost of labor (majority of countries).• Conducive weather conditions (temperature, stable environment, for those islands outside
the typhoon belt) to optimize growth.• Natural resources (sea, land, fish fry) utilized to produce a marketable product. This inclu-
des the utilization of an indigenous species to the Pacific Islands (avoids the hazards, poten-tial complications and costs of an introduced species) that is low in the trophic food chain.
• Potential synergy with existing domestically based tuna longline fishery providing compli-mentary economic benefits to both.
Comparative Disadvantages
• Remoteness of location (internationally and domestically) constricts access to potential mar-kets as well as access to farm inputs.
• Limited logistics (shipping frequency, destination, potential fragile nature of consistent carrierservice and cost by air or sea). Poor international transport services restrict opportunities.
• Limited support infrastructure (electrical, roads, etc.) – includes delivery of farm inputs andtechnical services.
• High cost of imports (potential inputs).• Limited skilled workforce.• Small domestic market and lower market price structures may restrict viable development
along with hampering economical scale.• Limited capital sources to finance sustained development. • Fragile ecosystems (includes potential eutrophication).• Restricted suitable land resource in some islands (limited suitable sites available, and effects
of customary marine tenure on access to potential sites).
Assuming that an island has a positive net comparative advantage in the production of milkfish, thereare a number of methods that can be utilized for the grow-out of milkfish. These include the following.
• Extensive pond culture – utilizing natural pond productivity as food source.• Semi-intensive to intensive pond culture – utilizing commercial feed input.• Pen culture – this can be extensive or intensive depending on location.• Cage culture – this is usually intensive depending on location.
23

Milkfish aquaculture methods and production in Taiwan, Philippines, and Indonesia are identifiedin Table 9. It can be seen that production varies substantially within and between these major milk-fish producer countries, with Taiwan being the most technically advanced. A similar range in pro-duction occurs in those Pacific Islands that are or have cultured milkfish in the past. Therefore, theprojection of an industry based on the higher potential production increases the risk of failure whenthat production is not met. This contributes to making inappropriate investment decisions.
Table 9. Milkfish culture methods and production (after Lee and Banno 1990; Agbayani 2000).
The preferred aquaculture production method (pond, pen, or cage) will also be island specific. Thedetermination will depend on a number of factors including the following.
• Size of tuna longline fleet potentially able to utilize live bait.• Size of pole-and-line fishery.• Economics of production that would allow for the export of frozen milkfish as bait or food.• Size of potential non-bait markets domestically.• Suitable land sites availability.• Environmental limitations (protected water areas for pen/cage culture, whether they are sub-
ject to typhoons, etc.).
Extensive culture with the utilization of wild caught fry is a suitable method for some Island coun-tries as an entry into bait culture, since the additional costs associated with hatchery operations andmore intensive operations will make the cost per unit production too high to be competitive againstother frozen baits
FINANCIAL ANALYSIS OF MILKFISH CULTURE AS BAIT
The cost of production will vary among the SPC members. Therefore, the financial analysis repre-sents estimated costs, which will change with actual costs in each island. However, the results canbe used on a relative basis in a comparison of the different production methods. The assessment ofthe costs for individual islands should remove the subsidies and other government incentives todetermine the true costs of operation. If the government wants to provide subsidies to the industrythat should be made as a public policy that responsibly weighs the costs of the incentives to thebenefits of development of the industry to be sure that they are justified. Otherwise, it introducesprice distortions into the market place and inefficiencies.
A financial analysis of every potential production scenario is impractical for this study; therefore,the financial analysis will focus on generic production scenarios for milkfish as live bait. In thefinancial analysis, the assumptions for biological, physical, and financial inputs are identified inAppendix 6. The costs of production including capital costs are identified in Appendix 7 for sixaquaculture production methods; however, the costs will vary among the 22 SPC Island members(individual costs can vary significantly; i.e., labor, taxes, construction, etc.). Therefore, each
24
COUNTRY AND CULTURE METHOD STOCKING DENSITY PRODUCTION (kg/ha/yr)
TAIWANExtensive- Shallow Water 6,000-7,000/ha 1,800-2,500 kg/ha/yrSemi-intensive Deep Water Method >2,500/ha 8,000-12,000 kg/ha/yrPen
PHILIPPINESExtensive 1,500-6,000/ha 800-4,000 kg/ha/yrPen 30,000-40,000/ha 2,000-10,000 kg/ha/yrCage 35-100/m3 13-17 kg/m3
INDONESIAExtensive 6,000/ha 300-1,000 kg/ha/yr

country will have to evaluate their specific costs to accurately reflect the potential financial viabi-lity of milkfish production. The resulting financial analysis based on these assumptions is presen-ted in Appendix 7. The different aquaculture production scenarios should be utilized as a guide ona relative basis and not the absolute values due to the wide range in costs that are to be encountered inthe different islands. The financial analysis for the different culture methods is summarized in Table 10.
Table 10. Summary of financial analysis for different milkfish culture methods for one-hectare area(US$)
Baitfish rearing farms in Taiwan produce three crops per year (over winter slow or no growth). Thegrow-out season usually spans April thru November. The bait is sold per piece. SPC Islands shouldbe able to produce 5 crops/yr due to year round warm conditions. In an economic analysis of milk-fish culture as bait in Taiwan (Lee 1983), the average baitfish farm was 1.81 ha with major pro-duction costs being fry (75.2%) and labor (14.8%). It should be noted the cost structure could varysignificantly from country to country with the different costs of inputs. Net annual revenue avera-ged NT$44,429/ha (1979 values; US$1,233/ha) for farms under 1 ha in size, with farms over onehectare in size averaged NT$51,954/ha (US$1,441/ha). The cost allocation and returns for the twosize categories of farms are summarized in Table 11. It should be noted that the culture method isequivalent to "extensive plus" in which supplemental feeds are utilized in addition to the naturalproductivity of the ponds with a moderate stocking density of 3.7-4.1 pieces/ha. From Table 11, itcan be seen that baitfish culture provides a substantially higher return than that from food fish pro-duction for an equivalent area.
Table 11. Production cost distribution for milkfish farms producing for the tuna longline bait mar-ket compared to milkfish production for food fish (Lee 1983).
25
Extensive Extensive plus Semi-Intensive Intensive Pen CageVariable Costs $14,920 $26,300 $56,140 $140,070 $140,280 $268,270Fixed Costs $1,400 $2,250 $3,000 $24,000 $20,750 $27,000Revenue $25,200 $42,000 $84,000 $252,000 $252,000 $420,000Net $8,800 $13,450 $24,860 $82,930 $90,970 $124,730Cost Per Unit $/kg $2.59 $2.72 $2.82 $2.68 $2.56 $2.81
BAITFISH FARMS FOOD FISH FARMS
COST ITEM FARM SIZE FARM SIZE FARM SIZE FARM SIZE < 1 HA > 1 HA < 3 HA 3-10 HA
Direct Costs
Fry 69.8% 76.4% 36.2% 40.5%Feeds 1.9% 2.3% 24.6% 22.6%Labor 19.6% 13.9% 23.3% 21.8%Fuel 0.9% 0.8% 1.3% 1.7%Materials 2.5% 2.0% 5.0% 2.2%Water Fees NA NA 0.4 0.2%Subtotal 94.6% 95.4% 90.9% 88.8%
Indirect Costs
Land rent 1.2% 1.0% 2.4% 2.9%Water & Electricity 1.1% 0.9%Interest on borrowed capital 0.04% 0.8% 4.2% 5.1%Maintenance Costs 1.5% 1.0%Taxes 0.7% 0.6% 0.1% 0.1%Depreciation on equipment 0.6% 0.4% 2.4% 3.1%Subtotal 5.4% 4.6% 9.1% 11.2%
Net Revenue/ha NT$44,429 NT$51,954 NT$6,094 NT$7,399Rate of farm Income 27.3% 29.8% 6.31% 7.41%Average Farm Size (ha) 0.75 2.42 1.82 5.75

Effect of stocking density has been examined to determine the best stocking density for the cultu-re of milkfish for bait (Yabo 1994; Baliago et al. 1987) along with managing the growth retardationto provide a continuous supply for bait within a specific size range. As previously mentioned, milk-fish spawning is seasonal; therefore, the fry supply will be limited to a few months of the year. Insome locations there is a secondary spawning season. There is also differences in the time of yearthat spawning occurs through the Pacific. However, the grow-out needs to incorporate this fact inthe operation of the farm (adds to cost of operation) to allow for output of the proper size and quan-tity of bait throughout the year to supply the bait market. Therefore, crowding will be required toretard growth for a portion of the crop to meet the demand throughout the year.
As part of the market analysis in the assessment and planning stage (Appendixes 8 & 9), the poten-tial users of the bait need to be evaluated as to their capacity and interest in utilizing the product.In domestic longline fisheries that are not familiar with the use of live milkfish as longline bait,there will be a need for training and awareness programs for the tuna longline vessel captains. Sincewithout the interest to utilize live milkfish as bait, the market will not materialize despite whatwould seem to be logical projections of its use. In this situation, the demonstration of milkfisheffectiveness as bait should be carried out as part of the planning and assessment phase in marketanalysis. The responsibility of this aspect of development will likely be with a government (localor international) program for economic and fisheries development. In the evaluation of the poten-tial users of the product, it should include the vessels capacity to utilize live bait. This will requi-re live bait wells. The cost of modifying vessels to accommodate live bait wells may prove to be asufficient barrier for the fleet to utilize live bait despite the efficiency of the bait and is an impor-tant component that should be part of the assessment and planning phase.
In an analysis of milkfish culture in the Philippines utilizing the cage culture method, a cost com-parison was made at different cage sizes (Lopez, unpublished). This was to produce a food fish sizeproduct, which normally shows a lower return compared to baitfish production. Table 12 providesthe costs for four different cage sizes. This is with the assumptions of a stocking density of 50/m3,survival rate of 80%, feed conversion ratio of 1.7, harvest size of 3.5 pieces/kg (286 g/fish), and awholesale price of US$1.07/kg (P60/kg). Of the four surface area sizes evaluated, all showed a pro-fit, with the 1,000 m2 cage having the highest rate of return.
Table 12. Cage culture of milkfish (food fish 3.5/kg) comparison of costs and area (Lopez, unpu-blished). Exchange rate based on 100 Philippine Peso = US$1.79 (January 2004).
26
Item 100 m2 200 m2 400 m2 1,000 m2
(10m x 10m cage) (20m x 10m cage) (20m x 20m cage) (50m x 20m cage)Construction Cost
PE net $128.88 $233.60 $322.20 $572.80PE rope $10.74 $15.04 $19.33 $21.48Kawayan $35.80 $53.70 $62.65 $89.50Labor cost $17.90 $26.85 $35.80 $44.75Miscellaneous $8.95 $13.43 $17.90 $22.38Subtotal $202.27 $342.62 $457.88 $750.91
Production and Marketing CostsFingerlings @ US$0.054 $268.50 $537.00 $1,074.00 $2,685.00Feed pellet @ US$0.254 $493.90 $987.79 $1,975.16 $4,938.54Harvesting cost (2% GS) $24.56 $49.10 $98.18 $245.50Marketing cost (5% GS) $61.38 $122.78 $245.46 $613.74Miscellaneous (5%) $42.42 $84.83 $169.64 $424.14Depreciation cost $50.57 $85.65 $114.47 $187.74Subtotal $941.33 $2,267.16 $3,676.91 $9,094.66
Calculation of BenefitsProduction output 1,143 kg 2,286 kg 4,571 kg 11,429 kgGross sale (GS) $1,227.58 $2,455.16 $4,909.25 $12,274.75Net Profit $286.26 $588.02 $1,232.34 $3,180.10
Break-even price $0.82 $0.82 $0.80 $0.80Break-even production 876 kg 1,739 kg 3,424 kg 8,468 kgRate of Return 30.40% 31.50% 33.50% 34.97%

The Fiji Islands Trade & Investment Bureau (2001) reported that a milkfish bait project under theCommodity Development Framework sold the milkfish bait to the domestic tuna fisheries atUS$1.15/kg (FJ$2.00/kg). This would be about US$.07/fish (live bait at 60 g/fish). This would bea very competitive price compared to the Taiwan price of US$0.20-0.25/fish but slightly higher thanIndonesia price, if the farm is operating profitably. Similarly, Kiribati’s price of US$1.84/kg(AU$2.50/kg) or US$.11/fish (live bait at 60 g/fish) would be competitive, if it had a market.However, this operation has not proven to be profitable to date.
The calculated cost for fingerlings (stocking size) in the Philippines was 0.33 to 0.83 peso (Libreroet al. 1991, 1993) or US$0.013 to 0.032 (US$13 to 32/1000 fry based on 25 peso/US$1 in 1990),which is similar to the Taiwan price. The cost of collected wild fry in the Philippines varies subs-tantially also through the seasonal runs. They go from US$2.69 to 16.13/1000 fry (Smith 1981).
HATCHERY FRY PRODUCTION
The major technological advancement in milkfish aquaculture over the past 20 years is the deve-lopment of hatchery technology for milkfish since the early 1980’s that has allowed commercializa-tion of fry production from hatcheries and reduced the dependence on wild caught fry. This hasstabilized the fry supply and has contributed to lowering the fry portion of the production costs(Chen et al. 2001). Lee (1995) identified fry cost as 39.7% in 1979, while in 1990 it was reducedto 19.5% in Taiwan of the grow-out production costs. Part of this shift in the production cost allo-cation is due to the increase in costs of other input components such as labor and feed.
There are two basic hatchery operation methods for producing milkfish fry and they are intensiveand semi-intensive. The intensive system uses tanks for larval rearing with the addition of separa-tely cultured algae, rotifers, and artemia at different stages during the culture period. Larvae arestocked at a relatively high density of 20-30/l. In the semi-intensive system, a pond is utilized andnatural phytoplankton and zooplankton growth is promoted through fertilization. The larvae arestocked at a lower density of 5/l. A cost of fry production analysis was done for Taiwan (Lee et al.1997). The major cost of production for both systems is labor, but the intensive system has the hig-hest labor cost (61.1%). The cost of producing fry from a hatchery utilizing both the intensive andsemi-intensive methods is presented in Table 13. They found the semi-intensive method of fry pro-duction to be the most profitable under the existing conditions. The semi-intensive method had alower cost of production at US$6.67/1000 fry compared to the intensive system, which had aUS$27.40/1000 fry cost of production. It was further noted that to reach a profitable level a mini-mum production had to be obtained. For the intensive system, it was 1.4 million fry per cycle,while the semi-intensive required 2 million fry per cycle at a market price of US$24/1000 fry. Thisis exclusive of the costs of obtaining fertilized eggs (broodstock and spawning). However, it shouldbe noted that this is calculated on the cost of the facility and operational costs only during that por-tion of the year when the milkfish are spawning (4-months in Taiwan, May-Aug). For the remain-der of the year, the hatchery facility’s fixed and variable costs require other sources of revenue thatat least allow it to break-even or those costs would be added to the milkfish fry production and mostlikely make it uneconomical. Therefore, it is important to incorporate a multi-species use into theanalysis and design of a hatchery.
27

* Note assigned depreclation and operational costs of the hatchery are only for 4-months of the year during the milk-fish spawning/larval rearing period.
In comparison to the hatchery costs in Taiwan, Hawaii has a higher unit cost of production asdemonstrated in Table 14 with the cost of production of threadfin, which has similar hatcheryprocedures to that of milkfish. The unit cost of nearly US$0.23/fry would be very high andwould make the production of milkfish as bait not economical.
Table 14. Oceanic Institute, Hawaii, hatchery costs (in US$) for Pacific Threadfin (Polydactylussexfilis) (Lotus et al. 2003).
28
INTENSIVE FRY PRODUCTION SEMI-INTENSIVE PRODUCTION
Percentage Percentageof Total of Total
Assigned Operating Assigned OperatingTotal Cost Depreciation Cost Total Cost Depreciation Cost
Capital CostsLarval readng tanks $28,800 $2,880 $120,000 $6,000Phytoplankton. tanks (size 1) $57,600 $5,760 $0 $0Phytoplankton tanks (size 2) $9,120 $912 $0 $0Phytoplankton txanks (size 3) $1,200 $120 $0 $0Rotifer ponds $9,120 $912 $24,000 $1,200Artemia tanks $720 $72 $0 $0Buildings (including office, lab, plumbing, electrical) $221,091 $11,055 $76,000 $3,800Laboratory and office equipment $4,000 $800 $4,000 $800Blowers $10,000 $1,250 $14,000 $1,750Pumps $5,000 $625 $10,000 $1,250Total $346,651 $24,386 $248,000 $14,800
Operational CostsFeed $15,714 4.78% $8,669 5.41%Labor $200,746 61.06% $50,187 31.32%Energy (for pumps, blowers, others) $11,105 3.38% $30,187 18.849Chemical $2,416 0.73% $2,601 1.62%Repair and maintenace $17,333 5.27% $12,400 7.74%Land rent $1,665 0.51% $8,326 5.20%Interests $27,732 8.44% $19,840Contingency $27,671 8.42% $13,207 8.24%Depreciation $24,386 7.42% $14 800 9.24%
Total $328,768 100.00% $160,217 100.00%
Table 13. Comparison of hatchery production costs (in US$) for fry from intensive and semi-intensive methods in Taiwan (Lee et al. 1997).
PERCENTAGEOF TOTAL
REVENUE & OPERATINGCOST COST
Gross Revenue ($0.25/fry) $300,000
Variable CostsFeed $5,442 2.48%Labor $129,993 59.13%Energy (for pumps, blowers, others) $10,228 4.65%Chemical/Supplies $24,985 11.37%Repair and maintenace $1,557 0.71%Land rent/Facilities rent $6,000 2.73%General Excise Tax $1,500 0.68%
Fixed CostsEquipment Depreciation $10,331 4.70%Development Depreciation $20,817 9.47%Subtotal $31,148
ITEM
ITEM

*Based on 2nd year when in full production at 1.2 million fry/yr.
A "nucleus hatchery" system is used in Taiwan and Indonesia along with satellite hatcheries. Thenucleus hatchery would maintain broodstock and carryout spawning with distribution of the eggsto numerous smaller satellite hatcheries for larval rearing to fry. In Indonesia, this system is oftenreferred to as a "back-yard hatchery" system, which has been promoted with success. In Taiwan, apercentage (40-60%) of the total revenues are paid to the nucleus hatchery. A study on the econo-mics of the Bali, Indonesia, system of nucleus hatchery and satellite "backyard hatcheries" reportsa cost of milkfish fry at US$14.00/1000 fry in 1997-98 (Siar et al. 2002). Bali currently has 9nucleus hatcheries and over 300 "backyard hatcheries" (Sugama, personal communication 2004).
The cost of live milkfish as bait (40-60g) is approximately 10 times the cost of the fry. For exam-ple, the farm cost fry in Taiwan is approximately US$0.02-0.025/fry and the bait cost is US$0.20-0.25. In Guam, the fry cost was approximately US$0.05/fry (imported from Taiwan) and the bait pricewas as high as US$0.50/piece (later dropped to US$0.43/piece and to US$0.30-0.35 just before stoppingproduction). Therefore, it is critical that the fry cost does not exceed US$0.05/fry to produce a bait sizefish that is reasonably competitive with alternative baits and provide an acceptable profit margin.
Figure 5 shows the components of a milkfish hatchery. The size and operation varies substantiallywith demand for fry and the technical capacity of the country. As with the grow-out phase in milk-fish production, the hatchery component should be flexible to switch production to alternative spe-cies as the demand changes over time. Development of a hatchery facility should not be based solelyon milkfish fry production. The production season for milkfish would only span approximately a4-month period; therefore, the remaining 8-months in a year need to be committed to alternativespecies production. A hatchery facility would only be a justified investment if it were part of a lar-ger integrated aquaculture program for the development of commercially viable aquaculture. Insome islands, the current existence of a hatchery facility would facilitate the adaptation with usuallyminor modifications to allow for milkfish fry production. The high capital investment along withinvestment in technically trained staff will make the development of a hatchery not advisable in theinitial development of milkfish aquaculture. Utilization of wild fry stocks, that are available in suffi-cient quantity for initial development or the importation of fry would be the most prudent strategy.
29
Contingency $8,985 4.09%
Total Operational Expenses $219,838 100.00%Interest Expenses $45,819Net Income Before Tax $34,343Income Tax $6,756Net Income After Tax $27,587
Cost per Fry Before Tax $0.2201
Cost per Fry After Tax $0.2270
MATURATIONOF
BROODSTOCK
SPAWNING(Natural ofInduced)
EGG INCUBATION/
HATCHINGLARVAE REARING FRY
TRANSFERTO
GROW-OUTFACILITIES
HATCHERY COMPONENTS
MicroalgaeCulture
RotiferCulture &
Enrichment
ArtemiaHatching &Enrichment
FormulatedFeeds
Day 1 Day 45
Figure 5. Milkfish fry production and hatchery components

There is available a hatchery operations manual for mullet by the Guam Aquaculture Developmentand Training Center (Tamaru et al. 1993), which would provide an excellent guide to the specificsin the larval rearing and live food culture that are directly applicable to milkfish. A milkfish hat-chery manual is also available through Oceanic Institute Hawaii (Liu and Kelley 1994).
Hawaii has the hatchery capability and technology and potential farms that could produce milkfish;however, it has failed to develop despite a substantial domestic demand from the Filipino popula-tion. This can be attributed to a number of factors including the high cost of fry US$0.20-0.25/fryfrom the Hawaii hatchery, inadequate farm demand to support hatchery activity, competition to cul-tured product from imports, slower growth (winter period of lower water temperature), and lowreturn on the farm grow-out (Kam et al. 2003). Oceanic Institute that served as the broodstock andhatchery facility in Hawaii for milkfish production will be terminating fry production (shifting rese-arch to other species), since there is inadequate domestic demand for fry production to justify thecost of operation and maintenance of the broodstock. Domestic production could not compete withthe import price on milkfish from lower cost producers. This exemplifies that it is not only the issueof technology (Oceanic Institute is a leading research center for aquaculture), market demand (largedomestic demand as a food fish), infrastructure (internal and external), and farm capacity (facili-ties and skill labor) that determines the viability of sustainable aquaculture. All these factors wouldindicate a potentially favorable environment for milkfish cultivation; however, the current produc-tion economics in Hawaii do not support its viability. This emphasizes the importance of a thoroughanalysis of the industry that includes the long-term economic viability prior to major investments.
A hatchery facility for milkfish should only be considered once an aquaculture industry is establis-hed for milkfish and there is sufficient demand for further production expansion to support theminimum hatchery production level to obtain break-even. Utilization of fry from wild stock orimported fry from a low cost producer would provide seedstock for the initial stage of development.Establishment of a milkfish hatchery should be part of a broader aquaculture development programthat has identified multiple-uses for the hatchery so that it can be fully utilized throughout the yearwhen milkfish are not spawning. The alternative species for the hatchery should also reflect eco-nomically viable production. The establishment of a regional (sub-regional) hatchery facility ser-ving many of the SPC Islands may prove to be a more efficient and cost effective strategy. The conceptof a "nucleus regional hatchery" for the maintenance of broodstock and spawning to provide fertilizedeggs to small satellite hatchery facilities in different islands in the region would also be an option thatwould incorporate efficiencies of operation within a cooperative regional approach to development.
30
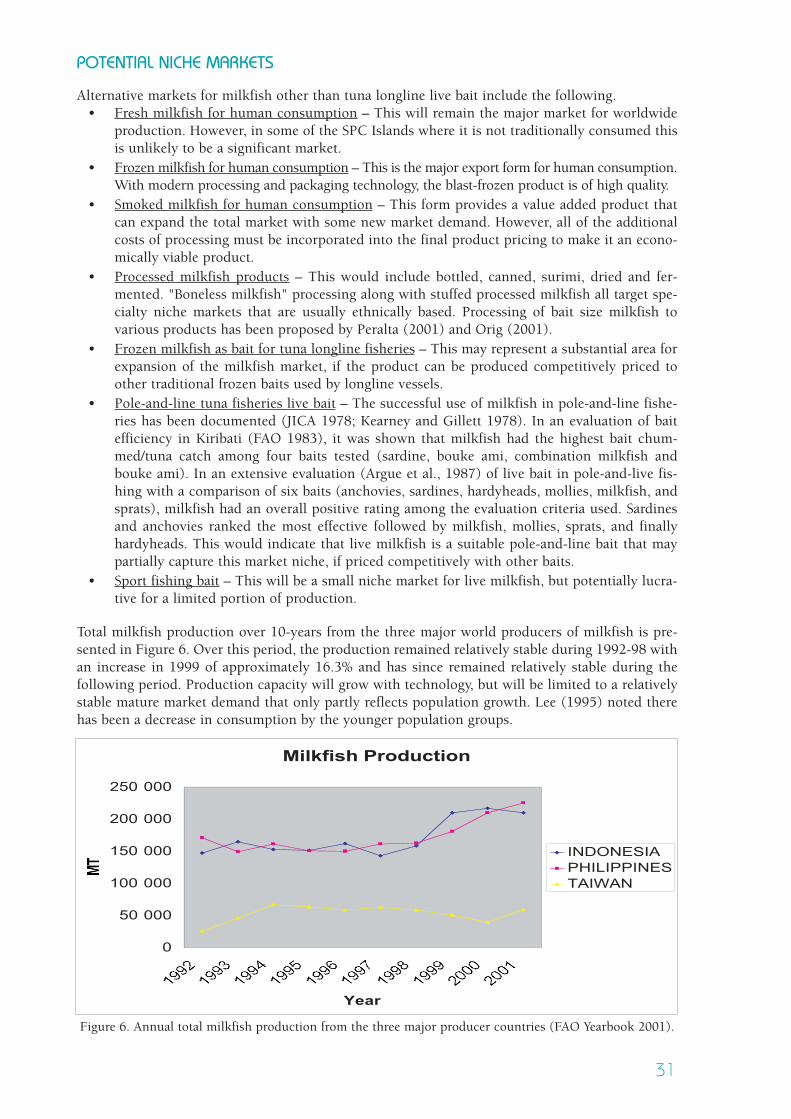
POTENTIAL NICHE MARKETS
Alternative markets for milkfish other than tuna longline live bait include the following.• Fresh milkfish for human consumption – This will remain the major market for worldwide
production. However, in some of the SPC Islands where it is not traditionally consumed thisis unlikely to be a significant market.
• Frozen milkfish for human consumption – This is the major export form for human consumption.With modern processing and packaging technology, the blast-frozen product is of high quality.
• Smoked milkfish for human consumption – This form provides a value added product thatcan expand the total market with some new market demand. However, all of the additionalcosts of processing must be incorporated into the final product pricing to make it an econo-mically viable product.
• Processed milkfish products – This would include bottled, canned, surimi, dried and fer-mented. "Boneless milkfish" processing along with stuffed processed milkfish all target spe-cialty niche markets that are usually ethnically based. Processing of bait size milkfish tovarious products has been proposed by Peralta (2001) and Orig (2001).
• Frozen milkfish as bait for tuna longline fisheries – This may represent a substantial area forexpansion of the milkfish market, if the product can be produced competitively priced toother traditional frozen baits used by longline vessels.
• Pole-and-line tuna fisheries live bait – The successful use of milkfish in pole-and-line fishe-ries has been documented (JICA 1978; Kearney and Gillett 1978). In an evaluation of baitefficiency in Kiribati (FAO 1983), it was shown that milkfish had the highest bait chum-med/tuna catch among four baits tested (sardine, bouke ami, combination milkfish andbouke ami). In an extensive evaluation (Argue et al., 1987) of live bait in pole-and-live fis-hing with a comparison of six baits (anchovies, sardines, hardyheads, mollies, milkfish, andsprats), milkfish had an overall positive rating among the evaluation criteria used. Sardinesand anchovies ranked the most effective followed by milkfish, mollies, sprats, and finallyhardyheads. This would indicate that live milkfish is a suitable pole-and-line bait that maypartially capture this market niche, if priced competitively with other baits.
• Sport fishing bait – This will be a small niche market for live milkfish, but potentially lucra-tive for a limited portion of production.
Total milkfish production over 10-years from the three major world producers of milkfish is pre-sented in Figure 6. Over this period, the production remained relatively stable during 1992-98 withan increase in 1999 of approximately 16.3% and has since remained relatively stable during thefollowing period. Production capacity will grow with technology, but will be limited to a relativelystable mature market demand that only partly reflects population growth. Lee (1995) noted therehas been a decrease in consumption by the younger population groups.
31
Milkfish Production
0
50 000
100 000
150 000
200 000
250 000
19921993
19941995
19961997
19981999
20002001
Year
MT
INDONESIAPHILIPPINESTAIWAN
Figure 6. Annual total milkfish production from the three major producer countries (FAO Yearbook 2001).

Milkfish aquaculture area in Taiwan has decreased from 31% of the total aquaculture area in 1975to 17% in 2002 (Lee, 1995; Taiwan Fisheries Yearbook). Actual production has gone from 33,309MT to 72,435 MT, while the market price has decreased in this same period. During this period theproduction efficiency has increased to allow for greater production per area. In addition, the moreprofitable culture of alternative species has been developed along with other economic uses of theland, which has utilized some of the area that was once in milkfish culture. Similarly, the milkfishaquaculture area in the Philippines has decreased from 88% in 1981 to 45% in 1996 of the totalaquaculture area (Ahmed et al., 2001).
To address export markets for the non-live bait products, the islands will have to be competitive ona world commodity market price basis. With major low-cost producers in the Pacific region, thatinclude Indonesia, Philippines, and Taiwan, it will be very difficult to enter this market. However,there may be some opportunities for small exports within the region that allows for some competi-tive advantages such as nearby islands (keeping export costs to minimum), and to other islandcounties that have inherent high costs of the product due to remoteness from major market centersand high transportation costs.
The price for milkfish will be set by the supply and the consolidated demand for the different uses,which include various product forms as a food fish and as a live or frozen bait. The supply side willbe influenced by production costs, and competitive aquaculture species that may provide a farmbetter returns on investment. The general lower value of milkfish means it must compete for pro-duction area with higher value species such as shrimp, crabs, and other higher valued fish.Therefore, the price will vary with the supply/demand, competitive products, and influenced to a cer-tain level by international prices (lower cost producers with comparative advantages of production).
As an example of how market supply and demand impacts on economic viability, the PhilippineBureau of Fisheries and Aquatic Resources (BFAR) reported the Laguna Bay milkfish producersfarm-gate price had dropped to US$.80/kg, which is below production cost of US$.90-1.00/kg(Stream Philippines Communications Hub 2003). This was due to market pressures with produc-tion exceeding market demand; therefore, the BFAR was looking at export to Japan for tuna bait(frozen) as a means of increasing market demand. In addition, production of milkfish from thePhilippines is being promoted for the tuna bait market in Taiwan by the BFAR (Philippine govern-ment). This is targeting the estimated 150,000 MT/yr demand for milkfish bait in Taiwan, withabout half of that requirement being imported (Anonymous-A 2003). BFAR is initially projectingan export of 4,500 MT from the Philippines for this market (NADCFI 2003). This is part of an effortto expand and diversify the market for the Philippine's milkfish product. The milkfish for the baitmarket is that portion of production that develops off-flavor (blue green algae consumption) that isnot suitable for human consumption. The farm-gate price for this product is US$.42/kg (P23.5/kg)for fish that are 5-6 pieces/kg and blast frozen for export (Anonymous-B 2003). This is aimed atcapturing part of the frozen milkfish bait market, which is dominated by Indonesia.
A price quotation from one of the many bait/seafood wholesalers ([email protected]) that areavailable through the Internet (Appendix 10) was provided for frozen milkfish bait shipped to keyPacific ports (Table 15). The product comes in 10 kg blocks and in various sizes (i.e., 41-45, 46-50,51-55, 56-60, 61-65, and 66-70 pieces/carton). There is a minimum quantity per order of one 40 ftFCL (26 MT). The cost to reach some of the Pacific Islands will be higher due to shipping routes,while others may be slightly lower. Therefore, this would set a competitive basis the domestic pro-ducers would have to compete against (farm gate price + processing/transport costs + marketingcosts). The advantage of domestic producers is that they could possibly be more competitive onsmaller quantity purchases when the demand for bait would not meet the minimum order require-ment from an international wholesaler. Live bait from a domestic source would be more vigorousthan bait shipped long distances and the difficulty of shipping live quantities of fish will make iteconomically prohibitive in most cases.
32

Table 15. Frozen milkfish bait price (in US$) from Indonesia delivered to ports around the Pacific(January 2004). Minimum order 40 ft. FCL (26 MT) in 10 kg box units.
To enter the international market, the SPC Islands will have to compete with other producer coun-tries with significant comparative advantages (e.g., lower input costs, better logistics and infras-tructure, established market linkages and established supplier in international trade) such as keyproducers in Asia (e.g., Philippines, Indonesia, Taiwan). Each country may have country specificcharacteristics that influences markets along with favorable or unfavorable regulations and struc-ture. Even though milkfish is not traded internationally to the extent of shrimp or other marine pro-ducts, international market prices will influence the market and price in a specific country. Forexample, Guam’s milkfish production dropped off during the early 1990’s with the importation ofhigh quality blast frozen milkfish from Taiwan, which retailed at one-third to one-quarter the priceof the fresh Guam product. This market influx of lower priced milkfish was partially the result of incre-ased production from Taiwan shrimp farms that suffered from major shrimp disease problems. Thesefarms switched to alternative species for production including milkfish. This increased product supplylowered prices and the export to Guam impacted the local milkfish farms production and margins.
To be competitive in the international market for frozen or processed product, the production costswill have to be competitive with international prices for the product. In the domestic market, thisimport price will be impacted by potential import tariffs and taxes on the product by each islandalong with the shipping costs. So the domestic market may provide opportunities for the product,while the export market will have to be competitive with the world market price. For example, thewholesale price in Manila Philippines for milkfish (food fish) is approximately US$1.20/kg. Taiwantends to be a slightly lower (US$0.90-1.10/kg) cost producer, and Indonesia is the lowest cost pro-ducer of the major producers. These prices will fall below the best-case scenario for production inthe SPC regional Islands. Therefore, the products from the SPC region will not be competitive withthese major producers. However, in the case of live milkfish for bait the high cost of shipping thatproduct and logistics would make it prohibitive even from these low cost producers. This providesa potential domestic opportunity, if there is a market for live milkfish bait. The exception beingcases where longline vessels could make port of calls in those countries (i.e., Indonesia andPhilippines) where they could reprovision and purchase bait and then fish within the SPC region.
33
COUNTRY PRICE DELIVERED TO PORT
Bali, Indonesia $0.93/kgSingapore $0.95/kgKaoshung, Taiwan $0.98/kg

FUTURE TRENDS FOR MILKFISH AQUACULTURE IN THE PACIFIC
The past experience in the Pacific Islands with aquaculture in general should be noted and shared.Both successes and failures are learning experiences that help reduce risk in future developments.It should be noted that the two islands that had significant programs of milkfish production targe-ting the tuna baitfish market (Guam for the tuna longline fleets, and Kiribati for the pole-and-linefleets) are no longer supplying to those markets (the case of Guam) or at substantially reducedamounts from that originally planned (the case of Kiribati, which is mainly a government fundedor subsidized operation). This emphasizes the fragility of an aquaculture operation that is develo-ped around one product for a single market, particularly when that product can be readily substi-tuted with a lower cost product, and that market is mobile and has alternative suppliers. In the caseof Guam, the established private aquaculture industry was presented with the opportunity for a newmarket (milkfish bait) and shifted production from mainly existing farms to meet that marketopportunity. When that market was no longer available they had the flexibility to economicallyswitch production to other viable products. This flexibility of production will be critical to anylong-term aquaculture operation in the region.
The technological trends for the future development of milkfish aquaculture will include the following.• Refinement of the maturation/spawning/larval rearing for hatchery produced fry. This has sta-
bilized fry supplies and price. This could be further improved upon to include hormonally orenvironmentally controlled spawns throughout the year to reduce seasonality of fry supplies.
• Improved efficiency in the grow-out phase of production with improved efficiency of inputsand increased output per unit area. This will allow for reduced farming area, while maintai-ning production level at a lower cost.
The future trends for the markets are uncertain, since a number of factors determine the demand;however, areas for future development or improvement include the following.
• Traditional food fish – improvement of transportation services to improve market access fromproduction areas will assist in expanding markets. However, new markets will be difficult toestablish since milkfish is a bony fish. Lee (1995) implies that milkfish cannot be a luxuryfood item. Thus its markets will be mainly limited to those with a historical cultural prefe-rence for milkfish. Lee (1995) also states that even within cultures that historically preferredmilkfish the younger populations are trending toward alternatives.
• Expansion of milkfish markets – The fresh or frozen food product has limited markets forexpansion due to its bony nature. Boneless forms of processed milkfish and possibly cannedproduct, as labor-saving technology develops to process the product, do have potential formarket growth. New markets will require time, and promotion to develop awareness of theproduct and its various forms. Expansion of milkfish markets will require research and deve-lopment in both the marketing and the processing of milkfish.
• Milkfish as bait for tuna longline fishery – Even though there has been a trend away fromusing milkfish as live bait by the longline fishery in some locations, it remains as an effectivebait that can improve the catch rate. A major deterrent to the use of live milkfish as bait is thecost. With improved production efficiencies, it may become more attractive as a bait.Furthermore, controlled extensive studies will be needed to demonstrate its most efficientutilization by the fishery along with the economic viability of its use and demonstration ofimproved catch revenue over the additional cost of live bait (cost/benefit ratio comparison totraditional frozen baits).
Some issues that affect future trade in aquaculture products in general are the following.• Externalities – Environmental and social concerns influence aquaculture exports particularly
to North America and Europe (e.g., shrimp, live marine fish, along with chemical and drugissues, etc.). The importance of attaining sustainable aquaculture with no or limited exter-nalities will force many exporting countries to adopt more sustainable production practices.The introduction of eco-labeling schemes will further increase this trend.
35

• Quality – With growing concern about food safety, increasing efforts have been undertakento improve the quality of aquaculture products. International codex standards cover aqua-culture products, and the introduction of mandatory HACCP requirements for exports to theUSA and the European Union will have strong impact on trade in aquaculture products in thenear future. Some countries have developed comprehensive HACCP plans for selected aqua-culture products in the USA. In other countries, individual aquaculture producers underta-ke voluntary certification (ISO 9000) for control as well as marketing purposes.
• Tariffs – Despite steady reductions in tariffs on fish and aquaculture products in recent years,tariffs as well as import licenses continue to represent barriers to trade in many countries.This is especially the case in many fast-growing Asian economies, but important markets sucha Japan, the European Union and the USA all give competitive advantages to domestic pro-ducers of many species, especially in the case of processed products. Average tariffs onimports from developing countries are now estimated at 4.8%, a cut of 27% from the previouslevel of 6.6% (FAO, 1995). The long-term trend, with growing membership in the WorldTrade Organization, will be for further reduction in tariffs.
• Food security – Aquaculture is an important source of seafood because most of the produc-tion is consumed domestically by producing nations. It has also become a significant sourceof foreign currency to many developing nations because the products exported usually are themore valuable ones (e.g., shrimp), destined for markets in the developed world. These reve-nues allow the countries to import other less costly protein, and as such, aquaculture can beconsidered important to food security even when the output is exported.
36

CONCLUSIONS
Each Pacific Island should carefully evaluate its own individual market potentials and costs of pro-duction, since some of these will be unique to each island. A diversified production strategy formultiple markets that may be available domestically along with built in design flexibility of aqua-culture facilities that allow for the efficient culture of alternative products for these domestic mar-kets will reduce the operational risk and increase the likelihood of success for a sea or land based aqua-culture operation. The flexibility of design will be critical to sustainable aquaculture. This will requirethe evaluation and identification of alternative species that are economically viable. This will allow pro-duction to be shifted to alternative crops as markets and demand changes. Reliance on a single market(e.g., baitfish) or species (milkfish) increases the financial risk of the operation. This evaluation shouldbe part of a thorough planning and assessment analysis that is conducted prior to investment.
A recommended strategy for the cultivation of milkfish for the live bait market is to incorporate itinto a versatile aquaculture program that allows the farm operator to take advantage of diverse mar-ket opportunities as they develop. The transient nature of tuna fleets and the numerous externalfactors that impact on their operations would place at risk an aquaculture venture’s sustainable suc-cessful operation that was developed solely to meet a potential live bait market. Therefore, thereshould be the option of other viable products that an aquaculture farm can produce.
In the initial stage of milkfish aquaculture development, the demand for fry should utilize naturalfry resources from the wild followed by importation from low-cost producers (e.g., Indonesia,Taiwan) to meet fry demand. From a long-term regional perspective, the development of milkfishbait production should be in the most efficient and viable locations to serve the whole region. Thisshould include consideration of the application of a central "nucleus hatchery" strategy, as pre-viously described, with smaller satellite facilities for larval rearing to fry throughout the region atstrategic locations. This could prove to be the most cost effective and efficient method to meet frydemand in response to a potential expanding bait industry scenario. The "nucleus hatchery" woulddevelop and maintain broodstock, and conduct spawning for the distribution of eggs to smallersatellite facilities in the region. This would allow cost efficiencies in hatchery production that wouldnot be obtainable by most of the individual Island countries operating isolated complete hatcheryfacilities. As an alternative, the importation of eggs from hatcheries from the low cost producer ofIndonesia (i.e., Bali) would further reduce costs, if cost-effective transportation links can be established.
Even though the government will often play an important role in the initial phase of developmentthrough demonstration/pilot farms and other industry supports, this needs to be done in coordina-tion with the private sector, since it will ultimately be the private sector or in some cases commu-nity cooperatives that will have the role of operating economically sustainable enterprises. The pri-vate sector (production and market) along with community interests should be involved from theearly planning stage of aquaculture to assure their input and full participation. Aquaculture (milkfish orother species) can make a valuable contribution to the economies of the Islands within the SPC regionwhen done in a carefully planned and executed manner that takes full account of financial resources nee-ded, natural resources, environmental issues, manpower, markets, and economics of production.
ACKNOWLEDGEMENTS
I would like to acknowledge the assistance of Kris Anderson and Lois Ann Kiehl of PRAISE(University of Hawaii, Hamilton Library) along with the library staff of SPC in obtaining literaturefor the study. The assistance provided by Ben Ponia in coordinating the project for SPC is sincerelyappreciated. In addition, the assistance with specific information provided by David Chang(Overseas Fisheries Development Council of the Republic of China), PingSun Leung (University ofHawaii), David Itano (Pelagic Fisheries Research Program, University of Hawaii), AnthonyOstrowski (Oceanic Institute), Jim Cook (Pacific Ocean Producers, Honolulu), and Robert Gillett,is greatly appreciated.
37

LITERATURE CITED
Adams, T., J. Bell, and P. Labrosse. 2001. Current status of aquaculture in the Pacific Islands.Aquaculture in the New Millennium. FAO.
Ahmad, T. Personal communication. Director, Maros Fisheries Research Center, Sulawesi, Indonesia.
Ahmed, M., G.A. Mannayon-Umail, R.A. Valmonte-Santos, J. Toledo, N. Lopez, and F. Torres, Jr.2001. Bangus fry resource assessment in the Philippines. ICLARM Tech. Rep. 58, 38p.
Agbayani, R.F. 2000. Seafarming and community development in the Philippines. RegionalWorkshop on Sustainable Seafarming and Grouper Aquaculture. Medan, Indonesia, 17-20 April 2000.
Anonymous-A. 2003. Philippines finds new attractive avenue for its milkfish. http://www.grow-fish.com.au/content.asp?contentid=327.
Anonymous-B. 2003. RP to tap huge Taiwan market for bangus as fish bait. http://bas/gov.ph/cgi-bin/view_events.pl?events=74.
Anonymous-C. 2001. Milk fish farming project profile. Fiji Islands Trade and InvestmentBureau. P.O. Box 2303, Government Building, Suva: www.ftib.org.fj. 6p.
Anonymous-D.Undated.Overview of the inshore fishery sector: FSM.http://www.empat.fm/files/sectors/fisheries/infishplan.pdf.
Anonymous-E. 1996. Young milkfish distribution and trading policy. Directorate of FarmersBusiness Establishment and Product Manufacturing, Directorate General of Fisheries. 12p.
Argue, A.W., M.J. Williams, and J.P Hallier. 1987. Fishing performance of some natural and cul-tured baitfish used by pole-and-line vessels to fish tunas in the Central and Western PacificOcean. Tuan and Billfish Assessment Programme, Technical Report No. 18. South PacificCommission, Noumea, New Caledonia.
Bach, P., A. Bertrand, E. Josse, and L. Dagorn. 2003. Variation of catchability of tropical tunas bypelagic longlines by comparing acoustic and experimental fishing data. Fish Behaviour in Exploited Ecosystems, Bergen, 23-26 June 2003.
Baliao, D.D., N.M. Franco, and R.F. Agbayani. 1987. The economics of retarding milkfish growthfor fingerling production in brackishwater ponds. Aquaculture. 62: 195-205.
Bell, J.D., and M. Gervis. 1999. New species for coastal aquaculture in the tropical Pacific – cons-traints, prospects and considerations. Aquaculture International 7: 207-223.
Boggs, C. 1992. Depth, capture time, and hooked longevity of longline-caught pelagic fish timingbites of fish with chips. Fish Bull 90 (4). 642-658.
Brown, T.W. 1976. Preliminary report on the potential for Chanos chanos (milkfish) culture inFrench Polynesia.
Budhiman, A.A. Personal Communication. Director for Seeds Development, Directorate Generalof Aquaculture. Jakarta, Indonesia.
Camacho, V., and J. Lim. Personal Communication. Guam Aquaculture Development andTraining, Senior Biologist. Ocean Development, Farm Manager. Guam.
39

Chang, D. Personal Communication. Overseas Fisheries Development Council of the Republicof China., 19 Lane 113, Rossevelt Rd, Sect. 4, Taipei, ROC.
Chen, C.C., and J.C. Kuo. 2001. An economic analysis of milkfish fry culture in Taiwan. 6thAsian Fisheries Forum Book of Abstracts. 43 p.
Cook, J. Personal communication 2004. Pacific Ocean Producers, Pier 35, 965B N. NimitzHwy, Honolulu, Hawaii (808)537-2905
Dalzell, P., T.J.H. Adams, and N.V.C. Polunin. 1996. Coastal fisheries in the Pacific Islands.Oceanography and Marine Biology: an Annual Review. 43: 395-531.
Dela Cruz, E. 1997. Potential of milkfish farming development in Fiji. FAO, South PacificAquaculture Development Project (Phase II), GCP/RAS/116/JPN, Suva Fiji. Field Document No. 6. 48p.
Eleserio, F.O. Personal Communication. OIC, Capture Fisheries Division. Bureau of Fisheriesand Aquatic Resources, Philippines.
Evans, N., J. Raj, and D. Williams. 2003. Review of aquaculture policy and legislation in thePacific Island region. Secretariat of the Pacific Community, SPC Aquaculture TechnicalPapers. 173p.
FAO. 2001. FAO Yearbook 2001. FAO, Fishery Statistics Aquaculture Production. 92(2).
FAO. 1983. Kiribati pole and line tuna fishing with cultured milkfish bait. Tuna and BaitfishResources Evaluation Project. Food and Agriculture Organization of the United Nations,Rome. FI:DP/KIR/75/002, Field Document 3. 135p.
Fiji Islands Trade & Investment Bureau. 2001. Investment opportunity in the Fiji Islands –Milkfish farming project profile. Fiji Islands Trade & Investment Bureau. 6p.
FitzGerald, W.J., Jr. 1996. Preliminary report on the use of live milkfish (Chanos chanos) fortuna longline bait. South Pacific Commission Regional Technical Meeting on Fisheries,Aug. 96: 23p.
FitzGerald, W.J., Jr. 1995. Potential for aquaculture of bait on Guam; tuna bait to supply tunalongline vessels. Guam Business News Magazine. October 95
Gabbard, S. 2001. Aquaculture cooperative of American Samoa (AQCAS) receives ANA deve-lopment grant. Island Aquaculture - CTSA. 1(1): 4.
Garcia-Franco, M. 1995. Milkfish integrated farming in Tarawa Atoll. Federation of Japan TunaFisheries Co-operative Associations.
Gillett, R.D. 2003. Domestic tuna industry development in the Pacific Islands, the currentsituation and considerations for future development assistance. FFA Report 03/01. 196p.
Gillett, R.D. Personal Communication 2003. Reported information from an interview with Mr.Bachitiar Gafa, Agency for Agricultural Research and Development, Jakarta regarding ques-tions on the use of live milkfish as longline tuna bait faxed to Mr. Gafa by WilliamFitzGerald. Fiji.
Gopalakrishnan, V. 1976. Status and problems of culture of baitfish for the skipjack fishery inthe Pacific Islands. FAO Technical Conference on Aquaculture. Kyoto, Japan May 26 –June 2, 1976. 8p.
40

Hampton, J. and P. Williams. 2003. The Western and Central Pacific tuna fishery: 2001 overviewand status of stocks. Secretariat of the Pacific Community. Tuna Fisheries Assessment ReportNo. 4. 42p.
Hanafi, A. Personal Communication. Director of Research Institute for Mariculture in Gondol.Bali, Indonesia.
Hanamoto, E. 1976. Swimming depth of bigeye tuna. Bull. Jap. Soc. Fish. Oceanogr. 29. 41-44.
Harris, D. Personal Communication. Guam Port Authority.
Hester, F.J. 1974. Some considerations of the problems associated with the use of live bait for cat-ching tunas in the tropical Pacific Ocean. Mar. Fish. Rev. 36 (5): 1-12.
Honda, M. Personal Communication. Tuna Industry Advisor, Forum Fisheries Agency.
Isamu, T. 2003. Aquaculture country profile for Palau. . FAO, Sub-Regional Office for thePacific Islands. SAPA/A/Document 01/03. 24p.
Januma, S., Y. Kajiwara, T. Miura, J. Yamamoto, and M. Haruyama. 1999. Trial use of artificialbait with tuna longline. Bull. Fac. Fish. Hokkaido Univ. 50(2), 71-76.
Januma, S., K. Miyajima, and T. Abe. 2003. Development and comparative test of squid liverartificial bait for tuna longline. Fisheries Science 69: 288-292.
JICA. 1978. Report on the tuna and baitfish survey carried out in the Gilbert waters by theJapanese International Co-operation Agency (JICA) during the period November 1977 toFebruary 1978.
Juario, J.V., T. Teroroko, and E. Tekaraba. 1986a. Bait production using the lablab method. Draftmanuscript. 6p.
Juario, J.V., T. Teroroko, B. Naburennara, and E. Tekaraba. 1986b. Bait production using chop-ped tilapia, chopped leaves and chicken manure. Draft manuscript. 12p.
Kam, L.E., F.J. Martinez-Cordero, P. Leung, and A.C. Ostrowski. 2003. Economics of milkfish(Chanos chanos) production in Hawaii. Aquaculture Economics and Management 7(1/2): 1-29.
Kearney, R.E., and R.D. Gillett. 1978. Interim report of the activities of the skipjack survey andassessment programme in the waters of the Gilbert Islands (5-25 July 1978). Skipjack Surveyand Assessment Programme Preliminary Country Report No. 11, South Pacific Commission,Noumea, New Caledonia.
Lawson, T.A. 2003. Secretariat of the Pacific Community tuna fishery yearbook 2002. SPC,Noumea, New Caledonia. 177p.
Lee, C.S. 1995. Aquaculture of milkfish (Chanos chanos). Tungkang Marine Laboratory, Pintung,Taiwan, Aquaculture Ser. (1): 141p.
Lee, C.S. 1991. Socioeconomic status of milkfish farming in Taiwan. Presented at Workshop onSocioeconomics of Milkfish Farming, Tungkang, Taiwan, 21-22 December 1991.
Lee, C.S. 1983. Production and marketing of milkfish in Taiwan: an economic analysis. ICLARMTechnical Report No. 6, Contribution No. 91. 41p.
41

Lee, C.S. 1984. The milkfish industry in Taiwan. Advances in Milkfish Biology and Culture.Proceedings of the Second International Milkfish Aquaculture Conference, 4-8 October 1983,Iloilo City, Philippines. Eds. Juario, J.V. R.P. Ferraris, and L.V. Benitez. 183-198p.
Lee, C.S., P.S. Leung, and M.S. Su. 1997. Bioeconomic evaluation of different fry productionsystems for milkfish (Chanos chanos). Aquaculture 155: 367-376.
Lee, C.S., and J.E. Banno. 1990. Milkfish culture and production in Southeast Asia. In Tanaka,H., K.R. Uwate, J.V. Juario, C.S. Lee, and R. Foscarini. Proceedings of the regional workshopon milkfish culture development in the South Pacific. Tarawa, Kiribati, 21-25 November1988. 43-65p.
Librero, A.R., C.T. Aragon, and D.L. Evangelista. 1991. Socioeconomic status of milkfish farmingin the Philippines. Presented at Workshop on Socioeconomics of Milkfish Farming,Tungkang, Taiwan, 21-22 December 1991. 61p.
Librero, A.R., C.T. Aragon, and D.L. Evangelista. 1993. Socioeconomic status of milkfish farmingin the Philippines. Presented at International Symposium on Socioeconomics ofAquaculture, Keelung, Taiwan, 14-17 December 1993. 162p.
Lim, J. Personal Communication 2004. Manager Ocean Development Farm. Guam.
Lindsay, S. 2002. Aquaculture country profile, Federated States of Micronesia. SPC, Aquaculture Section, Noumea, New Caledonia. 25p.
Liu, K.K.M., and C.D. Kelly. 1994. The Oceanic Institute hatchery manual series, milkfish(Chanos chanos). The Oceanic Institute, Honolulu, Hawaii. 87p.
Lopez, N. unpublished. Brief summary of cost and return of milkfish cage culture in marinewaters. Bureau of Fisheries and Aquatic Resources, Philippines.
Lotus, E., Y.W. Kam, P. Leung, A.C. Ostrowski, and A. Molnar. 2003. Economics of milkfish(Chanos chanos) production in Hawaii. Aquaculture Economics and Management 7 (1/2): 1-29.
Macawaris-Ele, N. 2001. Aquaculture in focus: importance to food security. Statement by FAOSub-Regional Office for the Pacific Islands. SPC 2nd SPC Heads of Fisheries Meeting,Noumea, New Caledonia, 23-27 July 2001. Information Paper 7. 4p.
Naamin, N. 1993. Review of tuna fishery in the western part of Indonesian waters – IndianOcean side. Proceedings of the 5th Expert Consultation on Indian Ocean Tunas, Mahe,Seychelles, 4-8 October 1993.
National Fisheries Policy Study. 1999. Fisheries inshore. ADB TA No. 2551-FSM.http://www.empat.fm/files/sectors/fisheries/infishplan.pdf.
NADCFI. 2003. Milkfish export to Taiwan pushed. National Agribusiness Development CenterFoundation, Inc. http://www. Map-adc.org.ph/da/news_061803b.htm.
O’Malley, J.M. and S.G. Pooley. 2003. Economic and operational characteristics of the Hawaii-based longline fleet in 2000. SOEST 03-01. JIMAR Contribution 03-348.
Okuhara, M. 2000. Live milkfish bait trial for tuna longline fishery. Fishery Experiment Stationof Kagoshima. http://chukakunet.pref.kagoshima.jp/suishi/jigyohoukoku/H12/12.htm
O’Malley, J.M. and S.G. Pooley. 2003. Economic and operational characteristics of the Hawaii-based longline fleet in 2000. Joint Institute for Marine and Atmospheric Research, Honolulu,Hawaii. Contribution 03-348. 31p.
10

Orig, T.S. 2001. Bait-size bangus: a ‘new twist’ in the milkfish business. Philipp. Panorama30(11):16-17/26.
Ostrowski, A.C. 1999. Preliminary evidence for the effectiveness of cultured milkfish (Chanoschanos) as live bait on longline vessels in Hawaii. Annual Meeting of the World AquacultureSociety. Sydney, Australia, April 26-May 2, 1999. 575
Ostrowski, A.C, J. Szyper, C. Tamaru, and M. Fujimoto. 1999. Development of Pacific Threadfinand milkfish growout technology and production of live feeds and seedstock.http://library.kcc.Hawaii.edu/external/ctsa/aar99/aar99_thread.htm.
Peralta, J.P. 2001. Milkfish industry alternative: products from cultured baitsize. 6th Asian fis-heries Forum Book of Abstracts Unit A, Mayaman Townhomes 25 Mayaman Street UPVillage, Quezon City Philippines, Asian Fisheries Society. 195p.
Pollard, S. and Associates Pt. Ltd. 1988. The Kiribati Temaiku baitfish review. An operational,technical, financial, and economic review of the Temaiku facilities. EEC Project No.5100.36.74.012.
Pranowo, S.A., Dharmadi, and M.F. Sukadi. 1997. Bait milkfish trading in Muara Baru ocean fis-hery port. (Keragaan Pemasaran Bandeng Umpan Di Pelabuhan Perikanan Samudora MuaraBaru). Indonesia. 21p.
Preston, G.I. 1992. Milkfish capture on Christmas Island, Kiribati. SPC Fisheries Newsletter #60. 16-18.
Rachmansyah, Burhanuddin, S. Tonnek, and A. Sudrajat. Material for shipping technology ofmilkfish aquaculture in Keramba for both as bait and as food. Agricultural Research andDevelopment Board, Fishery Research and Development Center, Center for Coastal FishAquaculture Research of Maros. 44p.
Ranoemihardjo, B.S. 1981. Nauru eradication of tilapia from fresh and brackishwater lagoonsand ponds with a view to promoting milkfish culture. FAO FI:DP/NAU/78/001. 15P.
Samarakoon, J.I. 1972. On the experimental culture of milkfish Chanos chanos (Forskal) as tunabait in Ceylon. Coastal Aquaculture in the Indo-Pacific, Symposium Presentations Bangkok,18-21 Nov. 1970, FAO 1972. 454.
Sharma, K.R. and P. Leung. 1999. Technical efficiency of the longline fishery in Hawaii: an appli-cation of a stochastic production frontier. Marine Resource Economics, 13: 259-274.
Siar, S.V., W.L. Johnston, and S.Y. Sim. 2002. Study on economics and socio-economics of small-scale marine fish hatcheries and nurseries, with special reference to grouper systems in Bali,Indonesia. Report prepared under APEC project "FWG 01/2001 – Collaborative APECGrouper Research and Development Network". Asia-Pacific Marine Finfish AquacultureNetwork Publication 2/2002. Network of Aquaculture Centres in Asia-Pacific, Bangkok, 36p.
Smith, A.C. 1978. Pathology and biochemical genetic variation in the milkfish, Chanos chanos.J. Fish. Biol. 13: 173-177.
Smith, B.R. 1977. Appraisal of the live-bait potential and handling characteristics of the commontuna bait species in Papua New Guinea. Circ., U.S. Dept. Com., Natl. Oceanic and Atmos.Adm., Nat. Mar. Fish. Serv., (No. 408). 95-103.
11
Smith, I. 1981. The economics of the milkfish fry and fingerling industry of the Philippines.International Center for Living Aquatic Resources Management, Manila and AquacultureDepartment, Southeast Asian Fisheries Development Center, Iloilo, Philippines. ICLARMTechnical Reports1. 146 p.
SPC. Undated. Penrhyn: A brief overview of the marine environment for each of individualisland of the Cook Islands. SPC Coastal Fisheries Programme. http://www.spc.org.nc/coas-tfish/countries/cookislands/MMR2/Penrhyn.htm.
SPC. 2000. SPC Fisheries Information Newsletter #95. Secretariat of the Pacific Community,Noumea, New Caledonia.
SPC. 2002. 1st SPC aquaculture meeting, building capacity for aquaculture in the Pacific.Suva, Fiji Islands 11-15 March 2002. Secretariat of the Pacific Community AquacultureTechnical Papers. 62 p.
SPC. 2003. The SPC aquaculture action plan. Secretariat of the Pacific Community, Noumea,New Caledonia.
Sokimi, W., S. Beverly, and L. Chapman. 2001. Technical assistance and training in small-scale tunalonglining, Tarawa, Kiribati. Secretariat of the Pacific Community, Field Report No. 9. 57p.
Stream Philippines Communications Hub. 2003. Philippine Laguna milkfish growers encoura-ged to focus on Japanese exports. The Philippine Star, January 19, 2003.
Sugama, K. Personal Communication. Director, Research Center for Aquaculture, Jakarta, Indonesia.
Tamaru, C.S., W.J. FitzGerald, Jr. and V. Sato. 1993. Hatchery manual for the artificial propaga-tion of striped mullet (Mugil cephalus L.). Guam Department of Commerce, GuamAquaculture Development and Training Center and The Oceanic Institute of Hawaii. 167p.
Tamaru, C.S., F. Cholik, J.C.M. Kuo, and W.J. FitzGerald, Jr. 1995. Status of the culture forstriped mullet (Mugil cephalus), milkfish (Chanos chanos) and grouper (Epinephelus sp.).Reviews In Fisheries Science 3(3): 249-273.
Tanaka, H. Personal Communication. Fisheries and Aquaculture International Co., Ltd., Tokyo.
Tanaka, H., K.R. Uwate, J.V. Juario, C.S. Lee, and R. Foscarini. 1990. Proceedings of the regio-nal workshop on milkfish culture development in the South Pacific. Tarawa, Kiribati, 21-25 November 1988. 134p.
Tekinaiti, T. 1990. The status of the tuna baitfishery in Kiribati. Tuna Baitfish in the IndoPacific Region. Proceedings of a Workshop, Honiara, Solomon Islands, 11-13 December1989. eds. Blaber, S.J.M., and J.W. Copland. Canberra, Act Australia Australian Centre forInternational Agricultural Research. No. 30 p. 52-54 p.
Teroroko, T. 1984. Milkfish bait culture in ponds. SPC Fish Newsletter. 6(5): 6.
Trachet, N. 1989. Adding value to the products of aquaculture: the smoking of giant clamsfrom Palau and milkfish from Kiribati. FAO, South Pacific Aquaculture DevelopmentProject, Suva, Fiji. 24p.
Trade and Investment Promotion Unit. 2000. Milkfish. Dept. of Trade, Commerce andIndustry, Government of Samoa. http://www.tradeinvestsamoa.ws/investing_in_samoa/sec-tor_studies/fisheries_sec/milkfish.htm
44

Uwate, K.R. 1990. Economics of milkfish culture in the Pacific Islands. Proceedings of theRegional Workshop on Milkfish Culture Development in the South Pacific. Tarawa, Kiribati.21-25 November 1988. eds. Tanaka, H., K.R. Uwate, J.V. Juario, C.S. Lee, and R. Foscarini.109-120 p.
Uwate, K.R. 1986. Economic implications of fertilization trials of milkfish ponds in Temaiku,Tarawa. UNDP. 29p.
Uwate, K.R., J.V. Juario, and T. Teroroko. 1996. An assessment of the Temaiku bait fish farm inTarawa, Kiribati. Submitted to: Fisheries Division, Ministry of Natural Resources, Republicof Kiribati. 53 p.
Uwate, K.R., and T. Teroroko. 1986. Market considerations for bait and food fish production ofthe Temaiku Fish Farm. Submitted to Fisheries Division. MNRD, Republic of Kiribati.
Vergne, P., P. Bryan, and G. Broadhead. 1978. Large-scale production of the top minnows(Poecilia mexicana) in American Samoa and the testing of their efficiency as tuna bait. PacificTuna Development Foundation Technical Bulletin No. 1. 65p.
Wainwright, A. and B. Dalley. 1980. The development of a milkfish fry industry in the Republicof Kiribati. South Pacific Commission Twelfth Regional Technical Meeting on Fisheries.SPC/Fisheries 12/WP.21 6p.
Wilson, P.T. 1977. Observations of tuna bait species and their habitats in the Palau Islands. Circ.,U.S. Dept. Com., Natl. Oceanic and Atmos. Adm., Nat. Mar. Fish. Serv., (No. 408). 69-74.
Winans, G.A. 1985. Geographic variation in the milkfish Chanos chanos II. Biochemical evi-dence. Copeia 1985: 890-898.
Winans, G.A. 1980. Geographic variation in the milkfish Chanos chanos I. Biochemical eviden-ce. Evolution 34: 558-574.
Yabo, M.J.R. 1994. Pengaruh padat penebaran terhadap pertumbuhan bandeng, Chanos chanosumpan di tambak (Effect of stocking density on the growth of live bait milkfish, Chanos cha-nos in brackishwater ponds). J. Penelitian Budidaya Pantai 10(2):47-54.
Yuen, H.S.H. 1977. Desired characteristics of a bait for skipjack tuna, Katsuwonus pelamis. Circ., U.S.Dept. Com., Natl. Oceanic and Atmos. Adm., Nat. Mar. Fish. Serv., (No. 408). 52-54.
45

APPENDIXES
APPENDIX 1. TERMS OF REFERENCE:
The aim of this consultancy is to provide a regional assessment of the commercial viability for milk-fish aquaculture to supply the baitfish market and other potential niche markets.
The geographical scope of this consultancy will target milkfish (Chanos chanos) farmers from thePacific region comprising of the twenty-two SPC member Pacific island countries and territories.
The project will consist of four (4) weeks of gathering literature, data on current and potential mar-kets, and identifying specific advantages/disadvantages for participation by the SPC member islandcountries and territories in milkfish culture. Two (2) weeks will be utilized to compile the collec-ted information and data and prepare the report.
Specifically, your consultancy will produce a written report that will include the following information:
• a review of the status of milkfish aquaculture in the Pacific;• an assessment of the market demand for milkfish as baitfish. Particularly for the Pacific regio-
n’s tuna fishing industry;• financial analysis to investigate cost-profit scenarios for extensive (e.g. fry collection) versus
intensive (e.g. hatchery) milkfish aquaculture;• an examination of potential niche markets, other than baitfish, for milkfish producers in the
Pacific;• an assessment of the future trends for milkfish aquaculture in the Pacific.
47
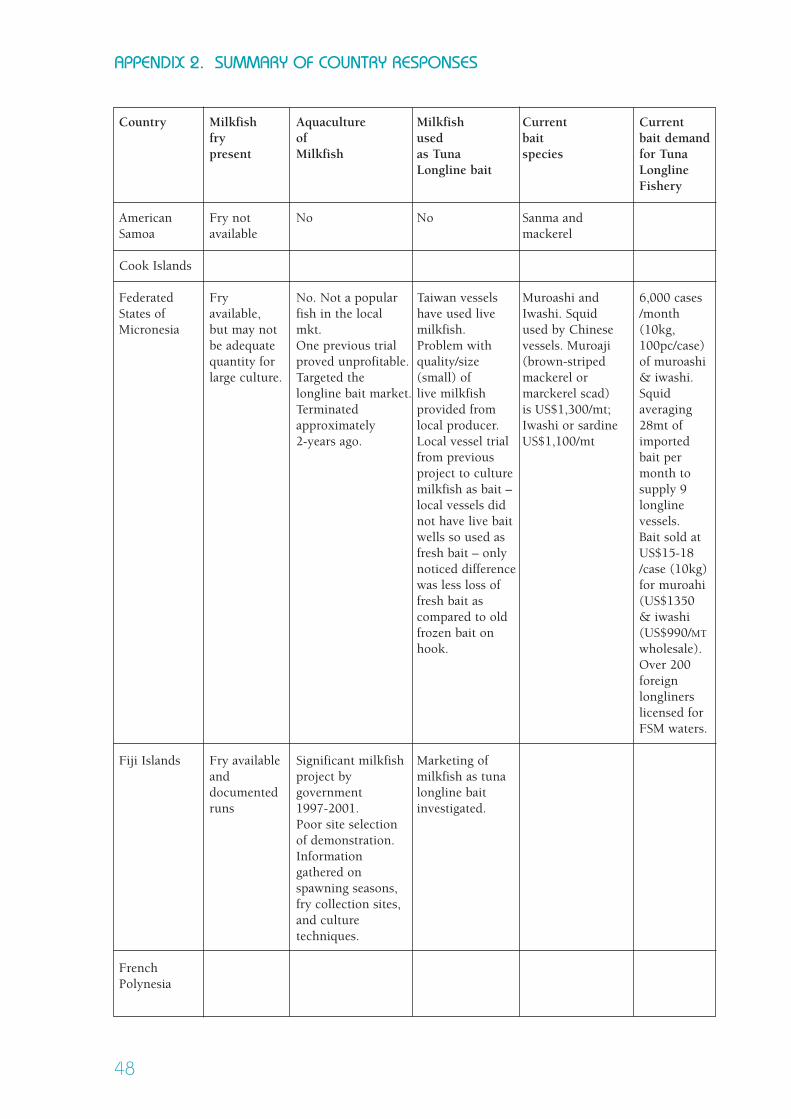
APPENDIX 2. SUMMARY OF COUNTRY RESPONSES
48
Country Milkfish Aquaculture Milkfish Current Currentfry of used bait bait demand present Milkfish as Tuna species for Tuna
Longline bait LonglineFishery
American Fry not No No Sanma and Samoa available mackerel
Cook Islands
Federated Fry No. Not a popular Taiwan vessels Muroashi and 6,000 casesStates of available, fish in the local have used live Iwashi. Squid /month Micronesia but may not mkt. milkfish. used by Chinese (10kg,
be adequate One previous trial Problem with vessels. Muroaji 100pc/case)quantity for proved unprofitable. quality/size (brown-striped of muroashilarge culture. Targeted the (small) of mackerel or & iwashi.
longline bait market. live milkfish marckerel scad) Squid Terminated provided from is US$1,300/mt; averagingapproximately local producer. Iwashi or sardine 28mt of 2-years ago. Local vessel trial US$1,100/mt imported
from previous bait per project to culture month tomilkfish as bait – supply 9local vessels did longline not have live bait vessels.wells so used as Bait sold atfresh bait – only US$15-18noticed difference /case (10kg)was less loss of for muroahifresh bait as (US$1350compared to old & iwashifrozen bait on (US$990/MT
hook. wholesale).Over 200foreign longlinerslicensed forFSM waters.
Fiji Islands Fry available Significant milkfish Marketing ofand project by milkfish as tunadocumented government longline bait runs 1997-2001. investigated.
Poor site selection of demonstration.Information gathered onspawning seasons,fry collection sites,and culture techniques.
French Polynesia

49
Guam Fry reported Yes, since the early Private farms Yes, used in the past The demand but not 1970’s. live milkfish from for live milkfish available in local aquaculture as bait from the adequate industry supplied to fleets porting in quantities. longliners based Guam stopped 2-Imported from in Guam, since mid years ago (baitTaiwan 1990’s. However, demand peaked
demand declined in 95-98 period).and stopped in Current produ2000-2001 ction of milkfish
is solely for foodor farms formerlysupplying livebait have changed species produced, since there is no longera market with the tunalongliners for live bait.
Kiribati Fry available Yes, approx. 80 ha Yes (as frozen Milkfish Current produon all lagoonal government farm milkfish not (Chanos chanos). ction of 2.2mt/yrislands on Tarawa plus live), for Some trials meets current
additional ponds domestic with flying fish. domestic on Kiritimati Is. fisheries – demand. There (1,100 ha). Smaller Central Pacific are no foreignpond areas in all 12 Producers Ltd. fleets. The frozenatolls with lagoons. Fisheries training milkfish bait is Tarawa in 2002 was and Fisheries US$1,830/MT19mt (2.2mt as Division’s long from the pondsbait, 9.7mt sold line vessel in Tarawa andfresh as food, 2.7mt (TeKokona III) Kiritimati.smoked). Bait sold at AU$2.50/kg.Production from Kiritimati is sold at AU$2.50/kg.
Marshall Islands
Nauru
New Unknown, No No Sardines and Caledonia milkfish mackerels are
reported to be the predominate rarely found in baitlocal market
Niue
Northern No No, but No No tuna longlineMariana aquaculture fleet based in Islands of shrimp and tilapia NMI.
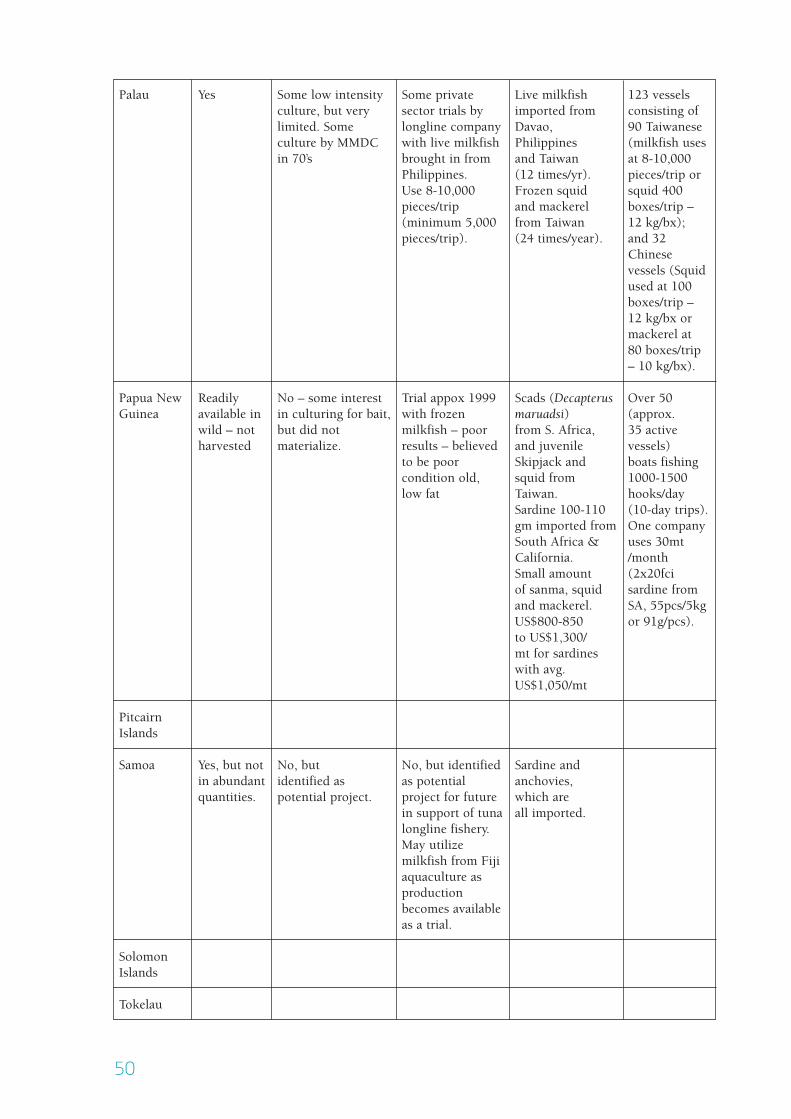
50
Palau Yes Some low intensity Some private Live milkfish 123 vessels culture, but very sector trials by imported from consisting of limited. Some longline company Davao, 90 Taiwanese culture by MMDC with live milkfish Philippines (milkfish usesin 70’s brought in from and Taiwan at 8-10,000
Philippines. (12 times/yr). pieces/trip orUse 8-10,000 Frozen squid squid 400 pieces/trip and mackerel boxes/trip – (minimum 5,000 from Taiwan 12 kg/bx);pieces/trip). (24 times/year). and 32
Chinesevessels (Squidused at 100 boxes/trip –12 kg/bx or mackerel at80 boxes/trip– 10 kg/bx).
Papua New Readily No – some interest Trial appox 1999 Scads (Decapterus Over 50 Guinea available in in culturing for bait, with frozen maruadsi) (approx.
wild – not but did not milkfish – poor from S. Africa, 35 activeharvested materialize. results – believed and juvenile vessels)
to be poor Skipjack and boats fishing condition old, squid from 1000-1500low fat Taiwan. hooks/day
Sardine 100-110 (10-day trips).gm imported from One company South Africa & uses 30mtCalifornia. /month Small amount (2x20fci of sanma, squid sardine from and mackerel. SA, 55pcs/5kgUS$800-850 or 91g/pcs).to US$1,300/mt for sardines with avg.US$1,050/mt
Pitcairn Islands
Samoa Yes, but not No, but No, but identified Sardine andin abundant identified as as potential anchovies,quantities. potential project. project for future which are
in support of tuna all imported.longline fishery.May utilize milkfish from Fiji aquaculture asproduction becomes availableas a trial.
Solomon Islands
Tokelau

51
Tonga Not verified No No Sauri imported US$28.83/10 kg,fry availability, from Pago Pago,but adults are Fiji, andby-catch of gill New Zealandnets in lagoons.
Tuvalu
Vanuatu
Wallis and Futuna
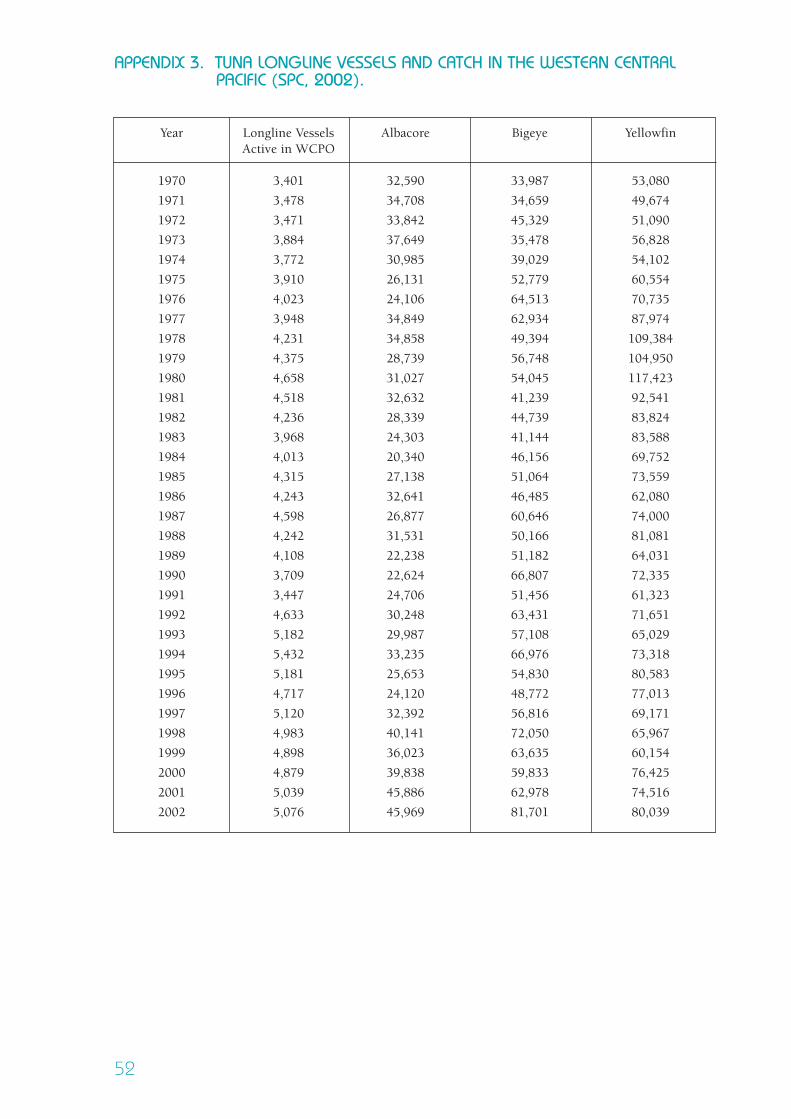
APPENDIX 3. TUNA LONGLINE VESSELS AND CATCH IN THE WESTERN CENTRALPACIFIC (SPC, 2002).
52
Year Longline Vessels Albacore Bigeye YellowfinActive in WCPO
1970 3,401 32,590 33,987 53,080
1971 3,478 34,708 34,659 49,674
1972 3,471 33,842 45,329 51,090
1973 3,884 37,649 35,478 56,828
1974 3,772 30,985 39,029 54,102
1975 3,910 26,131 52,779 60,554
1976 4,023 24,106 64,513 70,735
1977 3,948 34,849 62,934 87,974
1978 4,231 34,858 49,394 109,384
1979 4,375 28,739 56,748 104,950
1980 4,658 31,027 54,045 117,423
1981 4,518 32,632 41,239 92,541
1982 4,236 28,339 44,739 83,824
1983 3,968 24,303 41,144 83,588
1984 4,013 20,340 46,156 69,752
1985 4,315 27,138 51,064 73,559
1986 4,243 32,641 46,485 62,080
1987 4,598 26,877 60,646 74,000
1988 4,242 31,531 50,166 81,081
1989 4,108 22,238 51,182 64,031
1990 3,709 22,624 66,807 72,335
1991 3,447 24,706 51,456 61,323
1992 4,633 30,248 63,431 71,651
1993 5,182 29,987 57,108 65,029
1994 5,432 33,235 66,976 73,318
1995 5,181 25,653 54,830 80,583
1996 4,717 24,120 48,772 77,013
1997 5,120 32,392 56,816 69,171
1998 4,983 40,141 72,050 65,967
1999 4,898 36,023 63,635 60,154
2000 4,879 39,838 59,833 76,425
2001 5,039 45,886 62,978 74,516
2002 5,076 45,969 81,701 80,039

APPENDIX 4. ASSUMPTIONS FOR CALCULATION OF BREAK-EVEN POINT TO OFFSETADDITIONAL COST OF LIVE MILKFISH
* Required to offset additional cost of live Milkfish
53
ASSUMPTIONS FOR CALCULATION OF BREAK-EVEN POINT TO OFFSET ADDITIONAL COST OF LIVE MILKFISH
Average Size of Tuna Caught (kg) AST 35
Average Price of Tuna Caught (US$/kg) APT $2.75
Hooks per set HS 1500
Number of Sets per Trip ST 15
Cost of Frozen Bait (per MT) CFB $1,000
Cost of Live Milkfish (per MT) CLM $4,000
Size of Frozen Bait (g/fish) SFB 120
Size of Live Milkfish (g/fish) SLM 60
PercentBreak-even increase in
CPUE CPUE to offsetCPUE CPUE with Catch Value Catch* with live Additional cost
Scenario Frozen Bait (kg) Value of catch* (kg) milkfish of live Milkfish
1 0.75% 5,906 $16,242.19 $18,942.19 6,888 0.87% 16.62%
2 1.00% 7,875 $21,656.25 $24,356.25 8,857 1.12% 12.47%
3 1.25% 9,844 $27,070.31 $29,770.31 10,826 1.37% 9.97%
4 1.50% 11,813 $32,484.38 $35,184.38 12,794 1.62% 8.31%
5 1.75% 13,781 $37,898.44 $40,598.44 14,763 1.87% 7.12%
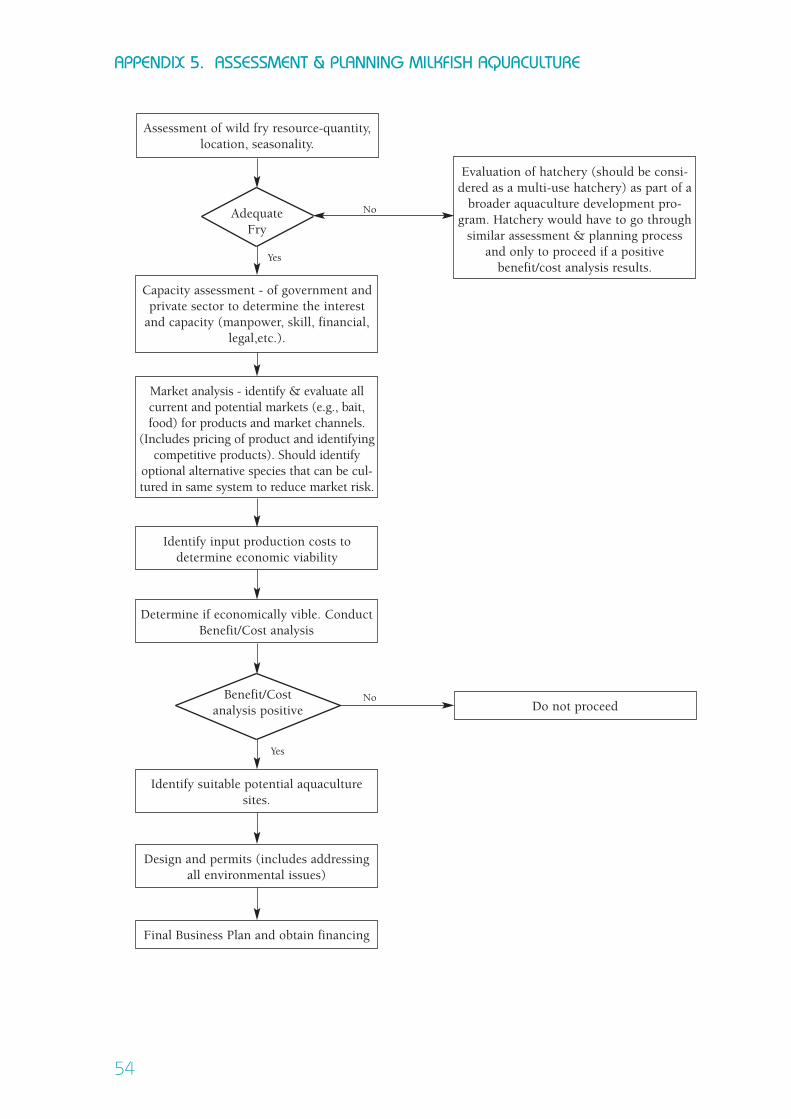
APPENDIX 5. ASSESSMENT & PLANNING MILKFISH AQUACULTURE
54
Assessment of wild fry resource-quantity,location, seasonality.
Market analysis - identify & evaluate allcurrent and potential markets (e.g., bait,food) for products and market channels.
(Includes pricing of product and identifyingcompetitive products). Should identify
optional alternative species that can be cul-tured in same system to reduce market risk.
Evaluation of hatchery (should be consi-dered as a multi-use hatchery) as part of a
broader aquaculture development pro-gram. Hatchery would have to go through
similar assessment & planning processand only to proceed if a positive
benefit/cost analysis results.
Adequate Fry
Capacity assessment - of government andprivate sector to determine the interest
and capacity (manpower, skill, financial,legal,etc.).
Identify input production costs to determine economic viability
Determine if economically vible. ConductBenefit/Cost analysis
Benefit/Costanalysis positive
Identify suitable potential aquaculturesites.
Design and permits (includes addressingall environmental issues)
Final Business Plan and obtain financing
Do not proceedNo
Yes
Yes
No

APPENDIX 6. NARRATIVE OF FINANCIAL & ECONOMIC ANALYSIS: MILKFISH IN SPCREGION
SCENARIOS
There are five scenarios that address hypothesized production scenarios that could potentially occurwith the development of milkfish aquaculture in the SPC region.
Scenario I - Extensive – This is the most likely scenario for initial pond production. The extensi-ve system will rely totally on the enhanced productivity (through commercial fertilizers) to supportthe growth of the milkfish.
Scenarios II - Extensive Plus – This represents an optional scenario that could be applied to mode-rately improved management over the entire system would allow greater management control andoperational efficiency. It represents a progressive increase in stocking density up to 5 milkfish/m2.The natural productivity of the ponds would be supplemented with a moderate quality feed (chic-ken grower).
Scenario III - Semi-intensive – This represents a scenario that could be applied to ponds that pro-vide adequate physical controls and have experienced management. The use of high quality sup-plemental feed would allow for the increased stocking density and increase in the number of cropsper year.
Scenario IV - Intensive – Represents a further progression of pond culture; however, this requiresvery knowledgeable and experienced management to be successful.
Scenario V - Net/Pen culture – These represents production scenarios that move from the land lea-sed pond culture to production along the coast and in protected waters. A net or pen culture is anarea immediately along the coast or in shallow waters < 4 m deep (tidal range dependent) that a netis used to enclose an area forming an enclosed pond.
Scenario VI - Cage – This scenario culture method could be carried out at the highest stocking den-sity. Fine mesh nets forming cages would be suspended in marine waters that are protected fromwaves and storm surge along with being away from boat traffic channels. This would requiresophisticated management and labor force similar to an intensive system. Even though this elimi-nates the costs associated with pond construction, other costs of watercraft and cage support facili-ties (e.g., walkway, dockage, and security watch facility) are incurred. The fish are totally depended onan artificial feed of the highest quality.
ASSUMPTIONS
BIOLOGICALStocking Rate (fry/m2)
This is the number of fry that are stocked per area. It should be noted that the stocking density forraising the milkfish to the live bait size (40-60 g/piece) allows for a higher stocking density thanthat used for grow-out to food size (250-300 g/piece), since the fish are harvested after approxi-mately 40-60 days of culture and to maintain biomass the stocking density is increased. In anextensive system this ranges from 10,000-30,000 per ha. In an "extensive plus" system (with somesupplemented feeding with modest grade feed) this ranges from 30,000-50,000 per ha. In a semi-intensive system this ranges from 100,000 to 250,000 per ha. Intensive and net/pond systems rangefrom 300,000 to 500,000 per ha. In the case of cages, it would be the 50 to 100- fry/m3 area. Thiswill be influenced by site-specific conditions. Note – this will depend on the targeted product har-vest size (i.e., larger size will require a reduction in stocking rate).
Survival Rate
This is survival from stocking to harvest. This can range from 60-80% under pond grow-outsystems depending on the physical condition, control of the ponds and predators, and quality ofmanagement. A value of 70% is used in all the scenarios, which represents a moderately good survival.
Crops Per YearThis is the number of complete grow-out cycles per year (from stocking to total harvest).
55

Feed Conversion RateThis is the weight ratio of supplemental feed to milkfish produced. There is no supplementalfeed in scenario I so it has a value of zero. Scenarios II & III utilize a moderate quality supple-mental feed and are progressively dependent on this feed for nutrition as the stocking densityincreases. Scenarios IV & V utilize a high quality milkfish feed that will serve as the main nutri-tional source.
Harvest Body Weight (kg)The average harvest body weight of 40-60 g/milkfish is the target at harvest for live bait. For fro-zen bait and food, it would be 125-200 g/fish; however, for this size product it would require areduction in stocking rate.
PHYSICALFarm Pond Area (ha)
This is actual pond area under water or in the case of pens it is the area at mean low tide. Forcages it would be the 10,000 m3 area.
Labor Requirement (people/ha)This is the number of full-time equivalent positions that are required per given area of ponds.This will vary with the intensity of culture system and the management skill level.
FINANCIALSale Price of Product - Farm-Gate ($/kg)
Local MarketThis is the median price the farm (on farm price) receives for product sold in the local market.
Export MarketThis is the median price the farm (on farm price) receives for product sold for the export market.
Market Share (%)Local MarketThis is the portion (%) of the total production that enters the local market. This is consideredthe priority market, since a higher price is received in the local market (does not incur all thecosts associated with participating in international markets).
Export MarketThis is the portion (%) of the total production that enters the export market.
Fry Cost ($/Fry)This is the cost per fry delivered to the farm (shipping, packing, handling costs included). Itwould be the cost of obtaining the fry from the wild or a hatchery. Generally wild fry collectioncosts will be lower than the cost to produce the fry in a hatchery and is the value assumed.
Feed Cost ($/kg)This is the price of the supplemental feed utilized. A medium grade feed (chicken grower) is usedas a supplement in Scenarios II & III. A high-grade nutritionally balanced commercial milkfishfeed is used in Scenarios IV, V, and VI, since there is a greater dependence on the feed as the mainsource of nutrition.
Electrical Power Rate ($/kW hr)This is the cost of electricity per unit.
Electric Power Demand (kW hr/ha/year)This is the total annual electrical demand per unit area of ponds. This will increase with the stoc-king density at semi-intensive with the use of pond aerators. It will also increase with the use of com-mercial pelleted milkfish feed, since it needs refrigerated storage to maintain the nutritional quality.
56

Chemical costs ($/ha/year)This is the total annual cost of chemicals per unit area of ponds. This includes lime, fertilizers, rote-none, piscacides (e.g., teaseed cake), etc. For example, these chemicals are applied depending on theconditions in the ponds to maximize natural productivity, while controlling pests (e.g., 12 g teaseedcake/m3 of water, rotenone 1-2 liters/ha (applied in shallow pond 5 cm), 500 kg lime/ha, fertilizer 25kg urea/ha plus 12.5 kg triple superphosphate/ha per application). In the pen and cage scenarios, che-mical use is modified to reflect the culture method (e.g., chemical cleaning of net material between cul-ture periods as needed).
Miscellaneous Costs ($/ha/year)This includes all supplies (including fuel) and materials that are consumed or have a useful life ofless than 1-year. It also includes repairs of equipment.
License Fee CostsNo costs are used in the scenarios, since it is considered a government operation or fees are wavedas a new industry. This normally consists of fees for licenses to conduct business and would be partof annual cost of doing business for a private entity.
Management CostBase Salary (up to 5 ha)This is a set amount in all of the scenarios with the exception of extensive, extensive plus, andsemi-intensive, since labor will fill the function of manager/owner. Since labor required for thesethree scenarios is only part-time, a separate management cost is not incurred in these 1 ha farm sce-narios. However, it should increase with technical requirements of the production system and scale ofoperation. In addition, costs for assistant manager and administrative staff will be incurred in largerfarms and ones with greater technical requirements.
Incremental Salary (>5 ha: $/ha)An incremental salary is not utilized in the current scenarios. However, in private enterprises itoften increases with responsibility associated with the size of the farm (can also be tied into a salarybonus above a certain base production goal).
Wage ($/hr)This is the wage rate paid to farm staff (non-management).
Lease ($/ha/year)No cost is assigned to the scenarios, since it is assumed to be on government owned land. Normally,a private entity would incur an annual cost for the lease of land utilized by the farm.
Fixed AssetsPond construction Cost ($/ha)A cost is assigned for the construction of the ponds or culture system.
Building Cost (Initial)This is for building structures for the storage of equipment, processing area, security, and on-farmhousing as needed.
Land Cost ($/ha)No cost is assigned, since it is assumed to be on government owned land. Normally, a private entitywould either buy the land or lease it; therefore, this provides for that option.
Equipment CostEquipment needs (e.g., pumps, refrigeration, vehicles, etc.) to be replaced and an allowance topurchase new equipment is provided. In addition, pond aerators along with electrical lines to theponds will be needed.
57

Working Capital Rate (% TVC)Working capital is calculated as 50% of the total annual costs minus depreciation. This is basedon the assumption that it would take six months for the cash inflow from harvest sales to meet orexceed the cash outflow. Working capital needs vary slightly between the species and manage-ment practices. For example, cost and revenue differences depend on growth rates of the species,stocking rates and schedules, feeding practices and feed quality, pond design and size, and thedegree of automation.
Total Equity Total equity reflects the portion of the total investment in the farm that is provided by the owners(shareholders) capital investment. In this case it is assumed with a government funded and ope-rated facility, the total equity will be the same as the total invested.
Total InvestmentThis is the total investment in the farm.
Depreciation Schedule (years)PondsA 20-year depreciation schedule is used.
Building Since no cost is assigned to the fully depreciated buildings there is no depreciation schedule.
EquipmentAn average 5-year depreciation schedule is used.
Size of LoanThere is no loan applied in the scenarios. However, under private operation a loan is usually utilized.
Loan Terms (years)This does not apply in the current scenarios, since there is no loan. However, it would normallybe the years of the loan.
Interest RateThis does not apply in the current scenarios, since there is no loan.
Insurance Premium Rate (%)There is no insurance premium, since it is assumed in the case of government operations they areusually considered self-insured.
Property Tax Rate (%)No property tax is applied, since it is assumed in this case the government owns it and thegovernment does not assess property tax on itself.
Corporate Tax RateNo corporate tax rate is paid, since it is assumed to be a government operation.
Inflation Rate on Lease (Annual)This does not apply, since there is no lease of property. However, there is usually an inflationclause in private leases that account for increase in the lease fee over the term of the lease.
Inflation Rate on OperationsThe rate utilized is 2.5%. However, the current scenarios only look at a single year operation andnot over an extended period so this inflation rate does not influence the scenarios based on a sin-gle year of operation.
58

APPENDIX 7. FINANCIAL ANALYSIS OF CULTURE METHODS FOR MILKFISH
59
SP
EC
IES
:C
HA
NO
S C
HA
NO
S -
TUN
A B
AIT
FIS
H (4
0-60
g/fi
sh)
12
34
56
AS
SU
MP
TIO
NS
BIO
LOG
ICA
L Sto
ckin
g R
ate
(PL'
s/sq
m)
SR
35
1030
3050
Sur
viva
l Rat
eS
UR
70,0
0%70
,00%
70,0
0%70
,00%
70,0
0%70
,00%
Cro
ps P
er Y
ear
CP
Y5
55
55
5Fe
ed C
onve
rsio
n R
ate
FCR
22
22
22
Har
vest
Bod
y W
eigh
t (kg
)H
BW
0,06
0,06
0,06
0,06
0,06
0,06
PH
YS
ICA
LFa
rm P
ond
Are
a (h
a or
10,
000
cu m
for
cage
s)FP
A1
11
11
1La
bor
Req
uire
men
t (p
eopl
e/ha
)LR
11
1,5
22
10FI
NA
NC
IAL S
ale
Pric
e of
Pro
duct
- F
arm
-Gat
e ($
/kg)
Loca
l Mar
ket
SP
LM$4
,00
$4,0
0$4
,00
$4,0
0$4
,00
$4,0
0E
xpor
t Mar
ket
SP
EM
$4,0
0$4
,00
$4,0
0$4
,00
$4,0
0$4
,00
Mar
ket S
hare
(%
)Lo
cal M
arke
tM
SLM
100,
00%
100,
00%
100,
00%
100,
00%
100,
00%
100,
00%
Exp
ort M
arke
tM
SE
M0,
00%
0,00
%0,
00%
0,00
%0,
00%
0,00
%Fr
y C
ost (
$/Fr
y)P
LC0,
050,
050,
050,
050,
050,
05Fe
ed C
ost (
$/kg
)FC
$0,0
0$0
,20
$0,4
0$0
,40
$0,4
0$0
,40
Ele
ctric
al P
ower
Rat
e ($
/kw
hr)
EP
R$0
,20
$0,2
0$0
,20
$0,2
0$0
,20
$0,2
0E
lect
ric P
ower
Dem
and
(kw
hr/h
a/ye
ar)
EP
D10
020
050
010
0010
010
0C
hem
ical
Cos
ts (
$/ha
/yea
r)C
C$1
00,0
0$1
00,0
0$1
00,0
0$2
50,0
0$1
00,0
0$2
50,0
0M
isce
llane
ous
Cos
ts (
$/ha
/yea
r)M
C$1
00,0
0$1
00,0
0$1
00,0
0$2
00,0
0$2
00,0
0$2
000
,00
Lice
nse
Fee
Cos
tsLF
C$0
,00
$0,0
0$0
,00
$0,0
0$0
,00
$0,0
0M
anag
emen
t C
ost
Bas
e S
alar
y (u
pto
5ha)
MC
BS
$3 0
00,0
0$3
500
,00
$8 0
00,0
0$1
0 00
0,00
$10
000,
00$1
0 00
0,00
Incr
emen
tal S
alar
y (>
5ha:
$/h
a)M
CIS
$0,0
0$0
,00
$0,0
0$0
,00
$0,0
0$0
,00
Wag
e ($
/hr)
W$2
,50
$2,5
0$2
,50
$2,5
0$2
,50
$2,5
0Le
ase
($/h
a/ye
ar)
L$0
,00
$0,0
0$0
,00
$0,0
0$0
,00
$0,0
0Fi
xed
Ass
ets P
ond
Con
stru
ctio
n C
ost
($/h
a)P
CC
$15
000,
00$1
5 00
0,00
$15
000,
00$1
5 00
0,00
$2 0
00,0
0$5
5 00
0,00
Bui
ldin
g C
ost (
Initi
al)
BC
$5 0
00,0
0$1
0 00
0,00
$25
000,
00$2
5 00
0,00
$5 0
00,0
0$2
5 00
0,00
Land
Cos
t ($
/ha)
LC$0
,00
$0,0
0$0
,00
$0,0
0$0
,00
$0,0
0E
quip
men
t C
ost
EC
$2 0
00,0
0$5
000
,00
$5 0
00,0
0$1
0 00
0,00
$2 0
00,0
0$1
5 00
0,00
Wor
king
Cap
ital R
ate
(% T
VC
)W
CR
40,0
0%40
,00%
40,0
0%40
,00%
40,0
0%40
,00%
Tota
l Equ
ityTE
$27
968,
00$4
0 52
0,00
$67
456,
00$1
16 0
28,0
0$7
3 11
2,00
$210
308
,00
Tota
l Inv
estm
ent
TI$2
7 96
8,00
$40
520,
00$6
7 45
6,00
$116
028
,00
$73
112,
00$2
10 3
08,0
0D
epre
ciat
ion
Sch
edul
e (y
ears
)P
onds
DS
P20
2020
2020
20B
uild
ing
DS
B20
2020
2020
20E
quip
men
tD
SE
55
55
55
Siz
e of
Loa
nS
L$0
,00
$0,0
0$0
,00
$0,0
0$0
,00
$0,0
0Lo
an T
erm
(ye
ars)
LT15
1515
1515
15In
tere
st R
ate
IR10
,00%
10,0
0%10
,00%
10,0
0%10
,00%
10,0
0%In
sura
nce
Pre
miu
m R
ate
(%)
IPR
0,00
%0,
00%
0,00
%0,
00%
0,00
%0,
00%
Pro
perty
Tax
Rat
e (%
)P
TR0,
00%
0,00
%0,
00%
0,00
%0,
00%
0,00
%C
orpo
rate
Tax
Rat
eC
TR0,
00%
0,00
%0,
00%
0,00
%0,
00%
0,00
%In
flatio
n R
ate
on L
ease
(A
nnua
l)IR
L0,
00%
0,00
%0,
00%
0,00
%0,
00%
0,00
%In
flatio
n R
ate
on O
pera
tions
IRO
3,00
%3,
00%
3,00
%3,
00%
3,00
%3,
00%
AQ
UA
CU
LTU
RE
PR
OD
UC
TIO
N S
CE
NA
RIO
S (V
ALU
ES
IN U
S$)
EX
TEN
SIV
EE
XTE
NS
IVE
PLU
SS
EM
I-IN
TEN
SIV
EIN
TEN
SIV
EP
EN
SC
AG
ES
PART 1

60
12
34
56
PR
OD
UC
TIO
NU
nit P
rod
uctio
n (
kg
/ha
/cro
p)
UP
1 2
60
2 1
00
4 2
00
12
60
01
2 6
00
21
00
0T
ota
l P
rod
uctio
n (
kg
/fa
rm/y
ea
r)T
P6
30
01
0 5
00
21
00
06
3 0
00
63
00
01
05
00
0
RE
VE
NU
E (
R)
$2
5 2
00
,00
$4
2 0
00
,00
$8
4 0
00
,00
$2
52
0
00
,00
$2
52
0
00
,00
$4
20
0
00
,00
OP
ER
AT
ING
EX
PE
NS
ES
(A
NN
UA
L)
VA
RIA
BL
E C
OS
TS
La
bo
rF
ull
Tim
e S
taff
5 2
00
,00
5 2
00
,00
7 8
00
,00
10
40
0,0
01
0 4
00
,00
52
00
0,0
0O
cca
sio
na
l L
ab
or
2 0
00
,00
4 1
60
,00
6 2
40
,00
8 6
20
,00
4 1
60
,00
5 0
00
,00
Fe
ed
0,0
04
20
0,0
01
6 8
00
,00
50
40
0,0
05
0 4
00
,00
84
00
0,0
0F
ry7
50
0,0
01
2 5
00
,00
25
00
0,0
07
5 0
00
,00
75
00
0,0
01
25
00
0,0
0E
lect
rici
ty2
0,0
04
0,0
01
00
,00
20
0,0
02
0,0
02
0,0
0C
he
mic
als
10
0,0
01
00
,00
10
0,0
02
50
,00
10
0,0
02
50
,00
Mis
ce
llan
eo
us
10
0,0
01
00
,00
10
0,0
02
00
,00
20
0,0
02
00
0,0
0--
----
----
----
---
----
----
----
----
---
----
----
----
---
----
----
----
----
---
----
----
----
---
----
----
----
----
-T
OT
AL
VA
RIA
BL
E C
OS
TS
(T
VC
)1
4 9
20
,00
26
30
0,0
05
6 1
40
,00
14
5 0
70
,00
14
0 2
80
,00
26
8 2
70
,00
FIX
ED
CO
ST
SS
ala
ry P
ers
on
ne
lM
an
ag
er/
Ow
ne
r0
,00
0,0
00
,00
10
00
0,0
01
0 0
00
,00
10
00
0,0
0A
ssis
t M
an
ag
er
0,0
00
,00
0,0
05
00
0,0
05
00
0,0
05
00
0,0
0A
dm
in S
taff
0,0
00
,00
0,0
05
00
0,0
05
00
0,0
05
00
0,0
0L
an
d R
en
t0
,00
0,0
00
,00
0,0
00
,00
0,0
0In
tere
st
on
Lo
an
0,0
00
,00
0,0
00
,00
0,0
00
,00
Lo
an
Pri
ncip
al
0,0
00
,00
0,0
00
,00
0,0
00
,00
De
pre
cia
tio
n Po
nd
s7
50
,00
75
0,0
07
50
,00
75
0,0
01
00
,00
2 7
50
,00
Bu
ildin
g2
50
,00
50
0,0
01
25
0,0
01
25
0,0
02
50
,00
1 2
50
,00
Eq
uip
me
nt
40
0,0
01
00
0,0
01
00
0,0
02
00
0,0
04
00
,00
3 0
00
,00
Lic
en
se
Fe
e0
,00
0,0
00
,00
0,0
00
,00
0,0
0In
su
ran
ce
0,0
00
,00
0,0
00
,00
0,0
00
,00
Pro
pe
rty T
ax
0,0
00
,00
0,0
00
,00
0,0
00
,00
----
----
----
----
---
----
----
----
---
----
----
----
----
---
----
----
----
---
----
----
----
----
---
----
----
----
---
TO
TA
L F
IXE
D C
OS
TS
(T
FC
)1
40
0,0
02
25
0,0
03
00
0,0
02
4 0
00
,00
20
75
0,0
02
7 0
00
,00
TO
TA
L O
PE
RA
TIN
G C
OS
T (
TO
C)
$1
6 3
20
,00
$2
8 5
50
,00
$5
9 1
40
,00
$1
69
0
70
,00
$1
61
0
30
,00
$2
95
2
70
,00
OP
ER
AT
ING
PR
OF
IT (
OP
)$
8 8
80
,00
$1
3 4
50
,00
$2
4 8
60
,00
$8
2 9
30
,00
$9
0 9
70
,00
$1
24
7
30
,00
CO
RP
OR
AT
E T
AX
(C
T)
$0
,00
$0
,00
$0
,00
$0
,00
$0
,00
$0
,00
NE
T P
RO
FIT
(N
P)
$8
88
0,0
0$
13
45
0,0
0$
24
86
0,0
0$
82
93
0,0
0$
90
97
0,0
0$
12
4 7
30
,00
RE
TU
RN
ON
EQ
UIT
Y (
RO
E)
31
,75
%3
3,1
9%
36
,85
%7
1,4
7%
12
4,4
3%
59
,31
%
RE
TU
RN
ON
IN
VE
ST
ME
NT
(R
OI)
31
,75
%3
3,1
9%
36
,85
%7
1,4
7%
12
4,4
3%
59
,31
%
BR
EA
K E
VE
N (
PR
ICE
$U
NIT
)$
2,5
9$
2,7
2$
2,8
2$
2,6
8$
2,5
6$
2,8
1
BR
EA
K E
VE
N (
PR
OD
UC
TIO
N K
G/H
A/Y
R)
LO
CA
L M
KT
4 0
80
,00
7 1
37
,50
14
78
5,0
04
2 2
67
,50
40
25
7,5
07
3 8
17
,50
BR
EA
K E
VE
N (
PR
OD
UC
TIO
N K
G/H
A/Y
R)
EX
PO
RT
MK
T4
08
0,0
07
13
7,5
01
4 7
85
,00
42
26
7,5
04
0 2
57
,50
73
81
7,5
0
Un
it V
ari
ab
le C
ost
($
/kg
)$
2,3
7$
2,5
0$
2,6
7$
2,3
0$
2,2
3$
2,5
5T
ota
l F
ixe
d C
ost/
ha
$1
40
0,0
0$
2 2
50
,00
$3
00
0,0
0$
24
00
0,0
0$
20
75
0,0
0$
27
00
0,0
0T
ota
l V
ari
ab
le C
osts
/ha
$1
4 9
20
,00
$2
6 3
00
,00
$5
6 1
40
,00
$1
45
0
70
,00
$1
40
2
80
,00
$2
68
2
70
,00
To
tal
Co
st/
ha
$1
6 3
20
,00
$2
8 5
50
,00
$5
9 1
40
,00
$1
69
0
70
,00
$1
61
0
30
,00
$2
95
2
70
,00
Un
it T
ota
l C
ost
($
/kg
)$
2,5
9$
2,7
2$
2,8
2$
2,6
8$
2,5
6$
2,8
1
AQ
UA
CU
LT
UR
E P
RO
DU
CT
ION
SC
EN
AR
IOS
(V
AL
UE
S I
N U
S$
)
EX
TE
NS
IVE
PL
US
SE
MI-
INT
EN
SIV
EIN
TE
NS
IVE
PE
NS
CA
GE
EX
TE
NS
IVE
PART 2

APPENDIX 8. EVALUATION PROCESS OF ESTABLISHING A COMMERCIAL BAITFISH FARM
I. FRY SUPPLY A. Availability
1. Size of fry available 2. Seasonality
B. Cost 1. Cost by size 2. Cost by month
C. Quantity/Quality D. Shipping process and cost options
1. Shipping quantity in a box at different sizes of fry 2. How much in container? 3. Is it cheaper per container?
II. GROW-OUT PRODUCTION A. Procedure
1. Pond steps a) Fry b) Holding c) Grow-out d) Transfer
2. Stocking density a) Phase I - fry b) Phase II - holding c) Phase III - grow-out d) Phase IV - acclimatization
3. Feed a) Rate
(1) Maintenance diet (stunting growth) (2) Growth diet
b) Type c) Frequency
B. Growth rate 1. Phase I - fry 2. Phase II - holding 3. Phase III - grow-out 4. Phase IV - acclimatization
C. Mortality at each phase 1. Phase I - fry 2. Phase II - holding 3. Phase III - grow-out 4. Phase IV - acclimatization
III. TRANSFER PROCESS TO LONGLINE VESSELS A. Equipment
1. Live pumps 2. Transport tank I truck a) Oxygen 3. Monitoring system
B. Process
IV. EVALUATION OF MARKET DEMAND AND REQUIREMENTS FOR PRODUCT A. Longline tuna fleet
1. Current 2. Future
61

B. Breakdown of fleet composition 1. Size of vessel bait wells
C. Market price 1. Size 2. Season by month
V. ALTERNATIVE PRODUCT PRODUCTION A. Marine shrimp B. Tilapia
1. Natural coloration 2. Red-hybrid
62

APPENDIX 9. PROCESS IN ESTABLISHING A COMMERCIAL AQUACULTURE OPERATION
I. PRELIMINARY ASSESSMENT A. Identification of specific intent/purpose B. Site assessment C. Preliminary design D. Preliminary Business Plan E. Evaluation to proceed
II. DESIGN AND PERMITS A. Design
1. Design Documentation & Specs B. Permits
1. Environmental Impact Assessment/Statement 2. Permit application process
a) Non-wetland b) Wetland/Seashore Reserve/ or
3. Permit issuance C. Evaluation to proceed
III. FINALIZATION OF BUSINESS PLAN AND FINANCING A. Business Plan B. Financing C. Evaluation to proceed
IV. CONSTRUCTION A. Construction permits B. Bid process C. Construction contact D. Implementation E. Monitoring F. Completion
V. PRE - OPERATION A. Personnel recruitment B. Equipment/supplies purchasing C. Systems evaluation D. Test operation of all facilities, equipment and verification of supplies
VI. COMMERCIAL OPERATION A. Production strategy
1. Production scheduling 2. Stocking/harvest 3. Alternate species
B. Production operations C. Farm maintenance
63

APPENDIX 10. INTERNET SITES FOR SUPPLIERS OF FROZEN MILKFISH BAIT.
Growfish - Gippsland Aquaculture Industry Network (GAIN)... said. The bait quality milkfish comes fromharvests that are deemed to be inferior in quality for human consumption. According to ... www.growfish.com.au/content.asp?contentid=327 - 21k - Cached - Similar pages
Seafood Industry Contacts - Indonesia ... We are exporter of milkfish for bait and human consumption, wecan supply about 300 MT/month. We have experience with milkfish export since 1995. ... www.sea-ex.com/countryinfo/indonesia.htm - 75k - Cached - Similar pages
Seafood Industry Contacts Indonesia Q - Z ... Main product: milkfish for bait and human consumption.Other products: red snapper, yellow pike conger, grouper, hair tail, cuttlefish etc. ... www.sea-ex.com/countryinfo/indonesia2.htm - 38k - Cached - Similar pages[ More results from www.sea-ex.com ]
All ActionTrade Portal , Import Export Trade Leads, Business Trade ... ... We would like to offer you Frozen milkfish and Round Scad/Muroaji forTuna ... Category: Seafood. Sub Category: Bait. Its an Offer to: sell. ... www.allactiontrade.com/tradeoffer/ offers1.asp?subcat=Bait&cat=Seafood - 62k - Cached - Similar pages
Indonetwork.info - Search All keywords in Products Catalog. ... Frozen Milkfish for Tuna Bait. FrozenMilkfish for Tuna Bait [May. 29, 2003 19:08:16]. PT. ..Frozen milkfish for Tuna Bait. Frozen Mackerel forTuna Bait. ... www.indonetwork.info/prod/AgQ3/0.html - 37k - Cached - Similar pages
Aquafind ... 30/03 INDONESIA (0). OFFER MILKFISH FOR TUNA BAIT - Harijanto, Andri 22:42:1410/30/03 INDONESIA (0). ***WTS Frozen Horse Mackerel ... www.aquafind.com/boards/boards.php?name=comfish - 19k - Cached - Similar pages
Indonetwork.co.id - Mencari Semua Kata di Semua Pilihan. ... beku.... (Selengkapnya...). Frozen Milkfishfor Tuna Bait. Jual: Frozen Milkfish for Tuna Bait [29 May. 2003, 19:08:16]. Harga: Fluktuatif. ... www.indonetwork.co.id/all/AgQ3/60.html - 40k - Cached - Similar pages
Indonetwork.co.id - Mencari Semua Kata di Semua Pilihan. ... beku.... (Selengkapnya...). Frozen Milkfishfor Tuna Bait. Jual: Frozen Milkfish for Tuna Bait [29 May. 2003, 19:08:16]. Harga: Fluktuatif. ... www.indonetwork.co.id/all/AgQ3/60.html - 40k - Cached - Similar pages
Business Portal - Tpage.com ... CV. Samudra Intan Berlian [ID] Products : MILKFISH FOR TUNA BAIT &HUMAN CONSUMPTION CV. SAMUDRA INTAN BERLIAN IS SPECIALIST EXPORTER ... dir.tpage.com/11/08/02/ - 25k - Cached - Similar pages
Indonetwork.co.id - Mencari Semua Kata di Katalog Produk. ... Selengkapnya...). Frozen Milkfish for TunaBait. Frozen Milkfish for Tuna Bait [29 May. 2003, 19:08:16]. PT. Lima Er [Indonesia]. Harga: Fluktuatif. ... www.indonetwork.co.id/prod/Ag/110.html - 37k - Cached - Similar pages [ More results from www.indonetwork.co.id ]
Trade Board 2003 ... MILKFISH TUNA BAIT Ms. Nien 05:17:10 10/30/03 (0): Exporters of SmallAnimals, Birds and Reptiles AMAZING LOOK 13:23:28 10/16/03 (2): ... www.arab.de/etrade/trade6.html - 53k - Cached - Similar pages
Marine Food Supplies,Seafood Supplies,Wholesale Marine Food, .... Chanos Milkfish4 Tuna Bait Offeringvarious tuna bait esp milkfish in almost end of season, we are still able to supply 7-9 containers 40' fcl reefermilkfish. ... trade.indiamart.com/offer/agro-farm/ marine-food-supplies/sell.html - 82k - Cached - Similar pages
Free trading board for fishing, aquaculture and seafood companies ... FILEFISH/LEATHER JACKET W/RAND H&G, PT. SAMUDRA KUALITA MINA 30-10-2003, MILKFISHBAIT 4M INDONESIA, PT. SUKSES JAYA MAKMUR 30-10-2003, WTS/// FROZEN SEAFOOD, ... www.seafoodboard.com/cgi-bin/ board.cgi?step=2&page_num=4 - 19k - Cached - Similar pages
64

Free trading board for fishing, aquaculture and seafood companies ... BASIS International 14-10-2003,WTS: Milkfish for tuna bait, de_kitchen 14-10-2003, WTS: Cuttlefish WR Uncleaned, de_kitchen 14-10-2003, WTS - IMITATION CRAB STICKS, ... www.seafoodboard.com/cgi-bin/ board.cgi?step=2&page_num=1 - 18k - Cached - Similar pages
To SELL products or services. Offer to Sell and Post an Offer. Do ... ... Frozen Marine Product and Steering Wheel Company : Lima Roti Dua Ikan Products Frozen Milkfish for Tuna Bait Frozen Round Scad ( Muroaji ) Dried ... www.ariestrade.com/ ielist.cfm?startrow=4481&posttype=2 - 73k - Cached - Similar pages
SHRIMP SEMOGA JAYA : Shrimp Export from Indonesia Around The ... ... Chanos Chanos) In a separatebuilding situated away from our Shrimp processing facilities, we have been producing frozen Milkfish for tunabait since 1990. ... shrimp.semogajaya.com/product.htm - 16k - Cached - Similar pages
Chinawebs, B2B vertical international trade website... We supply Frozen fish as follows : 1. Milkfish for tunabait 2. Muroaji for tuna bait 3. Ribbonfish 4. Yellow Croaker 5. Yellow Tilapia 6. leatherjacket If you ... www.chinawebs.com/trade/list_sub2.php?sub2_id=107 - 11k - Cached - Similar pages
EXPO - EXPORT - Search result for:HUMAN - [ Translate this page ] ... Samudra Intan Berlian, ContactSamudra Intan Berlian. Productos : Milkfish for bait & Milkfish for HUMAN consumption. Gresik, Indonesia. ... www.my-product.net/search.php3?terms=HUMAN - 56k - Cached - Similar pages
Art und Weise Manufacturers - [ Translate this page ] ... Samudra Intan Berlian, Contact Samudra IntanBerlian. Produkte : Milkfish for bait & Milkfish for human consumption. Gresik, Indonesia. ... world-product-expo.com/Textiles/Fashion/?from=276 - 89k - Cached - Similar pages
Fishing Monthly - Latest Fishing Reports - Updated Weekly... are some thumping Spanish mackerel present,as the bait schools are in ... doggie mackerel, broad barred Spanish mackerel, coral trout, milkfish, grinner,stripey ... www.fishingmonthly.com.au/reports/Fishing-reports/ qld/2003/0825.html - 82k - Cached - Similar pages[ More results from www.fishingmonthly.com.au ]
Business Portal - Tpage.com... items are frozen fish for human comsumption and some kinds of fish bait. ...PH] Go to Homepage Products : Bonuan Boneless Bangus(deboned milkfish) Bonuan Boneless ... dir.tpage.com/21/14/06/ - 25k - Cached - Similar pages
Aquatic Network: Aquaculture Products & Services... mozcom.com Subcategory: Aquaculture--milkfish;Seafood Production/Processing Comments: Looking for buyers of milkfish--fry, fresh ... West Central Bait Co., Inc. www.aquanet.com/products/dir_aq3a.htm - 43k - Cached - Similar pages
EXPO - EXPORT - Search result for:HUMAN - [ Translate this page ]... Samudra Intan Berlian, ContactSamudra Intan Berlian. Produits : Milkfish for bait & Milkfish for HUMAN consumption. Gresik, Indonesia. www.expo-export.net/search.php3?terms=HUMAN - 54k - Cached - Similar pages
EXPO - EXPORT - Search result for:HUMAN - [ Translate this page ]... Samudra Intan Berlian, ContactSamudra Intan Berlian. Produkte : Milkfish for bait & Milkfish for HUMAN consumption. Gresik, Indonesia. www.world-product-expo.com/search.php3?terms=HUMAN - 55k - Cached - Similar pages[ More results from www.world-product-expo.com ]
Chinawebs, B2B vertical international trade website... We supply Frozen fish as follows : 1. Milkfish for tunabait 2. Muroaji for tuna bait 3. Ribbonfish 4. Yellow Croaker 5. Yellow Tilapia 6. leatherjacket If you ... www.chinawebs.com/trade/list_sub2.php?sub2_id=107 - 11k - Cached - Similar pages
Trade Leads - Hop Cones - Fresh Dried - buy, sell, agents, ... ... Besides, we also could supply live lobster, any dried fish, kerapu and Tuna fishbait (muroaji and milkfish). Details / Contact. Buy Seafood dried fish shrimp. ... www.afacerionline.com/index.php/ TradeLeads/showProducts/11704 - 33k - Cached - Similar pages
export offers directory, export offers guide Bizeurope.com... Size 100 Grams above 2)Frozen Ribbon FishSize 200~700 Grams 3)Frozen Muroaji (Scad)for tuna bait 4)Frozen Milkfish for tuna bait and consumergood 5)Baby ... www.bizeurope2.com/export/sept2003.htm - 101k - Cached - Similar pages
65

seafood directory exporters and manufacturers - Bizeurope.com... Bait Products: herring, imported anddomestic illex squid, loligo squid, sardines ... of deboning processing and distribution of Bonuan BonelessBangus (milkfish). ... www.bizeurope.com/bsr/sourcing/seafood/001.htm - 101k - Cached - Similar pages
Taiwan Product Online: Agricultural & Food Products : Taiwan ... ... tool & supply/ supplies- (1) fishinghook, fish hook- bait holder hook ... mossambicus, tilapia fillet ( ixumidai) oreochromis niloticus, milkfish,catfish, large ... www.manufacture.com.tw/tpo4/product-category/ products/z411800e.htm - 42k - Cached - Similar pages
Trade Leads - Fishing - Industrial - buy, sell, agents, ... Besides, we also could supply live lobster, anydried fish, kerapu and Tuna fish bait (muroaji and milkfish). Details / Contact. ... www.afacerionline.com/index.php/ TradeLeads/showProducts/10801/4 - 34k - Cached - Similar pages[ More results from www.afacerionline.com ]
Interbirja... 60367 OFFER: [ID] We sell Milkfish for Tuna Bait and fish feed Posted by Mr. Heru cahyonofrom Erozone Global Logistics, Indonesia, on 2/24/2003 1:50:44 AM. ... www.interbirja.net.md/adverte.php?s=1&type=102 - 21k - Cached - Similar pages
Best Trade Site... and exporter of seafood in Taiwan.Such as illex squid,mackerel,milkfish,muroaji,pacific ...07-24 Message: Our product have Illex Squid for human and for bait. ... portugaltrade.org/site/best_site.htm - 70k - Cached - Similar pages
export offers directory, export offers guide Bizeurope.com ... Description: Specialist of milkfish exporter.Quantity: 300 mt/monthBrand: sib Size: all size For tuna bait, and human consumption. ... www.bizeurope2.com/export/july4.htm - 101k - Cached - Similar pages
66