Milk marketing strategies adopted by dairy farmers: A ...
13
International Journal of Environmental & Agriculture Research (IJOEAR) ISSN:[2454-1850] [Vol-7, Issue-6, June- 2021] Page | 4 Milk marketing strategies adopted by dairy farmers: A study of Ernakulam district Priyanka T R 1* , Dr S Harikumar 2 *1 Research Scholar, Department of Applied Economics, Cochin University of Science and Technology, Kerala 682022, India. 2 Professor (Rtd), Department of Applied Economics, Cochin University of Science and Technology, Kerala 682022, India. *Corresponding Author Abstract— Various studies and reports expect that due to great potential and increased demand on consumer’s side, dairy market in Kerala will grow at a CAGR of 15.7 percent during 2021-2026. But the reality and projection are quite different. Due to the involvement of many factors like lack of infrastructure facilities, transportation, interference of intermediaries, less bargaining capacity and lack of knowledge about the marketing conditions Kerala’s milk marketing is facing a huge challenges and constraints. Recent studies found that more than 70 percent of milk is sold to dairy cooperative society which implies that a traditional marketing channel dominates in Kerala. In this study, Ernakulam district have chosen. Ernakulam, which has over 330 co-operative societies of Milma in the district, faces a shortage of 70,000 litres per day. This gap is met by importing milk from Tamil Nadu and Karnataka. It indicates that there is a huge scope for dairy market in Ernakulam due to the steady increase in demand on consumer’s side. But recent studies reveal that the existing marketing conditions are not favourable to farmers. Therefore, in this context, the marketing strategy adopted, various milk marketing channels, the reasons for choosing, price received and quantity of milk sold to these stakeholders/channels on the producer’s side to be studied in detail. All these aspects are covered under this study. Present study tries to help the government and concerned department in taking appropriate actions for boosting the milk market in Ernakulam district by giving equal importance to both production and marketing side. Keywords— Consumer, Distribution channels, Marketing, Milk, Producer. I. INTRODUCTION The International Market Analysis Research and Consulting Group‟ (IMARC Group) latest report, titled “Dairy Industry in Kerala: Market Size, Growth, Prices, use segments, Cooperatives, Private Dairies, Procurement and Distribution”, offers an in-depth analysis of the Kerala dairy market. In 2020, the milk production in Kerala reached a volume of 2.5 billion litres. The state currently represents the twelfth largest dairy market in India (IMARC, 2020). According to the report, Kerala dairy market exhibited strong growth during 2015-2020 and dairy market grew at a CAGR of 13 percent during 2014-2019. In Kerala, milk has become the biggest product segment. Like milk, other by products such as frozen/flavoured yoghurt, cheeses, Ultra High Temperature (UHT) milk, flavoured milk and butter milk also have the scope of growing market. As per IMARC dairy market of Kerala will continue its growth in the coming years. In Kerala, Milma is the major contributor of milk and milk products. Besides Milma other cooperatives like People‟s Dairy Development Project (PDDP) Central Society, Jeeva Milk etc. have significant contribution in Kerala‟s dairy market. IMARC Group expects that Kerala dairy market will grow at a CAGR of 15.7 percent during 2021-26(IMARC, 2020). Due to the involvement of many factors like lack of infrastructure facilities, transportation, interference of intermediaries, less bargaining capacity and lack of knowledge about the marketing conditions Kerala‟s milk marketing is facing a huge challenges and constraints. As a result, many of the farmers could not find market for their products which creates pricing issues and thereby lowering profit. Proper marketing strategies are essential for the better and successful running of dairy farms. There are many forms of marketing channels like consumers/households, cooperative society and intermediaries in Kerala. Farmers adopts various kinds of marketing strategies like direct marketing, marketing through intermediaries, marketing through advertisement based on their objectives and goals. Received:- 10 June 2021/ Revised:- 20 June 2021/ Accepted:- 24 June 2021/ Published: 30-06-2021 Copyright @ 2021 International Journal of Environmental and Agriculture Research This is an Open-Access article distributed under the terms of the Creative Commons Attribution Non-Commercial License (https://creativecommons.org/licenses/by-nc/4.0) which permits unrestricted Non-commercial use, distribution, and reproduction in any medium, provided the original work is properly cited.
Transcript of Milk marketing strategies adopted by dairy farmers: A ...

International Journal of Environmental & Agriculture Research (IJOEAR) ISSN:[2454-1850] [Vol-7, Issue-6, June- 2021]
Page | 4
Milk marketing strategies adopted by dairy farmers: A study of
Ernakulam district Priyanka T R
1*, Dr S Harikumar
2
*1Research Scholar, Department of Applied Economics, Cochin University of Science and Technology, Kerala 682022,
India. 2 Professor (Rtd), Department of Applied Economics, Cochin University of Science and Technology, Kerala 682022, India.
*Corresponding Author
Abstract— Various studies and reports expect that due to great potential and increased demand on consumer’s side, dairy
market in Kerala will grow at a CAGR of 15.7 percent during 2021-2026. But the reality and projection are quite different.
Due to the involvement of many factors like lack of infrastructure facilities, transportation, interference of intermediaries,
less bargaining capacity and lack of knowledge about the marketing conditions Kerala’s milk marketing is facing a huge
challenges and constraints. Recent studies found that more than 70 percent of milk is sold to dairy cooperative society which
implies that a traditional marketing channel dominates in Kerala. In this study, Ernakulam district have chosen. Ernakulam,
which has over 330 co-operative societies of Milma in the district, faces a shortage of 70,000 litres per day. This gap is
met by importing milk from Tamil Nadu and Karnataka. It indicates that there is a huge scope for dairy market in
Ernakulam due to the steady increase in demand on consumer’s side. But recent studies reveal that the existing marketing
conditions are not favourable to farmers. Therefore, in this context, the marketing strategy adopted, various milk marketing
channels, the reasons for choosing, price received and quantity of milk sold to these stakeholders/channels on the producer’s
side to be studied in detail. All these aspects are covered under this study. Present study tries to help the government and
concerned department in taking appropriate actions for boosting the milk market in Ernakulam district by giving equal
importance to both production and marketing side.
Keywords— Consumer, Distribution channels, Marketing, Milk, Producer.
I. INTRODUCTION
The International Market Analysis Research and Consulting Group‟ (IMARC Group) latest report, titled “Dairy Industry in
Kerala: Market Size, Growth, Prices, use segments, Cooperatives, Private Dairies, Procurement and Distribution”, offers an
in-depth analysis of the Kerala dairy market. In 2020, the milk production in Kerala reached a volume of 2.5 billion litres.
The state currently represents the twelfth largest dairy market in India (IMARC, 2020). According to the report, Kerala dairy
market exhibited strong growth during 2015-2020 and dairy market grew at a CAGR of 13 percent during 2014-2019. In
Kerala, milk has become the biggest product segment. Like milk, other by products such as frozen/flavoured yoghurt,
cheeses, Ultra High Temperature (UHT) milk, flavoured milk and butter milk also have the scope of growing market. As per
IMARC dairy market of Kerala will continue its growth in the coming years. In Kerala, Milma is the major contributor of
milk and milk products. Besides Milma other cooperatives like People‟s Dairy Development Project (PDDP) Central Society,
Jeeva Milk etc. have significant contribution in Kerala‟s dairy market. IMARC Group expects that Kerala dairy market will
grow at a CAGR of 15.7 percent during 2021-26(IMARC, 2020).
Due to the involvement of many factors like lack of infrastructure facilities, transportation, interference of intermediaries,
less bargaining capacity and lack of knowledge about the marketing conditions Kerala‟s milk marketing is facing a huge
challenges and constraints. As a result, many of the farmers could not find market for their products which creates pricing
issues and thereby lowering profit. Proper marketing strategies are essential for the better and successful running of dairy
farms. There are many forms of marketing channels like consumers/households, cooperative society and intermediaries in
Kerala. Farmers adopts various kinds of marketing strategies like direct marketing, marketing through intermediaries,
marketing through advertisement based on their objectives and goals.
Received:- 10 June 2021/ Revised:- 20 June 2021/ Accepted:- 24 June 2021/ Published: 30-06-2021
Copyright @ 2021 International Journal of Environmental and Agriculture Research
This is an Open-Access article distributed under the terms of the Creative Commons Attribution
Non-Commercial License (https://creativecommons.org/licenses/by-nc/4.0) which permits unrestricted
Non-commercial use, distribution, and reproduction in any medium, provided the original work is properly cited.

International Journal of Environmental & Agriculture Research (IJOEAR) ISSN:[2454-1850] [Vol-7, Issue-6, June- 2021]
Page | 5
In this study, Ernakulam district have chosen. Ernakulam, which has over 330 co-operative societies of Milma in the
district, faces a shortage of 70,000 litres per day. This gap is met by importing milk from Tamil Nadu and Karnataka. It
indicates that there is a huge scope for dairy market in Ernakulam due to the steady increase in demand on consumer‟s
side. Therefore, in this context, main purpose of this paper is to explain the various forms of marketing/distribution channels
and the marketing strategies adopted by the dairy farmers in Ernakulam district. This paper has been divided into two parts.
First part deal with the marketing strategies adopted by the farmers and second part explains the quantity of milk sold to and
price received at dairy cooperative society and to local market. In this section detailed analysis of various agents/marketing
channels and the reason for choosing them have been done.
II. REVIEW OF RELATED STUDIES
In the paper Rajendran et al (2004) reviewed the existing status of milk marketing and dairy cooperatives in India and also
provide the recommendations to meet the future challenges. In the study, they found that more than 80 percent of milk is
marketed through unorganized sector and less than 20 percent is marketed through organized sector. The paper suggests that
by changing the dairy cooperatives laws and regulations we can reduce the role of unorganized sector in marketing. They
also recommend that by strengthening the dairy cooperatives we can overcome the challenges in milk marketing like quality
of the product, product development, infrastructure development and global marketing. In the paper, Sharma (2015) analysed
determinants of market channel choices of small milk producers based on farm household survey. In this paper impact of
various market channel choices on farmers‟ income and technology adoption has been analysed. The study has found that
though there has been emerging milk marketing channels, the traditional sector still dominates. Farmers sell nearly 70 per
cent of their milk to traditional marketing/distribution channels. It indicated that small dairy farmers are not excluded from
the cooperatives but are excluded from the modern private sector. Nilabja et al (2017) did not find milk production
commercially profitable in many cases. Paper also suggests that despite the white revolution, milk production still remains
largely a subsistence activity. There are, however, large variations in milk price, animal stock, and profit among regions;
urbanisation levels of districts; and main occupations of producers. The results also reveal that the producer‟s remuneration
varies with the uses of different marketing channels. While informal traders still dominate the market, the sign of entry of
private corporate buyers is also clear. In the study, Anjani Kumar et al (2018) shows that in India the dominance of
smallholders in milk production is increasing. The average milk production of household is found to be directly proportional
to the farm size. This study also investigates whether there is any systematic bias against the participation of poor
smallholders in organized milk marketing outlets. It is found that farmers with access to institutional credit are more likely to
sell their output through formal milk marketing channels like processors and cooperatives and government agencies. This
paper also suggest that incentives should be provided to attract smallholders, women, and under privileged sections of the
rural Indian society.
Dinesh & Singh (2017) in their study found that far more serious treatment and a more comprehensive approach are required
for analysing the interaction between crop and livestock production system, gainful employment of surplus family labour and
also examine the reason for rearing milch animals in gaining family nutrition. In the paper, Saravanadurai and Muthuraj
(2018) has examined the role of cooperatives in dairy sector and explored constraints such cooperatives face in the successful
functioning in the form of lack of professionalism in management, lack of good leadership and improper government control.
This paper suggests that this sector require scientific management, value addition for the dairy products, and customer
services for ensuring better performance of milk cooperatives in rural India and bringing the inclusive growth in Indian
economy.
III. OBJECTIVES
Main objectives of the study are
1) To analyse the marketing strategies adopted by the farmers in Ernakulam district
2) To examine quantity of milk sold to various agents/marketing channels and to explore various reasons for choosing
them.
IV. SIGNIFICANCE OF THE STUDY
The study, „Development and testing of potential indicators for evaluation of dairy production systems‟, published in the
Indian Journal of Animal Sciences, ranked the states on the basis of six major indicators of dairy production. Kerala stood
first in three categories- animal breeding, resource availability and policies and regulations. The state was placed second in
veterinary infrastructure; seventh in dairy production and eighth in value addition and marketing (The Hindu, 2020).
Currently, Kerala represents the 12th
largest dairy market at the national level. It indicates that Kerala has the great potential

International Journal of Environmental & Agriculture Research (IJOEAR) ISSN:[2454-1850] [Vol-7, Issue-6, June- 2021]
Page | 6
in dairy sector since there is huge market for the product due to the growing demand. In this study, Ernakulam district have
chosen due to various reasons. In terms of milk production, Ernakulam stands seventh position whereas its demand for milk
is growing rapidly than others due to the influence of consumers who live in cities/ towns. Ernakulam district faces a
shortage of 70,000 litres of milk per day. Despite the intervention of the government by seeking help from the Tamil
Nadu Co-operative Milk Producers‟ Federation, dairy experts wonder if the gap can be bridged (New Indian Express,
2020). It indicates that there is a huge scope for dairy market in Ernakulam due to the steady increase in demand on
consumer‟s side. Therefore, on the producer‟s side, the marketing strategy adopted, various milk marketing channels, the
reasons for choosing and quantity of milk sells to these stakeholders/channels to be studied in detail. All these aspects are
covered under this study.
V. MATERIALS AND METHODS
Present study used both primary data and secondary data. Primary data was collected from 320 dairy farmers in Ernakulam
district with the help of pre tested structured interview schedule. Primary data were collected to examine the milk marketing
strategies and channels adopted by dairy farmers in Ernakulam district. Multi stage random sampling method was used in the
study. Secondary data were collected from reports of various departments of state government. Descriptive statistics like
frequency distribution, percentages, proportion and mean were also used to analyse the data.
VI. RESULTS AND DISCUSSION
This section has been divided into two sub sections. They are (i) marketing strategies adopted by the farmers and (ii)
marketing/distribution channels and reasons for choosing such channels in Ernakulam district.
6.1 Marketing strategy adopted by dairy farmers in Ernakulam district
Marketing strategies are the long term planning of objectives and goals that the entrepreneur want to achieve. Dairy farm as
an enterprise also follows some goals like expand farms by capturing huge market for product/increased sale and obtain
higher price and higher profit. In order to achieve these objectives, it is very essential to choose the appropriate marketing
strategies. Therefore, every farmer tries to utilize the available opportunities to find markets and increased sale for their
output. Sale of milk and milk products through right and proper channels is the major concern of dairy farmers. A strategy
adopted by farmers includes direct marketing, personal contact strategy and marketing through intermediaries/middlemen.
All these are explained in detail below. Table 1 show the distribution of farmers who follow marketing strategy of direct
marketing, personal contact strategy and marketing through intermediaries/middlemen.
6.1.1 Direct marketing strategy
Main strategy adopted by farmers is the direct marketing. Direct marketing is the direct sale of products to different channels
like cooperative society, households, middlemen and hotels /shops. Main advantage of such strategy includes finding of new
customers and building of relationships, increased sales, helps in finding the best channels which results in the higher price of
product. In the present study direct marketing includes personal and impersonal contact strategy as well.
TABLE 1
MARKETING STRATEGY ADOPTED BY DAIRY FARMERS IN ERNAKULAM DISTRICT
Farm Size*
Direct marketing Strategy Personal Contact Strategy Marketing through
intermediaries
Number of
farmers Percentage
Number of
farmers Percentage
Number of
farmers Percentage
Very small 94 29.4 59 31.1 0 0.0
Small 142 44.4 84 44.2 3 16.7
Medium 44 13.8 26 13.7 2 11.1
Large 11 3.4 7 3.7 2 11.1
Very large 29 9.1 14 7.4 11 61.1
Total 320 100 190 59.4 18 5.6
Source: Primary data
*On the basis of total investment made by farmers, farms have been divided into 5 categories. Very Small (Upto Rs.
500000), Small (Rs. 500001 - Rs. 1000000), Medium (Rs. 1000001 - Rs. 1500000), Large (Rs. 1500001 - Rs. 2000000),
Very Large (Above Rs. 2000000)

International Journal of Environmental & Agriculture Research (IJOEAR) ISSN:[2454-1850] [Vol-7, Issue-6, June- 2021]
Page | 7
From the table it is clear that all the farmers in Ernakulam district adopt direct marketing strategy. In other words, farmers
sell milk directly to households and dairy cooperative society.
6.1.2 Personal contact strategy
Second most important strategy adopted by the farmer is personal contact. This strategy involves personal contact by meeting
or communicating with someone regularly. In other words, farmers sell milk and milk products to different channels like
cooperative society, households and hotels/shops on the basis of acquaintance with them. They may be friends, relatives,
neighbours or familiar persons. Therefore, farmer can ensure some customers throughout the period. This is the main
advantage of choosing this strategy. It is a part of direct marketing strategy which includes the number of farmers who sells
milk to various market channels on the basis of personal knowledge or information about them. This is personal contact
strategy adopted by farmers in the marketing of milk. Table 1 show the distribution of farmers who chose personal contact
strategy. From the table it is clear that out of 320 farmers, 59.4 percent of farmers follow personal contact strategy to sale
milk. Across different farm size, out of 190 farmers who adopt personal contact strategy, 44.2 percent are small farmers
followed by very small with 31.1 percent. Only 3.7 percent of large farmers adopt personal contact strategy.
6.1.3 Marketing through intermediaries
Another important strategy adopted by the farmers is marketing through intermediaries. Generally, intermediaries are also
known as middlemen. They are traders of different products try to explore and create market opportunities in order to make
more profit. Middlemen act as a distributor of many products and try to reduce the gap between producer and consumer.
They are like traditional middlemen who pick up the bulk amount of milk from the farmers and directly sell to consumers,
hotels or restaurants and take a margin on the milk while selling.
But a very few farmers approach middlemen even though they get higher price. It is due to the unawareness and
unavailability of the information on middlemen. Some farmers are less confident about them. Table 1 show the distribution
of farmers who opted intermediaries for selling milk. It is found from the table that only a few farmers marketing milk
through intermediaries/middlemen. Out of 320 farmers, only 5.6 percent sell milk to middlemen. Out of 18 farmers who
market milk through intermediaries, 61.1 percent are very large farms. Reason for low percent of farmers who adopt
middlemen for marketing milk is found from the survey that firstly, they have less confidence on them. Secondly, they do not
have much network facilities to reach the reliable intermediaries.
6.1.4 Sale of packed and unpacked milk
Farmers sell either packed milk or unpacked or both. They sell packed or unpacked milk on the basis of the preference of
households. On the customers side, some prefer packed and some prefer unpacked milk. Normally unpacked milk is bought
by some customers because unpacked milk is comparatively cheaper than packed milk. Major reason for preferring unpacked
milk by customers is that farmers are nearby and easily can deliver at the doorstep with no additional cost. Major preference
for packed milk is from the customers who live in cities or town areas of Ernakulam. Because packed milk ensure quality,
availability, hygenity, fat content and easiness to store to its customers. In the present study by packed milk, we mean milk is
packed in either glass bottle or plastic bottle. In other words, it is called as bottled milk.
Table 2 illustrates the preference of customers towards packed and unpacked milk. From the table it is clear that out of 320
farmers, 59.4 percent of farmers sell unpacked milk only and 5.9 percent of farmers sells packed milk only. And 34.7 percent
of farmers sell both packed and unpacked milk. Across different farm size, out of 19 farmers who sell packed milk, 31.6
percent of them are very small and small farmers, 15.8 percent are very large farmers and 10.5 percent are medium and large
farmers. Out of 190 farmers who sell unpacked milk, 40.5 percent are small farmers, 38.4 percent are very small farmers,
10.5 percent are medium farms, 2.1 percent are large farmers and 8.4 percent are very large farmers. Out of 111 farmers who
sell both packed and unpacked milk, 13.5 percent are very small farmers, 53.2 percent are small farmers, 19.8 percent are
medium farmers, 4.5 percent are large farmers and 9 percent are very large farmers.

International Journal of Environmental & Agriculture Research (IJOEAR) ISSN:[2454-1850] [Vol-7, Issue-6, June- 2021]
Page | 8
TABLE 2
PACKED/UNPACKED MILK
Size of farm Packed/
Unpacked
Total
Number of farmers Percentage
Very Small
Packed 6 31.6
Unpacked 73 38.4
Both 15 13.5
Total 94 29.4
Small
Packed 6 31.6
Unpacked 77 40.5
Both 59 53.2
Total 142 44.4
Medium
Packed 2 10.5
Unpacked 20 10.5
Both 22 19.8
Total 44 13.8
Large
Packed 2 10.5
Unpacked 4 2.1
Both 5 4.5
Total 11 3.4
Very Large
Packed 3 15.8
Unpacked 16 8.4
Both 10 9.0
Total 29 9.1
Total
Packed 19 5.9
Unpacked 190 59.4
Both 111 34.7
Total 320 100.0
Source: Primary data
6.2 Milk marketing channel
A marketing channel is the people, organizations, and activities necessary to transfer the ownership of goods from the point
of production to the point of consumption. It is the way products get to the end-user, the consumer; and is also known as
a distribution channel (Wikipedia). Bowersox and cooper define channel, “as a system of relationship among businesses that
participate in the process of buying and selling products and services. It means that channels comprise a number of members
each responsible for specific tasks.” In order to achieve the goals of any enterprise we require a well organized and well
planned marketing strategy. A proper and efficient marketing channel helps in achieving various goals.
There are various kinds of marketing channels in dairy market. The first and foremost requirement of any kind of business or
enterprise is large number of consumers for their product. Therefore, in order to attract the customers for making profit or
enlarging the market share every seller adopts some sort of marketing strategies like direct marketing and marketing through
intermediaries and so on. Marketing channels act as wholesalers or retailers or distributors by providing certain functions like
buying products on bulk basis and resale to other customers, direct sales to consumers and distributing the products to
various kinds of customers. Therefore, the marketing channels help the producer to extend the market to a wider segment of
customers through direct and indirect sale. Figure 1 shows the supply chain of milk. It tells how milk is distributed among
various marketing channels.

International Journal of Environmental & Agriculture Research (IJOEAR) ISSN:[2454-1850] [Vol-7, Issue-6, June- 2021]
Page | 9
FIGURE 1: Supply chain of Milk Source: Primary data
Figure 1 show that out of the total quantity of milk produced, 1.10 percent of milk is consumed by the dairy farmer itself and
98.90 percent of total milk produced is sold to various marketing channels such as dairy cooperative society and local market
includes consumers/households, hotels/shops and middlemen. Out of the total milk sold, 72.10 percent of milk is sold to
dairy cooperative society and remaining 27.90 percent is sold to local market. From the dairy cooperative society some
quantity of milk is directly sold to households. Milma has given such provision to each dairy cooperative society for earning
additional revenue in order to meet the daily expense of cooperative society. Milma collects remaining milk and processed in
corresponding regional dairy plant and distribute milk in different qualities. When milk is sold to local market, (i) directly
purchase by consumers/households (ii) sell to middlemen who sell a portion of milk to consumers/households or to shops
again purchased by consumers and (iii) sell to hotels/shops, restaurant and hotels purchase a portion and remaining portion is
sold to shops, then milk is purchased by consumers from the shops. From the figure it is clear that out of total quantity of
milk sol to local market, 63.04 percent is sold directly to consumers/households, 26.09 percent is sold to middlemen and
10.87 percent is sold to hotels/shops.
Most of the farms follow traditional and informal marketing of milk. In Milma, price of milk is determined on the basis of
FAT and Solid No Fat (SNF) content in the milk. Here in this paper, we explain the role of various marketing channels of
dairy products and analyse the reason for choosing them. Milk marketing channels in Kerala takes the following form (Table
3). All these kinds of marketing channels are found functioning during the period of study. It is found that marketing channel
of producer to consumer is more profitable and beneficial to producers than any other marketing channels even if farmers can
sell more quantities of milk to consumers/households directly. Higher price received for milk is the main reason for it. No
intermediary is involved in this process. Therefore, entire margin is received by the producer itself.

International Journal of Environmental & Agriculture Research (IJOEAR) ISSN:[2454-1850] [Vol-7, Issue-6, June- 2021]
Page | 10
TABLE 3
MILK MARKETING CHANNELS
S No Marketing channel Number of intermediaries
1 Producer- Consumer 0
2 Producer-dairy coop. society-consumer 1
3 Producer-dairy coop. society-retailer-consumers 2
4 Producer-middlemen-consumer 1
5 Producer-middlemen-retailer-consumer 2
6 Producer-middlemen-processor-retailer-consumer 3
7 Producer-retailer-consumers 1
8 Producers-middlemen-retailer-consumers 2
Source: Primary data
6.2.1 Quantity of milk produced, consumed and sold per month
Milk production is the output of various factors and inputs, and a number of stages involved such as management of herd,
milking, collection, transportation, processing and distribution. Out of the total milk produced by the farmers a certain
amount is consumed by themselves. Remaining part of milk is sold to dairy cooperative society and local market including
consumers, middlemen and hotels/shops.
Table 4 shows average quantity of milk produced by dairy farmers in Ernakulam district. In terms of quantity, on an average
3168 litres of milk is produced per month. From the table it is clear that as the farm size increases quantity of milk produced
increases. It indicates that with farm size increases number of milch animals is high which leads to increased milk
production.
TABLE 4
QUANTITY OF MILK PRODUCED, CONSUMED AND SOLD (IN LITRES) AND SHARE OF MILK CONSUMED AND
SOLD TO TOTAL MILK PRODUCED (IN %) PER MONTH
Farm size Quantity of milk (litre) Share of milk (%)
Produced Consumed Sold Consumed Sold
Very Small 1220 27 1193 2.21 97.79
Small 2433 33 2400 1.36 98.64
Medium 3596 40 3556 1.11 98.89
Large 5337 55 5282 1.03 98.97
Very Large 11612 54 11558 0.47 99.53
Total 3168 35 3133 1.10 98.90
Source: Primary data
Farmer consumes a part of the total milk produced. Quantity of milk consumed by each household depends upon the size of
family, age of the household members, taste and preferences etc. Table 4 present data on average quantity of milk consumed
per month. On an average 35 litres of milk are consumed per month. That means on an average 1 litre of milk is consumed
per day. Due to availability and high quality of milk household of farmers consume milk. From the table it is found that on an
average 1.10 percent of total quantity of milk produced is consumed per month. Remaining part is sold to different marketing
channel. On an average 3133 litres of milk are sold per month which indicates that 98.90 percent of total quantity of milk
produced is sold per month.
6.2.2 Quantity of milk sold to cooperative society and local market per month
Out of total milk available for sale, major part of milk is sold to dairy cooperative society and local market includes
households/consumers, middlemen and hotels/shops. It indicates that farmers try to sell their milk in various channels in the
hope of getting a certain amount of margin. Selling milk to dairy cooperative society alone is not viable to them. Therefore,
they have to find other channels and market. Quantity and share of milk sold to cooperative society and local market per
month are presented in the Table 5.
International Journal of Environmental & Agriculture Research (IJOEAR) ISSN:[2454-1850] [Vol-7, Issue-6, June- 2021]
Page | 11
TABLE 5
QUANTITY OF MILK SOLD (IN LITRES) AND SHARE OF MILK SOLD TO COOPERATIVE SOCIETY AND LOCAL
MARKET (IN %) PER MONTH
Farm size Quantity of milk sold (litre) Share of milk sold (%)
Cooperative Society Local market Cooperative Society Local market
Very Small 996 197 83.49 16.51
Small 1867 533 77.79 22.21
Medium 2583 973 72.64 27.36
Large 3570 1712 67.59 32.41
Very Large 7286 4272 63.04 36.96
Total 2259 874 72.10 27.90
Source: Primary data
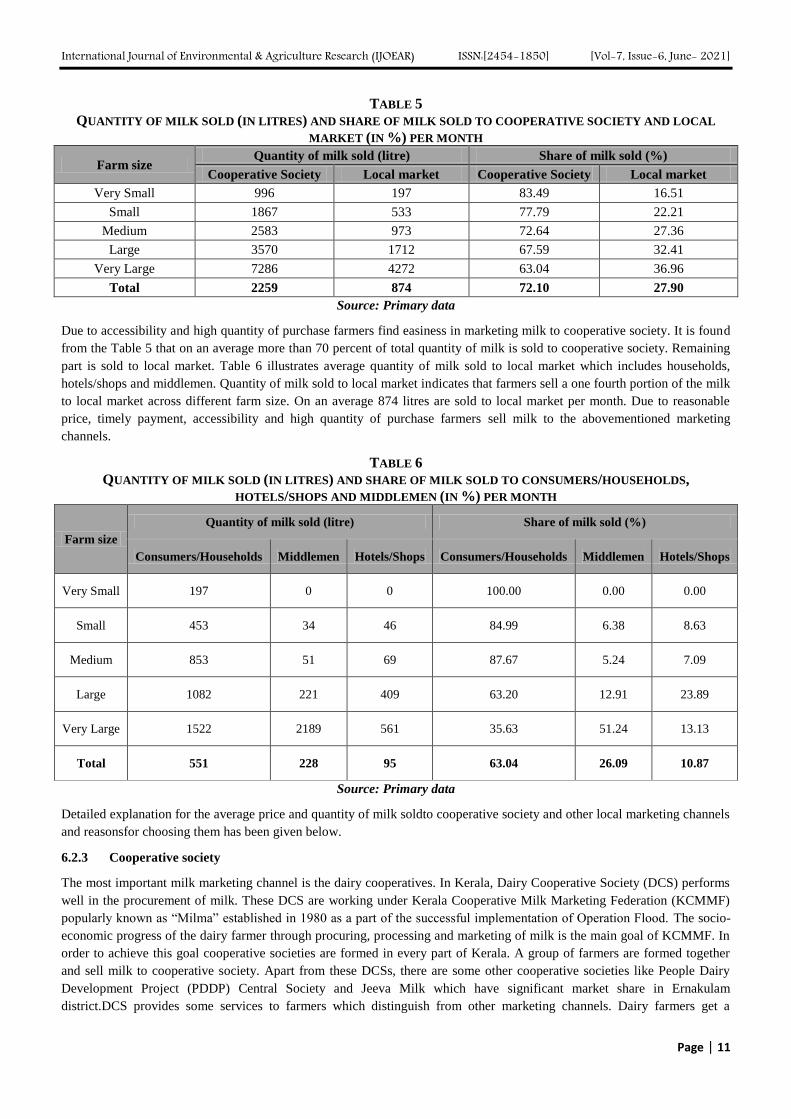
Due to accessibility and high quantity of purchase farmers find easiness in marketing milk to cooperative society. It is found
from the Table 5 that on an average more than 70 percent of total quantity of milk is sold to cooperative society. Remaining
part is sold to local market. Table 6 illustrates average quantity of milk sold to local market which includes households,
hotels/shops and middlemen. Quantity of milk sold to local market indicates that farmers sell a one fourth portion of the milk
to local market across different farm size. On an average 874 litres are sold to local market per month. Due to reasonable
price, timely payment, accessibility and high quantity of purchase farmers sell milk to the abovementioned marketing
channels.
TABLE 6
QUANTITY OF MILK SOLD (IN LITRES) AND SHARE OF MILK SOLD TO CONSUMERS/HOUSEHOLDS,
HOTELS/SHOPS AND MIDDLEMEN (IN %) PER MONTH
Farm size
Quantity of milk sold (litre) Share of milk sold (%)
Consumers/Households Middlemen Hotels/Shops Consumers/Households Middlemen Hotels/Shops
Very Small 197 0 0 100.00 0.00 0.00
Small 453 34 46 84.99 6.38 8.63
Medium 853 51 69 87.67 5.24 7.09
Large 1082 221 409 63.20 12.91 23.89
Very Large 1522 2189 561 35.63 51.24 13.13
Total 551 228 95 63.04 26.09 10.87
Source: Primary data
Detailed explanation for the average price and quantity of milk soldto cooperative society and other local marketing channels
and reasonsfor choosing them has been given below.
6.2.3 Cooperative society
The most important milk marketing channel is the dairy cooperatives. In Kerala, Dairy Cooperative Society (DCS) performs
well in the procurement of milk. These DCS are working under Kerala Cooperative Milk Marketing Federation (KCMMF)
popularly known as “Milma” established in 1980 as a part of the successful implementation of Operation Flood. The socio-
economic progress of the dairy farmer through procuring, processing and marketing of milk is the main goal of KCMMF. In
order to achieve this goal cooperative societies are formed in every part of Kerala. A group of farmers are formed together
and sell milk to cooperative society. Apart from these DCSs, there are some other cooperative societies like People Dairy
Development Project (PDDP) Central Society and Jeeva Milk which have significant market share in Ernakulam
district.DCS provides some services to farmers which distinguish from other marketing channels. Dairy farmers get a

International Journal of Environmental & Agriculture Research (IJOEAR) ISSN:[2454-1850] [Vol-7, Issue-6, June- 2021]
Page | 12
somewhat fair price for the milk they sell and provide an assured marketing space for the milk and thereby financial security
is maintained. Thus, dairy sector is organized in this way. Major difference between DCS and other cooperative society is
that farmers get higher price for milk by other dairy cooperative society rather than DCS.
TABLE 7
NUMBER OF DAIRY FARMS SELL MILK TO AGENTS/MARKETING CHANNELS
Farm size
Cooperative society Consumers/
Households Middlemen Hotels/Shops
No of
farmers Percentage
No of
farmers Percentage
No of
farmers Percentage
No of
farmers Percentage
Very Small 94 29.4 72 25.6 0 0.0 0 0.0
Small 142 44.4 134 47.7 3 16.7 14 46.7
Medium 44 13.8 40 14.2 2 11.1 6 20.0
Large 11 3.4 11 3.9 2 11.1 3 10.0
Very Large 29 9.1 24 8.5 11 61.1 7 23.3
Total 320 100.0 281 87.81 18 5.6 30 9.4
Source: Primary data
Table 7 illustrates the number of farmers pour milk to Dairy Cooperative Society and other society, consumers/households,
middlemen and hotels/shops. From the table it is obvious that all the farmers pour milk to dairy cooperative societies across
different farm size. Majority of farms belongs to small farms; as a result, 44.4 percent of small farmers sell milk to dairy
cooperative society.
6.2.4 Average price and quantity of milk sold to dairy cooperative society
Average price per litre and quantity of milk pour to cooperative society per month are presented in Table 8. Price is fixed by
dairy cooperative society on the basis of fat and SNF content of milk. On an average of 2259 litres of milk pour to
cooperative society per month at Rs. 37 in Ernakulam district. Table shows that very small farmers get higher price (Rs.40)
than other farms. Lowest price is received by small, medium and very large farms with Rs. 36 each.
TABLE 8
AVERAGE PRICE (RS.) AND QUANTITY OF MILK (IN LITRE) SOLD TO AGENTS/MARKETING CHANNELS
Farm size Cooperative society
Consumers/
Households Middlemen Hotels/Shops
Price Qty Price Qty Price Qty Price Qty
Very Small 40 996 51 197 0 0 0 0
Small 36 1867 47 453 47 34 45 46
Medium 36 2583 48 853 48 51 45 69
Large 38 3570 50 1082 44 221 48 409
Very Large 36 7286 48 1522 46 2189 46 561
Total 37 2259 49 551 46 228 44 95
Source: Primary data
It is found that selling milk to consumers/households is more profitable and beneficial to farmers than any other marketing
channels even if farmers can sell more quantities of milk to consumers/households directly. Farmers get higher price for the
milk from the consumers/households than any other marketing channels. But in reality, farmers sell higher quantity of milk
to dairy cooperative society where they get a lower price which is not feasible and viable. When considering return from
milk, dairy cooperative society contributes more. On an average, price difference of Rs. 12 has been found between the price
of milk sold to dairy cooperative society and consumers/households.
6.2.5 Reason for choosing dairy cooperative society
From the Table 9, it is clear that main reason for choosing dairy cooperative is timely/regular payment (100%), high quantity
of purchase (98.44%), accessibility (97.81%), no network facility for direct marketing/no household demand (92.19%) and
conventional practice (80.00%). Very few farmers choose dairy society due to reasonable and higher price (26.88%) they get.

International Journal of Environmental & Agriculture Research (IJOEAR) ISSN:[2454-1850] [Vol-7, Issue-6, June- 2021]
Page | 13
From the table it is clear that some kind of malpractices is there in cooperative society in measuring Fat and SNF content.
Some farmers sell milk to cooperative society due to known persons. They personally know dairy society secretaries.
TABLE 9
REASON FOR CHOOSING VARIOUS AGENTS/MARKETING CHANNELS
Reasons Cooperative society
Consumers/
Households Middlemen Hotels/Shops
No of farmers % No of farmers % No of farmers % No of farmers %
Advance payment 0 0.00 22 7.83 0 0.00 0 0.00
Timely/
regular payment 320 100.00 249 88.61 17 94.44 28 93.33
Known Persons 6 1.88 273 97.15 18 100.00 30 100.00
No malpractice 5 1.56 273 97.15 7 38.89 30 100.00
Reasonable/
Higher price 86 26.88 278 98.93 18 100.00 30 100.00
Accessibility 313 97.81 263 93.59 18 100.00 29 96.67
High quantity of
purchase 315 98.44 7 2.49 18 100.00 3 10.00
Network facilities 0 0.00 2 0.71 2 11.11 0 0.00
Conventional
practice 256 80.00 110 39.15 0 0.00 7 23.33
No network
facility for direct
marketing/No
household
demand
295 92.19 1 0.36 5 27.78 7 23.33
Other reasons if
any 0 0.00 0 0.00 0 0.00 0 0.00
Source: Primary data
6.2.6 Consumers/Households
Consumer plays an important role in marketing process and they act as central element in the commodity market. Household
is also used in the same meaning of consumer. Recently there has been a new trend in urban Kerala in which consumers
prefers fresh farm milk even though price of milk is high. For them higher price is the indicator of quality milk. Farmers find
difficult in selling whole milk to dairy cooperative society since they provide less price for the milk when compared to other
marketing channels. Price variation is very high from location to location. It is not viable for the farmers if they sell entire
quantity of milk to society alone. Therefore, farmers try to find other market channels which provide reasonable price and
easy accessibility. These marketing channels are commonly known as local market. Consumers/household is one among
local market channels. Table 7 reveals that out of 320 farmers, 87.81 percent sell milk directly to consumers/households.
Remaining 39 farmers (12.19%) do not sell to consumers/households.
6.2.7 Average price and quantity of milk sold to consumers/households
Average price per litre and quantity of milk sold to consumers/households per month is illustrated in Table 8. It can be seen
that on an average 551 litres of milk are sold per month at Rs. 49. It helps the farmers to increase their revenue from selling
milk to consumers. Table shows that very small farmers get higher price (Rs.51) than other farms. Lowest price is received
by small farmers with Rs. 47. Both very small and large farmers receive higher price than the district average. Along with
price, average quantity of milk sold is very much important for a farmer in getting more revenue. When look at the data it is
shown that average quantity of milk sold to consumers fluctuates over different farm size.
6.2.8 Reason for choosing consumers/households
From the Table 9, it is clear that due to reasonable price /higher price (98.93%), known persons (97.15%), no malpractice
(97.15%), accessibility (93.59%), timely/regular payment (88.61%) and conventional practice (39.15%) farmers have chosen
consumers/households. It also can be seen from the table that very few farmers chose consumers/households due to advance
payment (7.83%), high quantity of purchase (2.49%), network facilities (0.71%) and no network for direct marketing

International Journal of Environmental & Agriculture Research (IJOEAR) ISSN:[2454-1850] [Vol-7, Issue-6, June- 2021]
Page | 14
(0.36%). When sell milk to consumers farmers get fair prices but higher quantity of purchase by consumers is not possible.
Farmers do not have much network for expanding their sale. Majority of farmers have the opinion that no malpractices is
from consumers in selling milk directly to consumers.
6.2.9 Middlemen
Yet another important marketing channel adopted by dairy farmer in Ernakulam district is middlemen. They act as a
distributor of products and try to reduce the gap between producer and consumer. They are like traditional middlemen who
pick up the bulk amount of milk from the farmers and directly sell to consumers, hotels or restaurants and take a margin on
the milk while selling. Present study found out that very few sells milk to these intermediaries even though they provide
reasonable or higher price. It is due to the asymmetric information possessed by farmers regarding price. Table 7 reveals that
out of 320 farmers, only 5.6 percent sell milk directly to middlemen. It indicates that majority do not depend on middlemen
in selling milk due to various reasons.
6.2.10 Average price and quantity of milk sold to middlemen
Average price per litre and quantity of milk sold to middlemen per month is illustrated in Table 8. It can be seen that on
average milk sold to middlemen at Rs.46. On an average 228 litres of milk are sold to middlemen per month. It is found from
the table that only small and medium farmers receive higher price with Rs 47 and Rs. 48 respectively which is higher than
that of district average. Very small farmers do not sell milk to middlemen. When considering average quantity of milk sold to
middlemen, it is seen that very large farmers sell larger quantity of milk (2189 litres) to middlemen. When compared to the
price of milk sold to middlemen with other marketing channels, on an average, difference of Rs. 9 has been found between
DCS and other cooperative society and middlemen where price of milk sold to middlemen is higher. Price difference of Rs. 3
and Rs. 2 is found between middlemen and consumers/households and between middlemen hotels/shops respectively where
price of milk sold to consumers/households are higher and price of milk sold to hotels/shops are lower than that of the price
of milk sold to middlemen.
6.2.11 Reason for choosing middlemen
Reasons for choosing middlemen as marketing channel is presented in the Table 9. Percentage of farmers who sell to
middlemen due to various reasons is calculated by using the number of farmers who sell to the same and excluded the
number of farmers who do not sell to middlemen. From the table it is clear that due to known persons (100%), reasonable
price /higher price (100%), accessibility (100%), high quantity of purchase (100%), timely/regular payment (94.44%), no
malpractice (38.89%) no network facility for direct marketing/no household demand (27.78%) and no network facilities
(11.11%) farmers have chosen middlemen. Main advantage of selling to middlemen is the high quantity of purchase When
compared to other local marketing channels. Data indicates that some kind of malpractices in the form of price reduction is
there. Middlemen sometimes try to mislead the farmers by giving wrong information about price. Due to this asymmetric
information on the producer‟s side they have to accept that price.
6.2.12 Hotels/shops
Fourth important channel in milk market is institutional buyers like hotels/shops. Some farmers sell a part of their surplus
milk to hotels/shops to get a margin. Table 7 reveals that out of 320 farmers, only 9.4 percent sell milk directly to
hotels/shops. It indicates that majority do not sell milk to hotels/shops. Out of 30 farmers who sell milk to hotels/shops, 46.7
percent are small farmers followed by very large farmers with 23.3 percent, medium farmers with 20 percent and large
farmers with 10 percent. Very small farmers do not sell milk to hotels/shops since cooperative society and
consumers/households are the only marketing channels to them.
6.2.13 Average price and quantity of milk sold to hotels/shops
Average price per litre and quantity of milk sold to hotels/shops per month is illustrated in Table 8. It can be seen that on
average milk sold to hotels/shops at Rs.44. Farmers have opined that they do get fair price when they sell milk to
hotels/shops. On an average 95 litres of milk is sold per month. Both large and very large farmers sell higher quantity of milk
to hotels/shops and get a higher price than that of district average with Rs.46 and Rs.48 respectively. When compared to the
price of milk sold to hotels/shops with other marketing channels, on an average, difference of Rs. 7 has been found between
DCS and hotels/shops where price of milk sold to hotels/shops is higher. Price difference of Rs. 5 and Rs. 2 is found between
hotels/shops and consumers/households and between hotels/shops and middlemen respectively where price of milk sold to
consumers/households and middlemen are higher than that of the price of milk sold to hotels/shops.

International Journal of Environmental & Agriculture Research (IJOEAR) ISSN:[2454-1850] [Vol-7, Issue-6, June- 2021]
Page | 15
6.2.14 Reason for choosing hotels/shops
Reasons for choosing hotels/shops as marketing channel have presented in the Table 9. Percentage of farmers who sell to
hotels/shops due to various reasons is calculated by using the number of farmers who sell to the same and excluded the
number of farmers who sell milk to others channels. From the table it is clear that due to known persons (100%), reasonable
price /higher price (100%), no malpractice (100%), accessibility (96.67%) and timely/regular payment (93.33%) and
conventional practice and no household demand (23.33%) farmers have chosen hotels/shops. It also can be seen from the
table that very few farmers chose hotels/shops due to high quantity of purchase (10%) and no malpractice (3.33%). Even
though farmers get fair price when sell milk to hotels/shops they are unable to sell higher quantity to them due to various
reasons like unavailability of information, no network facilities etc. Data indicates that no kind of malpractices is there.
Farmers do not have much network for expanding their sale. Therefore, it is found that due to the higher price received for
milk from consumers/households, selling milk to consumers/households is more profitable and beneficial to farmers than any
other marketing channels if and only if farmers can sell more quantities of milk to consumers/households directly. But in
reality, due to timely/regular payment, high quantity of purchase, accessibility, and no network facility for direct
marketing/no household demand, out of total milk sold, 72.10 percent of milk sold to dairy cooperative society where they
get a lower price which is not feasible and viable and remaining portion is sold to other local market. Therefore, as one of the
main objectives of rural development is to ensure economic well being of people by providing adequate income and
employment, it is necessary to ensure reasonable price for the milk produced by farmers without affecting their willingness to
produce.
VII. CONCLUSION
It is evident that Kerala has the great potential in dairy sector since there is huge market for the product due to growing
demand. Due to the involvement of many factors like lack of infrastructure facilities, transportation, interference of
intermediaries, less bargaining capacity and lack of knowledge about the marketing conditions Kerala‟s milk marketing is
facing a huge challenges and constraints. As a result, many of the farmers could not find market for their products which
creates pricing issues and thereby lowering profit. Proper marketing strategies are essential for the better and successful
running of dairy farm. In this context the present study has analysed the marketing strategy adopted, various milk marketing
channels, quantity of milk sell to these channels and the reasons for choosing in Ernakulam district are studied in detail.
Present study reveals that procurement prices are lower in the cooperative societies. Therefore, it is found that due to the
higher price received, selling milk to consumers/households is more profitable and beneficial to farmers than any other
marketing channels if and only if farmers can sell more quantities of milk to consumers/households directly. When
considering return from milk, dairy cooperative society contributes more since average quantity of milk sold to dairy
cooperative society is higher than that of any other marketing channels. It implies the existence of various reasons such as
timely/regular payment, high quantity of purchase, accessibility, and no network facility for direct marketing/no household
demand. Therefore, out of total milk sold, 72.10 percent of milk is sold to dairy cooperative society which indicates that
farmers are not able to extend their market and they have to entirely depend on cooperative society which is found non
feasible and non-viable. On an average, price difference of Rs. 12 has been found between the price of milk sold to dairy
cooperative society and consumers/households. Apart from that, due to the lack of extended marketing facility/unawareness
about the extended marketing opportunities, and lack of transportation facility only 27.90 percent of total milk sold is
available for local sale which indicates the dominance of traditional marketing channel like cooperative society. In order to
reach a break-even point, some quantities of milk have to be sold to other local marketing channels other than cooperative
society. Otherwise, farmers will incur huge loss which in turn adversely affects the willingness of the farmers in producing
milk and it will reflect in the decline of milk production in Ernakulam district. Therefore, as the main objective of rural
development is to ensure economic well being of people by providing adequate income and employment, it is necessary to
ensure reasonable price for the milk produced by farmers without affecting their willingness to produce. In this context, in
order to meet the increased demand for milk on the consumer‟s side, government and concerned department have to take
appropriate actions to boost the milk market in Ernakulam district by focusing on both production side and marketing side
with equal importance.
REFERENCES
[1] Anjani Kumar, Ashok K Mishra, Shinoj Parappuarathu, Girish Kumar Jha (2018). Framer‟s Choice of Milk marketing Channels in
India. Economic and Political Weekly: Vol.53, Issue No. 51, 29 Dec, 2018.

International Journal of Environmental & Agriculture Research (IJOEAR) ISSN:[2454-1850] [Vol-7, Issue-6, June- 2021]
Page | 16
[2] Ghosh, Nilabja, Amarnath Tripathi, M Rajeshwor and Roopal Singh (2017). Do producers gain from selling milk? An economic
assessment of dairy farming in Contemporary India”, Economic & Political Weekly. Vol 52. No. 25-26, pp 88-96
[3] M, Dinesh & Singh, O (2017). Economics of Dairy Farming in India. Economic and Political Weekly. 52. 77-79.
[4] Rajendran K, Samarendu Mohanty (2004). Dairy Co-operatives and Milk Marketing in India: Constraints and Opportunities. Journal
of Food Distribution Research 35(2)
[5] Saravanadurai A, Muthuraj S (2018). A study on marketing of milk through dairy cooperatives in Akkarapalayam Panchayat. Indian
Journal of Applied Research: Volume 8, Issue 11, November 2018
[6] Vijay Paul Sharma (2015). Determinants of Small Milk Producers‟ Participation in Organized Dairy Value Chains: Evidence from
India. Agricultural Economics Research Review: volume 28(No.2) July-December 2015 pp 247-261
[7] Dairy Industry in Kerala: Price, Consumption Analysis and District wise Milk Production Report 2021-2026 (imarcgroup.com).
Available from https://www.imarcgroup.com/dairy-industry-kerala. Data accessed on 04/11/2020
[8] https://www.thehindu.com/news/national/kerala/kerala-tops-ndri-study-on-dairy-production/article31076118.ece. Data accessed on
15/03/2020
[9] https://www.newindianexpress.com/cities/kochi/2020/feb/18/milk-shortage-hits-district-2104728.html. Data accessed on 18/02/2020
[10] https://en.wikipedia.org/wiki/Marketing_channel. Data accessed on 12/05/2021.