MILITARY EXPENDITURES AND INCOME INEQUALITY EVIDENCE … · MILITARY EXPENDITURES AND INCOME...
16
1 MILITARY EXPENDITURES AND INCOME INEQUALITY EVIDENCE FROM A PANEL OF EUROPEAN COUNTRIES (Work in progress, Very preliminary draft, September 2017) Raul Caruso * Institute of Economic Policy, Catholic University of the Sacred Heart Antonella Biscione Catholic University “Our Lady of Good Counsel” Abstract: This paper contributes to the literature on military spending by analysing the relationship between military spending and income inequality in a panel of transition economies over the period 1990-2015. In fact, there is a strong conceptual argument that would explain how an increase of military spending is linked to a growth of income inequality. Due to military spending public financial resources are diverted from other items of public spending which are supposed to reduce inequality. Empirically, the effect of military spending on income inequality is examined by using a panel regression with European countries level observations over the period 1990–2015 by considering also a wide range of control variables. Preliminary estimates highlight a positive relationship between military spending and income inequality. Keywords: military expenditures, inequality income, human capital, political regime Jel Codes: J24, I24, H56 * corresponding author, email: [email protected]; Catholic University of the Sacred heart; Institute of Economic Policy and Center for Applied Economics (CSEA) and CESPIC, Catholic University ‘Our Lady of Good Counsel’. This paper is very preliminary. Please do not cite without permission. The authors thank Marco Sanfilippo for his valuable comments on this work in progress.
Transcript of MILITARY EXPENDITURES AND INCOME INEQUALITY EVIDENCE … · MILITARY EXPENDITURES AND INCOME...
1
MILITARY EXPENDITURES AND INCOME INEQUALITY
EVIDENCE FROM A PANEL OF EUROPEAN COUNTRIES
(Work in progress, Very preliminary draft, September 2017)
Raul Caruso*
Institute of Economic Policy, Catholic University of the Sacred Heart
Antonella Biscione
Catholic University “Our Lady of Good Counsel”
Abstract: This paper contributes to the literature on military spending by
analysing the relationship between military spending and income inequality
in a panel of transition economies over the period 1990-2015. In fact, there is
a strong conceptual argument that would explain how an increase of military
spending is linked to a growth of income inequality. Due to military spending
public financial resources are diverted from other items of public spending
which are supposed to reduce inequality. Empirically, the effect of military
spending on income inequality is examined by using a panel regression with
European countries level observations over the period 1990–2015 by
considering also a wide range of control variables. Preliminary estimates
highlight a positive relationship between military spending and income
inequality.
Keywords: military expenditures, inequality income, human capital,
political regime
Jel Codes: J24, I24, H56
* corresponding author, email: [email protected]; Catholic University of the
Sacred heart; Institute of Economic Policy and Center for Applied Economics
(CSEA) and CESPIC, Catholic University ‘Our Lady of Good Counsel’. This paper
is very preliminary. Please do not cite without permission. The authors thank
Marco Sanfilippo for his valuable comments on this work in progress.

2
INTRODUCTION
This paper is focused on the relationship between military spending and
income inequality in a panel of eastern and transition countries over the
period 1990-2015. This topic is rather unexplored in literature. In fact, a
substantial number of previous studies analyse in depth the determinants of
defence spending. Yet, another substantial literature focuses on the impact
of military spending on economic growth and development highlighting in
most cases a negative relationship [see the survey presented in Dunne and
Tian (2013) and among others Kollias et al. (2017); Kollias C., Paleologou S.
(2015); Kollias et al. (2007)]. A minor literature focuses on other
macroeconomic variables as public debt [see among others Caruso and Di
Domizio, 2016; Paleologou (2013), Smyth and Narayan, (2009), Dunne et al.
(2004)].
In other words, the impact of military expenditure on the other macro
economic variables have also been analysed in the literature, but the
relationship between defence spending and income inequality have been
subject only of a very limited number of studies. In the past, the works with
reference to the military expenditure, tried to explore this issue in relation
to the economic growth, income, education, inflation and other sectors. In
sum, this study contributes heavily to the existing literature. In fact, it
analyses the link between military expenditure and income inequality in a
panel of twenty-six transition European countries. Since all countries
considered are transition post-communist economies, we are likely to
narrow the results to this class of countries.
In sum, the aims of this paper are: (i) analysing the relation between
military expenditure and income inequality and (ii) quantifying the impact
of defence spending on income inequality.
The paper is organized as follows: Section 2 of the paper presents the
literature review and conceptual background; section 3 introduces the
methodology and the data used, while section 4 presents and discusses the

3
empirical results. Finally, section 5 summarizes and concludes.
I. LITERATURE AND CONCEPTUAL BACKGROUND
The role of defence spending as a factor of income inequality has found
scarce attention from the theoretical and empirical point of view. Despite
the few studies carried out to understand the causality between military
spending and income inequality, it is possible to identify three main
hypotheses (Lin and Ali 2009, Elveren 2012, Rufael 2016) that try to explain
this association: (i) the inequality-narrowing, (ii) the inequality-widening
and (iii) the neutrality hypothesis.
According to the inequality-narrowing hypothesis, higher military
expenditure can generate higher aggregate demand and therefore an
increase of employment level in the whole economy. In fact, if the military
industries are labour intensive and if the defence production is indigenous,
the economic growth produces benefits for the poor population so leading to
an improvement of income distribution (Hirnissa et al 2009; Lin and Ali
2009; Elveren 2012). Empirical findings that corroborates this hypothesis
come from Ali (2012), in his study carried out on Middle East and North
African (MENA) countries, he unveiled that military expenditure has an
important and negative effect on income inequality, in other words, in these
countries an increase of military expense leads to a reduction of income
inequality.
The inequality-widening hypothesis is based upon the idea that the
military industries prefer more productive workers who have higher salaries
than the less-skilled workers in the civil sectors. In such a way the military
expenditure can increase the intersectoral wage gaps (Ali, 2007). Moreover,
the disparity between skilled and unskilled labour can be exacerbated if the
military industry decides to produce by employing skilled labour rather
than unskilled workers. In addition, the military sector can lead to an
increase of income inequality if the interest groups related to the military
4
complex lobby for higher spending when they perceive that the government
wants to reallocate the defence spending in favour of other sectors.
Therefore, the additional resources in favour of the military complex reduce
those provided for the welfare state that could be used to redistribute the
income through transfer payment programs (Elveren, 2012). The empirical
findings that confirm this hypothesis come from Abell (1994), Ali (2007,
2012) Tongur and Elveren (2012), Kentor et al. (2012) Meng et al. (2013),
Lucyshyn et al. (2013) Rufael (2016).
Finally, the neutrality hypothesis argued that the effect of military
expenditure on income inequality is not significant for two main reasons: (i)
the defence spending represents only a small portion of total government
expenditure and (ii) the labour force employed in the military industrial
sector is only a negligible part of the overall labour force. Therefore, if the
government chooses to address the resources to the welfare instead of the
defence sector, the effect of military expenditure on income inequality would
be negligible. Empirically the effect would be statistically insignificant. In
their analysis, Hirnissa et al (2009) unveiled no significant relation between
military expenditure on income distribution for Indonesia Philippines, India
and South Korea, also Lin and Ali (2009) found no substantial findings to
confirm any causal relationship between the defence expenditure and
income inequality in both directions.
The hypothesis previously described underline three different
predictions with relation to the effects of military expenditure on income
inequality. However, it could be argued that the impact of military spending
on income inequality is likely to differ across countries because they are
characterised by different stages of economic development. The aim of this
paper is to analyse the relation of military spending and income inequality
in a large group of European countries to evaluate whether defence
expenditure lead to an improvement or worsening of income inequality. The
countries included in the sample are transition economies.

5
II. DATA AND METHODOLOGY
The table 1 show the variables considered to estimate the effect of military
spending on income inequality by using a panel regression with transition
countries level observations over the period 1990–2015 (see appendix 1 for
the list of countries).
Table 1- Descriptive statistics
Names Description
Number of
observations min max mean
Std.
Dev
Milex Log military expenditure 648 0 6.242 4.365 2.133
Labour productivity Log GDP per person employee 650 -3.108 11.226 10.040 0.844
Human Capital
Log human capital index based on
year of schooling and return of
education 475 0.896 1.312 1.114 0.083
Inflation Log inflation rate 650 0 6.232 4.886 1.130
Democracy Log polity index 650 0 3.045 2.606 0.516
Openness Log ratio of total trade on GDP 650 2.460 5.294 4.410 0.452
Unemployment Log unemployment rate 650 0.693 6.413 5.247 1.286
Inequality Log Gini index 646 -1.703 -0.549 -1.026 0.232
Ethnic fractionalization Ethnic fractionalization index 616 0.047 68.460 0.820 5.587
urban population Log ratio of urban population on total 676 3.273 4.334 4.027 0.234
UE Dummy for countries EU 676 0 1 0.173 0.379
Presidential
Dummy for countries with presidential
political system 676 0 1 0.425 0.495
Parliamentary
Dummy for countries with
parliamentary political system 676 0.000 1.000 0.345 0.476
AEP
Dummy for countries with Assembly
Elected President political system 676 0 1 0.090 0.287
Time trend Time variable 676 1 26 13.5 7.506
The data on income inequality used in this paper is taken from the Global
Income Dataset (GID)1. The dataset presents estimates of monthly real
consumption and income of various quintiles of the population for the
majority of countries in the world between 1960 and 2015. Data on military
1 See http://gcip.info/about

6
spending are drawn from the Stockholm International Peace Research
Institute (SIPRI 2015). The human capital index is taken from Penn World
Tables (PWT 8.1) and it is based on the average years of schooling from
Barro and Lee (2013) and also on a rate of return to education, based on
Mincer equation estimates around the world (Psacharopoulos, 1994). In
order to remove the inconsistencies in classification systems between
sources or censuses, the data on the average years of schooling in the
population is to combine information from population censuses with
information on school enrolment.
The openness index is the ratio between the total trade of a country
(the sum of the amount of the exports and the imports) and its GDP. The
index of ethnic fractionalization is extracted from the QOG Standard TS
Dataset 2017 carried out by the Quality of Government Institute (QoG) of
Gotheborg. The index of fractionalization, based on the Herfindahl index of
market power, allows to quantify the degree of ethnic diversity in a
jurisdiction and it measures the probability that two randomly selected
individuals from a country/region belong to two different groups. The level
of democracy is captured by means of the Polity IV database, carried out by
the Center for Systemic Peace, which rates each country on a democracy-
autocracy scale.
The data about the real GDP per person employee (as a proxy for
labour productivity), the inflation rate, the unemployment rate, the ratio of
the manufacturing to the GDP, the percentage of urban population to the
total are drawn from the World Development Indicator, World Bank.
Furthermore, we use four dummy variables, the UE indicates the dummy
variable for countries belonging to European Union and three dummies
represent the political system, these last extracted from the Database of
Political Institution 2015 produced by Inter-America Development Bank
(IDB).
III. THE EMPIRICAL MODEL

7
In order to observe the relationship between the military expenditure and
income inequality, in this study we use the fixed effects model, it is able to
correct for the problem of the heterogeneity bias. This model eliminates the
possibility of time invariant unobserved effects. The fixed effects, in fact,
allow to explore the relation between military spending and income
inequality within each country. In the fixed effects model, the individual-
specific effect is a random variable that is allowed to be correlated with the
explanatory variables. Mainly variables considered, are logged (to minimize
the skewness) so to present an elasticity: a change in the explanatory
variable by one per cent leads to a change of income inequality equal to the
coefficients per cent. Furthermore, the regression has been estimated using
one-year lag. The empirical model will be estimated using the fixed effect
method, that is specified as follows:
𝑙𝑛𝑖𝑛𝑒𝑞𝑢𝑎𝑙𝑖𝑡𝑦𝑖𝑡
= 𝛽0 + 𝛽1𝑙𝑛𝑚𝑖𝑙𝑒𝑥𝑖𝑡−1 + 𝛽2𝑙𝑛𝑢𝑛𝑒𝑚𝑝𝑙𝑜𝑦𝑚𝑒𝑛𝑡𝑖𝑡−1
+ 𝛽3𝑙𝑛𝑙𝑎𝑏𝑜𝑢𝑟𝑝𝑟𝑜𝑑𝑢𝑐𝑡𝑖𝑣𝑖𝑡𝑦𝑖𝑡−1 + 𝛽4𝑙𝑛𝑖𝑛𝑓𝑙𝑎𝑡𝑖𝑜𝑛𝑖𝑡−1
+ 𝛽5𝑙𝑛ℎ𝑢𝑚𝑎𝑛𝑐𝑎𝑝𝑖𝑡𝑎𝑙𝑖𝑡−1 + 𝛽6𝑙𝑛𝑑𝑒𝑚𝑜𝑐𝑟𝑎𝑐𝑦𝑖𝑡−1 + 𝛽7𝑙𝑛𝑜𝑝𝑒𝑛𝑛𝑒𝑠𝑠𝑖𝑡−1
+ 𝛽8𝑙𝑛ℎ𝑢𝑟𝑏𝑎𝑛𝑝𝑜𝑝𝑢𝑙𝑎𝑡𝑖𝑜𝑛𝑖𝑡−1 + 𝛽9𝑒𝑡ℎ𝑛𝑖𝑐𝑓𝑟𝑎𝑐𝑡𝑖𝑜𝑛𝑎𝑙𝑖𝑧𝑎𝑡𝑖𝑜𝑛𝑖𝑡
+ 𝛽10𝑝𝑟𝑒𝑠𝑖𝑛𝑑𝑒𝑛𝑡𝑖𝑎𝑙𝑖𝑡 + 𝛽11𝑝𝑎𝑟𝑙𝑖𝑎𝑚𝑒𝑛𝑡𝑎𝑟𝑦𝑖𝑡 + 𝛽12𝐴𝐸𝑃𝑖𝑡 + 𝛽13𝑢𝑒𝑖𝑡
+ 𝛽14𝑡𝑖𝑚𝑒𝑡𝑟𝑒𝑛𝑑𝑖𝑡 + 𝜇𝑖 + 𝜆𝑡 + 𝜐𝑖𝑡
The dependent variable lninequalityit is the income inequality,
lnmilexit-1 is the one-year lagged military expenditure. 𝜇𝑖is the country fixed
effect, 𝜆𝑡 is the year fixed effect and 𝜐𝑖𝑡represents the error term. i
represents the country of interest and t is the sample period which is from
1990 to 2015. Furthermore, we consider a number of control variables in
order to analyse to what extent other factors, apart from defence spending,
could be influence the income inequality.

8
(…)
IV. RESULTS
This section presents the results of regression estimate in assessing the
impact of military spending on income inequality in European countries, in
fact, the finding for the panel analysis are contained in the following table.
Table 2 – Military spending and income inequality - Main results
(1) (2)
(3)
(4)
(5)
(6) (7)
lnMilexit-1 0.0250*** 0.0159*** 0.0158*** 0.0110*** 0.0101*** 0.00971** 0.0102**
[-0.00326] [-0.00379] [-0.00379] [-0.00387] [-0.00389] [-0.00403] [-0.00478]
lnLabour Productivityit-1
-0.121*** -0.119*** -0.112*** -0.103*** -0.0942*** -0.0991***
[-0.0249] [-0.0251] [-0.025] [-0.0254] [-0.0258] [-0.0302]
lnHuman Capital it-1
0.599** 0.625** 0.623** 0.584** 0.595** 0.189
[-0.25] [-0.253] [-0.248] [-0.249] [-0.251] [-0.29]
lnInflation it-1
0.0205*** 0.0185*** 0.0174*** 0.0205***
[-0.00565] [-0.00581] [-0.00583] [-0.00608]
lnDemocracyit-1
-0.0144 -0.0217 -0.0253 -0.0362 -4.23E-05
[-0.0206] [-0.0202] [-0.0205] [-0.0227] [-0.00369]
lnOpenness it-1
0.0588*** 0.0589*** 0.0639*** 0.0725***
[-0.022] [-0.022] [-0.0224] [-0.0263]
lnUnemployment it-1
0.00993* 0.00642 0.0117*
[-0.00547] [-0.00617] [-0.00687]
lnUrban Population it-1
-0.203
[-0.164]
Ethnic fractionalization
2.086*
[-1.141]
Presidential
0.0352
[-0.0485]
Parliamentary
0.0920*
[-0.0495]
AEP
0.0457
[-0.0489]
UE
-0.0067 -0.00976 -0.0123
[-0.0199] [-0.0201] [-0.0212]
9
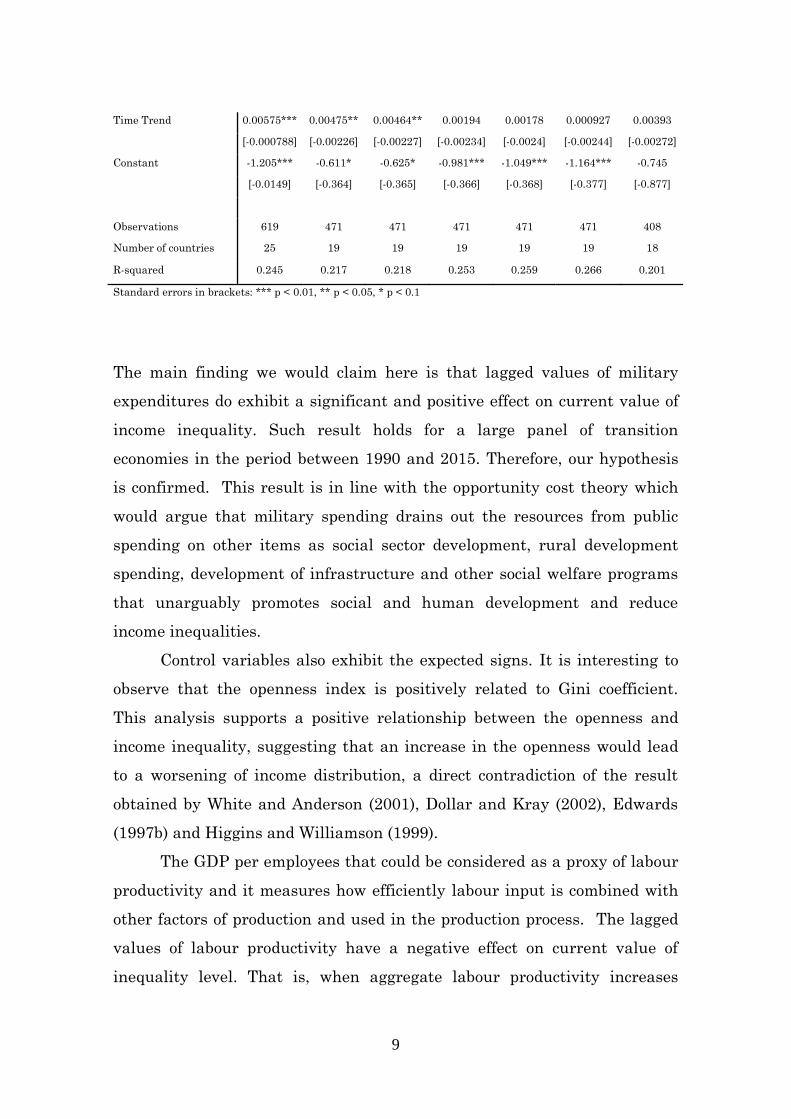
Time Trend 0.00575*** 0.00475** 0.00464** 0.00194 0.00178 0.000927 0.00393
[-0.000788] [-0.00226] [-0.00227] [-0.00234] [-0.0024] [-0.00244] [-0.00272]
Constant -1.205*** -0.611* -0.625* -0.981*** -1.049*** -1.164*** -0.745
[-0.0149] [-0.364] [-0.365] [-0.366] [-0.368] [-0.377] [-0.877]
Observations 619 471 471 471 471 471 408
Number of countries 25 19 19 19 19 19 18
R-squared 0.245 0.217 0.218 0.253 0.259 0.266 0.201
Standard errors in brackets: *** p < 0.01, ** p < 0.05, * p < 0.1
The main finding we would claim here is that lagged values of military
expenditures do exhibit a significant and positive effect on current value of
income inequality. Such result holds for a large panel of transition
economies in the period between 1990 and 2015. Therefore, our hypothesis
is confirmed. This result is in line with the opportunity cost theory which
would argue that military spending drains out the resources from public
spending on other items as social sector development, rural development
spending, development of infrastructure and other social welfare programs
that unarguably promotes social and human development and reduce
income inequalities.
Control variables also exhibit the expected signs. It is interesting to
observe that the openness index is positively related to Gini coefficient.
This analysis supports a positive relationship between the openness and
income inequality, suggesting that an increase in the openness would lead
to a worsening of income distribution, a direct contradiction of the result
obtained by White and Anderson (2001), Dollar and Kray (2002), Edwards
(1997b) and Higgins and Williamson (1999).
The GDP per employees that could be considered as a proxy of labour
productivity and it measures how efficiently labour input is combined with
other factors of production and used in the production process. The lagged
values of labour productivity have a negative effect on current value of
inequality level. That is, when aggregate labour productivity increases

10
income inequality appears to decrease. The effect of a change of labour
productivity on income inequality results always statistically significant at
1% confidence level.
The human capital, measured by a mincerian combination of years of
schooling (from Barro and Lee, 2013) and returns to education, has a
statistically significant effect on income inequality, in fact, an improvement
of human capital leads to an increase of Gini coefficient. The
interdependence between income and human capital represents the basis of
theory of the distribution of income. In fact, only richer families are able to
invest more in human capital, and thereby earn more in the future causing
difference in average income. The persistence of inequalities in incomes and
human capital also depends on imperfections in the capital market, if
everyone has access to the same investment opportunities, then incomes
and levels of human capital will converge. Anyway, the human capital loses
significance if we consider in our regression the percentage of urban
population and the ethnic fractionalization index.
Yet, interesting to note the result about inflation. We found a positive
and significant coefficient for lagged inflation in all regressions. That is,
inflation of previous year has positive impact on current inequality. In other
words, an increase of inflation rate generates a loss of purchasing power of
the national currency, particularly, the general increase of the price level
impoverishes specially the population that is in the last part on the left of
income distribution, thus increasing inequality. However, the results
obtained are inconsistent with those present in the studies carried out by
Maussner (2004), Sun (2011), Maestri and Roventini (2012), and Coibion et
al., (2012), in fact, they found that inflation decreases the income inequality.
The ethnic fractionalization presents a positive impact on income
inequality, this result corroborates what stated by Dincer and Hotard
(2011), in fact, they found a positive relationship between ethnic and
religious polarization and income inequality.
The coefficient of unemployment rate is positive and statistically
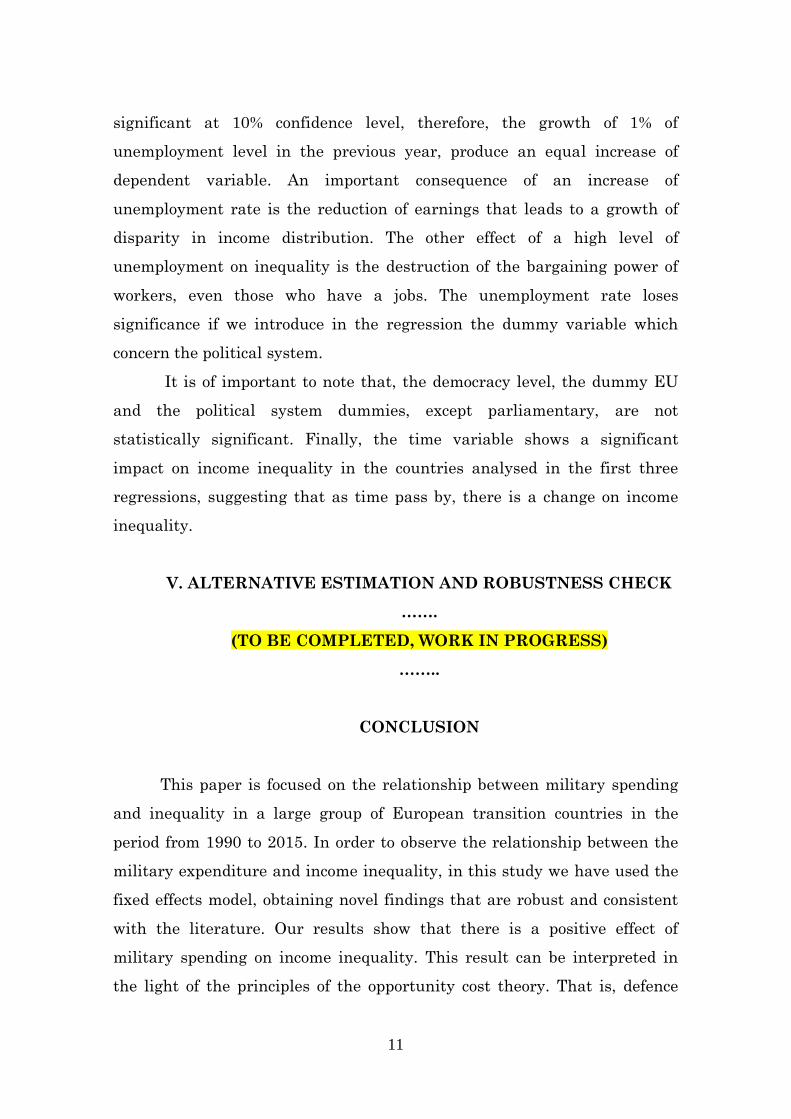
11
significant at 10% confidence level, therefore, the growth of 1% of
unemployment level in the previous year, produce an equal increase of
dependent variable. An important consequence of an increase of
unemployment rate is the reduction of earnings that leads to a growth of
disparity in income distribution. The other effect of a high level of
unemployment on inequality is the destruction of the bargaining power of
workers, even those who have a jobs. The unemployment rate loses
significance if we introduce in the regression the dummy variable which
concern the political system.
It is of important to note that, the democracy level, the dummy EU
and the political system dummies, except parliamentary, are not
statistically significant. Finally, the time variable shows a significant
impact on income inequality in the countries analysed in the first three
regressions, suggesting that as time pass by, there is a change on income
inequality.
V. ALTERNATIVE ESTIMATION AND ROBUSTNESS CHECK
…….
(TO BE COMPLETED, WORK IN PROGRESS)
……..
CONCLUSION
This paper is focused on the relationship between military spending
and inequality in a large group of European transition countries in the
period from 1990 to 2015. In order to observe the relationship between the
military expenditure and income inequality, in this study we have used the
fixed effects model, obtaining novel findings that are robust and consistent
with the literature. Our results show that there is a positive effect of
military spending on income inequality. This result can be interpreted in
the light of the principles of the opportunity cost theory. That is, defence
12
spending reduces the amount of resources which could be used for other
channels of public spending and in particular for the social and welfare
system which are expected to reduce income inequality. Therefore, as
military spending increases the commitment of government to reduce
inequality decreases. Among other possible explanations this appears to be
meaningful.
This work contributes to a rather unexplored aspect of military
spending. Yet it throws new light on the channels that generate a
detrimental effect of military spending on economic growth. In fact, the
analysis has been run only for transition economies. Whether such results
have to be considered valid also for both developed and low income countries
is a challenge of future research on this topic.
References
Abell, J. D., (1994). Military Spending and Income Inequality. Journal of
Peace Research, 35–43.
Ali, H. E., (2007) Military Expenditures and Inequality: Empirical Evidence
From Global Data. Defence and Peace Economics 18(6): 519-535.
Barro, R.J., Lee, J.W., (2013). A New Data Set of Educational Attainment
in the World, 1950-2010. Journal of Development
Economics,104(C):184-198.
Caruso R., Di Domizio M., (2016), Military Spending and Budget Deficits:
The Impact of US Military Spending on Public Debt in Europe (1988-
2013), Defence and Peace Economics, (ahead of print)
http://dx.doi.org/10.1080/10242694.2016.1228259
Caruso R., Di Domizio M., (2016), Interdependence Between US and
European Military Spending: A Panel Cointegration Analysis (1988-
2013), Applied Economics Letters, 23(4): 302-305.

13
Coibion, O., Gorodnichenko, Y., Kueng, L., Silvia J. (2012). Innocent
Bystanders? Monetary Policy and Inequality in the U.S. IMF. Working
Paper No. WP/12/199
Deininger, K., Squire, L. (1996). A New Data Set Measuring Income
Inequality. World Bank Economic Review 10 565–591.
Dincer, O.C., Hotard, M.J. (2011). Ethnic and Religious Diversity and
Income Inequality. Eastern Economic Journal 37(3): 417-430.
Dunne J.P., Tian N., (2013), Military Expenditure and Economic Growth:
A Survey. The Economics of Peace and Security Journal, 8, 1.
Dunne J.P, Perlo-Freeman S., Soydan A., (2004), Military Expenditure
and Debt in Small Industrialized Countries: A Panel Analysis, Defence
and Peace Economics, 15(2): 125-132.
Edwards, S. (1997b). Trade Policy, Growth and Income Distribution, The
American Economic Review, 87(2): 205-210.
Elveren, A. Y. (2012). Military Spending and Income Inequality: Evidence
on Cointegration and Causality for Turkey, 1963-2007. Defence and
Peace Economics, 23 (3): 289-301.
Hewitt, D. (1992). Military Expenditures Worldwide: Determinants and
Trends, 1972- 1988, Journal of Public Policy 12(1): 105-152.
Higgins, M., Williamson J.G., (1999). Explaining Inequality: the World
Round: Cohort Size, Kuznets Curves, and Openness, NBER Working
Paper NR.7224.
Hirnissa, M.T., Muzafar S. H., and Baharom A.H., (2009). Defense
Spending and Income Inequality: Evidence from Selected Asia
Countries. Modern Applied Science , NR.5.
Kentor, J., Jorgenson, A. and Kick, E. (2012). The “new” military and
income inequality: A cross national analysis, Social Science Research
41 514-526.
Kollias C. (2010), Growth, investment and military expenditure in the
European Union-15, Journal of Economic Studies, 37(2): 228-240.

14
Kollias C., Mylonidis N., Paleologou S., (2007), A Panel Data Analysis
Of The Nexus Between Defence Spending And Growth In The
European Union, Defence and Peace Economics, Taylor & Francis
Journals, 18(1): 75-85.
Kollias C., Paleologou S., Tzeremes P., Tzeremes N., (2017), Defence
expenditure and economic growth in Latin American countries:
evidence from linear and nonlinear causality tests, Latin American
Economic Review, 26(1): 1-25
Kollias C., Paleologou S. (2015), Defence And Non-Defence Spending In
The Usa: Stimuli To Economic Growth? Comparative Findings From A
Semiparametric Approach, Bulletin of Economic Research, 67(4): 359-
370,
Lin, E. S. and Ali, H. E. (2009). Military Spending and Inequality: Panel
Granger Causality Test. Journal of Peace Research 46(5): 671-685.
Maestri, V., Roventini, A. (2012.) Inequality and Macroeconomic Factors:
a Time-Series Analysis for a Set of OECD Countries, Laboratory of
Economic and Management Working Paper NR.21.
Maussner, A., (2004). Endogenous Growth and with Nominal Frictions.
Journal of Economics, 83(1): 1.46.
Meng, B., Lucyshyn, W. and Li, X. (2015). Defense Expenditure and
Income Inequality: Evidence on Co-Integration and Causality for
China. Defence and Peace Economics 26 (3): 327–39.
Paleologlou S.M., (2013), A Dynamic Panel Data Model for Analyzing the
Relationship Between Military Expenditure and Government Debt in the
EU, Defence and Peace Economics, 25(5): 419-428.
Perotti R., (2014), Defense Government Spending is Contractionary,
Civilian Government Spending is Expansionary, NBER Working Paper
Series, n.20179, pp. 1-46.
Psacharopoulos, G. (1994). Return Investment in Education: A Global
Update. World Development 22(9):1325-1343.

15
Reuveny, R. and Li, Q. (2003). Economic Openness, Democracy, and
Income Inequality: An Empirical Analysis. Comparative Political
Studies 36(5): 575-601.
Rufael, Y.W. (2016). Defence Spending and Income Inequality in Taiwan.
Defence and Peace Economics, 27 (6): 871-884.
Sandler, T. and Hartley, K. (1995). The Economics of Defense. New York:
Cambridge University Press.
Seiglie, C. (1997). Deficits, defence, and income distribution. CATO
Journal 17(1): 11-18.
Smith R., Nayaran P.K. (2009), A Panel Data Analysis of the Military
Expenditure-External Debt Nexus: Evidence from Six Middle Eastern
Countries, Journal of Peace Research, 46 (2): 235-250.
Smith D. and Smith D. (1980). Military Expenditure, Resources and
Development. University of London, Birkbeck College. Discussion
Paper, Nr. 87.
Sun, H. (2001). Search, Distribution, Monetary and Fiscal Policy.
Manuscript.
Tongur, U., Elveren, A.J. (2015). Military Expenditures, Inequality, and
Welfare and Political Regimes: A Dynamic Panel Data Analysis,
Defence and peace Economics, 26(1): 49-74.
Tongur, U., Elveren A.J. (2017). The Nexus of Economic Growth, Military
Expenditure and Inequality Income. Quality & Quantity, 51(4): 1821-
1842.
White, H., Anderson, E. (2001). Growth versus Distribution: Does the
Pattern of Growth Matter. Development Policy Review, 19 (3): 267-289.

16
Appendix 1- List of countries included in the analysis
Albania Croatia Latvia Romania Ukraine
Armenia Czech Republic Lithuania Russia Uzbekistan
Azerbaijan Estonia Macedonia Serbia
Belarus Georgia Moldova Slovakia
Bosnia and
Herzegovina Hungary Montenegro Slovenia
Bulgaria Kazakhstan Poland Tajikistan