
„Military Conscription and Economic Performance in OECD ... · conscription in OECD countries,...
55
DIPLOMARBEIT Titel der Diplomarbeit „Military Conscription and Economic Performance in OECD Countries” Verfasser Chen Hsien Lin angestrebter akademischer Grad Magister der Sozial- und Wirtschaftswissenschaften (Mag.rer.soc.oec.) Wien, 2012 Studienkennzahl It. Studienblatt: A 140 Studienrichtung lt. Studienblatt: Diplomstudium Volkwirtschaft Betreuer Neil Foster, BA MSc PhD
Transcript of „Military Conscription and Economic Performance in OECD ... · conscription in OECD countries,...

DIPLOMARBEIT
Titel der Diplomarbeit
„Military Conscription and Economic Performance in OECD Countries”
Verfasser
Chen Hsien Lin
angestrebter akademischer Grad
Magister der Sozial- und Wirtschaftswissenschaften (Mag.rer.soc.oec.)
Wien, 2012
Studienkennzahl It. Studienblatt: A 140 Studienrichtung lt. Studienblatt: Diplomstudium Volkwirtschaft Betreuer Neil Foster, BA MSc PhD

1
Acknowledgements
I am deeply grateful to my supervisor Dr Neil Foster for his patience and guidance.
Econometrics started to become more fun in the Praktikum class we had. I would also have to
thank Professor Wolfgang Weigel for the conception of this thesis and Professor Andreas
Wagener for his valuable input.
I would also like to thank Charlotte Laycock from the International Institute for Strategic
Studies for helping me with the membership, which was vital to obtain the data I use.
Last but not least, I would like to thank my friend Gizem Yildirim and Andreas Richter, from
whom I received helpful advice and mental support, and of course my parents, who have
supported me through this wonderful journey of studying in Vienna.

2
Contents
1. Introduction p.5
1.1 Introduction on Military Conscription p.5
1.2 Further Background p.6
2. Literature Review p.13
2.1 Theoretical Studies p.13
2.2 Empirical Studies p.16
2.2.1 Static Costs of Military Conscription p.16
2.2.2 Dynamic Costs of Military Conscription p.18
2.2.3 Other Economic Costs p.19
3. Model and Data p.20
3.1 The Augmented Solow Model p.20
3.2 Data p.21
4. Results p.26
4.1 Income Levels p.26
4.2 Growth Rates p.36
4.3 Sensitivity Test p.44
5. Conclusion p.46
References p.49
Appendix
A. Abstract (in English and German) p.52
B. CV p.54

3
L ist of Tables Table 1- Descriptive Statistics (Mean Values of Variables of Interest) p.24 Table 2- Correlation and Significance p.25 Regression Results: Table 3- Income Levels under Specification I p.28 Table 4- Income Levels under Specification II p.30 Table 5- Income Levels under Specification III p.32 Table 6- Income Levels under Specification IV p.34 Table 8- Growth under Specification I p.37 Table 9- Growth under Specification II p.39 Table 10- Growth under Specification III p.40 Table 11- Growth under Specification IV p.42 Summary of Regression Results: Table 7- Summary of Income Regression Results p.35 Table 12- Summary of Growth Regression Results p.43

4
L ist of F igures Figure 1- Military Recruitment around the World p.7 Figure 2- Military Recruitment in Europe p.8 Figure 3- Unweighted Ratio of Conscripts to Total Armed Force Personnel p.8 Figure 4- Defense Expenditure in ‘Old’ NATO Members p.9 Figure 5- Military and Civilian Personnel in the Armed Forces of ‘Old’ NATO
Members p.10
5
1. Introduction
1.1 Introduction on Military Conscr iption
Most economists favor an all-volunteer armed force to a conscripted one, based on the
economic theory of comparative advantages. Many empirical studies in this field focus on the
static efficiencies in terms of lifetime earnings associated with military conscription. For
aggregate effects, Keller et al. (2009) show empirically that conscription has negative effects
on both income levels and economic growth in OECD countries. The trend of abolishment of
conscription in OECD countries, which started in the 1990s after the end of the Cold War,
provides an opportunity to examine the debate between a conscripted and an all-volunteer
armed force. According to theory, the conscription system ignores the comparative advantage
of people who have to do the compulsory service, and may therefore distort the accumulation
of their human and physical capital, which then depresses output and growth (Lau et al,
2004).
This thesis is largely inspired by the empirical work of Keller et al. (2009). I extend their
sample to 2010, and include three additional relevant variables. First, is the conflict dummy
variable, hoping to control for additional military determinants. Second, is the ratio of
conscripts to the total armed force personnel, which is intended to capture some of the effects
of the abolishment of conscription, and to examine whether the reduction in conscripts in the
composition of the total armed force personnel has positive effects on economic performance
as theory predicts. Third, is the ratio of armed force personnel to the labor force, included to
examine the relationship between the size of the armed force personnel and economic
performance. Furthermore, instead of running cross-country and panel regressions with
averages from decades as in Keller et al., I run my panel regressions by year to obtain
hopefully better estimates.
The estimates obtained in the thesis are not always in line with what the theory predicts.
For example, the share of conscripts in the armed personnel is only estimated to have negative
effects on GDP per unit of the labor force when inflation and fixed effects are not accounted
for (A 10% increase in this share variable decreases GDP per labor force by 0.098%, holding
all else constant.) As for its effect on economic growth, measured by the GDP per capita
growth rate, it also only has negative and significant effects when not controlling for inflation
and fixed effects. Without further specifications, a 10% increase in the share of conscripts to

6
the armed force reduces GDP per capita growth rate by 0.0595%, ceteris paribus. When
country and year fixed effects are added, the coefficient estimates of this variable on income
and growth become positive and significant.
When fixed effects are added, all conscription variables have a surprisingly mostly
positive effect on both income levels and growth rates, which cannot be explained solely by
the mainstream theory. The results imply that the negative effect of conscription on economic
performance is not robust to fixed effects.
The rest of the thesis is organized as follows: the next section reports further background
information on military conscription, followed by the literature review on conscription in
section two, which tends to be divided into three types of costs: static, dynamic, and other
economic costs. The section after describes the model and data used for estimation, which is
an augmented Solow growth model, following the tradition of Keller et al (2009). The fourth
section presents the results, which are surprisingly somewhat different than the findings of
Keller et al (2009). I also provide interpretations of these results. Sensitivity tests are also
reported in this section. The fifth section concludes.
1.2 Further Background What is military conscr iption?
Military conscription, or the military draft has been the main source of armed force
personnel recruitment for most countries throughout history. Almost all countries in the world
have military manpower (except Iceland). Instead of military conscription, a government can
also rely on an all-volunteer force, or a combination of both compulsory and voluntary
recruitment systems.
Throughout time, conscripted soldiers have been the dominant source of military
manpower. Both World Wars were fought with conscripts. For the government, the
conscription system is cheaper to finance than an all-volunteer force. The choice between the
two systems is likely to depend on the government’s ability to tax, either by levying an in-
kind tax on conscripts, or monetary tax to hire and keep professional soldiers.
Both the volume and duration of conscription are sizable. Almost all young male citizens
who are deemed to be able-bodied are subject to conscription (Israel being a special case of
recruiting also female conscripts), and the length of compulsory military service was by and
large over 1.5 years in the past. Given the compulsory nature of conscription, its volume and
duration, it is of interest for economists to find out whether and to what extent conscription
has an influence on economic performance.

7
Some recent development in the military sector : While the tradition of keeping a conscripted armed force remains in most parts of the
world (countries marked in red in Figure 1 below), and for most OECD countries until the
mid 1990s, there have been significant developments in the functioning of the military in the
recent past. The progress in developing modern weaponry, information technology such as the
advent of the internet, the fall of communism, and military adventurism, etc., all make the
military sector less labor-intensive and require more professional skills. This trend towards
more specialized armed force personnel can be seen in OECD countries. The United Kingdom
abolished conscription in 1960, followed by Luxembourg in 1967, and the United States in
1973. In 1985, just eight out of 22 OECD countries that had a population over one million
still used conscription. After the end of the Cold War, most western European countries
started to abolish or phase out conscription, as Figure 2 shows. In Figure 3, one can see the
trend towards abolishment of conscription in a sample of 21 OECD countries1. Each dot in
Figure 3 represents the (unweighted) average percentage of conscripts in total armed
personnel in these 21 OECD countries. Since 1990, and the end of the Cold War, there is a
constant decrease in the ratio of conscripts to total armed personnel.
Figure 1: Military Recruitment Around The World, 2011
Source: Wagener and Poutvaara, Ending Military Conscription, 2011

8
Figure 2: Military Recruitment in Europe
Source: Wagener and Poutvaara, EndinngMilitary Conscription, 2011
Figure 3: Unweighted Ratio of Conscripts to Total Armed Force Personnel
1 These are Australia, Austria, Belgium, Canada, Denmark, Finland, France, Greece, Ireland, Italy, Japan,
the Netherlands, New Zealand, Norway, Portugal, Spain, Sweden, Switzerland, Turkey, the United Kingdom and
the United States of America. Source: own calculations

9
From Poutaara and Wagener’s (2011) research finding, one can see in Figure 4 below that
aside for different starting levels, military expenditures from 1985 to 2009 do not vary much
for conscription countries (Denmark, Germany, Greece, Norway, and Turkey) and countries
that abolished conscription (Belgium, France, Italy, the Netherlands, Portugal, and Spain) in
early 1990s. There seems to be no clear correlation between use of conscription and military
expenditure. However, countries that still use conscription seem to afford larger military
budgets. Figure 5 shows quite unsurprisingly, that conscription countries have the highest
percentage of armed personnel in the labor force. The reduction in armed personnel in the
total labor force is to be seen for all country groups from 2000, and the reduction is largest for
the conscription country group. This might indicate the problem of unfair selection in
conscription system, and/or that more young people who are subject to conscription were
willing and able to serve in alternative service. Surprisingly, the abolishment of conscription
does not seem to reduce military budgets nor army size in relative terms.
Figure 4: Defense Expenditure of ‘Old’ Nato Members
Source: Wagener and Poutvaara, Ending Military Conscription, 2011

10
Figure 5- Military and Civilian Personnel In The Armed Forces of ‘Old’ Nato Members
Source: Wagener and Poutvaara, Ending Military Conscription, 2011
Conscription and alternative service:
The quality difference between conscripted soldiers and professional soldiers is expected
to be significant. Conscripted soldiers have shorter periods of training, less on-the-field
experience, and high turnover rates. Moreover, conscripts are paid less than same-rank
professionals, and do not enjoy the same perks for veterans and (retired) professionals, who
might enjoy a higher interest rate in saving, better health insurance, discounts on grocery, etc.
Since most conscripts do not seek a professional soldier career after their forced service time,
it should be assumed that their military productivity is lower due to lack of skills, experience,
incentives and motivation. There is unfortunately very little data on whether conscripts were
actually sent to fields of real wars, except in the case of Australia and the United States of
America during the first years of the Vietnam War
As a corollary to conscription, most democratic countries offer alternative service to
conscientious objectors. Unfortunately, there is not enough data on the volume and duration
of alternative service for a cross-country empirical analysis. One should bear in mind that
alternative service has economic costs too, such as setting up screening-commission panels,
and other bureaucratic burdens. The length of alternative service is usually longer than that
for military service. From the little data available, Denmark is the only country that has the

11
same length of service, 4 months, for both alternative and compulsory military service.
Austria has a longer length of alternative service, which is systematically 50% longer than
normal military service. (8 months for Zivildienst, or alternative service as in 2011), Greece is
also punitive in alternative service length, 15 months as in 2011 which is about two-thrids
longer than normal military service time. Most punitive is Finland, which has a 100% longer
spell in alternative service (12 months) than in military service (6 months). People in
alternative service usually work in civilian and social sectors, and some argue that it provides
valuable social benefits at lower budgetary costs.
Conscription and Efficiency Loss: The main arguments against conscription are focused on the mismatch in comparative
advantages. Adam Smith (1976 [1776]: 701) provides a clear intuition against conscription
and found an ‘irresistible superiority which a well-regulated standing army has over a militia’.
In other words he preferred a professional armed force to conscription. A conscription system
ignores the differences in comparative advantages and productivity, and assigns all conscripts
to similar tasks for the same output. This mismatch is inefficient and adds further opportunity
costs, and should lead to output loss compared to an all-volunteer armed force. From
conscripts’ point of view, the opportunity cost of serving in the army is likely to be larger than
their willingness-to-pay to avoid the draft. The missed opportunity can be, for example,
postponed/disturbed continuation of education, training, on the job experience and earnings.
Switzerland is the only country in the world that actually accepts monetary payments in order
not to serve in conscription (the exemption fee is 3% of annual income tax until the age of
30).
Few economists are in favor of conscription, but their arguments are also centered around
comparative advantage. Lee and McKenzie (1992) and Warner and Ash (1995) argue that
conscription can be socially more costly than professional army if the latter’s budgetary costs
are financed through high and distortionary taxes. Most other economists, such as Hansen and
Weisbrod (1967), Oi (1967), Fisher (1969), Poutvaara and Wagener (2005), do see potential
in efficiency loss in conscription due to the mismatch in comparative advantages and
productivity. The efficiency loss ranges from static dead-weight loss to long-term distortions
in output. The same logic of efficiency loss also applies to alternative service given its
compulsory nature.
In terms of the effects of conscription on real output, Hansen and Weisbrod (1967)
provide estimates of monetary cost of conscripted soldiers to the United States. Some other

12
static costs estimates for other countries are reported in the literature review, in the section
2.2.1. For the dynamic, long term effects, Lau et al (2004) provide computational equilibrium
simulations, which show that the long-term GDP can be depressed by up to 1%, if the whole
population is subject to conscription (or to any similar form of compulsory service).
The work of Keller, Poutvaara, and Wagener (2009) is the first large-scale empirical work
testing the hypothesis that in the long run, military conscription hampers economic
performance. They examine 21 OECD countries (same country sample as in Figure 3) from
1960-2000 and find negative and significant effects of conscription on both income levels and
growth. So far it is the only work that empirically studies the long-run effects of military
conscription on economic performance at the macroeconomic level.
This thesis extends the work of Keller et al. to 2010, uses panel data by year, and adds few
new variables. The results are surprisingly quite different. Most important finding is probably
that the expected negative effects of conscription seem not to exist, when fixed effects are
being controlled for.

13
2. L iterature Review
2.1 Theoretical Studies
The choice between a professional and a conscripted army was debated in the 18th century
by Adam Smith and Immanuel Kant. Kant states in the third preliminary article of Perpetual
Peace (1795) that “Standing armies (miles perpetuus) shall in time be totally abolished”
because they are themselves “a cause of offensive war.” In other words, Kant argues that a
perpetual standing army (mercenary soldiers) is the source of potential conflicts. Of course
there is a difference between Kant’s ‘standing armies’ and the modern professional, voluntary
soldiers. Kant’s standing armies might have referred to foreign mercenary soldiers during the
medieval periods, or for example, the German Hessians hired by the British to fight the
rebellious American colonists during the War of Independence. Curtis (1982) points out this
important difference in the definition: ‘Mercenary soldiers hired for service in an army not of
their own country are not the same as a modern, volunteer army—that is, one in which
citizens choose to serve in their country’s armed forces.’ James and Choi (2003) provide
empirical results that contradict Kant’s view on military manpower system: for the period
from 1886 to 1992, they show that conscripted soldiers are significantly connected to more
militarized interstate disputes than professional soldiers.
Adam Smith shows his preference for professional soldiers over conscripts in terms of
economic interest. He finds ‘irresistible superiority which a well-regulated standing army
(professional soldiers) has over a militia (conscripts)’ (1776). The main arguments against
conscription from Smith and most other economists are focused on the comparative advantage
and benefits from specialization. People have different skills and are good at different tasks,
this implies that not everyone is a good soldier. The skills, experience and expertise (in
handling complex weaponry, for example) required for a good soldier are harder for
conscripts to achieve given their shorter periods of service, high turnover rates, and perhaps
most importantly, lack of motivation. Therefore, the labor productivity of conscripts should be
lower than professional soldiers. A society that relies on conscription would have to forgo the
productivity gains from a professionalized army in terms of military output (perhaps in the
form of ‘peace-dividend’ from crisis-averting and peace-keeping functions, as argued by
Knight et al. 1996), and bear the opportunity costs from the mismatch of comparative
advantages among conscripts. Poutvaara and Wagener (2007) provide interesting analogy of

14
this mismatch, ‘Forcing everybody to serve in the military is no more sensible than forcing all
citizens to work as nurses, heart surgeons, or teachers.’
Little had been said on this debate since the comments of these two individuals until the
escalation of the Vietnam War in 1966. Over the next five years, together with public debates,
economists produced a substantial volume of research on the feasibility and efficiency of an
all-volunteer armed force. Major contributors include Walter Y. Oi (1967), Hansen and
Weisbrod (1967), Altman and Fechter (1967), Friedman (1967), Fisher (1969), and Altman
and Barro (1971). With Friedman on the board of the Gates Commission, which was
established by Richard Nixon, conscription was abolished in the United States in 1970
following a unanimous recommendation of the board members.
Among academics who are not in favor of conscription Hansen and Weisbrod (1967),
Warner and Ash (2001), Poutvaara and Wagener (2007), and Pfaffenzeller (2009) recognize
and summarize the distributive and allocative effects of conscription on real gross national
product. Given the compulsive nature of conscription, there has to be some sort of selection
procedure (at least for the United States), that creates uncertainty for ‘draftable’ young men
and their employers, and a possible selection bias which can be an issue of fairness. The
apparent cheapness of draftee labor means a below market wage, and would imply more
enlistment than necessary, leading to an excessive personnel-capital ratio in conscript armies.
Furthermore, the opportunity costs for the conscripts exceed the fiscal costs by the maximum
amount draftees are willing to pay to avoid compulsory service. These costs can be measured
by the difference between the conscripts’ below market wage income in the military and the
potential market income if they were not forced to serve. One also needs to note that the
pecuniary disutility includes also the extra risk of death or injury that military service may
entail.
Not all economists are in favor of an all-volunteer force. Lee and McKenzie (1992) and
Warner and Ash (1995) argue that under certain circumstances, an all-volunteer force is not
feasible, for example due to aging and changing demography, or it could be more efficient
than conscription if all-volunteer military forces are financed through high and distortionary
taxes. Ng (2008) offers an alternative view opposed to almost unanimous preference for an all
volunteer force among economists, and argues that the desirability of conscription cannot be
completely excluded if the returns in military service are high (due to both training costs and
learning by doing), and the required amount of military service is high (such as for a country
at war).
With significant technological development in the military sector, and the end of the Cold

15
War, many European countries started to consider ending conscription. The all-volunteer
example set by the United States and the United Kingdom do seem to play a role in the
decision makings of European governments. Warner and Negrusa (2005) examine the
conversion from conscription to a more volunteer force in the European countries with the
extended theory of military manpower procurement system choice (Warner and Ash, 1996).
Warner and Negrusa (2005) add the social costs of individuals’ attempts to evade conscription
and the government’s cost of preventing it in the military manpower procurement model, and
interpret their research results as that the higher these evasion costs are, the more likely that a
government converts to an all volunteer military manpower. Warner and Negrusa (2005) find
the decisions of many European countries to end conscription efficient and equitable. With
the changing roles and missions of European militaries and the post Cold War downsizing,
they argue that volunteer forces have lower real resource costs than conscripted forces.
A further branch of research focuses on why some countries use conscription while some
do not. Mulligan and Shleifer (2004) find that countries with a higher population tend to use
conscription more (holding the relative size of military constant). They also find that countries
with a French legal origin, which they see as those facing lower fixed and variable
administrative costs, are more likely to use conscription than countries with common law
origins. Furthermore, they find that conscription does not seem to be influenced by
democracy, but rather by the deadweight costs of taxation only in countries with very large
militaries. They conclude that the fixed costs of introducing and administering new
regulations may be an important determinant of the use of conscription.
Anderson, Halcoussis and Tollison (1996) argue that the strength and extent of the labor
unions may be a determinant in government’s choice of military procurement. They
hypothesize that unions may expect to benefit from conscription in the same way that they
prefer minimum wages. Both devices are meant to protect the lower skilled, younger members
of the union. They find that in countries where the influence of labor unions is high the more
likely it is to use military conscription.
Poutvaara and Wagener (2007) discuss Pareto efficiency in the abolishment of military
draft as a form of intergenerational redistribution. They argue that introducing military
conscription benefits the older generation while it harms the young and all future generations.
In their view, military conscription distorts human capital formation more severely than an
intergenerational transfer using public debt or pay-as-you-go pensions, therefore it can be
abolished in a Pareto-improving way if age-dependent taxes are available. More specifically,
they argue that the political allure to keep military conscription can be explained with the

16
absence of age-specific taxation.
2.2 Empirical Studies
The empirical work in the filed of military conscription focus largely on efficiency losses.
I find that this research tends to be divided into three types of costs:
1. Static Costs: efficiency loss measured in terms of income (usually life-time earning
or budgetary costs comparisons for a certain country in a certain period)
2. Dynamic: the effects of conscription through the channels of education and human
capital accumulation. The dynamic costs tend to account for the indirect effects of
conscription through human capital accumulation on economic performance, which provides
framework for estimating the effects on military conscription
3. Other economic costs: for example social costs, which are hard to be measured, for
example the evasion costs of conscription (e.g. costs in emigration, pretended schooling,
bribing recruitment officers, faking medical records, etc.)
2.2.1 Static Cost of Military Conscription
Hansen and Weibrod (1967) are the pioneers in modeling the static costs of military
conscription. Their theoretical model of implicit income taxes on eligible draftees is focused
specifically on the allocative and distributive effects of conscription on real output, and on
finding numerical values of such costs for the United States. The annual total distributive cost
equals up to $990 million and the annual allocative cost equals up to $1120 millions. On the
individual level, the difference in annual net forgone income (annual civilian income
opportunities minus annual actual military compensation) equals $1480.
Angrist (1989) compares the lifetime earnings of the Vietnam War veterans and non-
veteran. He uses instrumental variables estimates from the Social Security Administration
records, and finds that in the early 1980s, the earnings of white veterans are approximately
15% less than non-veteran earnings. In an attempt to explain this loss of earnings to veterans,
Angrist estimates the experience-earnings profiles jointly with time-varying veteran status
coefficients. His estimates suggest that the effect of Vietnam era military conscription on
white veterans is equivalent to a loss of two years of civilian labor market experience.

17
Bauer and Schmidt (2009) identify the causal effect of military conscription on conscripts’
subsequent labor market outcomes in Germany during the 1950s with the regression-
discontinuity design. Using the White Cohort (Weißer Jahrgang) as a control group (German
and Austrian men who were born between 1929 and 1937, and exempted from compulsory
military service), they find that people that served in conscription earn comparatively more,
yet the earnings advantage and wage premium of those who serve in the armed forces vanish
when the selection effects are taken into account. The observed earnings differentials could
entirely be attributed to the way the conscripts are selected. They argue that healthier men are
likely to contribute a better labor market outcome than their rejected or exempted counterparts
(selection effect), and therefore ‘it would be reasonable to say that conscripts would have
earned more even without serving in the Bundeswehr.’
Imbens and Klaauw (1995) report the earning differentials between men who were
selected to serve in conscription and those who were not in the Netherlands. They point out
the complicated examination process of the selection in to the military draft, and numerous
(temporary) exemptions that can be manipulated by young men to avoid military service.
They find that approximately after 10 years of serving in the Dutch military (1989/1990),
former conscripts earn on average 5% less than the members of their birth cohort who did not
serve in the military. Furthermore, a comparison of this cost with the returns to one year of
work experience indicates that serving in the military is roughly equivalent to the cost of
losing one year of potential work experience.
Kunze (2002) explores the short and long run effects of career interruptions on (accepted)
wages for young skilled workers in West Germany. Beside military conscription, the analysis
includes three other types of career interruptions: unemployment, parental leave for female
workers, and other non-work spells. For interruptions due to military conscription, Kunze
finds that conscripted men earn 3.2% more in wage income during the first year after service
term, but earn less afterwards than the non-conscripted men, and the gap in wages increases
with time.
In terms of comparison with budgetary costs, Lutz (1996) finds that the annual
monetarized utility loss from conscription equals 9-27% of the German defense expenditure.
Kerstens and Meyermans (1993) estimate the social costs of the selective conscription in
Belgium to be twice as large as its budgetary costs. They point out the complicated

18
examination process of the selection in to the military draft, and numerous (temporary)
exemptions that can be manipulated by young men to avoid the draft.
2.2.2 Dynamic Costs
Lau et al. (2002) argue that conscription distorts output via two channels. The first
channel is human capital accumulation. Young people (usually men) have to disrupt/postpone
education or labor market experience. They argue that the time spent in compulsory military
service depreciates their human capital, i.e., the knowledge and skills they gain from
secondary education would be more or less lost during the service time. Hence the time gap
dedicated to conscription interrupts and distorts the human capital accumulation and thus
might reduce labor productivity. The lifetime earning research, e.g. the work of Kunze (2002)
corroborates this.
The second channel is through capital accumulation. They share the view of conscription
as form of in-kind tax as in Weisbrod et. Al (1967), and further suggest that this front-loaded
in-kind tax is levied more one-sidededly on young people than ‘normal monetary’ taxation on
general population to finance public expenditure.
To estimate the dynamic costs of conscription and other similar types of disruptions in
human capital accumulation (such as alternative civilian service) via these two channels, they
provide a dynamic general equilibrium model and computational simulations of steady-state
output, with respect to the extent of conscription and taxation. Their findings suggest that
conscription decreases output by 0.2% to 1% from its original steady-state.
Wagener and Keller (2009) hypothesize that military draft discourages demand for higher
education. Using data from 1960-2000 for OECD countries, they find empirically that the
scale and extent of conscription, measured in the share of conscripts to the labor force, and the
duration of service time, do have significant negative effects on tertiary education enrollment
rates.
The first large scale empirical work on the effect of conscription on economic
performance is from Keller et al. (2009). Using an augmented Solow growth model and data
from OECD countries from 1960-2000, they find that conscription and alternative service
have negative and significant effects on income levels and economic growth.
2.2.3 Other E conomic Cost

19
While the real social costs of conscription can hardly be measured, some empirical work
does provide a useful insight. Bauer et al. (2011) focus on conscription in Germany, which
was introduced in 1956 and where young men were able to postpone military service if they
enrolled in universities. They argue that young men are drafted typically when they are at the
height of their learning ability, and in order to continue their human capital accumulation in
the hope for higher returns from civilian labor market later and also to avoid the draft, the
demand for tertiary education might increase. Consistent with this, they find that conscription
leads to an increase in the probability of having a university degree in Germany.
Galiani et al. (2006) provide relationships between conscription and crime. They find that
the initiation in criminal activities is typically a ‘young’ phenomenon and argue that
conscription, being one of the major events affecting the young, may have some causal effects
on crime. Using data from Argentina, where selective conscription exists, they find that
participation in military service increases the likelihood of developing a criminal record
(particularly for property and weapon-related crimes) in adulthood.
Vasquez (2005) studies the relationship between conscription and military casualties. He
finds that democracies with conscript armies experience fewer combat casualties than
democracies with volunteer or professional forces, and argues that this is because societal
actors most closely affected by conscript casualties are more likely to have the political power
and access with which to constrain policy makers. Poutvaara and Wagener (2011) see the idea
of conscription being more ‘representative’ of society in the military sector as a myth, because
conscription covers less than half of the population and often excludes women, homosexuals,
fathers and some religious groups. They argue that a conscript armed force is de facto biased
in terms of the selection process, which includes legal and illegal buyout options.
Debates on links between conscription and the representativeness of the population, peace-
keeping, and democracy are still open. Choi and James (2003) study the violent interstate
conflicts from 1886 to 1992 and find that conscript armies are associated with more military
disputes than a military manpower system with professional or voluntary forces. Anderson et
al. (1996) conclude that war-like states are more likely to rely on conscription. Pfaffenzeller
(2009) finds no empirical link between democracy and conscription, and finds conscription
unnecessary in countries without threat.
20
3. Model and Data
3.1 The Augmented Solow Model
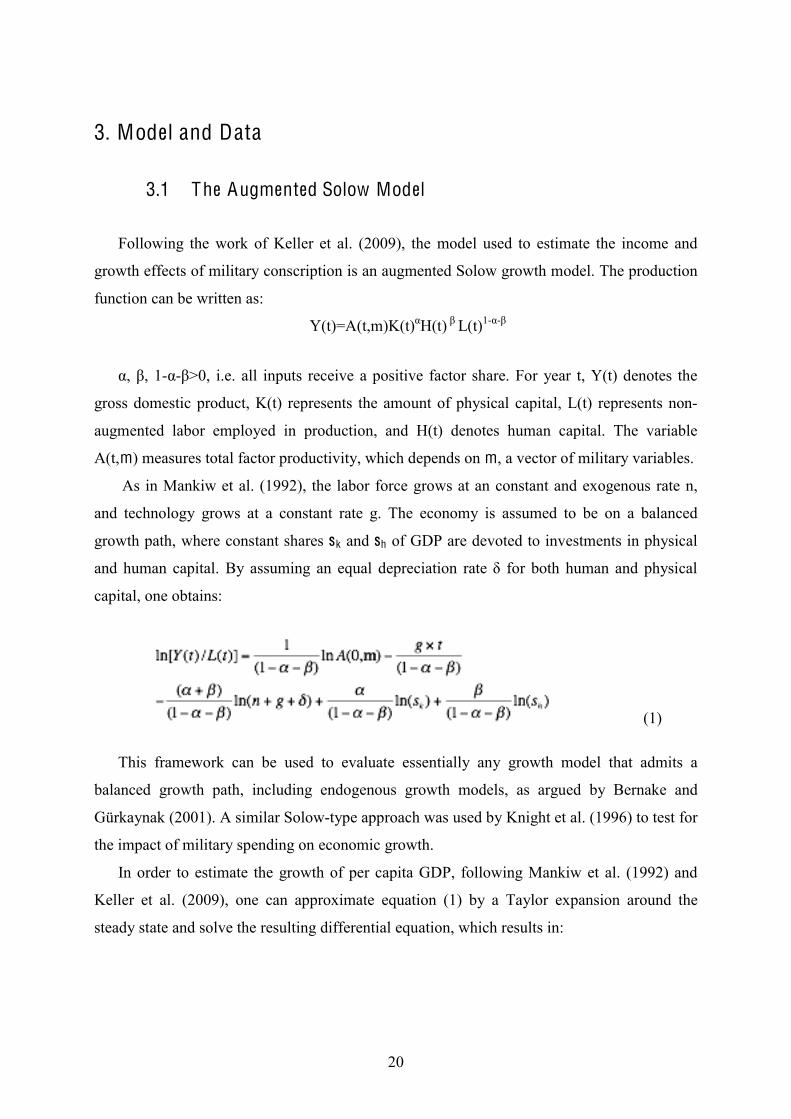
Following the work of Keller et al. (2009), the model used to estimate the income and
growth effects of military conscription is an augmented Solow growth model. The production
function can be written as:
Y(t)=A(t,m)K(t)!H(t) " L(t)1-!-"
!, ", 1-!-">0, i.e. all inputs receive a positive factor share. For year t, Y(t) denotes the
gross domestic product, K(t) represents the amount of physical capital, L(t) represents non-
augmented labor employed in production, and H(t) denotes human capital. The variable
A(t,m) measures total factor productivity, which depends on m, a vector of military variables.
As in Mankiw et al. (1992), the labor force grows at an constant and exogenous rate n,
and technology grows at a constant rate g. The economy is assumed to be on a balanced
growth path, where constant shares sk and sh of GDP are devoted to investments in physical
and human capital. By assuming an equal depreciation rate # for both human and physical
capital, one obtains:
(1) This framework can be used to evaluate essentially any growth model that admits a
balanced growth path, including endogenous growth models, as argued by Bernake and
Gürkaynak (2001). A similar Solow-type approach was used by Knight et al. (1996) to test for
the impact of military spending on economic growth.
In order to estimate the growth of per capita GDP, following Mankiw et al. (1992) and
Keller et al. (2009), one can approximate equation (1) by a Taylor expansion around the
steady state and solve the resulting differential equation, which results in:

21
(2)
where is the rate of convergence.
3.2 Data
In the analysis that follows I use the same 21 OECD countries for my sample, and extend
the period one decade further. The vector m in the augmented Solow model mentioned above,
is a assumed to be a vector of the following military variables:
Conscript Dummy Variable: this takes the value one if a country uses conscription ( in a
particular year). During transition time, when conscription is being abolished de jure but not
de facto, the variable also takes the value one, as long as the number of conscripts is positive.
Conscripts/A rmed Personnel is the ratio of conscripts to total armed personnel. If a
country does not have any conscripts, the value is zero. As seen in Figure 3, there is a clear
trend of decreasing shares of conscripts to total armed force in those 21 OECD countries since
1990. This control variable should indicate the effect of the composition of the armed force on
economic performance, i.e. whether a larger share of conscripts depresses economic
performance, or in other words, whether a more professionalized armed force is better for the
economy.
Conscripts/Labor Force is the ratio of conscripts to the total labor force. This should
measure the effect of the scope of conscription in the labor force. If conscription indeed
hampers economic performance, then the larger the share of the conscripts to the labor force,
the larger the negative effect it should have on income levels and growth.
A rmed Force Personnel/Labor Force is the ratio of total armed force personnel to total
labor force, i.e. the relative size of the armed force to the total labor force. It is a more general
military variable, and should indicate the effect of the relative size of armed force.

22
L ength of Conscription is the length of conscription measured in months. If the lengths
of conscription vary among military branches, army, navy, and air force, the length is
calculated as the weighted average of the service lengths from each branch, with respect to the
composition of conscripts in each branch. If the composition of conscripts in each branch is
unknown, and the lengths of conscription do vary among branches, the length of conscription
is calculated as the weighted average of the of service lengths from each branch, assuming
that conscripts are distributed identically as army, navy and air force in total armed force
personnel. The value of length of conscription takes the value zero if a country does not use
conscription.
Keller et al. (2009) include the lengths of alternative as a regressor. However, following
the same source (WRI, EBCO, and OMHROI), I find that there is unfortunately no time series
data on the lengths of alternative service, and so it is dropped from my estimations. The value
of length of conscription takes the value zero if a country does not use conscription.
The conscript dummy variable, the numbers of conscripts and the total armed force are
from the Military Balance of IISS (The International Institute for Strategic Studies, London).
To capture military environment, such as whether a country deploys armed force to
national or international conflicts, and how much a country spends in military expenditure, I
include the following two variables.
Conflict: is a dummy variable taking the value one if a country is involved in armed
conflict(s) in that year, as defined by the Uppsala Conflict Data Program (UCDP, 2011) ‘a
contested incompatibility that concerns government and/or territory where the use of armed
force between two parties, of which at least one is the government of a state, results in at least
25 battle-related deaths’. The data are taken from UCDP and the International Peace Research
Institute (PRIO, Oslo, 2011). Conflicts are for example the Vietnam War, Invasion of the
Falkland Island, the war against terrorism in Iraq and Afghanistan.
Military Expenditure/G DP is the ratio of military/defense expenditure to GDP, which is
taken from the World Development Indicators (2010) database of the World Bank. In the
literature of defense economics, there is usually mixed results of the estimated ceteris paribus
effects of this variable on economic growth (Frederiksen, 1983). Some say that it has no
effect, such as Denne et al. (2004), and some say it has negative effects on growth (Knight et

23
al. 1996). Despite the findings that the relationship between defense spending with economic
performance might be non-linear, as Heo (1998), Hooker and Knetter (1997) and Stroup and
Heckelmann (2001) argue, I include this variable in my simple linear regression models,
mostly because of the supposedly homogeneity in the OECD countries, and also following the
conscription regression models by Keller et al. (2009).
Other non military variables, GDP, GDP per capita growth rate, labor force, investment
proxy (gross capital composition as % of GDP), inflation rates, and population growth rates,
are taken from the World Development Indicators (2010) databases of the World Bank.
I use basically the same data source as Keller et al. (2009), with exceptions of Population,
and Education. Keller et al. (2009) use working-age population as a proxy for Population,
whereas I use the total labor force. For Education, they use the average shares of the
working-age population that is in secondary education, while I use the average years of
secondary education from Barro and Lee (Educational Attainment for Aged 15 and Over,
2010). The missing values in the four-year gaps from Barro and Lee are calculated assuming
that the changes in the average years of secondary education between each period change at
the same rate. Since there is so far no convention in choosing a proxy for human capital, as
discussed by Sianesi and Van Reenen (1992) and that there is essentially more data available
from Barro and Lee (average school years) than with the data used by Keller et al. (2009), I
use the education proxy from Barro and Lee.

24
Summary Statistics:
Table 1: Descriptive Statistics (Means of Variables of Interest)
Without Conscription
With Conscription All Countries
Conscripts /Armed Personnel
0 57.6% 32.5%
Conscripts/ Labor Force
0 0.1% 0.5%
Armed Personnel/Labor Force
0.75% 16.3% 12.7%
Length 0 13.508 months 8.488 months Conflict 0.361 0.223 0.272 Military Expenditure /GDP
1.854% 2.051% 1.964%
Investment/GDP 22.4% 23.2% 22.9% Population Growth Rate+ 0.05
0.059% 0.057% 0.058%
Education (secondary School Year)
3.621 years 2.562 years 2.935 years
Inflation Rate 4.2% 7.2% 6.2% GDP/Labor Force 45309.25 39280.38 41749.35 GDP per capita Growth Rate
1.83% 2.27% 2.11%
Table 1 reports the descriptive statistics for the major variables in the dataset. For those
observations where countries use conscription, the average ratio of armed personnel to the
total labor force (16.3%) is much larger than that for the group without conscription (0.75%).
Average military expenditure as a percentage in GDP is also higher for observations with
conscription. On average 2.05% of GDP is spent on the military sector for observations with
conscription, whereas observations without conscription spend less than 1.9% of GDP for
military sector. The average investment ratio to GDP is slightly larger in countries with
conscription. However, these differences may not be significantly different.
In terms of other variables, population growth is slightly larger and average years of
secondary education is more than one year higher for countries that do not use conscription,
results which are consistent with the findings of Keller et al. (2009). Interestingly, the
observations without conscription have more conflicts on average. Income levels as measured
in GDP by per unit of the labor force are higher on average in the observations that do not use

25
conscription, and the corresponding GDP per capita growth rate is lower.
The average inflation rate is higher in the sample of countries that use conscription. Keller
et al. (2009) argue that higher inflation indicates the weaker ability of the government to tax,
thus the government is more likely to use conscription as the main source to recruit military
staff. Therefore I report in Table 2 the correlations (along with significance levels) between
inflation and military variables. Inflation is indeed significantly positively correlated with all
the military variables, with the highest correlation being with the ratio of conscripts to the
labor force. The ratio of military expenditure to GDP is also positively and significantly
correlated with all the military variables, and highest with respect to the ratio of total armed
forces to the labor force. Conflict is negatively correlated with all the military variables,
although not always significantly. It seems that countries with higher inflation rates rely more
on conscription, and that countries which are involved in more conflicts rely more on
professional soldiers.
Table 2: Correlation and Significance
Inflation Military Expenditure/GDP
Conflict
Conscription DV 0.172 *** 0.105 ** -0.1475 *** Conscripts/Total Armed Personnel
0.331 *** 0.154 ** -0.1869***
Conscripts/Labor Force
0.593 *** 0.422 *** -0.05
Total Armed Personnel/Labor Force
0.547 *** 0.596 *** -0.054
Length 0.293 *** 0.298 *** -0.064 * Note: *, **, and *** denotes significance at the 10%, 5% and 1% levels respectively

26
4. Results
When estimating equation (1) and (2), I extend the augmented growth model of Mankiw
et al. (1992) by adding six military variables, measuring the use of conscription and the
relative size of military expenditure to GDP. The variable Military Expenditure/GDP is added
to the conscription variables because it very likely affects the choice of military recruitment,
i.e the size and composition of the military force. Instead of using military expenditure/GDP
as an additional control variable as in Keller et al. (2009) in most of their estimations, I
include it as one of the military variables to avoid potential multicollinearity problems.
Inflation and Conflict are added as additional control variables, as the inflation rate has
often been shown to negatively affect economic growth (Barro (1996), Fountas et al. (2001)),
and conflicts are likely to be the cause of demand for military output.
For both the income and growth estimations, I first report the regression results without
any military variable for the sake of comparison, before reporting results when adding
military variables one by one. This setup is then repeated for both income and growth
estimations in the following four specifications, each including more control variables:
Specification I: Investment, Population Growth, Education, as in the model of Mankiw et
al. (1992) )+ Conflict
Specification II: Specification I+ Inflation Rates
Specification III: Specification II+ Country Fixed Effects
Specification IV: Specification III+ Year Fixed Effects
Note that all the ratio variables, and GDP per capita growth rates are multiplied by 100, for
easier numerical interpretation
4.1 Income L evels
Table 3 reports OLS regression results for income levels under Specification I. The
coefficients on population growth and education receive the expected signs, i.e. population
growth has negative and education has positive effects on the level of income. In addition, the
estimated coefficients of population growth rate and education are all significant from column

27
(1) to (7). The coefficient on investment, on the other hand, does not always receive the
expected positive sign, for example in column (5) and (7). It is strange that the coefficients of
investment change so much when military variables are added. The coefficients on conflict
are always positive (although insignificant) in Table 3.
From column (2) to (7), one can see that enforcing military conscription depresses
income, and all the estimates of military variables are negative and significant, holding all
else constant. By having a conscription system, income per member of the labor force is
depressed by 0.06% ceteris-paribus. In terms of the effects of military staff composition, as
shown in column (3), the higher the percentage of conscripts to the total armed force the
lower is income per member of the labor force (all else equal). Based on the estimated
coefficient in column (3) and ceteris paribus assumption, if the total armed force personnel is
staffed equally by conscripts and professionals, the income per labor force is depressed by
about 0.045%; and if the armed force personnel is entirely consisted of conscripts, income per
labor force is depressed by 0.09%. A one month increase in the spell of conscription duration
depresses income per unit of the labor force by 0.01% (holding all else constant).
In column (4), the coefficient on the ratio of conscripts to the labor force indicates that if
10% of the labor force is forced to serve in conscription, income per unit of the labor force is
depressed by 1.31% (holding all else constant). To see the effects of the total military
personnel and expenditure on income, one can look at the estimates of Armed Force
Personnel/Labor Force and Military Expenditure/GDP as in column (5) and (7). Holding all
else constant, if 10% of the total labor force works in the military sector, income per labor
force is depressed by 1.29%; and a 10% increase in military expenditure to GDP depresses
income per labor force by 0.009%.

28
Table 3: Incom
e Levels under S
pecification I
(1)
(2) (3)
(4) (5)
(6) (7)
Investment
0.00202 0.00216
0.00231 0.00196
-0.000425 0.00227
-0.1018**
(0.00329) (0.00320)
(0.00324) (0.00314)
(0.00304) (0.00304)
(0.00435) P
opulation Grow
th +0.05
-0.3479*** -0.362***
-0.353*** -0.3201***
-0.325*** -0.3581***
-0.2793***
(0.02959)
(0.02946) (0.02865)
(0.02719) (0.02723)
(0.02754) (0.03.721)
Education
0.312*** 0.302***
0.301*** 0.260***
0.259*** 0.280***
0.291***
(0.0111) (0.0122)
(0.0123) (0.0136)
(0.0128) (0.0128)
(0.0155) C
onflict 0.0326
0.0258 0.0217
0.0136 0.0138
0.0210 0.00882
(0.0254)
(0.0257) (0.0256)
(0.0237) (0.0233)
(0.0251) (0.0281)
Conscript D
V
-0.0614**
(0.0271)
C
onscripts/Arm
ed Force
-0.00098**
(0.00042)
Conscripts/L
abor Force
-0.131***
(0.0168)
Arm
ed Force/L
abor Force
-0.129***
(0.0140)
Length
-0.0105***
(0.00207)
M
ilitary E
xpenditure/GD
P
-0.000968***
(0.000169)
Constant
11.38*** 11.53***
11.48*** 11.49***
11.66*** 11.62***
11.55***
(0.174) (0.183)
(0.174) (0.160)
(0.159) (0.169)
(0.195)
O
bservations 629
629 627
627 625
628 461
R-squared
0.610 0.614
0.614 0.646
0.656 0.628
0.589 F
-stat 215.1
189.3 193.4
295 255.9
225.9 111.4
Note: *(**)[***] denotes significance at the 10%
, (5%), [1%
] level; robust standard errors in parentheses

29
By adding the inflation rate as a control variable, Table 4 reports the results of the income
equation for specification II. The coefficients on population growth rate and education still
have the expected signs, and are always significant. The coefficients on investment are
estimated to be mostly positive though insignificant in columns (1) to (6), while in column (7)
the coefficient is estimated to be negative. The coefficient on the inflation rate is found to be
negative, as economic theory predicts, and is always significant. The coefficients on conflicts
are positive, and mostly significant except in columns (5) and (7).
Few things change in the coefficients of the conscription variables once inflation is added:
The coefficients on the conscript dummy and conscripts/armed force change signs, although
their coefficients are insignificant (columns (2) and (3)), while Length remains negative but
loses significance at conventional confidence levels (column (6)).
Among the remaining three negative and significant coefficients, the largest is the share of
armed personnel to the labor force (column (5)), a 10% increase of which reduces GDP per
unit of the labor force by more than 0.7%. The second largest effect is from the share of
conscripts to the labor force (column (4)), a 10% increase of which depresses GDP per labor
force by more than 0.5%. The coefficient on the ratio of military expenditure to GDP has the
smallest negative and significant coefficient under Specification II, a 10% increase in military
expenditure decreases GDP per labor force by 0.005% ceteris paribus.
29

30
Table 4: Incom
e Levels under S
pecification II
(1)
(2) (3)
(4) (5)
(6) (7)
Investment
0.002991 0.003
0.00293 0.00269
0.00119 0.00286
-0.00577
(0.00306) (0.00306)
(0.0031) (0.00301)
(0.00296) (0.0030)
(0.00426) P
opulation Grow
th +0.05
-0.2040*** -0.2038***
-0.1958*** -0.2130***
-0.2190*** -0.2154***
-0.1784***
(0.03228) (0.0341)
(0.03385) (0.03164)
(0.03152) (0.03299)
(0.03953) E
ducation 0.220***
0.220*** 0.222***
0.209*** 0.206***
0.213*** 0.227***
(0.0153)
(0.0156) (0.0156)
(0.0157) (0.0154)
(0.0155) (0.0191)
Conflict
0.0496** 0.0496**
0.0532** 0.0402*
0.0366 0.0499**
0.0364
(0.0246) (0.0249)
(0.0252) (0.0244)
(0.0240) (0.0247)
(0.0276) Inflation
-0.01748*** -0.01748***
-0.01806*** -0.01502***
-0.01415*** -0.01680***
-0.01432***
(0.00190) (0.00194)
(0.00202) (0.00192)
(0.00179) (0.00198)
(0.00192) C
onscript DV
0.000643
(0.0258)
Conscripts/A
rmed F
orce
0.000464
(0.000394)
Conscripts/L
abor Force
-0.0578***
(0.0180)
A
rmed F
orce/Labor F
orce
-0.0760***
(0.0136)
Length
-0.00303
(0.00216)
M
ilitary Expenditure/G
DP
Military E
xpenditure/GD
P
-0.000512***
(0.000153) C
onstant 10.96***
10.96*** 10.90***
11.08*** 11.22***
11.07*** 11.08***
(0.160)
(0.180) (0.172)
(0.165) (0.165)
(0.174) (0.187)
Observations
620 620
618 618
616 619
460 R
-squared 0.682
0.682 0.683
0.687 0.695
0.685 0.636
F-stat
257.2 214.2
205.2 283.3
284 228.3
203.7
Note: *(**)[***] denotes significance at the 10%
, (5%), [1%
] level; robust standard errors in parentheses

31
As Table 2 shows, the inflation rate is positively and significantly correlated with all
military variables. Once inflation is added as a control variable, three of six military variables
lose their significance, with two of them changing signs. One possible explanation might be
due to omitted variable bias. Since I do not have data on alternative military service, the
conscription dummy is likely to capture some of the effect of alternative service. The effects
of alternative service are argued by Keller et al. (2009) to be negative, following the same
logic of differences in comparative advantages. Among the 21 OECD countries that use
conscription, most of them also offer alternative service to conscientious objectors. The
positive sign of conscript DV in column (2) in Table 4 might somehow capture some
(positive) effects from alternative service in the public and social sectors, once inflation is
controlled for. Furthermore, inflation can perhaps be seen as a proxy for deadweight loss in
taxation, as argued by Keller et al. (2009). Countries with higher inflation may be less able to
staff armed force adequately with professional soldiers, and may thus be more prone to
conscription. (Table 2 shows positive and significant correlation between inflation rates and
all the conscription variables.) However, given the rather homogenous sample of developed
countries, the argument that higher inflation implies more deadweight loss in taxation and
thus more intense conscription use, may not apply. Another possible explanation is the time
horizon. The decrease in the ratio of conscripted soldiers to total armed force happened only
after 1990, as Figure 3 shows. It might be that two decades are not enough to fully exhibit the
effects of the intensity of conscription in terms of the share of conscripts to the armed force,
as in column (3) of Table 4.
31

32
Table 5: Incom
e Levels under S
pecification III
(1) (2)
(3) (4)
(5) (6)
(7) Investm
ent 0.00205
0.00257 0.00266
0.00203 0.00154
0.00208 0.00416***
(0.00168)
(0.00168) (0.00172)
(0.00169) (0.00158)
(0.0017) (0.00159)
Population G
rowth+
0.05 0.03518*
0.03807** 0.04036**
0.03530** 0.03113*
0.03522* 0.03054*
(0.0180)
(0.01747) (0.01758)
(0.01797) (0.01672)
(0.01798) (0.01804)
Education
0.164*** 0.173***
0.177*** 0.161***
0.109*** 0.166***
0.102***
(0.0156) (0.0186)
(0.0206) (0.0219)
(0.0162) (0.0185)
(0.0252) C
onflict 0.0783***
0.0830*** 0.0819***
0.0774*** 0.0648***
0.0796*** 0.0485***
(0.0129)
(0.0128) (0.0128)
(0.0123) (0.00937)
(0.0124) (0.0113)
Inflation -0.00676***
-0.00664*** -0.00692***
-0.00667*** -0.00502***
-0.00682*** -0.00387***
(0.00105)
(0.00107) (0.00107)
(0.00106) (0.000832)
(0.00105) (0.000793)
Conscript D
V
0.0586**
(0.0232)
C
onscripts/Arm
ed Force
0.000928*
(0.000484)
Conscripts/L
abor Force
-0.00830
(0.0243)
Arm
ed Force/L
abor Force
-0.115***
(0.0189)
Length
0.000788
(0.00181)
M
ilitary Expenditure/G
DP
-0.00114***
(0.000156)
Constant
9.854*** 9.777***
9.959*** 9.350***
9.595*** 9.842***
10.28***
(0.111) (0.120)
(0.100) (0.103)
(0.104) (0.123)
(0.137) O
bservations 620
620 618
618 616
619 460
R-squared
0.957 0.958
0.957 0.957
0.963 0.957
0.977 F
-stat 625.6
592.2 563.3
629.3 706.3
592.8 1497.4
Note: *(**)[***] denotes significance at the 10%
, (5%), [1%
] level; robust standard errors in parentheses

33
Table 5 introduces country fixed effects in to the previous regression model. When doing
so we observe that the coefficients on investment always have the expected positive signs,
with the coefficients being significant in all cases except column (7). The coefficients on
inflation and education not only always have the expected signs, but are also always
significant. Notably, the coefficients of population growth rate and the presence of conflicts
are all significantly positive, once country fixed effects are added to the specification.
When adding country fixed effects, enforcing conscription has positive and significant
effects in terms of the conscription dummy (column (2)) and the share of conscripts to armed
force (column (3)). Having a conscription system increases GDP per unit of the labor force by
more than 0.05% (significant at the 5% level), and a 10% increase in the share of conscripts to
the armed force increases GDP per unit of the labor force by 0.009% (significant at the 10%
level).
The more general military variables, i.e. the relative size of the armed forces to the labor
force, and the relative share of military expenditure to GDP, both remain negative and
significant at the 1% level (columns (5) and (7)).
Compared with the results from a similar specification in Keller et al. (2009), Table 5 shows
a number of differences. In the paper of Keller et al (2009) all estimated coefficients on the
conscription variables are negative, and mostly significant. Moreover, the coefficient on the
share of military expenditure to GDP is estimated to have almost no effect on income levels.
The new variable I add, the share of conscripts to the armed force is estimated to be negative
yet insignificant at conventional confidence levels.
One explanation for the positive signs and significance of the coefficients on the conscript
dummy and the share of conscripts to armed force could be that by adding country fixed
effects, the omitted variable issues are removed to a certain extent, and the country specific
characteristics are captured. The effects of enforcing conscription seem to be mixed and hard
to explain once country fixed effects are added to the estimation.
33

34
Table 6: Incom
e Levels under S
pecification IV
(1)
(2) (3)
(4) (5)
(6) (7)
Investment
0.00659*** 0.00785***
0.00776*** 0.00790***
0.00867*** 0.00769***
0.00828***
(0.00136) (0.00131)
(0.00133) (0.00136)
(0.00139) (0.00140)
(0.00149) P
opulation Grow
th+0.05
0.00774 0.01123
0.01700 0.00312
0.00409 0.00705
0.02233*
(0.01187)
(0.01089) (0.01128)
(0.01122) (0.01124)
(0.0112) (0.01.17)
Education
0.00228 0.0124*
0.0213*** 0.0192**
0.0118 0.0122*
-0.00556
(0.00760) (0.00654)
(0.00667) (0.00750)
(0.00719) (0.00652)
(0.0119) C
onflict -0.0103
-0.00567 -0.00608
-0.0110 -0.00925
-0.00605 -0.0155**
(0.00750)
(0.00697) (0.00689)
(0.00737) (0.00709)
(0.00704) (0.00724)
Inflation -0.00244***
-0.00214*** -0.00268***
-0.00299*** -0.00248***
-0.00270*** -0.00305***
(0.00067)
(0.000632) (0.00667)
(0.000756) (0.000711)
(0.000657) (0.000573)
Conscript D
V
0.0950***
(0.00988)
C
onscripts/Arm
ed Force
0.00181***
(0.000243)
Conscripts/L
abor Force
0.0571***
(0.0138)
Arm
ed Force/L
abor Force
0.0465***
(0.0110)
Length
0.00582***
(0.000978)
M
ilitary Expenditure/G
DP
-0.000116
(0.000103)
Constant
10.58*** 10.47***
10.40*** 10.50***
9.308*** 10.51***
9.348***
(0.0773) (0.0717)
(0.0770) (0.0807)
(0.0785) (0.0747)
(0.0928) O
bservations 620
620 618
618 616
619 460
R-squared
0.984 0.986
0.986 0.985
0.986 0.985
0.990 F
-stat 823.3
925.7 834.9
742.8 758.6
805.8 1223.67
Note: *(**)[***] denotes significance at the 10%
, (5%), [1%
] level; robust standard errors in parentheses

35
Table 6 reports the results of the income regressions under specification IV, where time
dummies are additionally included in the model. Inflation rates are always found to have a
negative and significant effect on the income level (significant at the 1% level), and
investment always has a positive and significant effect (at the 1% level). The presence of
conflicts has mostly negative and insignificant effects, while population growth rates have a
positive and mostly insignificant effect when year fixed effects are added. All the coefficients
on military variables become positive and highly significant (at 1%) in specification IV,
except for the share of military expenditure to GDP which is negative and insignificant.
Year fixed effects control for time-specific heterogeneity (i.e. world business cycles).
They are also likely to capture the impacts of technological and organizational improvements
in the military sector (and elsewhere), developments in military strategy, the advent of
military adventurism and joint missions, and historical events, etc. Surprisingly, when adding
year fixed effects, all the conscription variables are estimated to be positive and significant.
This is difficult to explain with the classic economic theory of comparative advantages alone.
Further research on the relationships between these time-specific impacts and conscription
should shed more light on the effects of conscription on income levels.
Table 7: Summary of Income Regression Results
I II III IV Conscript DV - ** + + ** + *** Conscripts/Armed Force
- ** + + ** + ***
Conscripts/Labor Force
- *** - *** - + ***
Armed Force/Labor Force
- *** - *** -*** + ***
Length - *** - + + *** Military Expenditure/GDP
- *** - *** - *** -
In Table 7, I report the signs and significance levels of the military variables from all four
specifications. Looking at the columns from left to right, one can see that deviating from the
augmented Solow model by adding more control variables, and in particular when adding
country and time fixed effects, the conscription variables lose their significance, and usually
change signs from negative to positive. Only under specification I are all conscription and
35

36
military variables negative and significant.
4.2 G rowth Rates
This section reports results from OLS regressions estimating Equation (2). In my analysis
I use data on annual growth rates, whereas Keller et al. (2009) use decadal average growth
rates. To estimate Equation (2), one needs to account for the initial income level. Keller et al.
(2009) use the GDP per capita in 1960 as a regressor in their growth estimations. One
problem with the initial per capita GDP term is that it is not possible to estimate the
coefficient on this variable when country fixed effects. In order to compare results across the
different specifications therefore I choose to drop the initial per capita GDP term in all
models. Time-invariant, country-specific factors – such as the initial income term – will be
captured by the country fixed-effects in specifications III and IV however.

37
Table 8: G
rowth under S
pecification I
(1)
(2) (3)
(4) (5)
(6) (7)
Investment
0.1331*** 0.1329***
0.1230*** 0.1227***
0.1229*** 0.1229***
0.1794***
(0.02263) (0.02268)
(0.02674) (0.02966)
(0.03006) (0.02304)
(0.04119) P
opulation Grow
th+0.05
-0.356* -0.3946**
-0.4415* -0.2663
-0.3244 -0.2059
-0.4334
(0.1928) (0.1977)
(0.2307) (0.2153)
(0.2284) (0.1862)
(0.2804) E
ducation -0.376***
-0.420*** -0.211**
-0.241** -0.174
-0.299*** -0.232*
(0.0786)
(0.0809) (0.0927)
(0.112) (0.126)
(0.0817) (0.140)
Conflict
-0.356* -0.382*
-0.533** -0.602***
-0.565** -0.427**
-0.856***
(0.203) (0.206)
(0.221) (0.226)
(0.225) (0.200)
(0.227) C
onscript DV
-0.263
(0.195)
Conscripts/A
rmed F
orce
-0.00595*
(0.00322)
Conscripts/L
abor Force
-0.179
(0.159)
A
rmed F
orce/Labor F
orce
-0.0345
(0.146)
Length
0.0153
(0.0145)
M
ilitary Expenditure/G
DP
0.00182
(0.00138)
Constant
2.407** 2.947**
2.631** 1.663
1.683 1.413
1.100
(1.115) (1.226)
(1.199) (1.162)
(1.251) (1.075)
(1.464)
O
bservations 880
880 778
635 624
859 480
R-squared
0.112 0.113
0.076 0.068
0.064 0.098
0.110 F
-stat 21.78
17.67 9.496
7.934 7.343
15.04 11.25
Note: *(**)[***] denotes significance at the 10%
, (5%), [1%
] level; robust standard errors in parentheses

38
Table 8 reports results from growth regressions under specification I. The coefficients on
population growth and investment have the expected signs, negative and positive respectively,
though the coefficients on population growth are not significant in column (4) to (7).
Education has surprisingly all negative and significant coefficients, though this has been
found else where (Angrist and Krueger (1991), and Benhabib and Spiegel (1994), Gemmell
(1996) Krueger and Lindahl (2001), and Pritchett (2011)). The conflict variable is found to
have a consistently negative and significant effects in specification I.
The coefficients on the conscript dummy, the share of conscripts to the labor force, and
the share of armed force to the labor force are all negative, but not significant at conventional
levels (column (2), (4), and (5)). The coefficients on length and on the share of military
expenditure to GDP are positive and insignificant (column (6) and (7)). In fact, the only
significant coefficient amongst the military variables is the share of conscripts to the total
armed force (column (3)), with a coefficient of -0.00595 that is significant at the 10% level. In
this specification, a 10% increase in the share of conscripts to total armed force depresses
economic growth by around 0.006%, holding all constant.
When adding the inflation rate (Table 9), the signs of the coefficients on investment,
population growth and the presence of conflicts are as expected. The coefficients on education
continue to have the negative signs, and are always significant. The presence of conflicts have
mostly negative and significant effects on the GDP growth rates per capita, holding all else
constant.
The only significant military variable in specification II is the length of conscription, with
a coefficient of 0.0262 (significant at the 10% level in column (6)). A one month increase in
the duration of conscription increases GDP growth rate per capita by 0.0262%, holding all
else constant. The coefficient on the share of conscripts in total armed force is still negative,
but loses significance when the inflation rate is added to the regression.
38

39
Table 9: G
rowth under S
pecification II
(1)
(2) (3)
(4) (5)
(6) (7)
Investment
0.1408*** 0.1400***
0.1220*** 0.1247***
0.1271*** 0.1316***
0.1819***
(0.02157) (0.02161)
(0.02680) (0.02982)
(0.03034) (0.02177)
(0.04181) P
opulation Grow
th+0.05
-0.1034 -0.1413
-0.1749 -0.07023
-0.09.564 1.099
-0.33.53
(0.2124) (0.2231)
(0.2920) (0.2442)
(0.2490) (0.1988)
(0.3006) E
ducation -0.577***
-0.610*** -0.315**
-0.297** -0.254*
-0.475*** -0.280*
(0.0901)
(0.0947) (0.125)
(0.136) (0.147)
(0.0935) (0.160)
Inflation -0.06118***
-0.06040*** -0.03317
-0.02389 -0.02663
-0.06706*** -0.01207
(0.01808)
(0.01814) (0.02259)
(0.02650) (0.02536)
(0.01841) (0.02737)
Conflict
-0.259 -0.266
-0.515** -0.608***
-0.573** -0.368*
-0.845***
(0.210) (0.211)
(0.223) (0.231)
(0.229) (0.203)
(0.229) C
onscript DV
-0.187
(0.208)
Conscripts/A
rmed F
orce
-0.00300
(0.00350)
Conscripts/L
abor Force
-0.0330
(0.191)
A
rmed F
orce/Labor F
orce
0.0784
(0.163)
Length
0.0262*
(0.0144)
M
ilitary Expenditure/G
DP
0.00208
(0.00138)
Constant
1.789 2.246
1.585 0.745
0.574 0.287
0.662
(1.218) (1.402)
(1.359) (1.243)
(1.319) (1.164)
(1.529)
O
bservations 862
862 760
626 615
841 479
R-squared
0.142 0.142
0.085 0.073
0.071 0.135
0.111 F
-stat 22.37
18.75 8.876
6.858 6.421
17.01 9.335
Note: *(**)[***] denotes significance at the 10%
, (5%), [1%
] level; robust standard errors in parentheses

40
Table 10: G
rowth under S
pecification III
(1)
(2) (3)
(4) (5)
(6) (7)
Investment
0.3361*** 0.3411***
0.3508*** 0.4058***
0.4064*** 0.3362***
0.4746***
(0.03226) (0.03244)
(0.03429) (0.04224)
(0.04427) (0.03285)
(0.05618) P
opulation Grow
th+0.05
-1.541*** -1.530***
-1.516*** -2.013***
-2.037*** -1.492***
-2.615***
(0.2040) (0.2042)
(0.2289) (0.2603)
(0.2691) (0.2514)
(0.2834) E
ducation -0.503***
-0.418*** 0.0272
0.217 -0.0816
-0.269** -0.485
(0.114)
(0.125) (0.164)
(0.258) (0.267)
(0.137) (0.371)
Inflation -0.1373***
-0.1376*** -0.1375***
-0.1298*** -0.1187***
-0.1398*** -0.06241
(0.01831)
(0.01829) (0.02576)
(0.03062) (0.03261)
(0.01861) (0.04029)
Conflict
-0.521*** -0.529***
-0.737*** -0.878***
-0.860*** -0.660***
-1.035***
(0.198) (0.197)
(0.211) (0.221)
(0.225) (0.197)
(0.243) C
onscript DV
0.509*
(0.291)
Conscripts/A
rmed F
orce
0.0189***
(0.00678)
Conscripts/L
abor Force
0.957**
(0.411)
A
rmed F
orce/Labor F
orce
0.242
(0.377)
Length
0.0544***
(0.0179)
M
ilitary Expenditure/G
DP
-0.00747**
(0.00319)
Constant
4.015*** 2.978**
4.637*** 1.263
3.647 5.519***
12.45***
(1.270) (1.386)
(1.322) (2.287)
(2.724) (1.297)
(1.780)
O
bservations 862
862 760
626 615
841 479
R-squared
0.309 0.310
0.280 0.283
0.282 0.301
0.334 F
-stat 11.87
11.57 8.843
7.645 6.725
10.63 7.956
Note: *(**)[***] denotes significance at the 10%
, (5%), [1%
] level; robust standard errors in parentheses

41
In Table 10 country fixed effects are added as control variables. The coefficients on
investment, the population growth rates, and the inflation rates have the expected signs and
mostly significant. The ceteris paribus effect of average years in secondary schooling is
mixed, and not always significant, with positive signs found in column (3) and (4). Notably
the presence of conflicts has a consistently negative and significant effect on growth rates.
All the coefficients on conscription variables are positive, and most of them are
significant except for the share of armed force to the labor force. The largest positive effect
among the conscription variables is the share of conscripts in the labor force (column (6)),
with results indicating that a 1% increase in its share increases GDP per capita growth rate by
0.957% . The second largest positive effect among the significant conscription variable is the
conscript dummy (column (2)), if a country enforces conscription, its GDP per capita growth
rate increases by 0.509% compared with the scenario where it employs a fully volunteer
armed force.
When country fixed effects are included the coefficient on military expenditure/GDP
becomes negative and significant (column (7)). A 10% increase in the share of military
expenditure to GDP decreases per capita GDP growth rate by 0.07%.
It appears that by adding country fixed effects, and thereby taking initial income levels
and other country-specific, time invariant factors into account, conscription variables have a
positive effect on economic growth.
41

42
Table 11: G
rowth under S
pecification IV
(1)
(2) (3)
(4) (5)
(6) (7)
Investment
0.2784*** 0.2778***
0.2877*** 0.2971***
0.2978*** 0.2828***
0.3436***
(0.02895) (0.02938)
(0.03188) (0.03952)
(0.04061) (0.02975)
(0.05992) P
opulation Grow
th+0.05
-1.282*** -1.282***
-0.9785*** -1.368***
-1.365*** -1.137***
-1.745***
(0.1884)
(0.1884) (0.2360)
(0.2465) (0.2498)
(0.2226) (0.2892)
Education
-0.177 -0.181
-0.148 0.0264
-0.116 -0.198
-0.647**
(0.177) (0.173)
(0.178) (0.248)
(0.238) (0.159)
(0.272) Inflation
-0.1100*** -0.1099***
-0.1323*** -0.1230***
-0.1166*** -0.1133***
-0.08725***
(0.02102) (0.02104)
(0.02422) (0.02824)
(0.02811) (0.0210)
(0.03277) C
onflict 0.0906
0.0944 0.0203
0.0890 0.103
-0.128 -0.191
(0.207)
(0.205) (0.214)
(0.223) (0.219)
(0.204) (0.254)
Conscript D
V
-0.0442
(0.234)
C
onscripts/Arm
ed Force
0.0155***
(0.00567)
Conscripts/L
abor Force
0.650*
(0.358)
Arm
ed Force/L
abor Force
0.490
(0.360)
Length
0.0139
(0.0189)
M
ilitary Expenditure/G
DP
-0.000325
(0.00324)
Constant
4.393* 4.475*
1.197 2.458
1.178 9.540**
11.88***
(2.510) (2.596)
(1.459) (2.050)
(2.403) (3.721)
(2.058) O
bservations 862
862 760
626 615
841 479
R-squared
0.540 0.540
0.540 0.560
0.556 0.541
0.607 F
-stat 11.80
11.89 .
. 11.37
11.19 13.09
Note: *(**)[***] denotes significance at the 10%
, (5%), [1%
] level; robust standard errors in parentheses

43
Table 11 adds year fixed effects. The coefficients on investment, population growth rate,
and the inflation rate have the expected signs and are always significant in this specification.
The coefficients on education are mostly negative, with the exception of column (5). The
coefficients on the presence of conflicts all have positive signs but are insignificant in Table
11.
The coefficient on the conscript dummy changes sign when year fixed effects are added,
but is insignificant (column (2)). The coefficients on the share of armed force to the labor
force and the length of conscription (column (5) and (6)) are still positive but lose their
significance when year fixed effects are controlled for. The coefficient on the share of
conscripts to the labor force (column (5)) is still positive and significant, but is smaller
compared with that in specification III (with a coefficient of 0.957). When year fixed effects
are added, a 1% increase in the share of conscripts to the labor force increase GDP per capita
growth rate by 0.65%.
Table 12 Summary of Growth Regression Results:
I II III IV Conscript DV - - + * - Conscripts/Armed Force
- * - + *** + ***
Conscripts/Labor Force
- - + ** + *
Armed Force/Labor Force
- + + +
Length + + * + *** + Military Expenditure/GDP
+ + - ** -
I summarize the signs and significance levels of the growth regressions in Table 12. In
general, military and conscription variables exhibit mixed signs. In the first two
specifications, most of the conscription variables are estimated to be negative, although rarely
significant. Adding country fixed effects, the conscription variables show positive and
statistically significant effects on economic growth. In specification IV, most of the
conscription variables remain positive except for the conscript dummy, with only
conscripts/labor force remains significant. It is to be noted that the duration of conscription
spell remains positive in all four specifications, although not always significant.
43

44
Specification III and IV are the most likely candidates for estimation of Equation (2) in
my growth regressions, because country fixed effects should capture differences in initial
GDPs. Comparing the summary results from specification III and IV, most conscription
variables lose their significance, with the conscript dummy changing its sign. Interestingly, all
the conscription variables are estimated to be positive and significant in specification III. It is
puzzling and difficult to explain these results with only the classic theories which suggest that
conscription hampers economic growth. Furthermore, even though I use the same 21 OECD
countries as Keller et al. (2009), I do not find consistently negative and significant effects of
conscription on economic growth as they do.
It seems that when fixed effects are added, conscription has a positive though not always
significant effect on economic growth. By adding fixed effects, the problem of omitted
variables (i.e. alternative service) should be removed to a certain extent, yet the results from
specification III and IV still present the unexpected positive effect of conscription.
4.3 Sensitivity Test
An important issue related to my analysis is that the use of conscription may be an
endogenous variable. Warner and Ash (1996), Warner and Negrusa (2005) and Mulligan and
Shleifer (2005) aim at explaining why some countries use conscription and some rely on
professional armed force. More precisely, they are interested in whether there is reverse
causality from income to conscription.
It could be that richer countries do not use conscription, while poorer countries cannot
afford a fully professional armed force. However, Mulligan and Shleifer (2005) do not find
any statistical significance for an impact of a country’s per-capita income on the choice of
military recruitment system. They argue that the choice of conscription might be correlated
with a high administrative burden that is to be found with a French civil-law legal origin.
Keller et al. (2009) test for Granger causality in their cross-country results to investigate
the possibility of reverse causality. The null hypothesis of no Granger causality cannot be
rejected at the 5% confidence level for many countries. More specifically, the results are
mixed. For some countries (Austria, France, and Greece), the length of conscription and the
share of conscripts in the labor force Granger cause growth. In Sweden, income Granger

45
causes the share of conscripts in the labor force, and growth Granger causes the duration of
conscription.
As for my results, since the conscription variables are neither consistently negative, as the
theory of comparative advantage suggest, nor are they consistently negative and significant as
in Keller et al. (2009), I do not test for Granger causality by country. Instead, I conduct least
absolute value (LAV), or least absolute deviation estimation, to reduce the influence of
potential outliers. To do this, I check the results from quantile regressions for all the income
and growth estimations, and then compare the signs and significance levels of military
variables with the OLS results reported in the section above.
By and large, most of the coefficients from LAV and OLS share the same signs and
significance with few exceptions. The major exceptions are that in the income regression
under specification II, military expenditure/GDP is positive and insignificant in OLS, but
negative and highly significant in LAV, while in the growth regression under Specification
IV, the conscript dummy is insignificantly negative in OLS and significantly positive in LAV
at 1% level.

46
5 Conclusion
The effect of military conscription on economic performance is predicted to be associated
with static inefficiencies as well as with dynamic distortions of human and physical capital.
Examining panel data from 21 OECD countries from 1960 to 2010 shows however
inconsistent results, especially when fixed effects are added.
Military conscription is measured by the conscription dummy variable, the share of
conscripts to the armed force, the share of conscripts in the labor force and the length of
service time. To see the effects of more general military sector, the relative size of the armed
force to the labor force and the relative size of military expenditure to GDP are also added.
To control for the demand for military output I include a conflict variable, which is a
dummy variable and takes the value one if a country is involved in domestic or international
conflict. The ceteris paribus effect of this variable is mixed. On income levels, which are
measured by GDP per unit of labor force, the coefficient of conflict is estimated to be mostly
zero, and sometimes significantly positive. Whereas on growth rates, which is the GDP per
capita growth rate, the coefficient of conflict is mostly significant and negative, and only
rarely zero.
The more general military variables, namely the share of military spending to GDP and
the share of military personnel to the labor force, have more consistent ceteris paribus effects
in my regressions. The relative size of the armed force to the labor force always receives the
negative sign in income regressions, and is always significant at the 1% level, whereas in
growth regressions it is estimated to have no effect. The coefficient of the ratio of military
expenditure to GDP is estimated to have negative and significant effects on income levels,
and has mixed results in growth regressions. In the literature on defense economics, military
spending has pretty mixed effects on economic growth. The relative size of the armed force,
however, has not yet been extensively considered. My results suggest that in OECD countries,
the larger the share of the labor force working in the military sector, the lower the income
levels are, holding all else constant.
The ceteris paribus effects of conscription variables on income levels (GDP per unit of
labor force) and economic growth (GDP per capita growth rate) are not consistently negative
when country and year fixed effects are included in the regressions. Compared with the
consistently negative and significant results of Keller et al. (2009), this is much of a surprise.
Among the conscription variables, the share of conscripts to the labor force is one of the
47
particular interests in this thesis. According to the computational general equilibrium by Lau
et al. (2004), the larger this share is, the more it depresses the income level from its steady
state level. In my income panel results, this variable is estimated to be negative and
significant only without fixed effects. One needs to note that, in the work of Lau et al. (2004),
supplementary tax rates are part of the determinants of the equilibrium outcomes. In my
simple regression models, tax rates are not included.
Another conscription variable of special interest in this thesis is the share of conscripts to
the armed force personnel. The larger this share is, the more negative effects it should have on
economic performance according to the mainstream economic theory on conscription. This
variable is supposed to measure directly the dyad of conscripts-all volunteer force. In my
results, this variable is only estimated to be negative and significant without inflation and
fixed effects. When fixed effects are added, its coefficient become positive and significant
(for both income and growth regressions).
The expected negative effects, due to ignorance of comparative advantage among
conscripts and the accompanying opportunity costs, vanish when country and year fixed
effects are added. This is difficult to explain, yet I summarize possible explanations and ideas
for future research:
1. Time Horizon. Given the relative young movement of abolishment of conscription in
Europe, which starts in 1990, it is likely that two decades are not enough to reflect the true
effects of the intensity of conscription, i.e., the share of conscripts to the armed force and to
the labor force, and the length of compulsory military service.
2. Space Horizon. Although the political disputes of conscription occur mainly in OECD
countries, the relationship between conscription and economic performance is also interesting
for developing countries and rest of the world. A wider sample can shed more light on the
subject.
3. Omitted Variable Bias:
i.) Alternative service is argued to depress economic performance in the same way as
compulsory military service. There is no time-series data of the intensity and length of
alternative service, therefore the conscription dummy variable may capture some of the
effects from alternative service, which might be more valuable to society as mainstream
economic theory predicts.

48
ii.) Taxation. To finance an all-volunteer armed force, government needs to rely on more
taxation than relying on military conscription. The allocative aspect of taxation may be
influencing the economic effects of conscription. Poutvaara and Wagener (2005) argues that
the abolishment of military conscription may bring Pareto-improvement to the society if
generation-specific tax can be enforced, more specifically, on the young generations, however
this is rather infeasible. They also show that the introduction of conscription benefits the older
generations while harming the younger and future generations, and abolishment of
conscription without generation-specific taxation would not necessary mean Pareto
improvement for the society. These inter-generational aspects of Pareto efficiency may help to
explain the unexpected signs of conscription variables in my results.
3. Specification of regression models. Perhaps the relationship between the conscription
variables and economic performance may be non-linear, just as defense spending is argued to
be non-linear to economic growth by Hooker (1997), Heo (1998), and Heckelman (2001). For
future research, quadratic relationships, for example, should be considered. It could be that
conscription is beneficial to economic performance to a certain degree, with some turning
point percentage which measures the intensity of conscription, such as the share of population
serving in the compulsory service to the labor force or armed personnel.
4. Difficulty to separate other determining effects. For example, the advent of internet, the
fall of communism, the rise of military adventurism, the development in military technology,
etc. The new landscape for the military sector can be determinant in the relationship between
conscription and economic performance as well.
To conclude, examining panel data from 21 OECD countries, conscription does not have
robust negative effects on economic performance, when fixed effects are added. The
mainstream economic theory that favours an all-volunteer force due to ignorance of
comparative advantage and increased opportunity costs cannot find full empirical support
from my estimates. The effects of military conscription on economic performance still need to
be further investigated.

49
Reference
Anderson, G.M., Halcoussis, D. and Tollison, R.D. (1996) Drafting the competition: labor
unions and military conscription.!"#$#%&#!'%(!)#'*#!+*,%,-.*& 7 189!202.
Angrist, J.D. (1990) Lifetime earnings and the Vietnam era draft lottery: evidence from social
security administration records.!/-#0.*'%!+*,%,-.*!1#2.#3 80 313!335.
Angrist, J. D., & Krueger, A. B. (1991) Does compulsory school attendance affect schooling
and earnings? 45#!67'08#09:!;,70%'9!,$!+*,%,-.*&, <=>(4), 979-1014.
Barro, R. (1996) Inflation and growth. ;,70%'9!,$!?,%#:@!A0#(.8!'%(!B'%C.%D, EF(3), 153-
169. Retrieved from
http://citeseerx.ist.psu.edu/viewdoc/download?doi=10.1.1.197.5261&rep=rep1&am
p;type=pdf
Bauer, T., Bender, S., & Paloyo, A. (2011) Do guns displace books? The impact of
compulsory military service on educational attainment. 1750!+*,%,-.*!)'G#0 (260).
Retrieved from http://papers.ssrn.com/sol3/papers.cfm?abstract_id=1856478
Bauer, T., Bender, S., & Paloyo, A. (2012). Evaluating the labor-market effects of
compulsory military service. +70,G#'%!+*,%,-.*!1#2.#3, H>(4), 814-829. Retrieved
from http://www.sciencedirect.com/science/article/pii/S0014292112000207
Benhabib, J. (1994) The role of human capital in economic development evidence from
aggregate cross-country data. ;,70%'9!,$!?,%#8'0:!+*,%,-.*&, !", 143-173. Retrieved
from http://www.sciencedirect.com/science/article/pii/0304393294900477
Bernanke, B.S. and Gürkaynak, R.S. (2001) Is growth exogenous? Taking Mankiw, Romer,
and Weil seriously. IB+1!?'*0,#*,%,-.*&!/%%7'9 16 11!57.
Card, D., Deaton, A., Griliches, Z., Grossman, G., Katz, L., Persson, T., Storesletten, K., et al.
(2001) Education for growth: why and for whom? ;,70%'9!,$!+*,%,-.*!J.8#0'870#,
KKKLK(December), 1101-1136.
Choi, S.-W., & James, P. (2003) No professional soldiers, no militarized interstate disputes?
A new question for Neo-Kantianism. ;,70%'9!,$!A,%$9.*8!1#&,978.,%, ME(6), 796-816.
doi:10.1177/0022002703258803
Crespo-Cuaresma, J. and Reitschuler, G. (2003) A non-linear defence-growth nexus?
Evidence from the US economy.!"#$#%*#!'%(!)#'*#!+*,%,-.*& 15 71!82.
Deger, S. and Sen, S. (1995) Military expenditures and developing countries. In!N'%(O,,C!,$!
"#$#%&#!+*,%,-.*&@ Vol. 1, edited by K. Hartley and T. Sandler. Amsterdam: Elsevier,
275!307.
Dunne, J.P., Smith, R.P. and Willenbockel, D. (2005) Models of military expenditure and
growth: a critical review. "#$#%*#!'%(!)#'*#!+*,%,-.*& 16 449!461.
Fisher, A.C. (1969) The cost of the draft and the cost of ending the draft.!/-#0.*'%!+*,%,-.*!
1#2.#3 59 239!254.
Fountas, S., Karanasos, M., & Kimà, J. (2006) Inflation uncertainty, output growth:
Uncertainty and macroeconomic performance. PQ$,0(!B799#8.%!,$!+*,%,-.*&!'%(!
R8'8.&8.*&, !(68), 319-343.
Frederiksen, P., & Looney, R. E. (1983) Defense expenditures and economic growth in
developing countries. /0-#(!S,0*#&!'%(!R,*.#8:, #, 633-45. Retrieved from
http://relooney.fatcow.com/RelPcfAFS83.pdf
Galiani, S.,M.A. Rossi and E. Schargrodsky (2011) Conscription and crime: Evidence from
the Argentine draft lottery. /-#0.*'%!+*,%,-.*!;,70%'9T!/GG9.#(!+*,%,-.*& 3, 119!36
Haltiner, K.W. (2003) The decline of the European mass armies. In!N'%(O,,C!,$!85#!
R,*.,9,D:!,$!85#!?.9.8'0:@ edited by G. Caforio. New York: Kluwer Academic/Plenum
Publishers, 361!384.
Hansen, W.L. and Weisbrod, B.A. (1967) Economics of the military draft.!67'08#09:!;,70%'9!

50
,$!+*,%,-.*& 81 395!421.
Heo, U. (1998) Modeling the defense-growth relationship around the globe.!;,70%'9!,$!
A,%$9.*8!1#&,978.,% 47 637!657.
Hooker, M.A. and Knetter, M.M. (1997) The effect of military spending on economic
activity: Evidence from state procurement spending.!;,70%'9!,$!?,%#:@!A0#(.8@!'%(!
B'%C.%D 29 400!421.
Imbens, G., & Klaauw, W. van der. (1995). Evaluating the cost of conscription in the
Netherlands. ;,70%'9!,$!B7&.%#&&!U!+*,%,-.*!R8'8.&8.*&, $!(2), 207-215.
Islam, N. (1995) Growth empirics: a panel data approach.!67'08#09:!;,70%'9!,$!+*,%,-.*&
110 1127!1170.
Kerstens, K. and Meyermans, E. (1993) The draft versus an all-volunteer force: issues of
efficiency and equity in the Belgian draft.!"#$#%*#!+*,%,-.*& 4 271!284.
Keller, K., Poutvaara, P., & Wagener, A. (2009) Military draft and economic growth in
OECD countries. "#$#%*#!'%(!)#'*#!+*,%,-.*&, %&(5), 373-393.
doi:10.1080/10242690802332994
Keller, K., P. Poutvaara and A. Wagener (2010) Does military draft discourage enrollment in
"#$%&'()*+,-.#/01()2#*&0,&(3'/4(5)67(6/+0.'#&89:(;#0-0<-',%#2(==:(>?!120.
Khan, M. S., & Senhadji, A. S. (2001) Threshhold effects in the relationship between inflation
and growth. L?S!R8'$$!)'G#0&, "'(1), 1-21.
Kiker, B.F. (1969) Von Thünen On human capital.!PQ$,0(!+*,%,-.*!)'G#0& 21 339!343.
Knight, M., Loayza, N. and Villanueva, D. (1996) The peace dividend: military spending cuts
and economic growth. L?S!R8'$$!)'G#0& 43 1!37.
Kunze, A. (2002) The timing of careers and human capital depreciation. LV/!".&*7&&.,%!
)'G#0!No. 509. Bonn: Institute for the Study of Labor.
Lau, M.I., Poutvaara, P. and Wagener, A. (2004) Dynamic costs of the draft.!W#0-'%!
+*,%,-.*!1#2.#3 5 381!406.
Lee, D.R. and McKenzie, R.B. (1992) Reexamination of the relative efficiency of the draft
and the all-volunteer army. R,785#0%!+*,%,-.*!;,70%'9 59 646!654.
Lutz, D.S. (1996) Ist eine Freiwilligen-Streitkraft billiger? (Are all-volunteer forces cheaper?)
In!N'-O70D#0!B#.80XD# Y70!S0.#(#%&$,0&*57%D!7%(!R.*5#05#.8&G,9.8.C@ edited by J.
Gross and D.S. Lutz. Hamburg, 39!54.
Mankiw, N.G., Romer, D. and Weil, D.N. (1992) A contribution to the empirics of economic
growth.!67'08#09: ;,70%'9!,$!+*,%,-.*& 107 407!437.
Mulligan, C. and Shleifer, A. (2005) Conscription as regulation.!/-#0.*'%!J'3!'%(!
+*,%,-.*&!1#2.#3 7 85!111.
Ng, Y .-kwang. (2008) Why is the military draft common? Conscription and increasing
returns. /%%'9&!,$!+*,%,-.*&!'%(!S.%'%*#, !'", 373-384.
Nonneman, W. and Vanhoudt, P. (1996) A further augmentation of the Solow model and the
empirics of economic growth for OECD countries.!67'08#09:!;,70%'9!,$!+*,%,-.*& 111
943!953.
Oi, W. Y . (1967) The economic cost of the draft. 45#!/-#0.*'%!+*,%,-.*!1#2.#3, ()(2), 39-
62.
Pfaffenzeller, S. (2009) Conscription and democracy: The mythology of civil- military
relations. /0-#(!S,0*#&!U!R,*.#8:, Z>(3), 481-504. doi:10.1177/0095327X09351226
Poutvaara, P. (2007) To draft or not to draft? Inefficiency, generational incidence, and
political economy of military conscription. +70,G#'%!;,70%'9!,$!),9.8.*'9!+*,%,-:, [Z,
975-87. Retrieved from
http://www.sciencedirect.com/science/article/pii/S0176268007000262

51
Poutvaara, P. (2009) The political economy of conscription. A#R.SP!\,0C.%D!)'G#0!I,]!
[F[<. Retrieved from http://papers.ssrn.com/sol3/papers.cfm?abstract_id=1491419
Poutvaara, P., & Wagener, A. (2011) +%(.%D!-.9.8'0:!*,%&*0.G8.,%. A#&.$,!".*#!1#G,08 36-43.
Poutvaara, P. and Wagener, A. (2007) Conscription: economic costs and political allure.!
+*,%,-.*&!,$!)#'*#!'%( R#*70.8:!;,70%'9 2 6!15.
Ram, R. (1995) Defense expenditure and economic growth. In!N'%(O,,C!,$!"#$#%&#!
+*,%,-.*&@ Vol. 1, edited by K. Hartley and T. Sandler. Amsterdam: Elsevier, 251!273.
Reenen, J. V., & Sianesi, B. (2003) A review of the empirical macro-economic literature.
;,70%'9!,$!+*,%,-.*!R702#:&, $)(2), 157-200.
Segal, D. R., & Se$-@:(AB(CB(DEFFGH(I4&'#,-Js military population. ),G79'8.,%!1#$#0#%*#!
B70#'7, (#(4), 1-40.
Smith, A. (1976 [1776])!/%!L%^7.0:!.%8,!85#!I'870#!'%(!A'7&#&!,$!85#!\#'985!,$!I'8.,%&]
Oxford: Clarendon Press. Spencer, D.L. and Woroniak, A. (1969) Valuing transfer of
military-acquired skills to civilian employment.!_:C9,& 22 467!492.
Spencer, Daniel L. and Alexander Woroniak (1969) Valuing transfer of military- acquired
skills to civilian employment. Kyklos 22(3): 467!492.
Stroup, M.D. and Heckelman, J.C. (2001) Size of the military sector and economic growth: a
panel data analysis of Africa and Latin America.!;,70%'9!,$!/GG9.#(!+*,%,-.*& 4 329!
360.
Venniker, R. (2000) Social returns to education: a survey of recent literature on human capital
externalities. A)B!I#85#09'%(&!B70#'7!$,0!+*,%,-.*!),9.*:, 47-50. Retrieved from
http://www.tilburguniversity.edu/research/institutes-and-research-
groups/center/staff/smulders/gtlit/vennik00.pdf
Warner, J.T. and Asch, B.J. (1995) The economics of military manpower. N'%(O,,C!,$!
"#$#%&#!+*,%,-.*&@ 1, edited by K. Hartley and T. Sandler. Amsterdam: Elsevier, 348!
398.
Warner, J.T. and Asch, B.J. (1996) The economic theory of a draft reconsidered.!"#$#%&#!'%(!
)#'*#!+*,%,-.*& 7 297!315.
Warner, J.T. and Asch, B.J. (2001) The record and prospects of the all-volunteer military in
the United States.!;,70%'9 ,$!+*,%,-.*!)#0&G#*8.2#& 15 169!192.
Warner, J.T. and Negrusa, S. (2005) Evasion costs and the theory of conscription.!"#$#%&#!
'%(!)#'*#!+*,%,-.*& 16 83!100.
Williams, C., & Gilroy, C. (2006) The transformation of personnel policies. "#$#%&#!R87(.#&,
>(1), 97-121. doi:10.1080/14702430600838586
Data Source Variables Data Source Version Conscription Dummy, Length of Conscription, Number of Conscripts
Military Balance from IISS (The International Institute for Strategic Studies)
1960-2011
Education-average years of secondary schooling in total population
Barro & Lee 2010
Conflict UCDP (Upssala Conflict Data Program) and PRIO (Peace Research Institute, Oslo)
2011
Other Non Military-Variables
WDI (World Development Index) of World Bank
2010

52
Abstract
Mainstream economic theory predicts that military conscription is associated with
static inefficiencies and dynamic distortions of the accumulations of human and
physical capital, relative to an all-volunteer force recruitment system.
To examine the effect of conscription on economic performance, panel data from 21
OECD countries is used. Surprisingly, the estimates do not always indicate negative
influence of military conscription on economic performance, especially when fixed
effects are accounted for.
53
K urzfassung Die klassische ökonomische Theorie besagt, dass im Vergleich zu einer Freiwilligenarmee
eine Wehrpflicht sowohl mit statischer Ineffizienz als auch dynamischer Verzerrung der
Human-, und Sachkapitalakkumulation assoziiert sei.
Anhand von Paneldaten aus 21-OECD Staaten wird der Einfluss des Wehrdiensts auf die
Wirtschaftsleistung geprüft. Überraschenderweise entsprechen die geschätzten Koeffizienten
nicht immer dem negativen Einfluss des Wehrdiensts auf die Wirtschaftsleistung, den
klassische Theorien prognostizieren, insbesondere dann, wenn Fixed Effects kontrolliert
werden.

54
Curriculum Vitae
General Information Name: Chen Hsien Lin Sex: male Date of Birth: March 22nd, 1985 Place of Birth: Taipei, Taiwan (Republic of China) Citizenship: Taiwan (Republic of China) Marital Status: Single Languages: Chinese, English, German
Contact Info Address: Quellenstraße 131/17, Vienna 1100, Austria E-mail: [email protected] Mobile: (+43) 650 546 9484 Education 2000-2003 Chien-Kuo Municipal Junior High School, Taipei 2003 Training Program in Teaching the Chinese Language, Word Chinese Language Association, Taipei 2003-2004 Deutschkurs, Wiener Internationale Hochschulkurse, University of Vienna Certificates Toefl 247, 2002 Chinese Teaching Certificate, 2003 Fortgeschrittene 2, Perfektionsniveau in Deutsch, Wiener Internationale Hochschulkurse, 2004 Ergänzungsprüfungen aus Mathe, Sozialkunde und Englisch, Universität Wien Juli 2004
!