
Mikko Järveläinen HOW FINANCIAL FACTORS …jultika.oulu.fi/files/nbnfioulu-201711293206.pdf ·...
91
OULU BUSINESS SCHOOL Mikko Järveläinen HOW FINANCIAL FACTORS INFLUENCE GROWTH OF A FIRM: EXAMINATION ON COMPANIES FROM FINLAND Master’s Thesis Department of Management and International Business November 2017
Transcript of Mikko Järveläinen HOW FINANCIAL FACTORS …jultika.oulu.fi/files/nbnfioulu-201711293206.pdf ·...

OULU BUSINESS SCHOOL
Mikko Järveläinen
HOW FINANCIAL FACTORS INFLUENCE GROWTH OF A FIRM: EXAMINATION ON
COMPANIES FROM FINLAND
Master’s Thesis
Department of Management and International Business
November 2017

2
UNIVERSITY OF OULU ABSTRACT OF THE MASTER'S THESIS
Oulu Business School
Unit
Management and International Business Author
Mikko Järveläinen Supervisor
Hurmelinna-Laukkanen, P., Professor Title
How financial ratios influence growth of a firm: examination on companies from Finland Subject
International Business Type of the degree
Master’s degree Time of publication
November 2017 Number of pages
91 Abstract
This thesis looks at impact that financial factors have on growth of a company and how financial
factors can be used as a tool in growth management. The purpose is to empirically analyze the
influence of investments, equity ratio and gearing on growth of a firm. Furthermore, the aim is to
find out whether these three variables have a relation with the growth of medium-sized Finnish
companies.
The study begins with a literature review where the concepts of investments, equity ratio and
gearing are researched from the perspective of influencing growth. Based on existing literature
about the three variables hypothesizes are formed for statistical testing. Consequently, the literature
review forms a foundation for the empirical part of the thesis. The research method used in this
study is quantitative and the data for the regression analysis has been gathered from certain
company listings published in Talouselämä-magazine, implicating that this study uses secondary
data as a data collection technique. Microsoft Excel and StatsModel softwares have been utilized to
runt the statistical analysis of the study and to determine the relation between the studied variables
and growth.
As Finnish medium-sized companies have lacked growth in recent years, it is evident that ways to
find root causes for slow growth, have gained attention. In this sense, this thesis is also continuity
for the search of how companies can grow faster. The findings and results of the study provide
clear implications how investments, equity ratio and gearing impact on growth of a company.
Coherent with existing academic literature, the results of the thesis support the perception that
there is a statistically significant relation between investments and growth, as well as, between
equity ratio and growth. On the contrary, the findings indicate that there is not a statistically
significant relation between gearing and growth of a company. Additionally, it can be concluded
that investments have the most significant relation on growth. Suggesting that a firm should
prioritize investments over equity ratio when looking for ways to grow company faster.
The main purpose of this Master’s thesis is not to produce one size fits all suggestions for growing
company faster. Theoretical part focusing on growth management with financial indicators is
constructed with the aim to bring management perspective to the thesis and to produce reflections
on how readers own organization is currently viewing usage of financial metrics data. Similarly,
literature review and empirical study on relation of the three financial factors and growth cannot be
generalized very well because of a rather small population used in the analysis, which in addition
includes only companies from one country.
Keywords
Financial factors, Investments, Equity ratio, Gearing, Company growth, Growth Management
Additional information

3
CONTENTS
Table of Contents
Figures and Tables
Table of Contents 1 INTRODUCTION............................................................................................... 6
1.1 Introduction to the topic ............................................................................ 6
1.2 The objective of the study ........................................................................ 10
1.3 Research questions and objectives .......................................................... 12
1.4 Research methods ..................................................................................... 13
1.5 Structure of the thesis .............................................................................. 13
2 COMPANY GROWTH AND FINANCIAL FACTORS .............................. 16
2.1 Growth and investments .......................................................................... 16
2.1.1 Literature review ............................................................................. 16
2.1.2 Summary and hypothesis formation ............................................... 20
2.2 Growth and equity ratio .......................................................................... 21
2.2.1 Literature review ............................................................................. 21
2.2.2 Summary and hypothesis formation ............................................... 24
2.3 Growth and gearing ................................................................................. 24
2.3.1 Literature review ............................................................................. 24
2.3.2 Summary and hypothesis formation ............................................... 26
3 HOW FINANCIAL FACTORS CAN HELP IN MANAGING GROWTH?
............................................................................................................................. 27
3.1 Defining financial indicators ................................................................... 27
3.2 Managing growth with financial indicators ........................................... 29
4 EMPIRICAL EXAMINATION ...................................................................... 36
4.1 Research methods ..................................................................................... 36
4.2 Data collection .......................................................................................... 37
4.2.1 Theoretical data ............................................................................... 37

4
4.2.2 Empirical data ................................................................................. 38
4.2.3 Talouselämä 500+ –listing .............................................................. 39
4.2.4 Description of the companies included in the empirical study ....... 40
4.3 Data analysis ............................................................................................. 41
5 EMPIRICAL FINDINGS ................................................................................. 43
5.1 Relation of investments and growth ....................................................... 43
5.2 Relation of equity ratio and growth ....................................................... 46
5.3 Relation of gearing and growth .............................................................. 48
5.4 Multivariable regression .......................................................................... 51
5.5 Further look on the importance of financial factors ............................. 53
5.5.1 Investments in top and bottom performing companies ................... 55
5.5.2 Equity ratio in top and bottom performing companies ................... 56
5.5.3 Gearing in top and bottom performing companies ......................... 58
6 DISCUSSION .................................................................................................... 61
6.1 Investments and growth .......................................................................... 61
6.2 Equity ratio and growth .......................................................................... 63
6.3 Growth and gearing ................................................................................. 65
7 CONCLUSION ................................................................................................. 68
7.1 Main findings of the study ....................................................................... 68
7.2 Implications for research and practice .................................................. 71
7.3 Validity and reliability of the study ........................................................ 73
7.4 Limitations of the study ........................................................................... 74
7.5 Suggestions for future research .............................................................. 75
REFERENCES ......................................................................................................... 77

5
APPENDICES
Appendix 1. List of companies forming the empirical dataset.
Appendix 2. Summary of single variable regression statistics: investments on growth
Appendix 3. Summary of single variable regression statistics: equity on and growth
Appendix 4. Summary of single variable regression statistics: gearing on growth
FIGURES
Figure 1: GDP of Finland and selected comparison countries ...................................7
Figure 2: Employment changes in Finland between 2001-2012 ................................9
Figure 3: Role of financial indicators in the improvement of company’s
performance................................................................................................................30
Figure 4: regression analysis of investments on growth.............................................45
Figure 5: regression analysis of equity ratio on growth..............................................47
Figure 6: regression analysis of gearing on growth....................................................50
Figure 7: median revenue of top 20 and bottom 20 companies..................................54
Figure 8: median investments per revenue of top 20 and bottom 20 companies.......56
Figure 9: median equity ratio of top 20 and bottom 20 companies............................57
Figure 10: median gearing of top 20 and bottom 20 companies................................59
TABLES
Table 1: single variable regression of investments on growth...................................44
Table 2: single variable regression of equity ratio on growth....................................46
Table 3: single variable regression of gearing on growth..........................................49
Table 4: multivariable regression of investments, equity ratio and gearing on
growth........................................................................................................................52

6
1 INTRODUCTION
The first chapter of this study gives the reader an overview on the subject that has
been researched in this study. After a short introduction to the topic, chapter moves
on by presenting the significance, purpose and objectives of this study. Following
this discussion, research questions and problem are introduced. Furthermore,
research methods are presented briefly in order to give the reader a abbreviation on
what kind of academic research methods have been chosen for this study. Finally,
introduction chapter is concluded by presenting structure of the thesis, so that the
reader can get a comprehensive picture about the research paper, before the study
moves on to the theoretical part.
1.1 Introduction to the topic
Finland has been the success story of 1900s. A country that is celebrating its 100
years of independence in 2017 was one of the poorest countries in Europe at the turn
of 1900s, and the poorest country in the Nordics by far. After the world wars the
country began its phenomenal journey to be one of the leading countries in the world,
for instance in such areas as education, civil rights, freedom of press, economic
wealth and so on. However, economically the first two decades of the following
century have not been such a success story anymore.
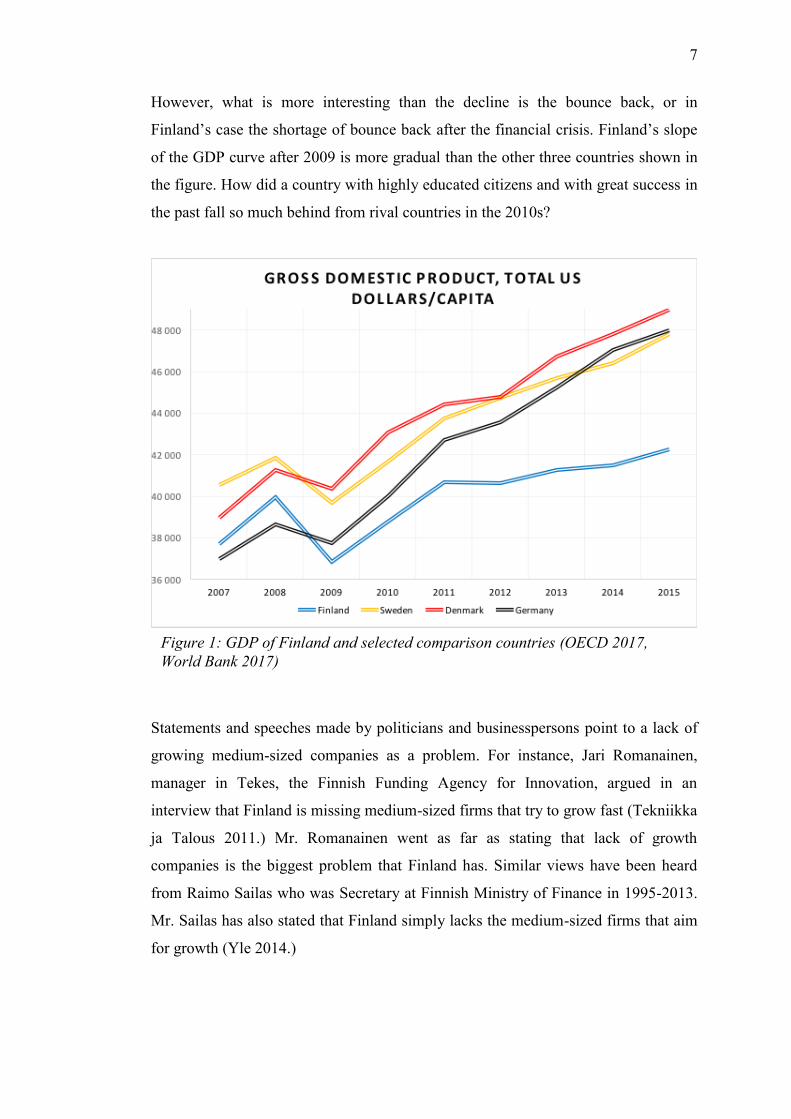
Finland has been in economic turmoil ever since the financial crisis of 2007-2008.
Figure 1 on the next page shows GDP development of Finland, Sweden, Denmark
and Germany. These three are selected to the comparison, based on, being the most
important rival countries to Finland, as mentioned, for instance, by Juha Sipilä, the
acting Prime Minister of Finland (Yle 2015.) Norway is excluded from the
comparison because of the unique economic structure of the country. Gross domestic
product is presented in the United States dollar, which is commonly used currency in
GDP comparisons and calculated in per capita basis (World Bank 2017.) As can be
clearly interpreted from the figure 1, Finland has fallen behind of the comparison
group especially after 2011. All the four countries had significant decreases in GDP
per capita when the financial crisis happened, although, Finland’s decrease was more
severe than that of other countries.
7
However, what is more interesting than the decline is the bounce back, or in
Finland’s case the shortage of bounce back after the financial crisis. Finland’s slope
of the GDP curve after 2009 is more gradual than the other three countries shown in
the figure. How did a country with highly educated citizens and with great success in
the past fall so much behind from rival countries in the 2010s?
Statements and speeches made by politicians and businesspersons point to a lack of
growing medium-sized companies as a problem. For instance, Jari Romanainen,
manager in Tekes, the Finnish Funding Agency for Innovation, argued in an
interview that Finland is missing medium-sized firms that try to grow fast (Tekniikka
ja Talous 2011.) Mr. Romanainen went as far as stating that lack of growth
companies is the biggest problem that Finland has. Similar views have been heard
from Raimo Sailas who was Secretary at Finnish Ministry of Finance in 1995-2013.
Mr. Sailas has also stated that Finland simply lacks the medium-sized firms that aim
for growth (Yle 2014.)
Figure 1: GDP of Finland and selected comparison countries (OECD 2017,
World Bank 2017)

8
As a matter of fact, lack of medium-sized growth firms in Finland seems to be a
problem so big that separate organization, which aims to support growth of medium-
sized firms, has been founded. Kasvuryhmä (Growth Collective Finland) defines
itself as a “movement bringing together Finnish mid-sized companies in the pursuit
of growth” and it has notable persons, such as, Matti Alahuhta, Mika Anttonen and
Bengt Holmström taking part in the organizations operations (Kasvuryhmä 2017.)
Ilkka Kivimäki, Chairman of the Board of Kasvuryhmä, has argued in line with the
findings presented by academic community by stating that medium-sized growth
firms are backbone of the Finnish economy and a key for revival of the economy
(Teknologiateollisuus ry 2016.)
As mentioned previously, academic field seems to be almost unanimous about the
importance of medium-sized firms for the economy. Two different major argument
lines can be identified from previous research (Deakins & Freel 1998, Holmlund &
Kock 1998, Beck & Demirguc-Kunt & Levine, 2005.) First one is the wider social
and economic benefits for the society. Foremost this means higher employment and
economic growth. Consensus from a wide body of academic research, made in
different countries around the world, is that SMEs provide major amount of all the
jobs (see e.g. Birch 1979, Holmlund & Kock 1998, Kongolo 2010, Vronhoof et al.
2011, Robu 2013, Maunu & Räsänen 2016.) Besides academic publications, the
OECD have also studied SMEs impact on job creation. The OECD Observer
magazine (2003) did a study on vast literature and concludes that small and medium-
sized enterprises compose two thirds of the newly created jobs. Similarly, non-
academic data is also available from Finland. Statistics Finland, a government
supported organization, composes and publishes different datasets regularly. Figure 2
on the following page shows total net changes in employment during 2001-2012. As
we see, a major share of employment opportunities has been provided by SMEs.
Share of the medium-sized firms from the total was 22 percentages. This is a finding
specifically from the context country of this thesis, and is in line with the previous
academic literature.

9
Second major line of argumentation in favor of SMEs is higher innovation and
productivity. Acs & Audretsch (1987) examined companies in the United States and
they conclude their findings stating that small enterprises have higher innovation
rates, at least, in the context of high technology industries and countries. They
continue by arguing that, vice versa, large companies have the innovative advantage
in lower technology countries. As Finland is high-technology country, we can draw
the line that Acs’s & Audretsch’s (1987) conclusion regarding SMEs higher
innovation rate in the context of developed country, which the United States is also,
is what is the most important notification for this study. From more general
perspective, many previous studies argue that SMEs provide innovation boost in the
economy. Among the academics, it is viewed that competition provided by SMEs
enables higher innovation and productivity (Kongolo 2010s.) Savlovschi & Robu
(2011) make the argument that medium-sized firms are the inventors of new ideas
and new processes. They go-on by stating that SMEs have also important role in
creating ways for more effective use of resources by looking continuously for new
ways of doing things (World Bank 2001, Kongolo 2010).
Before moving on, a short conclusion from the previous chapters is in order. A large
body of academic literature argues that medium-sized companies form the backbone
93%
7%
Net changes in employment 2001-2012
SME enterprises Large enterprises
Figure 2: employment changes in Finland between 2001-2012
(Statistics Finland 2013)

10
of economy and provide significant benefits, such as, provide economic growth,
innovations and development, and have a wider social role by employing people. The
most important and recent research from Finland is by Ali-Yrkkö and Rouvinen
(2015). They state that medium-sized are critical piece of Finland’s growth. Medium-
sized firms are already big enough that their growth would have substantial effects
both locally in city level but also country wide. Ali-Yrkkö and Rouvinen continue by
arguing that middle sized firms also have a benefit by not having size of large firms,
which could at some point be a burden if local labor market cannot supply enough
employees (Ali-Yrkkö & Rouvinen, 2015.) Furthermore, it was recognized that it is
widely accepted fact that Finland lacks growing medium-sized companies. From here
the conclusion is rather straight forward. A research studying how medium-sized
Finnish companies can be grown, or what affects the growth of these companies, is
highly beneficial. This need for this type of study is also what forms the core
motivation for the author of this study.
1.2 The objective of the study
As discussed above in the introduction, Finland lacks growth among medium-sized
firms. This observation forms the broader objective of the thesis to explain how
companies can enhance growth by utilizing knowledge relating to different financial
ratios. Financial ratios are chosen as an examined viewpoint because there is wide
body of academic literature available and also because of the author’s personal
motivation for finance and accounting.
The studied financial factors are investments, equity ratio, and gearing. These
financial factors have been chosen because of multiple different reasons. First and
foremost, investments have been identified to be one of the most important factors
having impact on growth of a firm, while the two other factors lack academic
research in the same extent (Liu & Hsu 2006, Coad & Rao 2010, Hall & Lerner
2010, Yujun et al. 2011, Capasso & Treibich & Verspagen 2015.) Naturally, this
gives motivation to study relation of equity ratio and gearing on growth. Secondly,
these three financial factors are figures that can be found from companies’ official
financial statements, which are mandatory in Finland for all the medium-sized firms.
The information is collected by Finnish Patent and Registration Office, which is a

11
government organization and works under the administrative branch of the Ministry
of Economic Affairs and Employment.
At first the thesis we will look at what previous academic research argues about
relationship of growth and three chosen financial factors. This will form a foundation
for the literature review of the study. Furthermore, based on the literature review,
hypothesizes are formed and tested with statistical methods and Finland based data in
the empirical section of the thesis. Having formed and tested the hypothesizes the
objective is to create an answer whether the three financial factors have an impact on
growth of a company. Moreover, it is especially in the interest of the study to look at
what are the practical implications from the empirical part, i.e. could this newly
acquired information be used to accelerate growth.
Company growth and its relationship between all the three financial factors,
investments, equity ratio, and gearing has been studied a significant amount (Myers
1977, Kim & Sorensen 1986, Liu & Hsu 2006, Petrunia 2007, Hall & Lerner 2010,
Yujun et al. 2011, García-Manjón & Romero-Merino 2012, Kiani et al. 2012,
Capasso & Treibich & Verspagen 2015.) This is particularly true in the case of
investments, which is an area so widely studied that it has been adopted as part of
political debate when politicians are offering solutions for slow growth (Yle 2015.)
In a time where many Finnish companies seem to struggle to grow, and whole
Finnish economy for that matter, there are firms that have achieved notable growth
figures after the financial crisis. Naturally, in time of problems the lack of
investments, or other potential root causes for slow growth, has gained attention. In
this sense, this thesis is also continuity for the search of how companies can grow
faster.
The main purpose of this Master’s thesis is not to produce general ‘one size fits all’
instructions on how a company will grow faster. Theoretical part titled ‘how
financial indicators can help in managing growth’ is constructed with the aim to
bring management perspective to the thesis and to produce reflections on how
readers own organization is currently viewing usage of financial metrics data.
Similarly, literature review and empirical study on relation of the three financial
factors and growth cannot be generalized very well with a rather small dataset, which

12
includes companies only from one country. Nevertheless, evidence from the analysis
and implications drawn, based on the findings, give an opportunity to see whether
investments, equity ratio, and gearing have similar impact to growth of medium-
sized Finnish companies as they have been found to have globally. Finally, the thesis
gives suggestions for future research on the field.
1.3 Research questions and objectives
The objective of this study is to reach an understanding on the current state of
knowledge related to what kind of impact investments, equity ratio and gearing have
on growth of medium-sized companies in Finland. Furthermore, theoretical part also
reviews literature on the topic of using financial indicators as a tool for managing
growth. In order to reach these objectives, a review on the literature and empirical
study will be conducted.
The main research questions for this study are:
RQ1: What is the influence of investments, equity and gearing on growth of a
company?
RQ2: What identifiable differences there are in selected financial indicators
between growing and shrinking companies?
Additionally, one supporting research question was formed to look on managerial
implications of growth. Supporting research question for this study is:
SQ1: How financial figures can be used to help in managing growing
company?
The thesis will initially cover usage of financial indicators from the point view of
management. However, the focus in the study is kept more on relation between
growth, investments, equity ratio and gearing. Besides extensive literature review,
the main research questions will be answered first by creating hypothesizes based on
previous research and afterwards testing these hypothesizes in the empirical study.

13
1.4 Research methods
In the thesis, the presented theoretical discussion is based on academic literature. All
the previous academic works used as source are peer reviewed studies. This literature
review also creates the basis for the empirical analysis of the study.
As presented briefly above in earlier sub-chapters, this thesis will look at how
medium-sized Finnish companies could grow faster. More specifically put, it will
study what kind of relationship is between investments, equity ratio, gearing and
growth of a firm. Furthermore, by utilizing statistical methods the study analyses
whether one variable is a predictor of company’s’ growth. To clarify, in the context
of the thesis growth of a company is measured as growth in revenue, which is widely
accepted figure to measure growth (Pasanen 2007).
Usage of statistical methods already implies that the methodology in the empirical
part of this study is quantitative. Additionally, secondary data has been used as data
collection technique. Secondary data suits well the purposes of this study because it
would have been impossible, within the time limits, to collect such a big amount of
data, for example through companies’ annual reports. Further discussion on
advantages and disadvantages of both quantitative research method and secondary
data is presented in chapter 4. The required secondary data has been collected mainly
from Talouselämä 500+ –listings (also known as Talouselämä Haastajat-listaus in
the original language in Finnish), which are produced by Talouselämä magazine.
Along with Talouselämä listings various company specific data has been validated
from Voitto+ database. Voitto+ is the most extensive financial statements database in
Finland and it contains financial statements data and key ratios for 90 000
companies. Voitto+ is produced and made by Suomen Asiakastieto Oy. For this
study, the database has been used through University of Oulu’s common database
license, which is available for all the students of the University.
1.5 Structure of the thesis
In the following chapters this study will try to answer the research questions. There
are three main parts included in the thesis. The first one is the literature review where

14
the three financial factors and their relation to growth is studied in chapter 2, as well
as, how leaders can use financial indicators as a tool in chapter 3. Second part is the
empirical part presenting research method and data collection techniques in chapter
4, analysis and presentation of the findings from the empirical study in chapter 5.
Finally, the third part includes discussion reflecting theoretical and empirical
findings in chapter 6, as well as, the final chapter 7 that presents the conclusions,
main findings, practical implications, and finally suggestions for future areas of
research.
The first chapter presents for the reader both an introduction and an overview on the
background of this study. It consists of description of research objectives and
purpose as well as research questions. Finally, the chapter closes with a brief prelude
of research methods used in the study before moving on to this very part presenting
structure of the thesis.
Second chapter presents the current state of knowledge relating to the impact that
investments, equity ratio, and gearing have on firms’ growth. It explains and
describes what previous academic studies have shown the relationship to be between
growth and the three financial factors. Additionally, examples and statistical analysis
results from previous empirical studies, from multiple different countries, are
presented. These previous academic findings, and whole second chapter for that
matter, act as foundation for the hypothesizes that are formed and tested in the
empirical part.
Moving on to the chapter three, which defines key concepts relating to financial
indicators and more generally speaking to measuring different things in an
organization. It also describes how management and people in leadership roles can
use financial indicators in growth management. Furthermore, chapter presents a nine-
step process how financial metrics data flows through the organization and enhances
management’s decision making. Essentially, it characterizes the role of financial
indicators in the improvement of company’s performance.

15
After the theoretical framework is built in the literature view in preceding chapters,
chapter four will describe the research methodology, data collection and the methods
for data analysis.
Chapter five focuses on the analysis and findings of the empirical research. Chapter
describes the statistical methods that have been used to test the previously formed
hypothesizes. Emphasis in the chapter is put on the regression results, which are the
most important part under scope. A minor reflection to previous studies and theory is
made already in the chapter, but main body of the discussion is in chapter six.
The chapter six is namely a discussion part of the thesis. This discussion is based on
the empirical research findings and it compares the findings of this study to previous
academic research in a concrete way trying to present both similarities and
differences. Additionally, it opens the floor on presenting contribution that this thesis
has made on the studied subject.
Lastly, the final chapter seven focuses on presenting conclusions. It briefly revises
the main findings of the study and implications of the findings before moving on to
discussing validity, reliability and limitations of the study. Final words and
conclusion of this thesis concentrates on looking at the future. There will be a
discussion of possible future research around the topic and suggestions for future
research.

16
2 COMPANY GROWTH AND FINANCIAL FACTORS
Academic interest toward growth has been substantially high since the second half of
1900s. Some authors even consider it to be one of the most, if not the most,
important areas that have been studied regarding companies and corporations (Klette
& Griliches 2000.) This particularly high interest for growth is natural; hence, as was
discussed in introduction, many authors argue that growth is a necessary attribute
that guarantees survival of a company (e.g. Geroski 1995, Sutton 1997.)
This section composes a literature review looking to the selected three financial
factors, (investments, equity ratio, and gearing) which are used in empirical part of
this study. More specifically, we will look at what previous studies and researches
argue about relation of company growth and each financial factor. Additionally, at
the end of each sub-chapter a hypothesis is formed based on existing literature.
2.1 Growth and investments
2.1.1 Literature review
In the firm growth literature, investments and the contribution that investments have
for growth have been the most studied area when compared to two other financial
factors, equity ratio and gearing (which are used in the empirical part of this study).
Background logic why companies make investments is quite straightforward and
comes from the theories of Joseph Schumpeter (1934) who argued that the reason
why companies make investments is simply because firms try to innovate and create
something new in order to find business opportunities where they can enjoy
monopoly incomes (Capasso & Treibich & Verspagen 2015.) That is a firm does
business in the area where it does not have competition, for instance imagine that
company X would develop flying car, it would have monopoly on that business until
one of its competitors would catch up and develop similar product/service.
Schumpeter (1934) called this process as creative destruction and Acs, Morck and
Yeung (1997) argue that today mainstream of economists increasingly accepts
creative destruction as the fundamental force behind continuous improvement of our

17
societies in areas like standard of living and general well-being. So, the process of
creative destruction and company’s interest to look for new business opportunities is
one of the drivers that bring growth. A great amount of academic literature also
argues that besides growth, investments are made so a firm can survive. Kitching et
al. (2009) make the argument, which is widely accepted among the academics, that
company which does not grow, but only stays still, will eventually start to shrink.
This, of course, leads eventually to vanishing of a firm after enough shrinking has
happened (Chastain 1982, Aghion & Howitt 1992, Acs & Morck & Yeung 1997,
Deans et al. 2009).
Recent studies include a multitude of empirical research that has been made to study
the subject. Heshmati & Lööf (2008) have made multivariate autoregressive analysis
about Swedish SMEs. Their conclusion is that investments have correlation to
revenue and how firms’ revenue develops, that is how company grows. Particularly,
academic field seems to have a consensus that investments in research and
development have the most notable impact on growth (e.g. Liu & Hsu 2006, Coad &
Rao 2010, Hall & Lerner 2010, Yujun et al. 2011, García-Manjón & Romero-Merino
2012, Capasso & Treibich & Verspagen 2015.) The chain of events in which way
investments boosts company growth can be described as follows: higher investments
bring higher innovation, which produces higher productivity, and with higher
productivity company gets more growth in terms of revenue (Capasso & Treibich &
Verspagen 2015.) Ericsson and Pakes (1995) argue in their study that firm’s
investments determine the performance of sales, profitability and growth of a
company. Klette & Griliches (2000) support this view by concluding that
investments are the engine of growth, and therefore, investing to, for instance in
research and development is crucial if company’s aim is to grow. Capasso, Treibich
and Verspagen (2015) used quantile regression model in their research to examine
the effect that investments have on growth. Their findings are clearly supporting the
mainstream view that investments have positive effect on growth of firm. Effect of
investments has also been studied from the perspective of certain companies. Stam
and Wennberg (2009) made their research from the point view of high growing
companies, or “elite-growth” firms as they call them, and, also came into conclusion
that stimulating growth by investments is important method to increase growth rate
of a company. Investments and growth have been studied also with country level

18
data. Hall (1987) made a study in the United States and found that investments have
a positive correlation on growth of a company. Scherer (1965) studied large
corporations in the U.S and found also notable positive relationship between the two
variables. In the context of Japan, Yasuda (2005) found investments having a
significant on growth. Vasić, Kecman and Mladenović (2016) published their
research recently, in which, they look at EU-countries and R&D investments from
country level perspective. Their conclusions support the findings of other researches
that have been presented above. The most interesting research regarding this thesis is
made by Deschryvere (2014) who studied Finnish SMEs and large firms with a data
covering the years 1998-2008. Deschryvere’s conclusions from vector-auto
regression model are in line with other literature: he found positive and clearly strong
correlation between investments and revenue growth (Deschryvere 2014.)
Critical observations on the same topic include results from a research made by Hölzl
(2009). He argues that actual causality from investments to company growth cannot
be found. Although, this result contrasts with mainstream view and with the results
from a wide body of previous research presented above, there are also research
papers that have suggestion what might cause this contradiction. Research by Klomp
and Van Leeuwen (2001), as well as, study by Coad and Rao (2008), both present the
idea that explanation for this might be that company growth is often measured one or
two years after investment expenditure, as was the case in Hölzl’s paper. In their
more recent paper, Coad and Rao (2010) argue that in practice a much longer time is
required for investment to materialize in terms of growth. Their view is that even
successful investments could be unprofitable for several years (e.g. costs related to
development) before it brings growth for a firm (Coad & Rao 2010.) This idea has
been acknowledged by academic field and nowadays researchers speak about
concept of “time lag” when addressing the problem that investments do not show
immediately as a growth for a firm (see e.g. Liu & Hsu 2006, Coad & Rao 2010,
Yujun et al. 2011, García-Manjón & Romero-Merino 2012, Capasso & Treibich &
Verspagen 2015.) Study by Hölzl (2009) is not the only one with critical results
regarding effect of investments on growth, but major share of academic field seems
to believe that time lag effect considered, there is a clear positive correlation for
growth. Thus, time lag effect is the reason why contrasting results and opinions can
be found from the literature (Brynjolfsson & Yang 1996, Liu & Hsu 2006).

19
In this study, the time lag effect has been taken into consideration by making a
longitudinal study, or in other words, making a study using a longer time-period in
the empirical study (Saunders 2016.) The time period of nine-years from 2007 to
2015 is significantly longer than the two to three years that have been mentioned in
the literature as a time frame that still has time lag effect (Liu & Hsu 2006, Coad &
Rao 2010).
Previous academic research, presented above, brings an important follow-up question
to mind. How significant is the so-called time lag effect in investments? Capasso &
Treibich & Verspagen (2015) made OLS (ordinary least squares) regression, or
linear regression, in their research which gave indicative results. They conclude that
in the short term, higher R&D investments seem to have not so significant impact on
growth. However, over a medium term (four years in their research) investments to
R&D have extremely significant correlation for growth. García-Manjón & Romero-
Merino (2012) have also studied effect of investments for growth with OLS
regression, and additionally they used quantile regression. In their analysis, they used
data which included 1000 European companies from multiple countries and
consisted years 2003-2007. Their results are parallel to findings of Capasso &
Treibich & Verspagen (2015). García-Manjón & Romero-Merino (2012) conclude
that, with both OLS and quantile regression, a clear positive effect of R&D (that is,
investment to R&D) on the revenue growth is witnessed; “According to this result,
when we study the sample in average conditions, an increase in the R&D investment
positively influences the growth of a firm’s net sales” (García-Manjón & Romero-
Merino 2012, page 1090.) Regarding results, they mention that correlation between
R&D investments and company’s growth varies depending on used time frame in the
analysis (García-Manjón & Romero-Merino 2012.) This result that significance of
correlation depends on time is expected as per the concept of time lag, which we
looked in on previous paragraph (Brynjolfsson & Yang 1996).
The question of when is the optimal time to invest is a trickier one. Common
assumption that arises from the academic literature seems to be that general
recommendations suiting every company cannot be made. Instead, universal
statements arguing that there is one right time for every firm to invest are seen to be
dangerous, because those recommendations do not identify enough individual

20
situations of companies. Both qualitative and quantitative research shows that what
firms seems to do is cut investments in a time of difficult economic situation, and
vice versa, invest during better times. Besides macro level difficulties, any other
financial constraints tend to suppress investments also (Yujun et al. 2011.) This
would indicate that firms see investing as a luxury that is only possible to do when
economic situation is stable enough (Deans et al. 2009, Kitching et al. 2009, García-
Manjón & Romero-Merino 2012.)
2.1.2 Summary and hypothesis formation
The above presented literature review of investments and growth of a company gives
a wide and clear picture about the relation between the two variables. From the
previous research it has been identified that investments have a positive impact for
growth of a company. A major share of research presents findings showing
investments having a positive relation for growth. Companies gain more market, or
more business, by investing, which eventually leads to new innovations. There is also
consensus that a longer time span than only one or two years must be taken into
account in order to see a clear, positive and significant correlation between
investments and growth. This is also something that we can logically expect by
thinking day-to-day activity in firms. It takes time to convert new innovations,
knowledge, etc. into value, in other words into growing sales numbers. Capacity
problems might also arise and enhance the time lag between investments and
company growth. If a company makes innovation with commercial value today it
could well be that its factory is working already at full capacity, and therefore, new
product/service cannot be sold to markets just yet (Barkham et al. 1996, Brynjolfsson
& Yang 1996, Yu et al. 2010, García-Manjón & Romero-Merino 2012). Nonetheless,
the problem that the so called time lag effect poses is countered in this thesis by
making a longitudinal study, which has a longer time span than only one or two
years.
Existing literature clearly indicate that investments have a positive impact on firms
growth. Given the theoretical findings presented above, the following hypothesis has
been formed. This hypothesis will be utilized in the empirical section in order to test

21
the possible relation between investments and growth of a company with a dataset of
this thesis:
Hypothesis 1: investments have a positive relationship with growth of a company.
2.2 Growth and equity ratio
2.2.1 Literature review
Main body of the literature about relation between equity ratio and growth comes
from the field of corporate finance (Petrunia 2007.) Company’s capital structure, or
the ratio of equity and debt, is one of the most studied subjects in the corporate
finance literature, as it is thought to have influence on numerous different things,
such as growth (Kiani et al. 2012).
There is a large body of literature which clearly indicates that using at least some
level of leverage, or debt, to fund firm’s operations can boost growth (e.g. Myers
1977, Kim & Sorensen 1986, Petrunia 2007.) This observation can be linked back to
investments and capacity problem discussion, which was presented in the previous
chapter of this study. In the case of firm’s factories operating on full capacity the
solution could be to expand, for instance construct or acquire another factory, and in
that way, buy more capacity. In numerous situations, it is good idea to fund this
expansion by borrowing money, i.e. use debt-leverage. Empirical study by Whited
(1992) supports this conclusion by presenting results that show growth depending on
firm’s leverage: lower levels of debt boost growth, but breaking point when low
equity ratio comes a burden and instead shrinks revenue is not clear and depends on
multiple issues, such as firms’ size, industry, age, country, etc.
However, as much as academics seem to accept the fact that some level of leverage
is better than 100 percent equity, they also argue that too much debt is dangerous.
Petrunia (2007) argues that major portion of corporate finance literature show that
too large amount of debt can be a restrictive element on firm’s operations and
growth. This problem is also referred to as liquidity problem in corporate finance,
which, in essence means that highly levered companies face cash-flow demands by

22
debtors, thus limiting company’s ability to expand and acquire growth (Petrunia
2007.) Study by Kiani et al. (2012) continues with this theme by concluding that too
low equity ratio is especially risky in time of crisis when debt providers come more
critical and firm’s thus need more buffer in their capital structure. Ulrich & Arlow
(1980) show in their study that liquidity problems have even made owners to lose
control of their firm or forced to declare bankruptcy. Myers (1977) argues in line
with Petrunia that highly leveraged firms cannot get funds even for projects with
positive new present value, because of amount debt that firm already has. Identical
argument is also presented by Atkin & Glen (1992). Thus, too small amount of
equity lowers growth of a company. Myers continues by stating that other negative
effect is that firm’s might limit investment activities and not even consider all the
possible expansion options, whereas in previous case it is the providers of debt who
decline to supply more funding. Why could companies with better equity ratio and
lower debt then grow faster? Lang, Ofek and Stulz (1996) make interesting point by
arguing that companies with good growth opportunities try to have lower amount of
debt, which brings financial flexibility so that firm has the possibility to seize
potential investing and growth opportunities. Though, opposite statements include
Ross (1977) who argued the so-called “signaling effect” that lower equity ratio could
have. Core of the argument is that firm could choose to operate with higher leverage,
and in doing so, give a signal to outside stakeholders that managers believe in firm’s
future prospects (Lang & Ofek & Stulz 1996, Liu & Hsu 2006, Petrunia 2007).
Let us look at the quantitative research results relating to equity ratio and growth.
Negative aspects of high leverage, i.e. low equity ratio, include decline in specific
attributes of a firm. Opler and Titman (1994) studied the correlation between low
equity and growth. Their findings indicate that revenue decrease is much more
common with firms that have lower equity ratio. Lang, Ofek and Stulz (1996)
presented results that show a negative relationship between leverage and growth of
firms (they have separated growth to non-core and core segments). Though, it is
important to note that their findings do not indicate that, for example just one percent
of debt (and 99 percent of equity) means that firm shrinks compared to a situation
with 100 percent of equity. Rather, their findings are in line with other authors and
show that too high leverage is bad for growth. Research by Liu and Hsu (2006) show
results that support the mainstream argument that too much leverage is not good for

23
growth. In their regression model, they found that low equity ratio is associated with
low company growth. This finding reflects the view, which is supported by other
studies also, that company with stable financial structure tends to achieve higher
growth. Liu and Hsu (2006) looked also what effect different debt instruments have,
and found that high bank-financing ratio correlates with higher growth, while
companies using bonds as a form of debt capital usually have lower growth. This
result could reflect the fact that banks have higher standards for lending than what
individual investors in bond markets have.
The mainstream view by researchers presented above holds also when looking at
literature with specific country data. Kiani et al. (2012) made regression analysis on
Asian companies with data including years in turn of 2000s. Their results show that
leveraged firms grew faster in the years before Asian Financial crisis of 1997, but
during the following years after the crisis firms with lower debt grew faster. These
findings by Kiani et al. (2012), that equity ratio and performance is related to
economic situation, are very similar to conclusions made by Myers (1977) and
Petrunia (2007). Study by Qiu and La (2010) examined 367 firms in Australia
between years from 1992 to 2006. They conclude that debt-asset ratio is negatively
related to growth prospects, which means that higher debt leverage is associated with
slower growth. So, low equity ratio brought higher growth than low ratio. Finally,
Kim and Sorensen (1986) show, with their regression results, that growing firms in
fact used less debt rather than more debt and low growing firms were the ones with
higher leverage.
Finance literature in general does not editorialize what is optimal equity ratio for
each company, rather it is viewed that this depends from a number of different
factors, such as firm size, industry, country, etc. (Liu & Hsu 2006, Petrunia 2007.)
Some specific optimal equity ratio number is not either in the interest of this study,
as this thesis looks to the relation between different equity ratios and firm’s growth
with data from firms competing in multiple industries. Next chapter presents
academic literature for the third, and last, financial ratio used in the empirical
analysis.

24
2.2.2 Summary and hypothesis formation
The above presented literature review of equity ratio and growth of a company gives
a broad and clear picture about the relation between the two variables. From the
previous research it has been identified that higher equity ratio has a positive impact
for growth of a company. This line of argumentation and findings has been found
from a wide spectrum of previous literature, which covers different countries,
industries and also different decades ranging from the 1970s to the 2010s.
Existing literature clearly indicate that higher equity has a positive impact on firms
growth rather than the opposite situation, i.e. company having low equity ratio would
grow faster. However, as higher and lower both are relative concepts this phrasing
cannot be used in the hypothesis. Accordingly the following hypothesis has been
formed to test the possible relation between equity ratio and growth of a company
with a dataset of this thesis:
Hypothesis 2: equity ratio has a positive relationship with growth of a company.
2.3 Growth and gearing
2.3.1 Literature review
Gearing refers to the level of a company’s net debt related to its equity capital and
measures company’s financial leverage. Particularly it measures how company
survives from its liabilities. The biggest difference to equity ratio is that gearing
calculates also receivables that belongs to the company (e.g. accounts receivables),
while equity ratio is only the measure of how much equity company has compared to
debt, or to the whole balance sheet to be exact. Although the two factors are closely
linked to each other, both variables have been also studied separately as they are two
different financial ratios; hence this chapter will present different academic studies
than the previous chapter.
A wide body of literature about gearing and growth has the same overall conclusion
as literature on equity ratio: both theoretical and empirical results show that too much

25
debt can be a restrictive element on firm’s operations and growth (Petrunia 2007,
Kiani et al. 2012.) Hussain (2011) made study with multiple factors examining how
those factors relate to growth of a firm. Results about gearing suggest that especially
long term interest bearing debt should be put under close look in companies. Hussain
speaks about possible ‘debt trap’ that firms could encounter: a situation where firm
has so much debt, i.e. very high gearing, that it cannot anymore survive from it. The
result could be losing control of the company to debtors or even bankruptcy, as was
argued by Ulrich & Arlow (1980) also in research about equity ratio. Even if firm
survives from the situation of nearly being buried under the debt, previous studies
clearly show that harm to firm’s growth is significant (see e.g. Myers 1977, Lang &
Ofek & Stulz 1996, Liu & Hsu 2006, Petrunia 2007.) Hussain (2011) makes also
argument relating to behavior of people within the company. Having a high debt
could bring a situation where employees and managers stress becomes unbearable
and starts to show in daily work effort, which would naturally deepen firm’s
problems even more (Hussain 2011).
On the quantitative regression analysis side, Brierley and Bunn (2005) presented
study made for Bank of England with clear results. In their paper, they say that:
“gearing levels are persistent, positively related to company size and negatively
correlated with growth opportunities” (Brierley & Bunn 2005, page 360.) So, their
analysis shows results, which are in consist with other existing literature. Brierley &
Bunn (2005) explain common logic behind low gearing by stating that companies
expecting high growth should keep debt level low because opportunity cost of not
being able to finance investments creating value is greater than for a company which
does not expect to even encounter such opportunities. From this you could make
interesting conclusion that for firms that do not expect growth, i.e. anticipate stable
or shrinking revenue, taking large amounts of debt is not that costly as for high
growing firms. This, of course, is true only from the point of view of opportunity
cost and does not hold in the long term because with shrinking revenue firm has ever
harder time to pay its growing amounts of debt. Fama & French (2002), pioneers in
the field of finance research, have looked also into the matter that high growing
companies seem to have lower level of gearing. This, they argue, could be seen
contradicting what many have as first impression about the subject. If thought with
common sense, it would add up that high growing companies in fact have higher

26
amount of debt, and therefore gearing, because of the higher investment requirements
that originate from growth. However, based on results it is in fact the other way
around, as we also saw in previous chapter. Firm’s maintain lower risk level by
having less debt and thus have capacity to finance expected investments and growth
opportunities in the future. This occurrence is numerically visible in the past research
as a negative relationship between gearing and future growth (Atkin & Glen 1992,
Lang & Ofek & Stulz 1996, Petrunia 2007, Hussain 2011, Kiani et al. 2012).
2.3.2 Summary and hypothesis formation
The above presented literature review of gearing and growth of a company gives a
clear view on the relation between the two variables. From the previous research it
has been identified that higher gearing has a negative impact for growth of a
company.
Existing literature clearly indicate that high gearing has a negative impact on firms
growth. However, as high is a relative concept, particularly so in the context of
gearing, this phrasing cannot be used in the hypothesis. Consequently the following
hypothesis has been formed to test the possible relation between gearing and growth
of a company with a dataset of this thesis:
Hypothesis 3: gearing has a negative relationship with growth of a company.

27
3 HOW FINANCIAL FACTORS CAN HELP IN MANAGING GROWTH?
3.1 Defining financial indicators
Financial indicators, or financial metrics, are essential for managers, or broadly
speaking for anyone who is in a leadership position, of a company. In the academic
literature, it has been correctly pointed out that it is extremely difficult to manage
something, which is not being measured (OSR Centre 2016.) To exaggerate, it could
lead into a situation where decisions are based on opinions, rather than facts, simply
because in many cases different metrics and numbers are the facts. Which in turn
means that using and developing different metric and controlling systems helps
providing facts for a company. This first sub-chapter provides a broader overview on
the financial metrics in the context of business world. The following sub-chapter
combines growth, the main topic of this thesis, with financial metrics by making a
landscape from the point of view of managing growth by using and following
financial indicators.
Measuring financial performance, or company’s conditions, is a key tool for
management that provides necessary information for controlling company’s
efficiency and use of resources. This, of course, is the very basics of what whole
purpose of companies are built on, as big parts of what firms try to do is be more
effective than their competitors, in order to gain competitive advantage. Performance
metrics give management the possibility to measure different things, be it equity
ratio, liquidity, growth, customer satisfaction, sales per store, employee satisfaction
or any other figure. However, perhaps as the most essential ability, it enables
managers to see how company has performed. In several aspects of everyday
business, it is important to precisely evaluate firm’s performance and position, for
example, if company falls short of target, managers in the firm can then draw
conclusion and take steps that are required to reach the target next time. Kaplan and
Atkinson (1998) state that properly chosen indicators provide excellent big picture
about organization’s situation. Suitable financial indicators give unbiased picture
about firm’s strategies and how its operations are working. Fanyves, Tarnóczi and
Vörös (2014) argue that especially during recent years the importance for companies
being aware of their own financial situation has come up as banks and other financial

28
institutions have reduced their lending activity after the financial crisis of 2007-2008.
Increasingly, only companies that can show clearly their current and future financial
position can get funding. Meaning that besides giving tools for managing a company,
financial indicators are in special interest also for wider audience of stakeholders
(Fanyves & Tarnóczi & Vörös 2014).
Already in the 1960s, Beaver (1966) showed in his study empirical evidence about
the importance of financial ratios. Especially financial metrics relating to debt and
cash flow were found to give statistically significant signals well in advance the
actual troubles had started to show, and people in the firms became aware of the
situation. Study by Suarez et al. (2011) also makes the case supporting use of
financial indicators to provide more factual information, and using this information
in management decisions.
Kaplan and Atkinson (1998) consider two main reasons for the widespread use of
financial performance measures. First financial performance measures, such as
profit, articulate directly with the organization’s long-run objectives, which are
almost always purely financial. Second, properly chosen financial performance
measures provide an aggregate view of an organization’s performance. An aggregate
financial performance measure, such as corporate or division profitability, is a
summary measure of the success of the organization’s strategies and operating
tactics.
More recently, a phenomenon like big hit in the world of numerical indicators
combined with managing firm has been balanced scorecard (BSC), which was
developed first by Harvard Business School Professors Robert Kaplan and David
Norton during the early 1990’s. Today, Balanced Scorecard is used extensively
around the world in business and industry, governments, nonprofit organizations, etc.
BSC gives ability to improve both internal and external operations, and monitor
whole organizations performance against goals that have been set. BSC has three
different segments, or areas, which it measures: financial related, customer related,
and internal business related subjects are the three segments that form Balanced
Scorecard. BSC is a strategic planning and management system, which allows people
in leadership positions to measure financial results, customer related results, and
29
internal activities, such as operations (Kaplan & Norton 2007, Narayanamma &
Lalitha 2016.) However, as the scope of this thesis is limited to financial indicators,
rather than all different quantifiable indicators, rest of this theoretical chapter will be
focused on financial metrics.
3.2 Managing growth with financial indicators
A major share of financial indicators or metrics literature has mainly focused on what
kind of metrics to use, which indicators are best for different industries, are there best
fit indicators to be found, etc. A significantly smaller share has studied the subject in
combination with other topics, such as managing growth, which is the aim of this
chapter. Theoretical foundation for this chapter derives from the financial indicator
and growth management literature, with the former as a base for financial indicators
and metrics, and the latter as a foundation for managing and growth.
Basis for the examination on how efficient usage of financial indicator can help in
managing firms’ growth has to be started from the basics. We saw definition and
logic for companies using financial metrics in previous chapter. Next area for
examination, before being able to answer how financial indicators can be used in
growth management, is what kind of process lies behind the logic of using financial
indicator data toward improvement. Suarez et al. (2011) has studied this process
from the very first steps all the way till final stages. Illustration of all the different
phases included in the process can be seen in figure 3 on the following page.

30
First phase in the figure, gaining financial indicators data, is provided by control
systems, programs, and tools likewise. Second step after data has collected is
processing and analyzing it. This is the step where large amounts of raw data, for
instance cash flow figures from every single store, will be combined to more usable
format. Rather than the very first raw data, it is this processed and crushed financial
indicator data that is meaningful information. Information such as what are the best
business units that the company has, or which stores make up the worst 10 % if
compared on sales per customer metric? Following phase is learning, which is
naturally based on information organization got during previous step. Management in
the company has now learned what stores form the worst 10 % that will require
attention to get business running as wanted also in those stores, and what are the
issues there. In the following step learning further transforms to knowledge.
Continuing with previous example, knowledge such as what are the issues and
problems that have made it so that identified stores are performing badly. From
organizations point of view, this knowledge is extremely useful and valuable as it
can be distributed or shared across the whole organization to other stores. Following
knowledge, comes financial condition, which in this context means that now firm
both has updated information about its current financial condition, as well as, can use
this knowledge about financial condition on next phase, decision making. After all in
Figure 3: Role of financial indicators in the improvement of company’s
performance (Suarez et al. 2011).

31
business world, step number seven, decision making has to be drawn to the realistic
situation. It could well be that, even though organization has learned that there are
nine issues to be rectified in these weak performing stores, there simply is not
enough funds to repair everyone these at this point. A decision-making phase is also
ultimately prioritizing step, a choice which of these nine issues will be repaired now
has to be made. Decision making leads to closing gaps. Now that acquired
information has provided organization with knowledge about the problems, and
decisions how to correct them has been carried out, these gaps, or issues, naturally
will be history now. Closing gaps leads to the final step in the process of using
financial indicators data, improved organizational capacity. Now that the issues have
been resolved and are in the past, the outcome naturally is even more efficient
company, or in other words, improved organizational capacity.
After the quick description of how the process of financial indicator data flowing
inside an organization all the way till improvement functions it is time to move on
the core topic of this chapter; how financial metrics can be used in managing growth
of a company. First and foremost, it must be acknowledged that only a minor fraction
of financial metrics can work in a one fit suits all model for all different companies
and industries. Widely used financial indicators, for instance sales numbers, gross
operating profit, cost structure, etc. are good metrics to use in every company, not
least because these are also figures that are with many companies required data by
governmental authorities (Cardinaels et al. 2010.) However, different businesses also
need customized financial metrics. Sector such as hotels and motels should prioritize
very different metrics when compared, for instance on manufacturing. Customer and
sales related figures such as sales per a hotel room or proportion of additional sales
from customers stay, just to name a few, are essential for managing a hotel business
(Philips & Louvieris 2005.) On the other hand, managing growth of a manufacturing
company would require concentrating more on financial metrics such as value of
storage, cost of transportation, etc. (Fernandes et al. 2006.) While non-financial
performance indicators are not the subject of this thesis, management should
nevertheless always bear in mind that these metrics are also highly relevant for
managing a business. As Kotane and Kuzmina-Merlino (2011) argue in their study,
nowadays this is true more than before as share of service and knowledge based
businesses continues to rise. Indicators such as quality, customer satisfaction, and

32
return rate of products are required to be monitored also. Ponikvar et.al. (2009)
conclude in their study by stating that besides financial indicators, non-financial
metrics give management of growing companies’ also relevant information for
decision making. This is also one of the reasons why Balanced Scorecard has been
developed further to include also more non-financial metrics (Kotane & Kuzmina-
Merlino 2011, Narayanamma & Lalitha 2016).
All the financial indicators have one thing in common from management’s
perspective: they can be used effectively in managing a growing company.
Previously introduced Balanced Scorecard is an exceptional example how much
controlling and measuring systems can enhance operations and functioning of
organization, not only in business world, but also government and non-profit
organizations. Management of a company that is aiming for high growth phase can
use measurement of financial metrics data to make sure that decided tasks are
moving forwards. As we remember from figure 3 (page 30), illustrating role of
financial indicators on organizational improvement, loop of the process continues
from organizations improvement back to the very beginning, which was getting data.
Company management can use financial metrics to measure, for instance, if the
investments, that have been decided to make, have actualized. Growth could be
managed in a way that financial indicators are used to provide information whether
the resources allocated for new investments have materialized as growth. For
instance, has the hotels sales per room raised, have additional sales in identified
troubled shops risen, etc. Additionally, usage of indicators in growth management
could also happen by following a broader set of indicators. For instance, if a
company has decided to invest 10 million in certain countries, management can track
progress by measuring how the investments have been executed, and have they been
made in countries that the executive board has favored. After all, especially in larger
companies, executive board does not have the time and resources to personally
oversee smaller investments. This means that it is in most cases the middle
management, which consists of people who personally oversee the implementation of
decisions, or investments in this case. However, what managing board can do is use
financial indicators to measure, analyze, and gain knowledge if everything has been
carried out as was the plan when decisions were made.

33
Second point relates to using financial indicators to measure things that otherwise
could be measured only by using non-financial metrics. For example, recruiting is
one of the areas that is commonly measured by counting how many new employees
have been hired, rather than by calculating how many resources have been used for
recruiting process (Kotane & Kuzmina-Merlino 2011.) A company decides that it
will recruit 50 new employees within the next year to in order to be able to answer to
the expected growth. If you add usage of financial indicator measurement to the
situation, management could go other way around and instead decide that the firm
will use 50 000 € to recruiting within the next twelve months. Now the management,
and effectively whole firm, knows precisely how much money will be used for
recruiting, rather than having to wait for recruitment of 50 new employees and after
that getting the knowledge about how much the total cost of those recruitments was.
Additional benefit in this management style is that it also helps in budgeting and
planning as a firm can be safer minded regarding total costs for the year. This same
logic in managing growth with usage of financial indicators can be transferred also to
other departments, problems, and issues within companies. Financial metrics data
can reveal which ten grocery stores of the firm are operating with the lowest sales per
worker and which one are operating with the highest. Management could make
staffing decisions based on this knowledge, moving workers from lower sales stores
to higher sales stores while trying to gain more growth. Management of a firm
experiencing seasonal differences in its business could also make same kind of
decision and through that way effectively manage growth (OSR Centre 2016).
Thirdly, area relating to future outlook of any firm, and thus to growth and managing
growth, is investments to intangible resources and human capital. Narayanamma &
Lalitha (2016) emphasize importance of investing to intangible resources throughout
their study. They hint that growing companies underestimate importance of investing
to employee capabilities, information systems, empowerment of workers, and
alignment of whole staff with company’s long-term vision and strategy. Measuring
systems and track of financial factors provide an opportunity for growth management
also with these subjects. Executive board managing with growth mindset could again
manage using financial metrics such as amount of spent money, usage of other
resources, calculate value of used hours per worker, etc. to make decisions on how
much to invest in human capital. Be it training new skills, rising employee

34
satisfaction with company leisure time activities, or any other similar activity. Rather
than trying to make decision in top management about what kind of new skills every
worker should acquire, management team could make decision only on how much
resources, hours, funds, etc. are to be used for training of employees. This would also
cut the amount of micromanagement, as decision regarding what kind of new skill
every single worker starts to learn is made in a lower level of company hierarchy,
effectively meaning that the decision is made closer to the employee.
Finally, financial indicator metrics can provide a tool for watching threshold levels.
For instance, a company has defined that as a part of its growth strategy, funds spent
on acquiring new clients has to be 10 000 € per individual store on a yearly level.
Now, in the case that this minimum threshold level is not achieved is in some stores,
management of the firm can look at the situation, gather knowledge why this has
happened, and finally make decisions how to fix it. Another example for threshold
levels could be a high growth company, which is trying to achieve a 20 % yearly
growth rate. Now, executive management has calculated that to accomplish this
growth goal, every individual grocery store of the firm has to invest hypothetical
minimum amount of 10 % from its incoming cash flow to recruiting and marketing
every month. Next step for management is to monitor the set indicators and make
sure that all the individual stores are achieving these decided thresholds on marketing
and recruiting.
Building financial measurement systems and financial indicators not only provides
ability to track performance, but also helps management to identify what should be
done and measured furthermore. It gives executive management an opportunity to
execute their decisions, which effectively means also whole business strategies.
Everyday operating of companies can be further enhanced by looking at financial
indicators from the point view of growth management. This potential for usage of
financial indicators in growth management is further supported by the very basic
operating logic how information flow through the organization in different steps, as
was shown in figure 3 on page 38. Measurement, analyzing gathering, information,
getting knowledge, and finally awareness of firms’ current situation is what yield the
possibility for facts based decision making and managing growth.

35
Following this chapter, next one presents empirical examination of the study, which
is done with the three financial indicators that were introduced in the first chapter of
the theoretical part. Discussion of the foundations of the empirical part is followed
by displaying findings from the empirical study and analyzing those results.

36
4 EMPIRICAL EXAMINATION
This chapter focuses on the methodology of the empirical part of the thesis. It
describes the research methodology, data collection and the methods for data
analysis. Main objective is to give the reader an introduction on what is the
fundamental setting in the background of the empirical research. Findings of the
empirical analysis are presented in chapter 5.
4.1 Research methods
Ghauri and Gronhaug (2005) have concluded well that, “research methods refer to
systematic, focused, and orderly collection of data for the purpose of obtaining
information from them, to solve/answer a particular research problem or question.”
In every research project the choice between quantitative and qualitative research
must be made. The objective of this study is to reach an understanding on the current
state of knowledge related to managing growth with financial indicators, and relation
between growth of a company and the selected financial factors. Additionally, the
aim is to research what is the relation between these three financial factors and
growth. Saunders (2016) states that one way to differentiate quantitative methods
from qualitative methods is to make a separation between used data. Namely to
categories of numeric data (quantitative) and non-numeric data (qualitative).
Quantitative is often seen as a synonym for any data analysis that uses and generates
numerical data. Quantitative research can be also identified to be a study which
examines relationships between variables that are further analyzed with statistical or
graphical methods.
As the research objective of this thesis is to study what kind of relations there are
between investing, equity ratio, gearing and growth, it was decided that the
quantitative research method would fit the purpose of this study. Therefore, statistical
tools are used to quantify the relations between the studied variables. Furthermore,
and more specifically, regression analysis, which is presented in chapter 5, forms the
major body of statistical methods. Additionally, correlation table and comparisons
between medians of variables will be made.

37
One major decision in the research methods concerns choosing what time horizon is
used in the study. Rather rough split can be made between a short snapshot in some
specific time and longer period, which is called a longitudinal study (Saunders 2016.)
As the purpose of this study is to find relations of different variables and growth, it is
in a way self-evident that a snapshot type of shorter-time frame would not suit the
purpose of this study. The study requires data from longer period that shows changes
and developments in different variables over time. Longitudinal studies track the
same population or use same data in the research. Showing different patterns and
development trends is precisely one main advantage of using longitudinal data when
compared to studies covering shorter time. In this thesis, the longitudinal study
method is also retrospective meaning that it looks back in time, which is the case
when dataset consists of existing data like company’s old financial statements (Hill
& Griffits & Lim 2010, Saunders 2016).
4.2 Data collection
The data gathered for the thesis consists of theoretical literature from various sources
and empirical data from financial data of companies.
4.2.1 Theoretical data
Theoretical data for the thesis was gathered from the most relevant scholarly
databases and in addition to that from other web databases. These databases included
EBSCOhost, ProQuest and Scopus. Investments, equity ratio, gearing, company
growth, financial indicators, managerial decisions, and managing growth were
amongst the most used key words when searching for articles, books and journals
from the databases.
To enhance validity of the thesis it has been ensured that all the previous academic
works used as source are peer reviewed studies. Furthermore, previous academic
publications have been selected so that they would relate to the research questions as
much as possible. Additionally, literature review includes publications from different
decades as well as from multiple countries. Fundamentally this decision was made to
improve generalizability of the thesis.

38
4.2.2 Empirical data
As mentioned in the very first chapter, it was decided that the usage of secondary
data is best suitable for this study. In a nutshell, secondary data can be defined to
mean any data that was collected initially for some other purpose (Adcock & Collier
2001, Saunders 2016.) Once obtained, this data can be analyzed to bring new
information and findings that were not something that was looked for at the first-time
data was gathered. Major advantages of secondary data are: ease of gaining data,
time effectiveness, fewer resource requirements, and it can be only solution for some
longitudinal studies. All the data used in this thesis has been gathered already so use
of secondary data brings major time and resource efficiency. Practically speaking, it
would have been impossible to collect required data for analysis by using primary
data methods. Additional advantage is the fact that secondary data generally is
permanent and available in a form that may be verified by other scholars also. This
means that study is more open to public scrutiny. Possible disadvantages that apply
to usage of secondary data are for instance, difficult or cost of access, unsuitable
aggregations or definitions, and no control over quality of data (Saunders 2016.)
However, from the listed disadvantages only last one applies to this study as there is
no cost of access and definitions are suitable to answer the research questions (Vogt
2011, Saunders 2016).
The research data in the empirical part of the thesis was gathered from Talouselämä
500+ -listing which was provided to the author by Talouselämä magazine (see
following chapter 4.2.3. for detailed briefing regarding Talouselämä 500+ -listing).
The data has been collected in the form of Microsoft Excel and kept in that form
throughout all the different parts of the empirical analysis. Thanks for the courtesy of
Talouselämä, the original data has been received already in Excel form, meaning that
no handpicking from physical magazines has been made by the author. Physical
Talouselämä 500+ –listings have been used only to double-check figures. Author has
received the original dataset in January 2017. All the calculations and statistical
procedures for the data have been made between January and April 2017. Dataset
includes all the years from 2007 to 2015. Financial statement figures for the year
2016 have not yet been published, therefore, 2015 is the last year taken into the
analysis.

39
Furthermore, as is the case with primary data, secondary data sources must be also
evaluated accordingly. Saunders (2016) concludes that author must make sure that
secondary data satisfies three major requirements. First, secondary data will enable
scholar to answer research questions. Second, benefits that are gained by use of
secondary data are greater than cost of using it. Third, researchers must have access
to the secondary data. Based on these requirements it was decided that the needed
secondary data should be collected from Talouselämä 500+ –listings, which are
produced by Talouselämä magazine. Talouselämä 500+ –listings provide data that
enables answering to research questions, cost of using secondary data is
economically speaking zero, and finally author of this study has direct access to the
secondary data used in the study.
Last, but certainly not least, topic is protection and management of data, which is one
of the most important aspects regarding any data used in academic works (Saunders
2016.) However, as this study uses secondary data and includes only publicly
available information (as mentioned previously, financial statements are mandatory
requirements in Finland) there was no need to put extra effort on data protection.
This is a big distinction, for instance on studies that includes surveys using personal
data or other sensitive information (Vogt 2011, Saunders 2016).
4.2.3 Talouselämä 500+ –listing
Talouselämä 500+ –listing, also known as Talouselämä 500 challengers, has been as
part of the magazine every year in a number that is published in May or June. The
publisher for the magazine is Alma Media Oyj, which is a media company based in
Finland. The listing includes companies that are ranked between 501 and 600, if all
the companies in Finland are put in order by revenue.
Information in the listings is based on official financial statements of the companies,
which are mandatory in Finland for all the companies that are included in this study.
Talouselämä gets the information for listings from Finnish Patent and Registration
Office, which is a government organization and works under the administrative
branch of the Ministry of Economic Affairs and Employment (for further information
see www.prh.fi). Usage of official data, which is both government regulated and

40
required by the law, eliminates possible biases which could happen, for instance, if
data would be collected from firms individually (e.g. company website). This is
simply because firms can publish on company websites data that uses different
calculations methods, etc. that might differ from company to another.
Along with Talouselämä 500+ –listings various company specific data has been
double-checked from Voitto+ database. Voitto+ is the most extensive financial
statements database in Finland. It contains financial statements data and key ratios
for over 90 000 Finnish firms. Voitto+ is produced and made by Suomen
Asiakastieto Oy. For this study, the database has been used through University of
Oulu’s common database license, which is available for all the students of the
university. As does Talouselämä 500+ –listing, Voitto+ database also utilizes
information, which is collected and provided by Finnish Patent and Registration
Office.
4.2.4 Description of the companies included in the empirical study
Data in this study consist of all the companies that are part Talouselämä 500
challengers (full list of companies included in the empirical study is presented in
appendix 1). These are companies that would be ranked on positions from 501 to
600, if all the companies in Finland would be put in in order by revenue. As is the
case with longitudinal studies, these same one hundred companies and their progress
was looked at every year in nine years ranging from 2007 to 2015, which was the
scope of the study. Simply put, reason why study includes only 100 companies is that
a dataset including, for instance 1000 firms, was not found in a reasonable time by
the author.
At the starting year of the study, these 100 companies had median revenue of 62
million euros, and median number of employees was 244. It should be highlighted
here that not every single one of these one hundred companies satisfies the official
definition of medium-sized firm. For example, median revenue of the companies was
over 50 million, which is the maximum limit in order to be considered as medium-
sized firm (European Commission 2003.) However, median number of employees in
2007, first year included in the study, was 243 and thus satisfies the maximum limit

41
of 250. The Talouselämä 500+ –listing is still used, regardless of this possible
limitation of not satisfying official term of medium-sized firm, foremost because the
easiness of accessing the data. Furthermore, new digital companies, such as
Supercell, do not fulfill these requirements either as revenue of the firm is over two
billion euros, albeit they have less than 200 employees (Voitto+.) Hence, it would
not be considered as medium-sized company, even though, it has significantly fewer
employees than the maximum of 250. Naturally, this makes one wonder if these
classifications companies are anymore valid in the current era of highly digital
business models.
Furthermore, using Talouselämä 500+ -listing provided efficient way to obtain a
great amount of data. Same dataset simply would not have been possible to be
collected manually by the author in reasonable amount of time. Another restrictive
matter would have been getting data from a long period of time. Voitto+ database
covers all the needed financial figures starting from 2011, which is multiple years’
shorter time period than what Talouselämä 500+ -listing provides.
4.3 Data analysis
Data analysis is a multi-step process and especially quantitative data can be analyzed
in a variety of different ways (Hill & Griffits & Lim 2010.) Quantitative data
analysis is helpful in evaluation because it provides numerical, and thus quantifiable,
results, which can be compared to other studies using similar measurements. This
thesis uses analytical procedures such as correlations and regressions, both of which
can be counted among more moderate and advanced analytical methods, rather than
basic methods. Correlation describes the nature of the relationship between two
different variables. However, correlation only indicates that a relation exists but it
does not explain causation. Regression can be seen as an extension of correlation and
it is used to determine whether one variable is a predictor of another variable. For
instance, a regression would help to define if the amount of investments is a predictor
of company’s’ growth in the following years (United States General Accounting
Office 1992, Hill & Griffits & Lim 2010).

42
Data analysis in this thesis was a rather straight forward process because of the
objective of using statistical methods to test previously formulated hypothesizes. As
described in the data collection part, the original dataset for the study was received
already in Microsoft Excel file. After receiving the Excel, it was first validated by
comparing information in it with physical Talouselämä 500+ -listings and, as
mentioned before, Voitto+ database was also utilized to ensure firms financial
figures. After this validation process the actual analysis was conducted.
First step in the analysis process was tabulating all the different data of the different
variables. Data set was organized so that all the 100 companies were in different
rows and information on the variables was in columns. After this arranging, all the
information on individual company would be in a single row, which is sensible
starting point for the statistical analysis. All the mathematical and statistical figures
have been calculated with Microsoft Excel with one exception. The multivariable
regression of all the three variables was conducted with StatsModels, which is a
module for Python programming language. Simple regressions with single variables
were conducted with Microsoft Excel by using Analysis Toolpack which is an
included feature in the software. All the tables and charts presented in various parts
of this thesis have been made also with Microsoft Excel.

43
5 EMPIRICAL FINDINGS
This chapter presents the findings from the empirical study. Emphasis is put on the
regression results, which are the ones answering to hypothesizes formed in the
theoretical part. A minor reflection to previous studies and theory is made already
here, but main body of the discussion is in next chapter. Regression results of each
financial factor and growth are presented in the same order as in the theoretical part,
starting on with investments. A multivariable regression of all the three factors on
growth is exhibited after simple regressions.
All the statistical analysis has been calculated with median values of individual
firms. For instance, median revenue growth from the nine-year timeline, scope of this
study, is regressed with median value of investments for the same period. Median
was chosen as a statistical method, rather than using mean, to decrease the effect that
extreme figures could have. Finally, it was decided that all the regression results are
presented also graphically, rather than showing only mathematical regression tables.
Study by Soyer & Hogarth (2012) argues that graphical presentation of regression
results makes findings easier to absorb, especially for readers who are not that
familiar with statistical studies or regression analysis.
5.1 Relation of investments and growth
As we saw in theoretical part, literature review on relationship of investments and
growth gave a clear reason to expect that investments do have a positive correlation
with growth. Accordingly, a hypothesis was formed to test if this finding is true also
in the context of companies studied in this study.
To test this hypothesis, a single variable regression analysis is used. Revenue growth
percentage of the companies is used as a dependent variable and investments as a
predictor variable. Firstly, R-squared value of 15,8 % is relative low, which indicates
that the model explains little of the variability (low R-squared value is best visible in
figure 4 on page 45, which shows graphical presentation of the regression results).
Secondly, quantity of companies included in the regression is 55 from the total of
100 companies in the dataset. This is due to the fact that all the necessary data, such
as amount of investments, was not available for all the companies in the dataset.

44
These limitations in regression are further discussed in conclusion chapter. Amount
of investments in the regression is share of total investments from total revenue of a
company, e.g. a company with median investments of 1 million and 50 million
revenue would get 0.5 as investments percentage. The regression summary is
presented in table 1 below.
Table 1: single variable regression of investment on growth
Dependent variable: growth % Sample: 2007 - 2015
Binary variable ( = 1 if good time, = 0 otherwise) R2: 0,1584
Observations: 55
Independent variables Coefficients
Intercept
0,0076 (0,0109)
Investments 0,6065*** (0,1920)
Notes: standard errors are given in parentheses, significance levels are expressed as:
*** (1% significance level), ** (5% significance level), * (10% significance level).
Consistent with the hypothesis 1 (investments have a positive relationship with
growth of a company), key finding from the regression analysis is that investments
do have a significant positive relationship with growth of a company. Coefficient of
investments (0,6065***) is highly positive with a p-value that indicates very
significant significance level.
Figure 4, on the following page, presents graphically the same regression results of
investments on growth. As mentioned earlier, the low R-squared value (15,8 %) is
easier to observe from graphical figure than from the table summarizing results in a
text format. Plainly put, R-squared measures how much variance a model can explain
and the more variance is accounted for by the regression model the closer the data
points will fall to the fitter regression line. In figure 4, this is not the case as a major
share of the observation points are distributed quite far from the regression line.
Interpretation of low R-square in most cases is that model cannot produce prediction
that are reasonable precise. However, regardless of the R-squared, model can still

45
show statistically significant predictors, which means that conclusions about the
relationship of predictor and dependent variable can be drawn.
Predicted revenue growth visible on orange color is result of a linear regression
calculation based on the data. As can be clearly seen in the figure, linear regression
result shows that the higher the amount of investments made, the higher is also
expected revenue growth. As mentioned, this result confirms the hypothesis about
the effect that investments have on growth of a firm and is also in line with the wider
body of academic literature presented in theoretical part (e.g. Scherer 1965, Stam &
Wennberg 2009, Deschryvere 2014, Capasso & Treibich & Verspagen 2015, Vasić
& Kecman & Mladenović 2016.) Interesting observation is that there is no single
firm having a negative revenue growth if investments are higher than 2.7
percentages. So, based on this set of data it seems that, to ensure growth, a firm
should invest amount that equals to at least 2.8 percentage of revenue. Naturally, this
is more a side observation, than a universal all company’s suitable truth from which a
conclusion could be drawn.
Further discussion regarding implications of these results and how it relates to
theoretical literature will be done in chapter 6. Next, regression results of equity ratio
and company growth are presented.
-15%
-10%
-5%
0%
5%
10%
15%
20%
25%
30%
0% 5% 10% 15% 20% 25%
Gro
wth
%
Investments
Observation Predicted growth % Linear (Predicted growth %)
Figure 4: regression analysis of investments on growth (n =55)

46
5.2 Relation of equity ratio and growth
In the theoretical part, it was found that a large body of literature supports the view
that some amount of debt is good to have, but a too low equity ratio reduces growth
of a firm. Furthermore, previous researches argued that low equity ratio poses actual
risks, especially in times of bad economic conditions, in the form of possible
bankruptcy or losing control of the company to debtors. Literature review on
relationship of equity ratio and growth gave a clear reason to expect that equity ratio
has a positive correlation with growth. Accordingly, a hypothesis was formed to test
if this finding is true also in the context of companies studied in this study.
To test this hypothesis, a single variable regression analysis is used. Revenue growth
percentage of the companies is used as a dependent variable and equity ratio as a
predictor variable. Firstly, R-squared value of 15,2 % is relative low, which indicates
that the model explains little of the variability (low R-squared value is once again
easier to observe graphically from figure 5 on next page) Secondly, quantity of
companies included in the regression is 47 from the total of 100 companies in the
dataset. This is because all the necessary data, in this case equity ratio, was not
available for all the companies in the dataset. These limitations in regression are
further discussed in the conclusion chapter. The regression summary is presented in
table 2 below.
Table 2: single variable regression of equity ratio on growth
Dependent variable: growth % Sample: 2007 - 2015
Binary variable ( = 1 if good time, = 0 otherwise) R2: 0,1519
Observations: 47
Independent variables Coefficients
Intercept
-0,0284 (0,0224)
Equity ratio 0,1304*** (0,0459)
Notes: standard errors are given in parentheses, significance levels are expressed as:
*** (1% significance level), ** (5% significance level), * (10% significance level).

47
Consistent with the hypothesis 2 (equity ratio has a positive relationship with growth
of a company), the regression analysis confirms that equity ratio has a positive
relationship with growth of a company. Coefficient of investments (0,1304***) is
positive and has significance level of 1 %, which indicates statistically very
significant result.
Figure 5 below shows graphically the same regression results of equity ratio on
growth of a company. As was the case with regression of investments on growth,
data points are distributed quite far from the regression line, which is statistically
measured as a relatively low R-squared (15,2 %). Nevertheless, regression results
indicate clearly that firms with higher equity ratios, in other words less debt leverage,
have had higher growth rates among companies used in this study.
Furthermore, from the total of 48 companies used in regression, 12 (25 %) had
negative median growth percentage. These firms with negative growth have
principally relatively low equity ratio: median 33.0 % and average 35.4 %, while
same values for companies with positive growth are 47.0 % and 48.2 %, respectively.
This, toward same overall conclusion pointing, result of course is also visible in
linear regression line. Secondly, only 19 companies, or ~ 40 percentages from total,
-15%
-10%
-5%
0%
5%
10%
15%
20%
25%
0% 10% 20% 30% 40% 50% 60% 70% 80% 90%
Gro
wth
%
Equity ratio
Observation Predicted growth % Linear (Predicted growth %)
Figure 5: regression analysis of equity ratio on growth (n =47)

48
have equity ratio higher than 49.9 %, indicating that the major share of companies is
leveraged with an amount of debt that equals to larger figure than firm’s own equity.
Further discussion regarding implications of these results will be done in chapter 6.
Next, regression results of gearing ratio on growth are presented.
5.3 Relation of gearing and growth
Existing academic studies showed findings that some amount of debt is good to have,
but a too high gearing reduces growth of a firm. Furthermore, previous researches
argued that high gearing poses actual risks, for instance in the form of possible
bankruptcy or losing control of the company to debtors. Literature review on
relationship of gearing and growth gave a clear reason to expect that rising level of
gearing has a negative correlation with growth of a company. Therefore, a hypothesis
was formed to test if this theoretical finding holds in the context of companies
studied in this thesis.
To test this hypothesis, a single variable regression analysis is used. Revenue growth
of the companies is used as a dependent variable and gearing as a predictor variable.
Firstly, R-squared value of 1,6 % is very low, which indicates that the model
explains little of the variability. Secondly, quantity of companies included in the
regression is 44 from the total of 100 companies in the population. This is due to the
fact that all the necessary data, such as amount of investments, was not available for
all the companies in the dataset. These limitations in the regression are further
discussed in conclusion chapter. The regression summary is presented in table 3 on
the following page.

49
Table 3: single variable regression of gearing on growth
Dependent variable: growth % Sample: 2007 - 2015
Binary variable ( = 1 if good time, = 0 otherwise) R2: 0,0160
Observations: 44
Independent variables Coefficients
Intercept
0,0382 (0,0106)
Gearing -0,008 (0,0107)
Notes: standard errors are given in parentheses, significance levels are expressed as:
*** (1% significance level), ** (5% significance level), * (10% significance level)
The hypothesis 3, which was formed in the theoretical part, was: gearing has a
negative relationship with growth of a company. Result from the regression analysis
is that gearing has a negative relationship with growth of a company. Coefficient of
investments (-0,008) is slightly negative, but the result is no statistically significant
as the P-value is very high. Consequently, this finding cannot be interpreted as a
meaningful result, which signifies that neither the hypothesis cannot be confirmed
nor unconfirmed.
Figure 6 on page 50 presents graphically the regression results with gearing on
revenue growth. First of all, important note regarding viewing the figure is that, as
we can see, gearing can have both negative and positive numerical values. Negative
gearing means that company is debt free. In practice this means that firm do not have
any interest-bearing debt, or that it could pay all those debts from cash reverse
immediately. Second observation is related to overall distribution of firms in the
chart. There is very small number of companies with extreme-high gearing, four
companies with higher than 200 % gearing to be precise.
Linear regression line visible in orange shows a slight correlation of lower gearing
resulting to higher company growth. Although, individual companies with
significantly higher than average gearing have achieved a positive growth figures,
more viable strategy based on regression results is to have lower gearing, or debt

50
level, if target of a firm is to have high growth. Linear regression line shows positive
growth even with extremely high gearing levels, such as 350 %, however, low
number of perception points on high levels (only four companies with higher than
150 gearing) means that there is uncertainty in that part of regression. Therefore, it
cannot be concluded that very high gearing levels would in average come hand in
hand with positive growth figures. On the contrary, the opposite can be stated based
on the results of regression analysis, in the 100 companies used in this thesis there is
a significant correlation towards higher growth with lower gearing ratios.
Further discussion regarding implications of these results will be done in chapter 6.
Next section of the empirical part presents results of multivariable regression of
investments, equity ratio and gearing on growth.
-15%
-10%
-5%
0%
5%
10%
15%
20%
25%
-100% 0% 100% 200% 300% 400%
Reve
nue
grow
th %
Gearing %
Observation Predicted growth % Linear (Predicted growth %)
Figure 6: regression analysis of gearing on growth (n =44)

51
5.4 Multivariable regression
Multivariable regression of all the three variables on growth was done to further test
the set hypotheses. The main difference compared to single variable regressions is
difference in observation size, as requirement for multivariable regression is that
information on all the three variables is available, rather than requiring only
information of one independent variable as is the case with single variable
regressions. Additionally, the multivariable regressions tests simultaneously impact
of all the chosen independent variables on the dependent variable. Furthermore, as
results of the single variable regressions indicated that investments is the most
statistically significant variable, with multivariable regression can be tested if model
with more than one independent variable explains the dependent variable (growth)
statistically in a clearer way. It can be expected that multivariable regression has
higher R-squared and thus, model explains variability more effectively as the studied
population, which the regressions are to be tested, is the same.
Quantity of companies included in the regression is 40 from the total of 100
companies in the population. This is due to the fact that all the necessary data, which
in the case of multivariable regression is amount of investments, equity ratio and
gearing, was not available for all the companies in the dataset. These limitations in
the regression are further discussed in the conclusion chapter.
Revenue growth of the companies is used as a dependent variable and investments,
equity ratio and gearing as predictor variables. Firstly, R-squared value of 29,4 % is
moderately low, which indicates that the model does not explain variability in the
best possible way. However, R-squared is now significantly higher than it was in any
of the three simple regression models. Clear interpretation from this is that
multivariable regression explains variability better than simple regression models.
The regression summary is presented in table 4 on the following page.

52
Table 4: multivariable regression of investments, equity ratio and gearing on growth
Dependent variable: growth %
Sample: 2007 - 2015
Binary variable ( = 1 if good time, = 0 otherwise) R2: 0,294
Observations: 40
Independent variables Coefficients
Intercept 0,0070
(0,0300)
Investments
0,6810*** (0,1910)
Equity ratio
0,0151 (0,0580)
Gearing -0,0194* (0,0110)
Notes: standard errors are given in parentheses, significance levels are expressed as:
*** (1% significance level), ** (5% significance level), * (10% significance level)
The multivariable regression analysis still confirms hypothesis 1 (investments have a
positive relationship with growth of a company) with a highly positive coefficient
(0,6810***), which is statistically very significant result. On the contrary, the
regression analysis does not confirm that there is a direct relationship between equity
ratio and growth, as well as, gearing and growth. Coefficient of equity ratio (0,0151)
is relatively low and statistically non-significant. Coefficient of gearing (-0,0194) is
also only slightly different from zero and has only low significance level.
Consequently multivariable regression results cannot confirm hypothesis 2 (equity
ratio has a positive relationship with growth of a company) and hypothesis 3
(gearing has a negative relationship with growth of a company) as neither result is
statistically in a reasonable significance level.
Furthermore, reason why results of the multivariable regression are not presented
graphically is that a 2-dimensional fitted line plot, which Excel produces, can only
display results from simple regression, which has only one independent variable or
predictor variable. Multiple linear regressions would require a graph with higher
dimensions, which cannot be graphed with the tools used in the making of this study.
Additional discussion regarding implications of these results will be done in
discussion chapter. Next section of the empirical part looks at growing and shrinking

53
companies within the 100 firms. Two different groups of companies are formed to
further make observations and help in drawing conclusion about the studied subject.
5.5 Further look on the importance of financial factors
This part looks more closely at the differences between growing and shrinking
companies, and as before, measure of growth is revenue. From the dataset of 100
companies, two groups have been divided: 20 top performing companies and 20
worst performing companies. Groups have been divided by calculating relative
change in revenue, so percentage change rather than absolute sums, in the same 9-
year timeline from 2007 to 2015, which has been used throughout this thesis. After
this, median revenue for both groups on each year has been calculated.
Figure 7 on the next page displays how median revenue of the two groups has grown
since the financial crisis. As we see, development has been really two-fold. In fact,
bottom 20 companies have higher revenue in 2007 before the financial crisis hits. In
2008, top 20 companies grow faster and overtake bottom group but difference is not
significant, less than 3000 euros. Year 2009 is the true deal breaker; bottom 20
companies shrink heavily while top 20 companies manage to grow their revenue
even in the time of financial crisis. Between 2009 and 2011 both groups are heading
once again to same direction as bottom group also manages to find more sales after
the crisis, although, top 20 companies grow faster during this time also.
2012 is the point from where onwards the two group of firm’s head to opposite
directions. Top 20 companies achieve every year higher median sales numbers as a
group, while bottom 20 companies shrink every year all the way to last year of the
study. In 2007, bottom 20 companies had higher revenue by 5 000 euros. In 2015, the
advantage is almost 67 000 € for top 20 companies. If we look at the relative change,
median revenue of top 20 companies has grown by 75 %. At the same time, sales of
bottom 20 companies fell by 24 %. This means that in 2015 top performing group is
more than double the size of bottom group, if measured by revenue.

54
What could explain this significant difference in growth development between these
two groups of firms? By looking at figure 7 one could easily reason that anticipation
by companies to effects of the financial crisis of 2008 has been totally different as
one of the biggest year-on-year change between the groups happened in the
aftermath of crisis. Second observation is that, as we saw Finland’s downward
heading economic development in the introduction part of this thesis, development of
bottom 20 group has been very much a like with the development of Finland. Could
it be that these companies are much heavily influenced by home markets, and high
growing companies have better footstep in global markets?
To take the analysis of these two groups to next level, following chapters presents
median amounts of the three variables. By looking at numerical differences in
financial ratios, rather than by making simple observations from the revenue figure,
it is expected that more observations are to be found regarding what might have
affected to the radically different development of top and bottom companies.
0
20,000
40,000
60,000
80,000
100,000
120,000
140,000
2007 2008 2009 2010 2011 2012 2013 2014 2015
Median revenue (in thousands €)
Top 20 companies Bottom 20 companies
Figure 7: median revenue of top 20 and bottom 20 companies.

55
5.5.1 Investments in top and bottom performing companies
Chapter 5.1. presented findings about linear regression of investments on growth.
The result was that investments have statistically significant positive correlation on
growth. Could differences in amounts of investments, therefore, explain why the
group of top 20 companies has grown significantly while bottom 20 companies have
seen their revenue to decrease?
A quick glance on figure 8 on the following page immediately reveals that the two
groups have a notable difference in investments (this key finding is the same also
with mean, but here only graph showing median values is presented as per choice of
statistical expression, which was briefly discussed on page 44). At the beginning of
our timeline, top 20 companies made almost four times more investments than
bottom 20 companies.
The most interesting result in this examination is that as investments by top 20
companies vary cyclically between the years, bottom 20 companies make practically
same amount of investments all the time with only significant difference after 2013.
So, top group seems to behave in way that could be expected by literature review.
Firms cut investments in a time of difficult economic situation, and vice versa, invest
in times of better times. So, firms see investing as a luxury that is only possible to do
when economic situation is stable enough (Deans et al. 2009, Kitching et al. 2009,
García-Manjón & Romero-Merino 2012.) This is what top 20 companies seem to do.
Investments are cut more by a half when the financial crisis of 2008 hits. After that
amount of investments pick-up once again until a new cut occurs in 2012.

56
Bottom 20 companies do not behave at all in the way mentioned in the existing
literature. No cuts to investments have been made in the aftermath of the financial
crisis of 2008, nor was there rises to investments in time of economic recovery. For
bottom group, only significant cuts to investments have happened in 2014 and 2015,
however, we cannot conclude what is the driver of this decrease: economic downturn
or financially unstable situation which might be consequence of long-term shrinking
in revenue.
Discussion which connects the results further to previous literature takes place in
chapter 6. Theoretical concepts relating to investments, such as time-lag and results
of the top 20 and bottom 20 groups are also done there. Next chapter presents equity
ratios of top and bottom groups.
5.5.2 Equity ratio in top and bottom performing companies
Single regression results of equity ratio on growth showed a statistically significant
positive relation between equity ratio and growth of a company. Based on this
finding, it would be reasonable to expect that the group of top 20 companies would
0.0 %
1.0 %
2.0 %
3.0 %
4.0 %
5.0 %
6.0 %
7.0 %
8.0 %
2007 2008 2009 2010 2011 2012 2013 2014 2015
Median investments / revenue
Top 20 Companies Bottom 20 Companies
Figure 8: median investments per revenue of top 20 and bottom 20 companies
(n=55).

57
have notable higher equity ratio levels than the group of bottom 20 companies. This
behavior could also be expected based on findings in the literature review.
Figure 9 above shows how the equity ratio has developed between the two groups
between 2007 and 2015. The groups have close to identical median equity ratios in
start of the timeline. The financial crisis of 2008, affected equity ratio of the two
groups in a very similar way as was its impact on revenue (see page 54). Group of
top firms managed to grow their equity ratio, i.e. decrease their debt leverage in
economically turmoil time, meanwhile, bottom firms once again had opposite
development and saw their equity ratio decreasing, or debt leverage increasing.
However, key difference to previous comparisons is that after 2010 equity ratio of
top firms starts to decrease and bottom companies grow their equity ratio in a way
that in 2012 and 2013 the two groups have practically identical median equity ratio
again. Down heading trend returned in 2014, but this time both groups move to the
same direction.
Couple of other observations also arises from the findings regarding development of
equity ratio between the groups. Firstly, relatively small differences, and even
identical ratios at times, between the two groups indicate that equity ratio might not
0
10
20
30
40
50
60
2007 2008 2009 2010 2011 2012 2013 2014 2015
Median equity ratio
Top 20 Companies Bottom 20 Companies
Figure 9: median equity ratio of top 20 and bottom 20 companies (n=47).

58
have such a significant influence on growth after all. At least, not from the point
view of the firms selected to these two groups. Of course, this analysis is against the
results that we found with regression analysis in previous chapters. Furthermore, it
could also be that significant drop in the equity ratio, as happened to bottom group in
2009, is already enough to cause decreasing revenue success from 2011 onwards, if
we assume some sort of time-lag phenomena here too.
Secondly, if we look at years around the financial crisis of 2008, relationship
between equity ratio and growth could also be that shrinking revenue resulted in
decreasing equity ratio in the case of bottom 20 companies and not the other way
around as expected in the regression analysis. Then again, this would not explain
why bottom 20 companies succeed to increase equity ratio during periods of
decreasing sales, such as 2012-2013. Interesting question, and topic even for further
research, would be to research how poorly performing companies with shrinking
revenue manage to balance their equity ratio back to same level with fast growing
companies. In this paper this observation is not studied as it is not part of the research
problem and scope of the thesis.
Third and final point is that group of top 20 companies have had decreasing equity
ratio figures from 2010 onwards. Could this be result from using more debt leverage
at times of economic growth, as mentioned in the literature, when companies with
stable capital structure are using more debt to finance growth projects? This line of
argument was presented, among others, by Myers (1977), Petrunia (2007) and Kiani
et al. (2012), as we saw in chapter about literature review on equity ratio and growth.
Discussion on potential implications that the presented results on equity ratio might
have in wider scale is continued in chapter 6. Next, we look at the third and final
financial ratio in the context of the two groups.
5.5.3 Gearing in top and bottom performing companies
As was presented in the previous section of the empirical part, regression results of
gearing on growth did not confirm the hypothesis that gearing has a negative impact
on growth. Simple regression model indicated statistically non-significant results and
multivariable regression showed only low significance level for relation of gearing

59
and growth. Negative coefficient, which gearing got from both regression models, is
in line with the previous academic but those cannot be interpreted as statistically
significant results. Thus, there is no reason to expect notably different gearing ratios
in the comparison of top 20 and bottom 20 companies.
Results of the comparison are visible below on figure 10, which shows development
of gearing for both groups of companies. If we do not take last two years into
account, the overall trend of the figure is very similar to equity ratio. Both top and
bottom groups have almost identical equity ratio at the starting point in 2007.
Diverging starts in 2008, and in 2009 after the financial crisis median gearing of
bottom firms is almost double to that of top companies. Continuing just like with the
equity ratio, in 2010 groups start to move closer to each other and during 2011-2012
bottom firms even have a lower median gearing than the top companies. 2013 is the
last year when gearing levels of the two groups are within a relatively small area. In
2014 gearing of the bottom group skyrockets, while group of top companies starts to
head towards lower levels. 2015 shows continuation to this trend.
Another interesting discovery is that all the way until 2014, also gearing of bottom
20 companies is relatively low and on similar levels as top 20 companies have.
0
20
40
60
80
100
120
140
2007 2008 2009 2010 2011 2012 2013 2014 2015
Median gearing
Top 20 Companies Bottom 20 Companies
Figure 10: median gearing of top 20 and bottom 20 companies (n=44).

60
Interpretation from this kind of simple comparison analysis would be very similar to
the findings from regression: as the gearing levels are within close levels between the
two groups it indicates that the effect that gearing has on growth is not significant, at
least, when making analysis based on the data used in this thesis. There is of course
the possibility that gearing also has a time lag effect, as existing literature argued that
investments have. Meaning that gearing ratios from time before 2007, which is a
starting point of this study, could have effect on development of growth between
2007 and 2015.
Final note is that relationship between gearing and growth could also be reverse.
Signifying that perhaps it was shrinking revenue which resulted in higher gearing in
the case of the bottom 20 companies and not the other way around as expected in the
regression analysis. On the other hand, as was the case with equity ratio, this would
not explain how the bottom companies managed to decrease gearing during periods
of decreasing revenue, which was witnessed during 2012-2013. Same thinking for
the group of top companies would be that why gearing level increased multiple times
during studied time line? The top group achieved constantly rising revenue numbers
so, with this analogy, gearing should not have increased at all. Common logic, which
is based on the literature, could be that growing companies funded projects,
expansions, etc. with debt, which would naturally lead to higher gearing.
Now, after presenting the findings that have arisen from the empirical analysis, it is
time to tie together results from both the theoretical and empirical sections. This
combining is done in discussion chapter, which starts from the following page.
61
6 DISCUSSION
Discussion part consists of three parts with the aim to look deeper at the findings we
got from the empirical study and reflect those findings on the previous academic
literature, which was presented in the theoretical part. The three parts are in the same
order, in which, the financial factors have been presented throughout the thesis.
Therefore, first part discusses investments and growth, second part addresses equity
ratio and growth, and third part discourses gearing and growth.
6.1 Investments and growth
Theoretical part was started by chapter 2.1, which presented existing literature
relating to relation of investments and growth. It painted a clear picture about the
positive effect that investments have on growth of a company. Basic logic for
investments was presented already in the 1930s by Joseph Schumpeter (1934) who
presented the idea about creative destruction. Firms invest in order to be more
efficient, innovate, and creating something new, so that there would be fewer
competitors. A wide body of literature argued that that investments in research &
development seem to have the most notable impact on growth of a company (see e.g.
Liu & Hsu 2006, Coad & Rao 2010, Hall & Lerner 2010, Yujun et al. 2011, García-
Manjón & Romero-Merino 2012, Capasso & Treibich & Verspagen 2015.) Studies
from different countries and different industries presented very similar results. Hall
(1987) made research with the firms from the United States, Scherer (1965) studied
large corporations also in the U.S., and in a more recent study Yasuda (2005) looked
at companies in Japan. The most recent study is by Vasić, Kecman and Mladenović
(2016) who studied the effect that investments have on growth in multiple different
EU-countries with country level data. Finally, we looked at the study made in
Finland with SMEs and large firms. This research by Deschryvere (2014) was made
using vector-auto regression model, which showed strong correlation between
investments and revenue growth. To conclude, all these researches showed similar
findings and concluded that investments have significant positive effect, or
correlation, to growth of a company.
62
Based on this large body of existing literature and prior empirical research a
hypothesis 1 (investments have a positive relationship with growth of a company)
was formed and tested. Findings from the single variable regression showed a
statistically significant positive relation between investments and growth (see table 1
on page 45). The model had a relatively low R-squared value, which implies that a
low amount of observation points is explained by a linear model. However, the
regression results showed investments to be statistically very significant predictor
(0,6065***), which means that conclusions about how relationship of predictor and
dependent variable can be drawn. Multivariable regression model had higher R-
squared value and, additionally showed also statistically very significant positive
regression of investments on growth (0,6810***). Consequently, in the case of the
first hypothesis, conclusion is that investments have a positive relationship with
growth of a company and, thus, hypothesis can be confirmed.
In addition to presenting regression results in a traditional table model a graphical
figure was also shown. Linear regression line displays that the positive effect on
growth starts already from the very low level of investments, which means that,
based on the regression results, a company that first has zero investments can expect
positive effect on growth already when investments are positive, meaning that firm
makes investments. These results confirm the arguments of wider body of academic
literature presented in literature review. However, it is important to note that this, of
course, does not mean that every single investment would have positive effect on
growth. There, for sure, are investment opportunities that companies could make, and
investments they execute, that have no positive effect on growth of a firm. These are
simply called bad investments or investments having negative effect.
When looked at the critical voices regarding the subject, the most notable critic came
from Hölzl (2009) who argued that actual causality from research and development
investments to company growth cannot be found, that is at least, in his study. This
line of critic was partly answered before Hölzl published his own study, and, in
studies published later. Klomp and Van Leeuwen (2001) suggested that the effect
which investments have on growth is studied often only within a timeline of one or
two years after the investment expenditure, which is a too short timeframe. Coad and
Rao (2010) supported this suggestion in their own study and argued that it could in

63
fact take several years before the effect from investments is truly visible. Other
studies talk about “time lag” as a concept to address the problem that investments do
not show immediately as a growth (e.g. Yujun et al. 2011, García-Manjón &
Romero-Merino 2012, Capasso & Treibich & Verspagen 2015.) As the regression
study in this thesis was made only within time-period of nine years, and no shorter
timelines were studied from the dataset, it is practically impossible to take stand on
the conversation started by Hölzl. Regression results of this thesis only confirm that
within a relatively long time frame, nine years, investments have statistically
significant positive effect on growth of a company. If there is time lag in investments
it is shorter than nine years based on the findings.
Besides regression results, we had chapter 5.4.1 looking at the differences in
investments made by the group of top performing companies and bottom performing
companies in the dataset. Results from this comparison support both previous
academic literature and findings of the regression analysis of this thesis. Group of top
companies had made significantly more investments, when compared relatively
based on amount of revenue, than the group of bottom companies. These results
highlight further the importance which investments seem to play in firms’ growth. To
the possible time lag effect that investments might have this comparison of the two
groups offered little new. The bottom group had stable or shrinking investments
during the whole nine-year period, and revenue of the top group was upward heading
the whole time-period, even though, there were many years with significant cuts in
investments, for instance, the years around the financial crisis of 2008. Time lag in
investments could exist but this study cannot conclude its existence as there is no
consisting evidence in the findings.
6.2 Equity ratio and growth
In the theoretical section, chapter 3.2. looked on literature about equity ratio and
growth. Based on the previous studies it was concluded that the major part of
researchers believes that companies should not have equity ratio of 100 percentages,
meaning that companies should use some level of debt. This line of arguments comes
from the corporate finance literature, which clearly indicates that optimal capital
structure of a firm has, at least, some level of leverage, or debt in other words (see
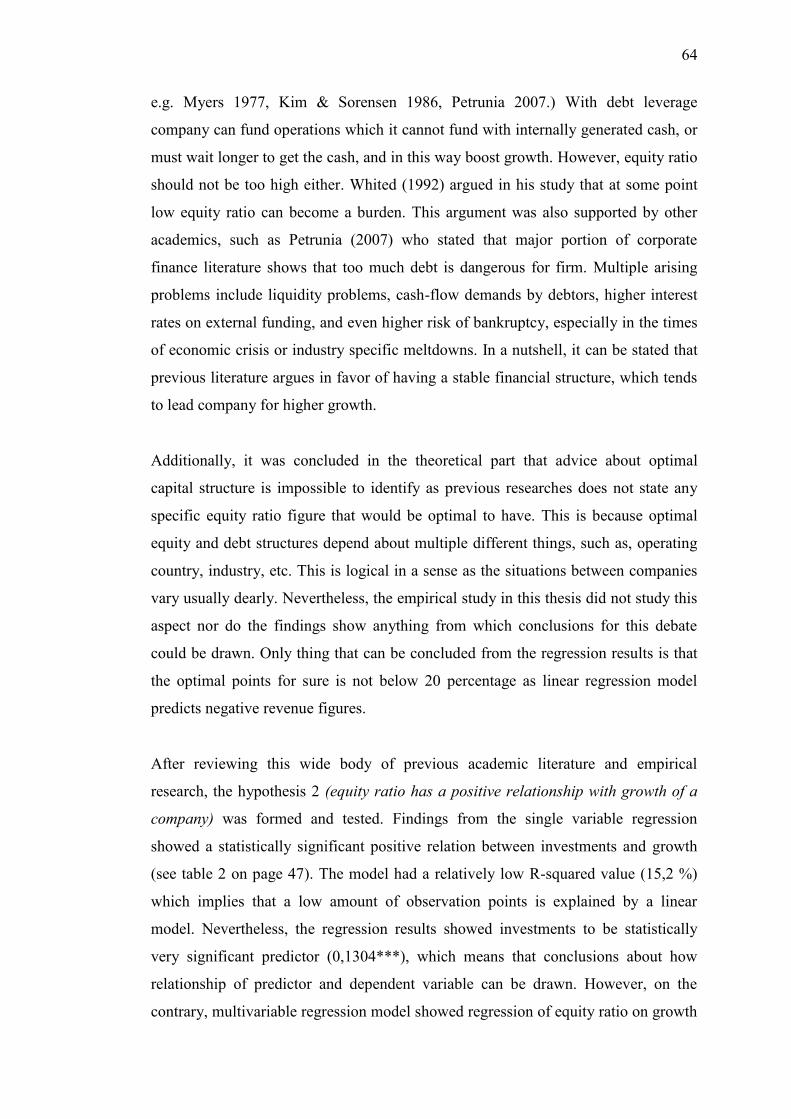
64
e.g. Myers 1977, Kim & Sorensen 1986, Petrunia 2007.) With debt leverage
company can fund operations which it cannot fund with internally generated cash, or
must wait longer to get the cash, and in this way boost growth. However, equity ratio
should not be too high either. Whited (1992) argued in his study that at some point
low equity ratio can become a burden. This argument was also supported by other
academics, such as Petrunia (2007) who stated that major portion of corporate
finance literature shows that too much debt is dangerous for firm. Multiple arising
problems include liquidity problems, cash-flow demands by debtors, higher interest
rates on external funding, and even higher risk of bankruptcy, especially in the times
of economic crisis or industry specific meltdowns. In a nutshell, it can be stated that
previous literature argues in favor of having a stable financial structure, which tends
to lead company for higher growth.
Additionally, it was concluded in the theoretical part that advice about optimal
capital structure is impossible to identify as previous researches does not state any
specific equity ratio figure that would be optimal to have. This is because optimal
equity and debt structures depend about multiple different things, such as, operating
country, industry, etc. This is logical in a sense as the situations between companies
vary usually dearly. Nevertheless, the empirical study in this thesis did not study this
aspect nor do the findings show anything from which conclusions for this debate
could be drawn. Only thing that can be concluded from the regression results is that
the optimal points for sure is not below 20 percentage as linear regression model
predicts negative revenue figures.
After reviewing this wide body of previous academic literature and empirical
research, the hypothesis 2 (equity ratio has a positive relationship with growth of a
company) was formed and tested. Findings from the single variable regression
showed a statistically significant positive relation between investments and growth
(see table 2 on page 47). The model had a relatively low R-squared value (15,2 %)
which implies that a low amount of observation points is explained by a linear
model. Nevertheless, the regression results showed investments to be statistically
very significant predictor (0,1304***), which means that conclusions about how
relationship of predictor and dependent variable can be drawn. However, on the
contrary, multivariable regression model showed regression of equity ratio on growth

65
to be practically non-existent. Coefficient was very low (0,0151) and it was not
statistically significant observation. Interpretation from this is that as multivariable
regression cannot confirm or reject the hypothesis 2, as result is not statistically
significant, the single variable regression is a better fitted model. Thus, equity ratio
seems to have a positive relationship with growth of a company and hypothesis can
be confirmed.
Findings based on the comparison of the top and bottom performing companies,
which were presented on chapter 5.5.3, show only a mild difference between the
groups. At the starting year of study in 2007 the median equity ratio of the top and
bottom groups was practically on same level, difference was less than three
percentage points. The financial crisis of 2008 altered the situation when equity ratio
of the bottom group started to fall but the groups were back within same levels again
in 2012-2013. First conclusion from these findings is that as differences in equity
ratio is much smaller than what the groups had in investments the effect that equity
ratio has on growth is smaller. Although the results still paint a clear picture as the
top group of companies have higher or same equity ratio percentage during all the
nine-years used in this thesis. Secondly, rather than being an effective factor on
growth, it could be that the relationship between equity ratio and growth of a firm is
the opposite. Meaning that negative growth could cause lower equity ratio and vice
versa. Finally, it is important to point out that, as this comparison of median equity
ratio levels of two different groups of companies is less relevant scientifically, the
overall conclusion is drawn based on the results of the regression analysis.
6.3 Growth and gearing
The main finding from the literature review on gearing was that existing literature
argues that too high debt level is risky for a company to have. These conclusions
were presented in studies showing both theoretical and empirical results. Mainly the
articles by Petrunia (2007), Kiani et al. (2012) and lastly by Hussain (2011) who
made a study using multiple factors in empirical analysis. All the three studies had
similar conclusion: too high gearing can be a restrictive element for firm’s growth,
instead of boosting for more rapid growth. Hussain points out that especially long
term interest bearing debt is the risky one and should be put under close look in

66
companies. Ulrich & Arlow (1980) stated that too high gearing level could even
eventually result that owners lose the control of a company to debtors, or that the
firms goes under, i.e. declares bankruptcy. This argument presented by Ulrich &
Arlow was also concluded in multiple other studies (e.g. Myers 1977, Lang & Ofek
& Stulz 1996, Liu & Hsu 2006, Petrunia 2007.) In a nutshell, same issue holds with
gearing as did with equity ratio. Too high amount of debt is expected to restrict
firms’ future growth.
This is also what the regression results presented in the empirical part of this study
showed. After the literature review on gearing, a hypothesis 3 (gearing has a
negative relationship with growth of a company) was formed based on existing
literature. In the empirical analysis this hypothesis was tested, first starting with
single variable regression. Findings from the single variable regression showed a
statistically non-significant result and the coefficient differed only minimally from
zero (-0,008). Consistent with this result, the multivariable regression indicated low
correlation (-0,0194*), which had statistically low significance as the p-value was
relatively high. Interpretation from both regressions is that, as neither result has
eligible statistical significance level, the hypothesis 3 cannot be confirmed. This is
rather surprising finding and is contrary to the existing literature discussed above.
Wide body of literature argues that too high levels of debt, or leverage, will start to
shrink growth of a company or even bring negative growth. However, interestingly
results from the regression analysis of gearing on growth do not show results that
would be in line with existing academic studies. Empirical results indicate that effect
which gearing has on growth is not meaningful, at least, not statistically.
When looked at the comparison of median gearing ratios between the top and bottom
performed groups (see chapter 5.4.3) a lot of same observations, once again, hold
with gearing as did with equity ratio. The two groups have practically identical
gearing at the starting point in 2007, and then move to opposite directions after the
financial crisis but come very close to each other again in 2011. Drastically different
gearing levels can be found only on the last two years of the dataset, 2014-2015,
when gearing of the bottom group has skyrocketed and the top group has lowered its
amount of leverage. The median gearing levels of the two groups do not behave in a
way that one could expect based on the previous literature. Even the difference

67
between the two groups in the aftermath of the financial crisis in 2009 is not
significant if we think it through guideline values for gearing, which can be found on
table 1 on page 43. In 2008 and 2009 both have gearing percentages which belong to
same category in guideline values, and particularly that category is good (gearing
between 10 – 60 %). However, if we think about differences in growth and gearing
guideline values it could be, in fact, logical that gearing seems to be the most
unimportant factor on growth. Even the bottom group has gearing below 120 every
year prior to 2014, and still in 2014-2015 it is only mildly over 120. Guideline value
table gearing shows that even gearing of 120 is still satisfying. Satisfying, by
definition, stands for something that is good enough, not excellent nor bad but
satisfying. If compared gearings between the two groups only with these verbal
guideline values, and if we believe that those verbal definitions are absolute, it might
make sense that gearing seems to have not that much effect on growth of a company.
Before moving to final chapter of this thesis a short conclusion of the previous
discussion about three different financial factors and their effect on growth is in
order. Based on the empirical results it can be clearly stated that investments had the
most significant positive impact on growth of a firm. These findings regarding
investments were also in line with the previous academic literature. Factor with
second largest impact on growth was observed to be equity ratio. Results of the
comparison of the equity ratio of the two groups might not been as apparent but,
nevertheless, the regression result showed statistically significant positive
relationship between equity ratio and growth. Third and last studied factor was
gearing, which also was concluded to have the least impact on growth when
compared to other two financial factors studied in this thesis. With these final words
on discussion part, it is now time to head for conclusion part of this thesis.

68
7 CONCLUSION
This final chapter of the thesis presents main findings of the study based on both
theoretical and empirical work. The results of this thesis have allowed author to
formulate multiple general conclusions and to also make recommendations on how
financial ratios can be used in managing a growing. Finally, we will look at the
limitations of this study and suggestions for future research.
7.1 Main findings of the study
The objective of the study was to examine what kind of influence the selected three
financial factors have on growth of a firm, and additionally, to reach an
understanding on the current state of knowledge related to the topic of managing
growth of a company. These objectives have been reached by answering the research
questions, which were presented at the first chapter, shown beneath:
The main research questions for this study were:
RQ1: What is the influence of investments, equity and gearing on growth of a
company?
RQ2: What identifiable differences there are in selected financial indicators
between growing and shrinking companies?
Supporting research question was:
SQ1: How financial figures can be used to help in managing growing
company?
The theoretical part began by composing a literature review about the three financial
factors, which were later, also studied in the empirical part. Findings concerning the
impact that investments have on growth were practically one-sided. Major share of
previous literature argued that investments have significant positive effect on growth
of a firm (e.g. Liu & Hsu 2006, Coad & Rao 2010, Hall & Lerner 2010, Capasso &
Treibich & Verspagen 2015.) This conclusion was found to be true regardless of the
country or industry of a company. Meaning that these previous studies could be
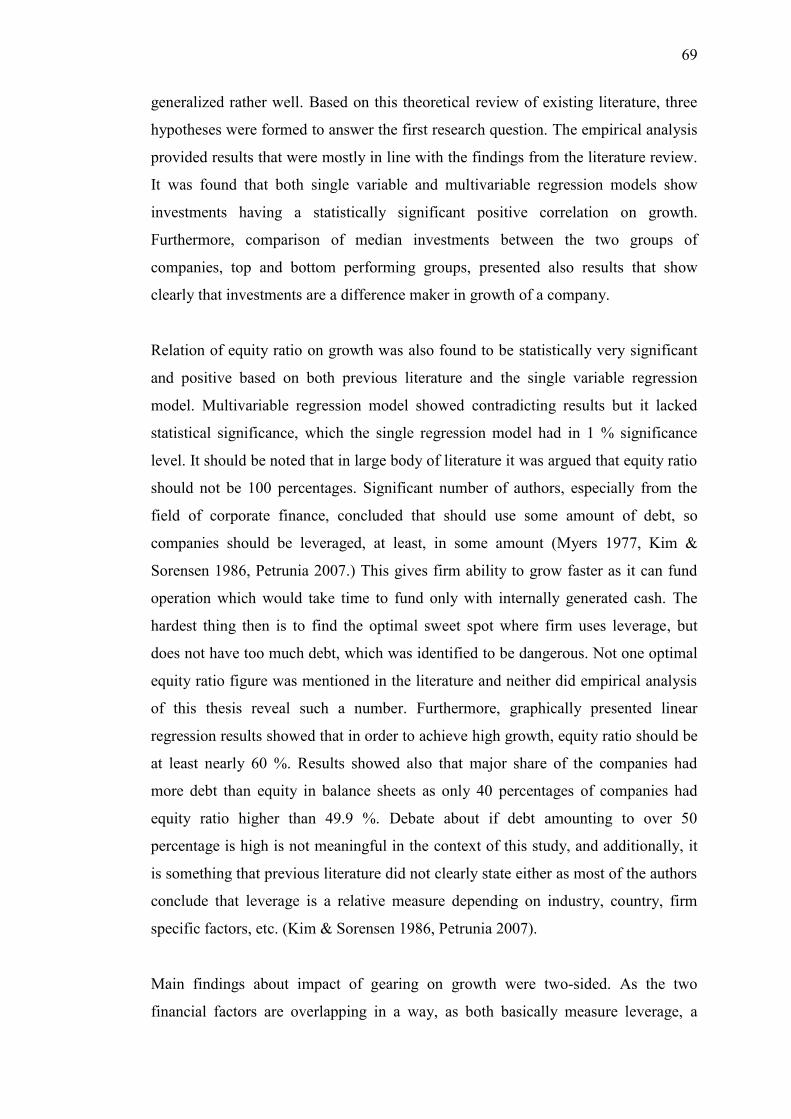
69
generalized rather well. Based on this theoretical review of existing literature, three
hypotheses were formed to answer the first research question. The empirical analysis
provided results that were mostly in line with the findings from the literature review.
It was found that both single variable and multivariable regression models show
investments having a statistically significant positive correlation on growth.
Furthermore, comparison of median investments between the two groups of
companies, top and bottom performing groups, presented also results that show
clearly that investments are a difference maker in growth of a company.
Relation of equity ratio on growth was also found to be statistically very significant
and positive based on both previous literature and the single variable regression
model. Multivariable regression model showed contradicting results but it lacked
statistical significance, which the single regression model had in 1 % significance
level. It should be noted that in large body of literature it was argued that equity ratio
should not be 100 percentages. Significant number of authors, especially from the
field of corporate finance, concluded that should use some amount of debt, so
companies should be leveraged, at least, in some amount (Myers 1977, Kim &
Sorensen 1986, Petrunia 2007.) This gives firm ability to grow faster as it can fund
operation which would take time to fund only with internally generated cash. The
hardest thing then is to find the optimal sweet spot where firm uses leverage, but
does not have too much debt, which was identified to be dangerous. Not one optimal
equity ratio figure was mentioned in the literature and neither did empirical analysis
of this thesis reveal such a number. Furthermore, graphically presented linear
regression results showed that in order to achieve high growth, equity ratio should be
at least nearly 60 %. Results showed also that major share of the companies had
more debt than equity in balance sheets as only 40 percentages of companies had
equity ratio higher than 49.9 %. Debate about if debt amounting to over 50
percentage is high is not meaningful in the context of this study, and additionally, it
is something that previous literature did not clearly state either as most of the authors
conclude that leverage is a relative measure depending on industry, country, firm
specific factors, etc. (Kim & Sorensen 1986, Petrunia 2007).
Main findings about impact of gearing on growth were two-sided. As the two
financial factors are overlapping in a way, as both basically measure leverage, a

70
major portion of the previous academic studies had practically identical conclusions
for the two. Too high gearing level is also dangerous as, in worst case, it can even
lead owners of the company losing control to debtors, or that firm has to declare
bankruptcy when it cannot meet debtors’ demands (Ulrich & Arlow 1980, Liu & Hsu
2006, Petrunia 2007.) Too high amount of gearing is expected to strict firms’ future
growth, instead of being a booster for growing revenues.
Results of the empirical analysis were somewhat contrary to theoretical findings.
Single variable regression model showed only minor relation between the variable
and growth and result was not statistically significant. Similarly, multivariable
regression model results indicated gearing having only minor impact on growth of a
firm and this result was statistically on a low significance level. Hence, based on the
findings of the empirical analysis, this thesis concludes that gearing has no
statistically significant relation on growth of a firm with the studied population of
firms. These findings imply that from the three financial factors, gearing is found to
be having the least impact on growth of a firm. We will look at these implications for
practice more closely now on next chapter (Lang & Ofek & Stulz 1996, Liu & Hsu
2006).
After the finance focused first theoretical chapter, the study presented existing
literature on the subject of managing growth with financial factors. Fundamental
view for measurement of financial factors is the fact that it is extremely difficult to
manage something, which is not being measured (OSR Centre 2016.) This could lead
into a situation where decisions are based on opinions, rather than facts, simply
because in many cases different metrics and numbers are the facts. Hence, measuring
company’s financial conditions should be a key activity that provides information for
management. In last couple of decades the measurement of financial factors has
taken a big advancement as financial ratios has been included as a significant part in
measurement systems like balanced scorecard (BSC) (Kaplan & Norton 2007,
Narayanamma & Lalitha 2016.)
From the literature, it can be concluded that all the financial indicators have one
thing in common from management’s perspective: they can be used effectively in
managing a growing company. Management of a company that is aiming for high

71
growth phase can use measurement of financial metrics data to make sure that
decided tasks are moving forwards. Company management can use financial metrics
to measure, for instance, if the investments, that have been decided to make, have
actualized. Growth could be managed in a way that financial indicators are used to
provide information whether the resources allocated for new investments have
materialized as growth.
Additionally, financial factors could be used to measure things that otherwise could
be measured only by using non-financial metrics. For example, recruiting is one area
which is commonly measured by counting how many new employees have been
hired, rather than by calculating how many resources have been used for recruiting
process (Kotane & Kuzmina-Merlino 2011.) Management could choose alternative
approach and instead decide that the firm will use 50 000 € to recruiting within the
next twelve months. Now the management, and effectively whole firm, knows
precisely how much money will be used for recruiting
Lastly, it must be acknowledged that only a minor fraction of financial metrics can
work in a one fit suits all model for all different companies and industries. Widely
used financial indicators, for instance sales numbers, gross operating profit, cost
structure, etc. are good metrics to use in every company but different businesses also
need to customize their financial metrics to best suit for the need of individual
company.
7.2 Implications for research and practice
Lack of growth in medium-sized companies has been identified as one of the big
problems concerning Finnish economy. Prominent figures from the fields of politics
and business have for multiple years argued that what Finland is lacking is growing
medium-sized companies and SMEs in more general. This gave both objective and
motivation to study what makes medium-sized Finnish companies to grow, and
particularly, do the selected three financial figures have impact on growth when
studied with regression analysis.

72
As we saw in previous chapter, both theoretical and empirical findings show that
investments and equity ratio have statistically significant correlation on growth of a
firm. On the contrary, the empirical results did not find such a correlation with
gearing. Implications from regression analysis can be concluded as follows. First,
higher investments seem to lead to higher growth, and with the companies used in
this study, every single firm that invested at least 2.7 % of its revenue every year had
a positive growth. Is this eternally binding truth that every company, which has an
investing ratio of 2.7 % at minimum, will have positive revenue growth? Probably
not. Nevertheless, it is a clear numerical implication from the growth empirical
study. Practical broader takeaway for managers and executives at companies is that
you should invest as much as possible. Based on theoretical findings the most
beneficial investment target, from the perspective of bringing highest growth, would
be research and development.
Similarly, implications regarding equity ratio of companies are also apparent based
on findings presented throughout the thesis. Companies should aim to have a stable
financial situation which can be interpreted to mean high equity ratio. However,
equity ratio at maximum level of 100 is too extreme. Rather, companies should use
debt leverage to grow faster by investing and taking on projects that would take
longer to start with internal cash flow. A single equity ratio number cannot be
concluded to be optimal to have as this is something that depends on multiple things,
i.e. industry a company is competing in, country, financial matters such as forecasted
revenue and profit, etc. Therefore, implication is that firms should not also go and
copy equity ratio level of some successful company. Seldom there are identical
companies with identical backgrounds.
Implications relating to third financial factor, gearing, are somewhat different. Based
on existing literature, some amount of debt should be used to boost growth by
acquiring new business, which rises gearing when financed with debt. However, in
the regression analysis no statistically significant correlation between the variable
and growth was found. From this a conclusion that companies should concentrate on
investments and equity ratio, if firm wants to have high growth faster, can be made.

73
Finally, this study gave a preview on the subject of managing growth with financial
factors in a company. First takeaway is that firm should start measuring financial
factors immediately because it is rather difficult to manage something, which is not
being measured. Additionally, measurement should be a continuous process that
flows throughout the whole organization as was illustrated in figure 3 on page 30.
Couple of practical cases how to manage growth with financial factors were also
mentioned. For instance, management of a company that is aiming for high growth
phase can use measurement of financial metrics data to make sure that decided tasks
are moving forwards. Hotel could measure has sales per room raised, or grocery store
might be interested if additional sales in identified troubled shops has risen after new
investments, etc. Additionally, it was argued that financial factors can be used to
measure things that commonly are measured only by using non-financial metrics.
Recruiting was named as a useful example of this. Lastly, it must be acknowledged
that only a minor fraction of financial metrics can work in a one fit suits all model for
all different companies and industries. Firms need to customize their financial
metrics to best suit for their individual need. These are all practical implications that
people in leadership position in various companies all around the world can take
under their focus.
7.3 Validity and reliability of the study
Validity in particularly answers to the question how well the variables, or the whole
analysis in more general, measures what it is supposed to measure and are these
variables appropriate to use when looking for answers for a question (Adcock &
Collier 2001.) Validity is often further divided to external and internal validity.
External validity is concerned with whether research findings can be generalized to
other relevant environments. For instance, can the findings from study in one
subsidiary company also be used to make changes in another subsidiary? Internal
validity, in the other hand, is achieved if research can demonstrate a causal
relationship between studied variables. The second concept of this chapter,
reliability, refers to question of replication and consistency. If a scholar is able to
replicate an earlier research and obtain same findings, then research is seen to be
reliable (Adcock & Collier 2001, Babbie 2001, Saunders 2016).

74
First step in securing validity relates to measurement. Do the indicators used or
selected for the study produce results that can be interpreted as adequately answering
to questions in a study? In this thesis, risk of selecting non-valid indicators is smaller,
simply hence the selected financial factors answer directly to the research questions.
This risk might be higher if new financial factors, for instance combination of
financial figures with different emphasis, were made, but in the case of this study the
selected variables measure precisely what is studied. Second step to secure validity
was the process of verifying data. As mentioned in the chapter 4, empirical
methodology, original data which was gotten in excel format has been gross
referenced also from physical Talouselämä-magazines. Regarding external validity,
increasing sample size of companies included in the study would naturally made
findings more generalizable, and, therefore, would have increased external validity.
As to internal validity, research findings demonstrating causal relationship between
studied variables would mean good internal validity in statistical study. This was
achieved in the case of investments in two different regression models, in the case of
equity ratio with single variable regression, and with equity ratio statistically
significant causal relationship cannot be demonstrated at all with either regression
model.
Reliability is naturally easier to secure in a study that uses methods of statistical
analysis, which can be repeated almost as many times as wanted, when compared,
for instance to study that is made with questionnaire. Reliability of this study has
been increased by running all the regression analyses three times using two different
programs, namely Microsoft Excel and StatsModels, which is a module for Python
programming language (Saunders 2016).
7.4 Limitations of the study
Major body of existing academic literature presented in the literature review was
from the United States or from European countries, other than Finland. An empirical
study about how Finnish companies lead growth and use financial indicators in
management could have given more insights especially for companies having their
presence in Finland.

75
However, rather than relating to management topics, the largest limitations of the
study relate to empirical part, which consist of four regression analysis. First, and the
most significant, limitation is the fact that the studied population, which was used in
empirical analysis consists of only 100 Finnish companies. A dataset containing
more companies could have given different results. Furthermore, this also produces
generalization problem as all the companies are from one country. Analysis on
companies from other countries’, even if they were of equal sized firms, could well
give different results and therefore lead to different conclusions.
Secondly, the regression analyses have, at least, some amount of validity problem.
As we saw in the empirical part, the dataset did not have all the required data, to be
able to calculate regressions, for all the one hundred companies. Regression analysis
of all the three financial factors, investments, equity ratio, and gearing had to be done
without a notable number of firms. Therefore, amount of how much these findings
can be generalized is limited compared to a situation where regression could have
been calculated with all the one hundred firms.
Finally, perhaps the most self-evident limitation, which was mentioned earlier in data
collection chapter, should be covered here too. As Saunders (2016) states, one major
disadvantage in usage of secondary data is the fact that author, or user of the data in
more general, does not have control over quality of data, as you have not seen or
controlled the data originally when it was collected. This disadvantage cannot be
disposed and hence must be mentioned as a limitation of this study.
7.5 Suggestions for future research
Regarding the area of managing company, a future research could look at how
Finnish companies are managing growth. A study with primary data, for instance
interviews, collected directly from the companies and management would be highly
useful when looking for answers on this topic. Especially, this could bring to light
best practices that are used in the firms.
Area of regression analysis with the three financial factors includes, at least, two
different improvements that could be taken as perspective in future research. First, a

76
research containing more than hundred companies and companies of different size
would be highly beneficial. For instance, a research with companies from small to
large corporations and with significantly larger dataset could show findings that
would give either ability to benchmark firms of different size to others, or to
generalize on companies of different size. Basing analysis also to data from a longer
period than 9-years, which was the scope of this study, would also give more
validity. Second topic would be to make regression analysis on different financial
factors. Are there other meaningful financial ratios and figures, for example amount
of working capital, which might show statistically significant relation on growth of a
company?

77
REFERENCES
Acs, Z. J. & Audretsch, D. B. (1987). Innovation, Market Structure and Firm Size.
Review of Economics and Statistics, 69, 567-574.
Acs, Z., Morck R., Shaver J. & Yeung B. (1997). The internationalization of small
and medium-sized enterprises: a policy perspective. Small Business Economics, 9, 7–
20.
Adcock, R. & Collier, D. (2001). Measurement Validity: A shared standard for
qualitative and quantitative research. American Political Science Review, 95(3), 529-
546.
Aghion, P. & Howitt, P. (1992). A model of growth through creative destruction.
Econometrica, 60(2), 323-351.
Ali-Yrkkö, J. & Rouvinen, P. (2015). Suomen Mittelstand – Löytyykö kasvu tästä
yritysjoukosta? (ETLA B270). Helsinki: Taloustieto Oy.
Atkin, M. & Glen, J. (1992). Comparing Corporate Capital Structures Around the
Globe. International Executive, 34(5), 369-387.
Babbie, E. R. (2001). The Practice of Social Research, 9th ed. Belmont, CA:
Wadsworth.
Beaver, G. (2002). Contemporary research on business growth. Strategic Change,
11(2), 55-58.
Beaver, W. H. (1966). Financial ratios as predictors of failure. Empirical Research in
Accounting: Selected Studies. Journal of Accounting Research, 4, 71–111.
Beck, T., Demirguc-Kunt, A. & Levine, R. (2005). SMEs, Growth, and Poverty:
Cross-Country Evidence. Journal of Economic Growth, 10(3), 199–229.
Brierley, P. & Bunn, P. (2005). The determination of UK corporate capital gearing.
Bank Of England Quarterly Bulletin, 45(3), 356-366.
Brynjolfsson, E. & Yang, S. (1996). Information technology and productivity: a
review of the literature. Advances in Computers, 43, 179–214.
Capasso, M., Treibich, T. & Verspagen, B. (2015). The medium-term effect of R&D
on firm growth. Small Business Economics, 45(1), 39-62.
Cardinaels E. & van Veen-Dirks, P.M.G. (2010). Financial versus non-financial
information: The impact of information organization and presentation in a Balanced
Scorecard. Accounting, Organizations and Society, 35(6), 565–578.
Chastain, C. (1982). Strategic planning and the recession. Business Horizons, 25(6),
39–44.

78
Coad, A. & Rao, R. (2008). Innovation and firm growth in high-tech sectors: A
quantile regression approach. Research Policy, 37(4), 633–648.
Coad, A. & Rao, R. (2010). Firm growth and R&D expenditure. Economics of
Innovation and New Technology, 19(2), 127–145.
Davis, Steven, J., Haltiwanger, J. & Schuh, S. (1993). Small Business and Job
Creation: Dissecting the Myth and Reassessing the Facts. Business Economics, 29,
13-21.
Deakins, D. & Freel, M. (1998). Entrepreneurial learning and the growth process in
SMEs. The Learning Organization, 5(3), 144 – 155.
Deans, G., Kansal, C. & Mehltretter, S. (2009). Making a key decision in a
downturn: go on the offensive of be defensive? Ivey Business Journal, Canada: Ivey
Business School.
Deschryvere, M. (2014). R&D, firm growth and the role of innovation persistence:
an analysis of Finnish SMEs and large firms. Small Business Economics, 43(4), 767-
785.
Ericson, R. & Pakes, A. (1995). Market perfect industry dynamics: A framework for
empirical analysis. Review of Economic Studies, 62, 53-82.
European Commission (2003). Commission Recommendation of 6 May 2003
concerning the definition of micro, small and medium-sized enterprises, (notified
under document number C(2003) 1422), (2003/361/EC). Accessed from http://eur-
lex.europa.eu/legal-content/EN/TXT/?uri=CELEX:32003H0361.
Eurostat (2017). News release February 2017, euro area economic indicators.
http://ec.europa.eu/eurostat/documents/2995521/7868348/2-14022017-BP-
EN.pdf/da0c1c33-2d80-4cc2-9f34-de2dab92aac5. Cited 14.2.2017.
Fama, E. F. & French, K. R. (2002). Testing trade-off and pecking order predictions
about dividends and debt. Review of Financial Studies, 15, 1-33.
Fanyves, V., Tarnóczi, T. & Vörös, P. (2014), Financial Indicators in Managerial
Decision-Making, Annals of the University of Oradea: Economic Science Series,
23(1), 893-904.
Fernandes K. J., Raja V. & Whalley A. (2006). Lessons from implementing the
balanced scorecard in a small and medium size manufacturing organization.
Technovation, 26, 623–634.
Fleck, V. & Garnsey, E. (1988). Managing Growth at Acorn Computers. Journal of
General Management, 13(3), 4.
Gallo, A. (13.7.2015). A Refresher on Debt-to-Equity Ratio, Harvard Business
Review.
79
García-Manjón, J. & Romero-Merino, M. (2012). Research, development, and firm
growth. Empirical evidence from European top R&D spending firms. Research
Policy, 41(6), 1084-1092.
Ghauri, P. & Gronhaug, K. (2005). Research method in business studies: a practical
guide (3rd edition). Harlow, Financial Times Prentice Hall.
Georg, v.K. & Cusumano, M.A. (2001). Three Strategies for Managing Fast Growth.
MIT Sloan Management Review, 42(2), 53-61.
Geroski, P.A. (1995). What do we know about entry? International Journal of
Industrial Organization, 13, 421–440.
Hall, B. (1987). The relationship between firm size and firm growth in the US
manufacturing sector. Journal of Industrial Economics, 3, 583–606.
Hall, B. H. & Lerner, J. (2010). The financing of R&D and innovation, Handbook of
the Economics of Technical Change. New York: Elsevier.
Heshmati, A. & Lööf, H. (2008). Investment and performance of firms: correlation or
causality? Corporate Ownership & Control, 6(2), 268-282.
Hill, R. C., Griffits W. E. & Lim G. C. (2010). Principles of Econometrics (4th
edition). John Wiley & Sons, Inc.
Hillidge, J. (1990). Planning for Growth in a Small Company. Long Range Planning,
23(3), 76-81.
Holmlund, M. & Kock, S. (1998). Relationships and the internationalization of
Finnish Small and Medium-sized companies. International Small Business Journal,
16(4), 46-63.
Hussain, I. (2011). Financial Development and Firms' Growth in Textile Industry of
Pakistan: A Panel Data Analysis. IBA Business Review, 6(2), 97-105.
Hölzl, W. (2009). Is the R&D behaviour of fast-growing SMEs different? Evidence
from CIS III data for 16 countries. Small Business Economics, 33(1), 59–75.
Kaplan R. S. & Atkinson A. A. (1998). Advanced Management Accounting (third
edition). Prentice-Hall, USA.
Kaplan, R. S. & Norton, D. P. (2007). Using the Balanced Scorecard as a Strategic
Management System, Harvard Business Review (July – August 2007), Accessed
from: https://hbr.org/2007/07/using-the-balanced-scorecard-as-a-strategic-
management-system.
Kasvuryhmä (2017). Organization website. http://www.kasvuryhma.fi/en/homepage.
Cited on 20.2.2017.
80
Kiani, K., Chen, E. & Madjd-Sadjadi, Z. (2012). Financial factors and firm growth:
evidence from financial data on Taiwanese firms. Quantitative Finance, 12(8), 1299-
1314.
Kim, W. S. & Sorensen, E. H. (1986). Evidence on the Impact of the Agency Costs
of Debt on Corporate Debt Policy. Journal of Financial and Quantitative Analysis,
21(2), 131.
Kitching, J., Blackburn, R., Smallbone, D. & Dixon, S. (2009). Business strategies
and performance during difficult economic conditions. (Project Report). Department
for Business Innovation and Skills, Kingston University, London.
Klette, T. & Griliches, Z. (2000). Empirical patterns of firm growth and R&D
investment: a quality ladder model interpretation. Economic Journal, 110(463), 363-
387.
Klomp, L. & Van Leeuwen, G. (2001). Linking innovation and firm performance: A
new approach. International Journal of the Economics of Business, 8(3), 343–364.
Kongolo, M. (2010). Job creation versus job shedding and the role of SMEs in
economic development. African Journal of Business Management, 4(11), 2288-2295.
Kotane, I. & Kuzmina‐Merlino, I. (2011). Non-financial indicators for evaluation of
business activity. European Integration Studies, (5), 213-219.
Lang, L., Ofek, E. & Stulz, R. (1996). Leverage, investment and growth. Journal of
Financial Economics, 40, 3–29.
Liu, W. & Hsu, C. (2006). Financial Structure, Corporate Finance and Growth of
Taiwan's Manufacturing Firms. Review Of Pacific Basin Financial Markets &
Policies, 9(1), 67-95.
Mao, H. (2009). Review on Enterprise Growth Theories. International Journal of
Business and Management, 4(8), 20-23.
Madique, A. M. & Hayes, R. M. (1984). The Art of High-Technology Management,
Sloan Management Review, pp. 18.
Maunu, T. & Räisänen, H. (2016). Minne uudet työpaikat syntyivät vuonna 2015?
(TEM-analyses, Serial number 72/2016). Finland’s Ministry of Economic Affairs
and Employment.
McCarthy, D. J., Spital, F. C. & Lauenstein, M. C. (1987). Managing Growth At
High-Technology Companies: A View From T. The Academy of Management
Executive, 1(4), 313.
Myers, S. C. (1977). Determinants of corporate borrowing. Journal of Financial
Economics, 5, 147–75.

81
Narayanamma, P. L. & Lalitha, K. (2016). Balanced Scorecard - The Learning &
Growth Perspective. Aweshkar Research Journal, 21(2), 59-66.
OECD Observer magazine. (2003). Small and Medium Enterprises in Europe 2003.
the Observer, Published by the Organisation for Economic Co-operation and
Development. OECD, France. Accessed from http://www.oecd-
ilibrary.org/economics/oecd-observer_15615529.
OECD. (2017). Organisation for Economic Co-operation and Development. Open
Database, cited 17.2.2017. https://data.oecd.org/
Om Sai Ram Centre for Financial Management Research. (2016). Financial
management indicators to aid decision-making (statistics). Journal of Financial
Management & Analysis, 29(1), iv-xx.
O'Neill, H. M. (1983). How Entrepreneurs Manage Growth. Long range planning,
16(1), 116-124.
Opler, T. & Titman, S. (1994). Financial distress and corporate performance. Journal
of Finance, 49, 1015–1040.
Pack, H. & Westphal, L. (1986). Industrial Strategy and Technological Change:
Theory versus Reality”. Journal of Development Economics, 22, 87-128.
Page, A. S. & Jones, R. C. (1990). Business growth - part 2: Growth management.
Management Decision, 28(3), 55.
Pasanen, M. (2007). SME Growth Strategies: Organic or Non-Organic? Journal of
Enterprising Culture. Dec2007, Vol. 15 Issue 4, p317-338. 2007
Petrunia, R. (2007). Persistence of initial debt in the long-term employment
dynamics of new firms. Canadian Journal Of Economics, 40(3), 861-880.
Philips P. & Louvieris P. (2005). Performance measurement systems in tourism,
hospitality and leisure small medium-sized enterprises: a balanced scorecard
perspective. Journal of Travel Research, 44, 201-211.
Ponikvar, N., Tajnikar, M. & Pušnik, K. (2009). Performance ratios for managerial
decision-making in a growing firm. Journal Of Business Economics & Management,
10(2), 109-120.
Prats, J., Sosna, M. & Velamuri, S. (2012). Managing in Different Growth Contexts.
California Management Review, 54(4), 118-142.
Qiu, M. & La, B. (2010). Firm Characteristics as Determinants of Capital Structures
in Australia. International Journal of the Economics of Business, 17(3), 277.

82
Robu, M. (2013). The Dynamic and Importance of SMEs in Economy. The USV
Annals of Economics and Public Administration. 13(1).
Ross, S. A. (1977). The determination of financial structure: The incentive-signalling
approach. Bell Journal of Economics, 8, 23–40.
Saunders, M. (2016). Research methods for business students (Seventh edition).
Harlow: Pearson Education.
Savlovschi, L. I. & Robu, N. R. (2011). The Role of SMEs in Modern Economy.
Economia. Seria Management, 14(1), 277 – 281.
Schumpeter, J. A. (1982). The Theory of Economic Development: An Inquiry into
Profits, Capital, Credit, Interest and the Business Cycle. Transaction Publishers,
London.
Scherer, F. M. (1965). Corporate inventive output, profits, and growth. Journal of
Political Economics. 73(3), 290–297.
Simons, M. & Hyötyläinen, R. (2009). Keskisuuren yrityksen dynaaminen
kasvumalli. Talentum.
Soyer, E. & Hogarth, R. M. (2012). The illusion of predictability: How regression
statistics mislead experts. International Journal of Forecasting, 28(3), 695-711.
Stacey, R. (1995). The science of complexity: An alternative perspective for strategic
change processes. Strategic Management Journal, 16, 477– 495.
Statistics Finland (2017). Pienet ja keskisuuret yritykset.
http://www.stat.fi/meta/kas/pienet_ja_keski.html. Cited on 13.2.2017
Suarez, V., Lesneski, C. & Denison D. (2011). Making the case for using financial
indicators in local public health agencies. American Journal of Public Health,
101(3), 419-425.
Sutton, J. (1997). Gibrat’s legacy. Journal of Economic Literature, 35, 40–59.
Tekniikka ja talous (14.3.2011). Lisää näitä yrityksiä Suomeen! Tekniikka ja talous.
http://www.tekniikkatalous.fi/innovaatiot/2011-03-14/Lis%C3%A4%C3%A4-
n%C3%A4it%C3%A4-yrityksi%C3%A4-Suomeen-3300533.html. Cited on
13.2.2017.
Teknologiateollisuus ry (2016). Press release published on 7.11.2016.
http://teknologiateollisuus.fi/fi/ajankohtaista/uutiset/lehdistotiedote-suomesta-
puuttuu-mittelstand-kasvuryhma-rakentaa-sen. Cited on 17.2.2017.
Ulrich, T. A. & Arlow, P. (1980). The Financial Implications of Growth. Journal of
Small Business Management, 18(4), 28-33.

83
United States General Accounting Office (1992). Quantitative Data Analysis: An
Introduction. Washington D.C.
Vasić, J., Kecman, N. & Mladenović, I. (2016). Research and development
investment as determinant of international competitiveness and economic growth in
EU28 and Serbia. Economic Themes, 54(2), 195-216.
Vogt, W. P. (2011). SAGE quantitative research methods, SAGE Publications Ltd.
Wilson, P. & Bates, S. (2005). The Essential Guide to Managing Small Business
Growth. John Wiley & Sons.
Whited, T. M. (1992). Debt, liquidity constraints, and corporate investment:
Evidence from panel data. Journal of Finance, 47, 1425–1460.
Worcester, R. M. (1970). Planning for growth in leading U.S companies. Long
Range Planning, 2(3), 8-14.
World Bank (2001). Small and Medium Enterprise (SME). World Bank Group
review of small business activities. Washington, DC.
World Bank (2017). World Bank Open Data. Accessed from
http://data.worldbank.org/
Yasuda, T. (2005). Firm growth, size, age, and behavior in Japanese manufacturing.
Small Business Economics, 24, 1–15.
Yle (19.6.2014). Kultaranta-talks, Parts of Raimo Sailas in the panel. Accessed from
http://areena.yle.fi/1-2855851. Video viewed on 10.2.2017.
Yle (16.9.2015). Speech of the Prime Minister Juha Sipilä. Accessed from
http://yle.fi/uutiset/3-8311098. Video viewed on 10.2.2017.
Yujun, L., Foley, M., Xiaowei, L., & Jingui, L. (2011). The role of R&D in
improving firm growth: evidence from high tech companies in China. International
Journal Of Business & Economics Perspectives, 6(1), 108-124.

84
Appendices
Appendix 1. List of companies forming the empirical dataset
Aldata Solution Oyj Hämeen Autovaruste Oy
Amcor Flexibles Finland Oy Icopal Oy
Ashland Finland Oy Ingram Micro Mobility Finland Oy
Atoy Oy J. Kärkkäinen Oy
Barona Group Oy Keskusautohalli Oy
Basware Oyj Koja-Yhtiöt Oy
Bella-Veneet Oy KPMG Oy Ab
Bestseller Wholesale Finland Oy KSS Energia Oy
Beweship Oy Kuhmo Oy
Bewi Styrochem Oy Landis+Gyr Goup Oy
Brandt Group Oy Lappeenrannan Energia Oy
Broman Group Oy Lindex Oy
BSH Kodinkoneet Oy Luvian Saha Oy
Captum Group Oy Länsi-Suomen Osuuspankki
Comptel Oyj Marimekko Oyj
Contineo Oy Massory Oy
Eckes-Granini Finland Oy Ab Meira Oy
Efore Oyj Metalliset Oy
Ekokem Oyj Murata Electronics Oy
Eniro Finland Oy Mölnlycke Health Care Oy
EPL Group Oy Nanso Group Oy
eQ Oyj Nautor Oy
Evli Pankki Oyj Normek Oy
FCG Finnish Consulting Group Oy Nurminen Logistics Oyj
Finnfeeds Oy Nynas Oy
Forchem Oy OI Finnish Holdings Oy
Gardner Denver Oy Osuuskunta Idän Maito
Gemalto Oy Oy Alholmens Kraft Ab
Helsingin KTK Oy Oy Carlson
Henkel Norden Oy Oy Forcit Ab

85
Appendix 1 continued.
Oy Honeywell Ab Sponfood Oy
Oy Kaha Ab Stalatube Oy
Oy Motoral Ab Suni Oy
Oy Närko Group Ab Suomen 3M Oy
Paperinkeräys Oy Suomen Lehtiyhtymä Oy
Pohjantähti Keskinäinen Vakuutusyhtiö Suomi-Soffa SSF Oy
PricewaterhouseCoopers Oy Synthomer Finland Oy
Purso Oy Tecnotree Oyj
Pyroll Group Oy Terramare Oy
Pölkky Oy Tiimari Oyj
R. Ruth Oy TNT Suomi Oy
Ramboll Finland Oy Tulikivi Oy
Raumaster Oy Työväen Keskin. Vakuutusyhtiö Turva
Roche Oy Varova Oy
Romukeskus Oy Veritas ömsesidigt skadeförsäkringsbolag
Sampo-Rosenlew Oy Volvo Bus Finland Oy
Santen Oy Weckman Steel Oy
Scanica Oy Wulff-Yhtiöt Oyj
Sekom Telecom Oy Y-Agro Oy
SK Entertainment Group Oy Älvsbytalot Oy

86
Appendix 2. Summary of single variable regression statistics: investments on
growth
Appendix 2A: general regression statistics
Regression Statistics
Multiple R 0,398036416
R Square 0,158432988
Adjusted R Square 0,142554365
Standard Error 0,061835839
Observations 55
Coefficients Standard Error t Stat P-value
Growth 0,00762975 0,01092475 0,69839172 0,48798543
Investments 0,60651020 0,19200906 3,15875826 0,00261640
Appendix 2B: Residual Output
Residual Output
Observation Predicted
Revenue growth Residuals
1 0,034316201 0,120683799
2 0,09132816 0,09767184
3 0,024612038 0,251387962
4 0,011268814 0,050731186
5 0,03007063 -0,00307063
6 0,094967221 -0,009967221
7 0,03128365 0,06871635
8 0,026431568 0,078068432
9 0,018546936 0,022453064
10 0,140455486 -0,077455486
11 0,0937542 0,0042458
12 0,050691976 0,034308024
13 0,016120895 0,090879105
14 0,053724527 0,014275473
15 0,06160916 0,00739084
16 0,020972977 0,033027023
17 0,016727405 0,067272595
18 0,015514385 0,005485615
19 0,023399018 -0,000399018
20 0,022185997 -0,024185997

87
21 0,024612038 0,008387962
22 0,016120895 0,013879105
23 0,024612038 0,039387962
24 0,020972977 0,029027023
25 0,034316201 -0,057316201
26 0,017333916 0,040666084
27 0,015514385 0,036485615
28 0,021579487 0,021420513
29 0,036135732 0,012864268
30 0,094360711 -0,077360711
31 0,044626874 0,019373126
32 0,016727405 0,009272595
33 0,048265936 -0,015265936
34 0,012481834 -0,057481834
35 0,024005528 -0,118005528
36 0,013694854 -0,006194854
37 0,011875324 -0,098875324
38 0,017333916 -0,010333916
39 0,014907875 -0,032907875
40 0,016727405 -0,077727405
41 0,013088344 -8,83441E-05
42 0,010055793 -0,009055793
43 0,024005528 -0,013005528
44 0,011268814 -0,025268814
45 0,014907875 -0,051907875
46 0,010055793 -0,080055793
47 0,022185997 -0,026185997
48 0,014907875 -0,050907875
49 0,024612038 -0,001612038
50 0,017333916 -0,064333916
51 0,008842773 -0,051842773
52 0,020366467 -0,056366467
53 0,025825058 -0,012825058
54 0,016727405 0,006272595
55 0,007629752 -0,073629752

88
Appendix 3. Summary of single variable regression statistics: equity ratio on
growth
Appendix 3A: general regression statistics
Regression Statistics
Multiple R 0,389739424
R Square 0,151896819
Adjusted R Square 0,133050081
Standard Error 0,056483239
Observations 47
Coefficients Standard Error t Stat P-value
Growth -0,028410631 0,022455604 -1,26519111 0,212315194
Equity ratio 0,130461018 0,045954126 2,838940235 0,006769619
Appendix 3B: Residual Output
Observation Predicted Revenue growth %
Residuals
1 0,045952149 0,109047851
2 0,051822895 0,137177105
3 0,013336895 0,048663105
4 0,030296827 -0,003296827
5 0,072044353 0,012955647
6 0,039429099 0,060570901
7 0,021816861 0,082683139
8 -0,002318427 0,065318427
9 0,032906048 0,065093952
10 0,012032285 0,072967715
11 0,0524752 0,0545248
12 0,039429099 0,028570901
13 0,014641505 0,039358495
14 0,028992217 0,055007783
15 -0,004927648 0,027927648
16 0,05117059 -0,05317059
17 0,077262794 -0,044262794
18 -0,007536868 0,018536868
19 0,045952149 -0,015952149
20 0,058998251 -0,008998251
21 0,034210658 -0,057210658
22 0,023773776 0,034226224

89
23 0,022469166 0,020530834
24 0,006813844 0,042186156
25 0,042690624 -0,025690624
26 0,082481234 -0,018481234
27 0,038124488 -0,012124488
28 0,028339912 0,004660088
29 0,068130522 -0,113130522
30 0,019859946 -0,113859946
31 0,0139892 -0,0064892
32 0,055084421 -0,048084421
33 0,024426081 -0,042426081
34 0,018555336 -0,079555336
35 0,040733709 -0,039733709
36 0,043342929 -0,032342929
37 0,01268459 -0,02668459
38 0,0524752 -0,0204752
39 -0,002318427 0,006318427
40 0,014641505 -0,084641505
41 0,002247708 -0,038247708
42 0,005509234 -0,052509234
43 0,002900014 -0,045900014
44 0,032906048 -0,019906048
45 0,026382997 -0,003382997
46 -0,007536868 -0,058463132
47 0,075305878 0,078694122

90
Appendix 4. Summary of single variable regression statistics: gearing on growth
Appendix 4A: General Regression Statistics
Regression Statistics
Multiple R 0,126604823
R Square 0,016028781
Adjusted R Square -0,007399105
Standard Error 0,061863901
Observations 44
Coefficients Standard Error t Stat P-value
Growth 0,03826130 0,01062818 3,59998542 0,00083374
Gearing -0,00889034 0,01074818 -0,82714890 0,41282761
Appendix 4B: Residual Output
Residual Output
Observation Predicted
Revenue growth Residuals
1 0,035060772 0,119939228
2 0,036749937 0,152250063
3 0,02697056 0,03502944
4 0,029193146 -0,002193146
5 0,039594847 0,045405153
6 0,041372915 0,058627085
7 0,034705158 0,069794842
8 0,006611676 0,056388324
9 0,032038056 0,065961944
10 0,027503981 0,057496019
11 0,043506597 0,063493403
12 0,034794062 0,033205938
13 0,045195763 0,008804237
14 0,043150984 0,040849016
15 0,02048061 0,00251939
16 0,035505289 -0,037505289
17 0,041728529 -0,008728529
18 0,038439102 -0,008439102
19 0,037372261 0,012627739
20 0,03941704 -0,06241704

91
21 0,033638317 0,024361683
22 0,029015339 0,013984661
23 0,020569514 0,028430486
24 0,032260314 -0,015260314
25 0,041017302 0,022982698
26 0,034438448 -0,008438448
27 0,03292709 7,29101E-05
28 0,03915033 -0,08415033
29 0,027770691 -0,121770691
30 0,027281722 -0,019781722
31 0,017013377 -0,104013377
32 0,043239887 -0,036239887
33 0,035371934 -0,053371934
34 0,041861884 -0,040861884
35 0,0331938 -0,0221938
36 0,028659725 -0,042659725
37 0,036749937 -0,004749937
38 0,035683096 -0,031683096
39 0,031949152 -0,101949152
40 0,044306728 -0,087306728
41 0,032482573 -0,019482573
42 0,030259987 -0,007259987
43 0,041772981 -0,107772981
44 0,037994585 0,116005415