MikesBikes-Advanced Player's Manual - Smartsims · Getting Started with Mikes Bikes 1 Read this...
68
MikesBikes-Advanced Players Manual (for windows software v6.80.0.22 and later) © Smartsims International Ltd
Transcript of MikesBikes-Advanced Player's Manual - Smartsims · Getting Started with Mikes Bikes 1 Read this...

MikesBikes-Advanced Players Manual (for windows software v6.80.0.22 and later)
© Smartsims International Ltd

i
Contents
Introduction and Overview 1
What is MikesBikes Advanced? ........................................................................ 1 Getting Started with Mikes Bikes ..................................................................... 1
Single-Player vs Multi-Player ................................................................... 1 Multi-Player Offline Mode ........................................................................ 2 Your Goal - Creating Shareholder Value (SHV)........................................... 3
Using the MB-A Single-Player .......................................................................... 4 The Main Decision Screen ....................................................................... 4 Single-Player Rollovers - Processing your Decisions .................................... 5 Viewing the Results ................................................................................ 6 Getting Help .......................................................................................... 6
The MB-A Model ............................................................................................ 8 The Management Goal ............................................................................ 8 The Underlying Model ............................................................................. 8
An Overview of the Industry .......................................................................... 10 History ................................................................................................ 10
Current Financial Position .............................................................................. 11
Marketing 13
Analyzing The Market .................................................................................... 13 Market Segments In MB-A ..................................................................... 13
Scenario Information / Reports ....................................................................... 16 Developing the Marketing Mix ........................................................................ 17
Product................................................................................................ 17 Price ................................................................................................... 18 Promotion ............................................................................................ 19 Place (Distribution) ............................................................................... 23
Operations 27
Current Operational Position .......................................................................... 27 Operations Decisions ..................................................................................... 28 Responsiveness ............................................................................................ 28
Capacity .............................................................................................. 28 Process ................................................................................................ 35
Quality ........................................................................................................ 36 Ongoing Strategic Control .............................................................................. 39
Just-In-Time Manufacturing (JIT) ............................................................ 39 Total Quality Management (TQM) ............................................................ 40

Contents ii
Product Development 41
The Product Development Decision ................................................................. 41 Developing a New Product ............................................................................. 42
Finance 46
Shareholder Value ........................................................................................ 46 Raising/Repaying Debt .................................................................................. 47 Raising/Repurchasing Equity .......................................................................... 48 Investor Relations ......................................................................................... 49 Corporate Takeovers ..................................................................................... 50
Takeover Rules & Regulations................................................................. 52
Drafting A Strategy 55
Drafting a Strategy ....................................................................................... 55
Appendix A - Additional Help 58
Further Help................................................................................................. 58 Hints And Tips ...................................................................................... 58 Frequently Asked Questions ................................................................... 60
Index 65

1
IN THIS CHAPTER
What is MikesBikes Advanced? .................................. 1 Getting Started with Mikes Bikes ............................... 1 Using the MB-A Single-Player .................................... 4 The MB-A Model ..................................................... 8 An Overview of the Industry ..................................... 10 Current Financial Position ......................................... 10
What is MikesBikes Advanced?
MikesBikes-Advanced (MB-A) is an Online Business Simulation that will give you the opportunity to run your own company, managing all the key functional areas of a Firm. It is used as an interactive tool to enhance the integration and learning of the basic concepts of business in a real life context: the Bicycle Manufacturing Industry. You will get hands on experience at making Price, Marketing, Operations, Product Development, and Financial Decisions.
Getting Started with Mikes Bikes
1 Read this Players Manual in full. At the least you should be familiar with what you are trying to achieve and what information is available in this Players Manual.
2 Go to www.smartsims.com and log in using the login and password provided by your instructor.
3 Watch the MikesBikes Videos. You can find these under the Manuals and Videos menu once you have logged into www.smartsims.com. There are many videos available from a basic introduction / overview of the Single-Player to a 5 step walkthrough about how to approach making your decisions.
4 Open your Single-Player and start practicing. This will allow you to get used to the simulation before your Multi-Player competition begins.
Single-Player vs Multi-Player
The MikesBikes Single-Player allows you to practice against a single computer controlled competitor. You are able to roll forward into the next decision period / year, or roll back as you wish in order to test and change your decisions. Your primary goals are to familiarize yourself with the simulation and to maximize your Shareholder Value (SHV).
C H A P T E R 1
Introduction and Overview
Introduction and Overview 2
In the Multi-Player you will compete against other student teams in your class to create the highest Shareholder Value (see 'goals' section below). Moving from one year (decision period) to the next is done by automatic rollover on preset dates. Before each of these scheduled times your team needs to have all decisions for the upcoming year entered into the Multi-Player.
Note: In Multi-Player, your Instructor decides when the simulation will move from one decision period to the next (ie. rollovers). You can not roll the Multi-Player forward and back yourself.
Multi-Player Offline Mode
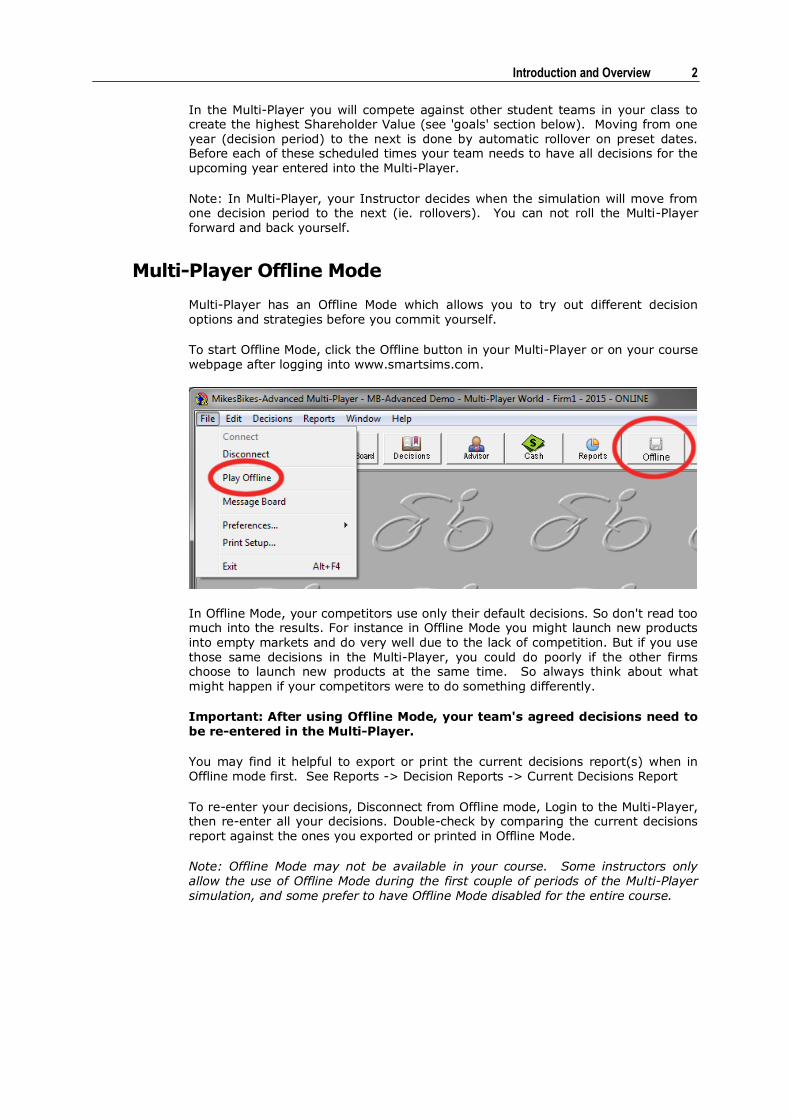
Multi-Player has an Offline Mode which allows you to try out different decision options and strategies before you commit yourself.
To start Offline Mode, click the Offline button in your Multi-Player or on your course webpage after logging into www.smartsims.com.
In Offline Mode, your competitors use only their default decisions. So don't read too much into the results. For instance in Offline Mode you might launch new products into empty markets and do very well due to the lack of competition. But if you use those same decisions in the Multi-Player, you could do poorly if the other firms choose to launch new products at the same time. So always think about what might happen if your competitors were to do something differently.
Important: After using Offline Mode, your team's agreed decisions need to be re-entered in the Multi-Player.
You may find it helpful to export or print the current decisions report(s) when in Offline mode first. See Reports -> Decision Reports -> Current Decisions Report
To re-enter your decisions, Disconnect from Offline mode, Login to the Multi-Player, then re-enter all your decisions. Double-check by comparing the current decisions report against the ones you exported or printed in Offline Mode.
Note: Offline Mode may not be available in your course. Some instructors only allow the use of Offline Mode during the first couple of periods of the Multi-Player simulation, and some prefer to have Offline Mode disabled for the entire course.

Introduction and Overview 3
Your Goal - Creating Shareholder Value (SHV)
As the Managers of your MikesBikes Firm, the primary goal for your company is to enrich its shareholders (owners) by providing a return on their investment in your company. The measurement of this total return to shareholders is known as Shareholder Value (SHV), so the success of your company is measured by the amount of SHV you can create in comparison to your competitors.
SHV is a measure of the current Share Price (which is the market value of one share in your company) plus the value of all past dividends paid, including interest accumulated on these past dividends. It is the value to an investor over time of owning a single share in your firm.
Your Share Price is mainly driven by:
Profitability and Earnings Per Share (EPS) for example: Firm A has 2 million shares issued and made $1 million profit. EPS = $0.50 Firm B has 20 million shares issued and made $10 million profit. EPS = $0.50 Firm C has 2 million shares issued and made $2 million profit. EPS = $1.00
Risk - Debt to Equity (D / E) Ratio A higher D/E ratio means higher risk which results in a lower share price A lower D/E ratio means lower risk which results in a higher share price
The Financial Results for All Firms report under the Financial Reports submenu shows how you are performing relative to your competitor(s).

Introduction and Overview 4
Using the MB-A Single-Player
The Main Decision Screen
When you are ready to start, go into the Main Decision Screen. Use the Functional Tabs at the bottom of the screen to make decisions in the key functional areas of your business (ie. ‘Market’, ‘Operations’, ‘Finance’, ‘Development’). The decisions that you make in each of these areas will determine how well your business performs.
You will see:
The name of your company, which you can change in the first period, using the Rename Button;
The period for which you are making decisions;
Results from the previous period (presented in the format of the Balanced Scorecard);
Four main types of functional decision. These appear on the relevant tabs to the bottom left of the screen: Marketing, Operations, Finance, and Product Development. Each tab leads to a corresponding Functional Decision Screen which are explained in more detail in later chapters.

Introduction and Overview 5
BALANCED SCORECARD
The Main Decision Screen shows a selection of measures that can be used under a Balanced Scorecard approach. The principle is to start with a few simple measures and add other measures later.
In this case, the measures used are already indicating potential problems in a few key areas of your business. For example, they show that you have no new product designs underway and are making a minimal investment in training.
Single-Player Rollovers - Processing your Decisions
MikesBikes is a turn or period based simulation, so you make decisions for an entire year.
Once you are ready to see the results of your decisions in the Single-Player, press the Rollover Button or select Rollover in the World Menu on your screen. Your decisions (and those of your competitor) will then be processed and the results calculated.
Note: In the Multi-Player there are no rollover and rollback buttons. Rollovers are pre-scheduled by your Instructor and it is your responsibility to have your final decisions entered prior to each rollover date.
If you are unhappy with the results you have two choices. You may
Roll back to make modifications to your decisions by pressing the Rollback Button.
Choose Restore from the World menu. This will clear all your decisions and take you back to the starting position.
You may want to roll back and roll over to try different combinations of decisions to achieve your desired share price. Once you have your results, try to see what share price you can achieve by the third rollover.

Introduction and Overview 6
Viewing the Results
MB-A makes a substantial number of reports available to let you know the results of your decisions and to help you analyze and learn from your performance.
These reports can be accessed from the Reports Menu, as shown in the picture here. You are encouraged to flick through these reports to get a better feel for what each provides.
Getting Help
MB-A is ambitious in its objectives and is a very rich learning environment. For this reason we have designed many additional features to get you going quickly with the system and have included in the software numerous sources of help. These include:
The Advisor (an on-line business mentor; see below)
More Info (three levels of online help; see below)
Online support (located in the Help menu).
Introduction and Overview 7
THE ADVISOR
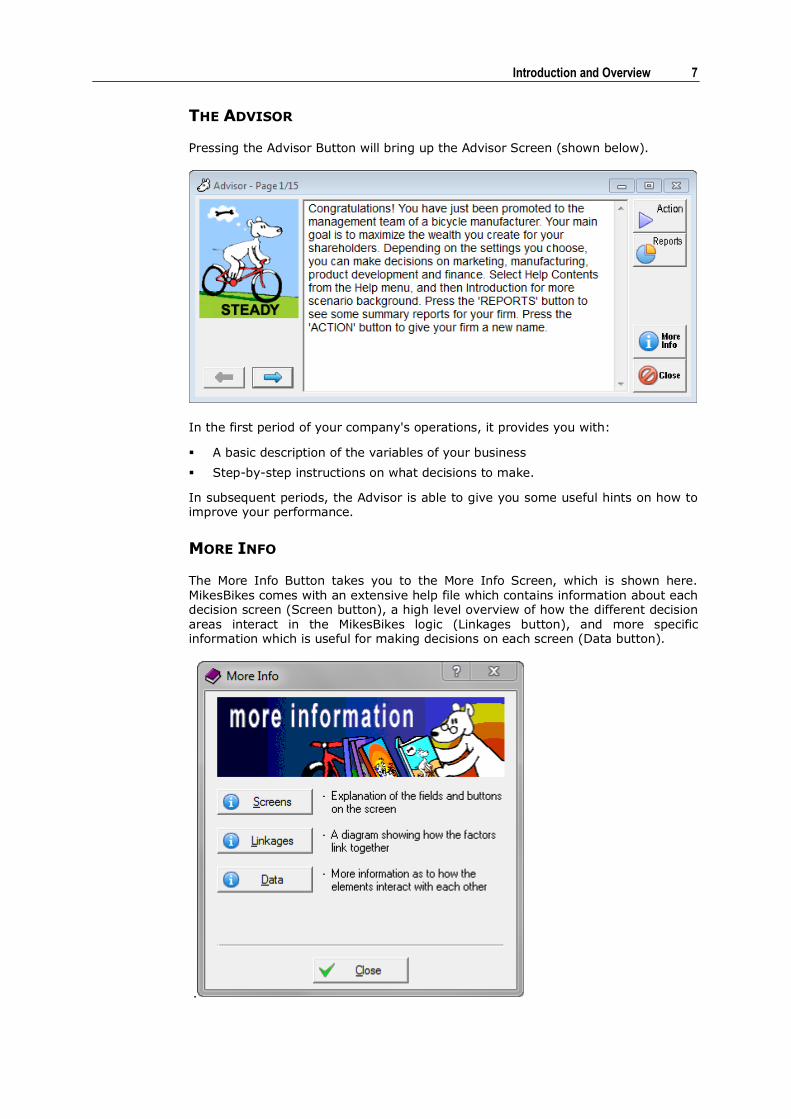
Pressing the Advisor Button will bring up the Advisor Screen (shown below).
In the first period of your company's operations, it provides you with:
A basic description of the variables of your business
Step-by-step instructions on what decisions to make.
In subsequent periods, the Advisor is able to give you some useful hints on how to improve your performance.
MORE INFO
The More Info Button takes you to the More Info Screen, which is shown here. MikesBikes comes with an extensive help file which contains information about each decision screen (Screen button), a high level overview of how the different decision areas interact in the MikesBikes logic (Linkages button), and more specific information which is useful for making decisions on each screen (Data button).
.

Introduction and Overview 8
The MB-A Model
The Management Goal
You are the new manager of an existing Bicycle Manufacturing company competing against other existing local Bicycle Manufacturing companies.
Your goal is to maximize Shareholder Value (SHV).
As part of your management brief, you will need to make many business decisions in a variety of functional areas. Your decisions apply for a whole year, so it is critical that you develop a coherent strategy, and draw up plans for the future. You are taking the reins of a going concern, and it is your job to ensure that the company continues to grow and prosper.
To make effective business decisions you will need to:
Analyze information
Identify alternative courses of action
Evaluate these alternatives
Consider the final decisions for your firm.
Ultimately your success will be determined by how well you promote your company as a stable, efficient, and enterprising bicycle manufacturer.
The Underlying Model
Business is typically highly cross-functional. Marketing, product development, operations, finance, human resources and information technology functions all interact regularly. All are important if the company is to work towards a common goal. MB-A models many of these functions.
The following high-level diagram indicates the main internal and external business relationships which affect your business. This is the underlying model on which MB-A is based, and shows how the many different business decisions interact to affect the outcome for your firm. You can find more detail about these relationships in the Logic section of the MB-A Help file.

Introduction and Overview 9
SHAREHOLDER VALUE
Maximizing shareholder value is assumed to be the ultimate goal for your business. To some degree your firm can control shareholder value itself, as the decisions that it makes will affect its current and future profits. However, shareholder value is also affected by some variables which are outside a firm's control, such as competitor actions and general economic conditions. These affect a firm's strategy also, as it seeks to improve its performance in the broader context of its competitive business environment.
STRATEGY
The most directly controllable determinant of a firm's long-term profitability is its strategy. Strategy results in two types of decisions:
Operating decisions that are concerned with achieving the best short-term performance from existing markets.
Investment decisions which relate to maximizing future profits by investing in new opportunities.
FUNCTIONAL STRATEGIES
Traditionally, an organization has been broken into a number of functions. While the names in a specific organization may vary, the generic functions are usually:
Marketing
Product development
Operations
Finance
Human resources
Information technology
A number of organizational techniques (such as Just-In-Time and Total Quality Management) have been developed to encourage all these functions to work together. One test of a well-run organization is to see whether the decisions taken within the individual functions support the overall strategy of the business. In MB-A it is assumed that the collective action of these functions is the strategy.
The Kolb Learning Cycle is a useful way of approaching your decisions for each simulated year.
Analyze Concrete Data First, look at the reports for the previous year to understand what data is available.
Reflect Second, consider the reasons for and the implications of the data and results that you are getting.
Learn and Change Third, learn from the results and make changes in how you will operate in the future.
Make New Decisions Finally make your new decisions for the following year. Once the next rollover has been processed, the cycle will start over again.

Introduction and Overview 10
An Overview of the Industry
In this section we give an overview of the business situation for MB-A at the beginning of the game.
History
MB-A models a bicycle industry in a western capitalist economy with a population of approximately 15 million people. Consumers in this market have high discretionary income, and will freely buy any bicycle that suits their individual needs.
There are five segments within this market: the low cost Kids Bike, Commuter Bike, and Leisure Bike segments; the mid-range Adventurer Bike segment; and the high cost Racer Bike segment.
Note: Each of these segments is sensitive to different factors and you may require a different approach to each to succeed. You should view Reports -> Scenario Information -> Market Segment Scenario Info for more information about each market segment.
Importers originally supplied their products within all segments, but in order to protect local manufacturers the government has regulated the market and restricted the importation of bicycles and bicycle components from foreign countries. This now leaves all five segments available to the local manufacturers, including your own. Due to the very competitive nature of the previous free market economy, all local manufacturers were only able to produce a single product in the Adventurer Bike segment. As such at this stage the other four segments do not have any products servicing them.
Note: Within the Single-Player there are only two segments in the market: the low cost Leisure segment and the higher cost Adventurer segment.
Introduction and Overview 11
Current Financial Position
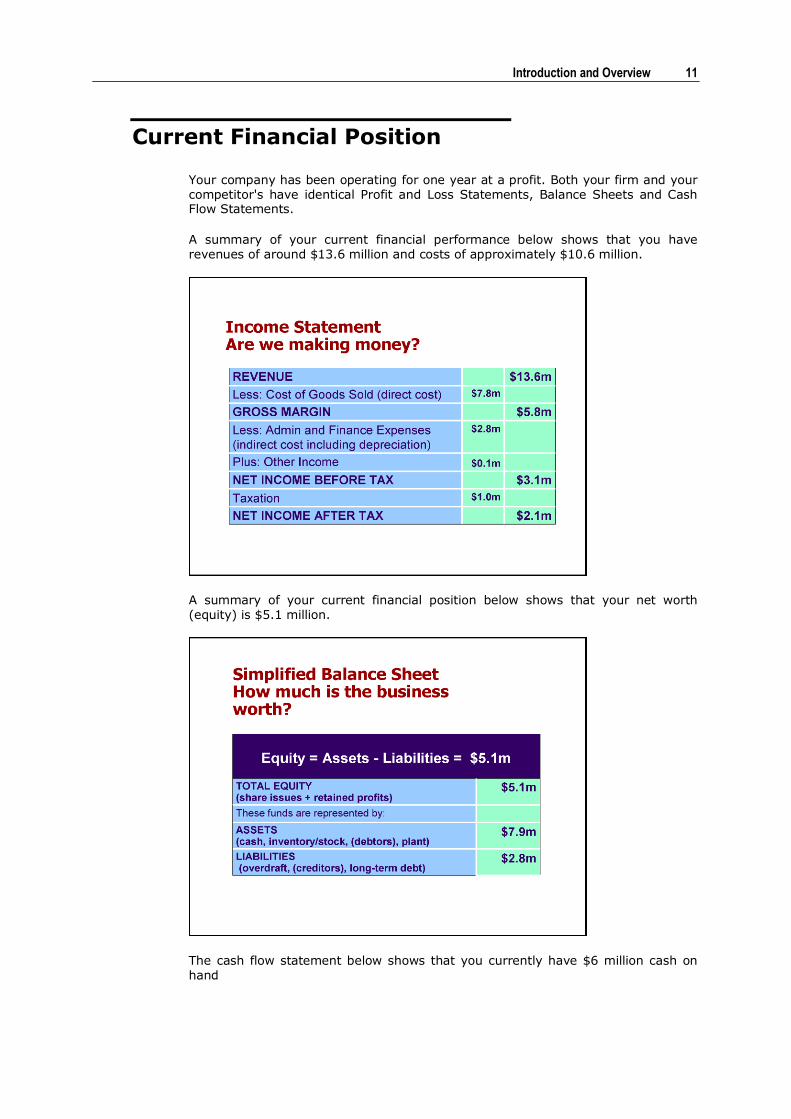
Your company has been operating for one year at a profit. Both your firm and your competitor's have identical Profit and Loss Statements, Balance Sheets and Cash Flow Statements.
A summary of your current financial performance below shows that you have revenues of around $13.6 million and costs of approximately $10.6 million.
A summary of your current financial position below shows that your net worth (equity) is $5.1 million.
The cash flow statement below shows that you currently have $6 million cash on hand

Introduction and Overview 12
.

13
IN THIS CHAPTER
Analyzing The Market .............................................. 13 Scenario Information / Reports ................................. 16 Developing the Marketing Mix ................................... 16
Analyzing The Market
Market Segments In MB-A
The Perceptual Map Report illustrated below shows the levels of Style/Design and Technical Specs which each of the market segments desire. You will find this report under the Reports Menu.
The circles indicate the acceptable ranges of Style/Design and Technical Specs. The Perceptual Map Report shows how well your products (and your competitors' products) match these requirements.
C H A P T E R 2
Marketing

Chapter 2 Marketing 14
The segment centers are the best points on the map to aim for. These are "ideal" positions, which satisfy the entire segment. You could of course move away from these center points, and produce a product that exceeds the style and technical specifications of the segment. You could sell it at the same price as one that met exactly the needs of that segment. However, the "better" product would not sell as well as one exactly meeting the segment needs, because it is not what the customer wants. Unnecessary features can be annoying for someone who wants a simple bike. Extra style and design attributes can reduce a bike's performance and functionality for someone who uses the bike for a specific purpose.
It is important to note that demand for a product is determined by many factors in addition to the product's attributes. These include pricing, quality, advertising, and distribution. In most cases these other factors are more significant than the closeness of a product to the center of the circle on its perceptual map.
Note: The best way to find what factors each market segment is sensitive to is to consult the scenario reports (Reports->Scenario Information). You should also check the Market Summary (All Product Details) report each year to see how your products compare to the competition on a range of different metrics.
Following extensive research into the types of people who purchase bikes, we have concluded that the potential bike market can be broken into five key segments. The segments have been given the names:
Adventurers (both Single-Player and Multi-Player)
Commuters (Multi-Player only)
Kids (Multi-Player only)
Leisure (both Single-Player and Multi-Player)
Racers (Multi-Player only)
Note that each firm currently only manufactures one type of bike, and these sell to the Adventurer segment. Adventurer customers desire trendy, high-specification, high quality mountain bikes and put them to reasonably demanding use. They are prepared to pay retail prices ranging from $1000 to $3,000.
On the other hand, Leisure customers purchase bikes for relaxed Sunday afternoon bike rides. They want a lower spec, stylish bike with a realistic retail price range from $100 to $700. No bikes suitable for the Leisure segment are being sold at the start of the game.
THE ADVENTURERS SEGMENT
The young suburban bicycle purchaser who wishes to buy a mountain bike broadly typifies the Adventurer segment. An Adventurer is typically a young person, focused on fitness and the outdoors. He or she wants a bike that will go anywhere and everywhere, and then come back. Often the Adventurer will forego luxury features in favor of a sturdy, high performance bike. The evidence is that the use of bikes for fun adventures and blood-pumping action is very popular and this segment has moderate underlying growth. The people who buy these bikes tend to be prepared to pay more for the right bike because they have a specific purpose for it and do not want to be held back with slow equipment or to have to stop for repairs.

Chapter 2 Marketing 15
THE COMMUTERS SEGMENT (MULTI-PLAYER ONLY)
The Commuter segment has appeared in the past decade in several overseas economies. Growing environmental concern worldwide has meant that more people are viewing their bike primarily as a means of transport. Bike users include university students who battle early morning rush-hour traffic to get to 7:30am lectures, factory workers who ride to work each day because they feel better getting some exercise before work, and business people who ride into the CBD each morning because they can't get a car park and see their bikes as an environmentally responsible option. All these people see their bikes essentially as packhorses. They don't need to look fashionable or do anything too exciting - they just have to get them from A to B. Thus Commuters place a great deal of emphasis on reliability and comfort. Price is of more concern than performance or of buying a well-known brand.
THE KIDS SEGMENT (MULTI-PLAYER ONLY)
The potential size of the Kids segment is understandably large. Children see bikes as a means of freedom. Many teenagers require a certain amount of mobility, but are unable to get a driver's license. The advantage of the Kids segment is that an average youth will go through 2.1 bikes between the ages of 4 and 15 years. The primary requirements of such purchasers are usually seen through their parents' eyes - the bike has to be simple and durable (so that it can take the knocks), but also relatively inexpensive, while having the best image on the block. Overseas, the Kids market segment is typically the biggest with a strong growth rate.
THE LEISURE SEGMENT
The Leisure segment is made up of people who own a bike, but use it only once or twice a month. Their bike is seen primarily as a means of relaxation, or leisure, and they go for a Sunday ride every now and then, often with friends or family. The Leisure segment therefore requires less in terms of high tech components and accessories, with "leisurites" preferring more comfort and style. Purchasers who buy bikes for leisure purposes are not very fussy, but they like to be able to buy a bike when they go out shopping, so long as they've seen the bike on TV before. Consumers in the leisure segment hate having to wait to buy, even if it is the best value for money. Because this segment is quite broad, it is also typically quite large.
THE RACERS SEGMENT (MULTI-PLAYER ONLY)
Those who view cycling primarily as a competitive activity dominate the Racer segment (as its name suggests). The typical Racer owns at least two bikes and trains at least three times a week. The range of Racers is great, from the Saturday morning school team to the Olympic Squad. However, we can generalize that the Racer wants a bike that performs - both on the track and on the road. It must be light, fast, and technically at the leading edge. Racers are not as sensitive to price as the other segments and some will pay up to $5,000 retail for the "right" bike. Racers also know what they want. They seldom take the advice of a sales assistant and are generally not influenced by advertising when making their purchase. They are also prepared to wait longer for delivery than most. The segment has slight growth in overseas markets although the total volume of sales is smaller than the other market segments.
Chapter 2 Marketing 16
Scenario Information /
Reports
The Scenario Reports give you detailed information about the preferences and shopping habits of each market segment, and all the costs associated with the scenario. You are encouraged to print these reports for future reference.
You access the Scenario Reports from the Reports Menu
Reports -> Scenario Information
There are six Scenario Reports
Market Segment Scenario Info Contains segment size and price range, segment sensitivity to price, advertising etc., media viewing habits, advertising and PR reach, shopping habits
Retail Distribution Channel Scenario Info Contains shopping habits and distribution channel information
Operations Scenario Info Contains various costs and limits relating to capacity, inventory, leadtime, and quality
Finance Scenario Info Contains various factors and limits relating to your company finances
Product Development Scenario Info Contains development costs and suggested targets for your first product development in each segment
Takeover Rules & Regulations Contains minimum bids and takeover premiums, share price of parent firm, securities commission rules, loans to subsidiaries, selling your shareholding
Note: This Players Manual is used for several different scenarios, and there are slight differences between Single-Player and Multi-Player. If you see a difference between the manual and a Scenario Report then assume the value from the Scenario Report is the correct one. You are encouraged to print these reports for future reference.

Chapter 2 Marketing 17
Developing the Marketing Mix
The next step is to determine the tactics for achieving the desired position in each of the segments. This involves considering the appropriate marketing mix - loosely called the "four Ps" (product, price, place, and promotion). More recently the importance of relationships (often called People and the "fifth P") has been introduced.
Product
In MB-A, all of the decisions involving your products are made within the Products Screen shown above. Here you can determine Price, Marketing, Sales Forecasts, when and how new bike products will be launched, and existing products can be modified and deleted.
NEW PRODUCTS
New products can be used to enter new segments of the market or to attempt to dominate a current segment with multiple product offerings.
New products can be launched at any time, using the Launch Button on the Products Screen. However before you can launch a new product, you must complete a design project in the Design and Development screen. Remember that product development takes a year to complete. So if you decide to create a new design project now, then it will not be available to launch as a new product until after the next rollover.
PRODUCT MODIFICATION
Existing products can be modified using the Modify Button on the Products Screen. Modifications can be made for a number of reasons:

Chapter 2 Marketing 18
To adapt the product to the changing needs of a segment
To improve an existing well known product so that it appeals to new market segments
To re-engineer processes - retaining the product's same physical characteristics but simplifying production requirements and lowering costs.
Modification allows for all the awareness of an existing product to be retained and transferred to a new (improved) design.
Where the firm holds obsolete stocks of finished goods for a product that has since been modified, the obsolete stocks are automatically dumped at cost.
(see the Product Development Chapter for more information)
PRODUCT DELETION
Products can be abandoned at any time if they prove no longer consistent with a firm's strategy. Use the Abandon Button on the Products Screen. Where the firm holds inventories of finished goods for deleted products these are dumped at cost.
Price
Pricing is made on the Products Screen for each individual product. Click on the Make/Sell Button to bring up the screen shown here. You must make a price decision for each product. The Price decision is of high priority and should align with your overall strategy, taking into account the price sensitivity of consumers in your target segments and the price of competing products.
Remember that this is the retail price paid by the final consumer. The distribution channels keep a certain percentage of this price and pass the remainder on to you.
(See the Operations chapter for a discussion of Production Volume and Safety Stock)

Chapter 2 Marketing 19
Promotion
In MB-A, brand awareness, product awareness and the influence of product public relations (PR) depend on current budget and the carry-over effect from previous periods. The effectiveness of product advertising and PR depends on choosing media that match the target market's media consumption habits. Brand advertising increases the effectiveness of product advertising and results in increased product awareness.
BRAND ADVERTISING
Only one brand is permitted (the name of your Firm, e.g. Real Cool Cycles). Brand advertising contributes to the effect of any other product advertising that is carried out. The branding budget determines the effectiveness of the advertising. In the next period, consumers "forget" the advertising to some extent, but any new brand advertising adds cumulatively to what is left. Note that Brand Advertising does not contribute to the effect of product public relations.
A budget can be allocated to brand advertising, as shown here. The resulting brand awareness applies to all the firm's products.
PRODUCT ADVERTISING
Analyzing the MikesBikes market has revealed that there are three media choices for advertising bikes - TV, Internet and Magazines.
Television:
Television is the most effective method of reaching a large audience. This is reflected in the fact that virtually every household has a television and that over 85% of all people watch television at least once a day. Adult bike riders tend to lead physically active lives, which lead them to have less time for television watching than the younger consumer. TV advertising is expensive, and a substantial budget is required to get effective results.
Internet:
Internet Advertising allows you to engage and reach potential customers through the devices they use for work and leisure (such as computers, smartphones, and tablets). It is important to note that the viewing of Internet advertisements is from predominantly a younger to middle aged audience. Internet advertising involves developing your company’s website, pay per click advertising on popular bike review sites, sponsored Ad Words on major search engines etc.
Chapter 2 Marketing 20
Magazines:
Magazines can reach a national market at relatively low cost per reader. In the MikesBikes market there are a variety of magazines catering to bike consumers ranging from specialist racing bike magazine through general outdoor adventure magazines to very general leisure magazines. Younger consumers are less interested in these magazines, but the adult age groups can be reached very effectively through magazine advertising.
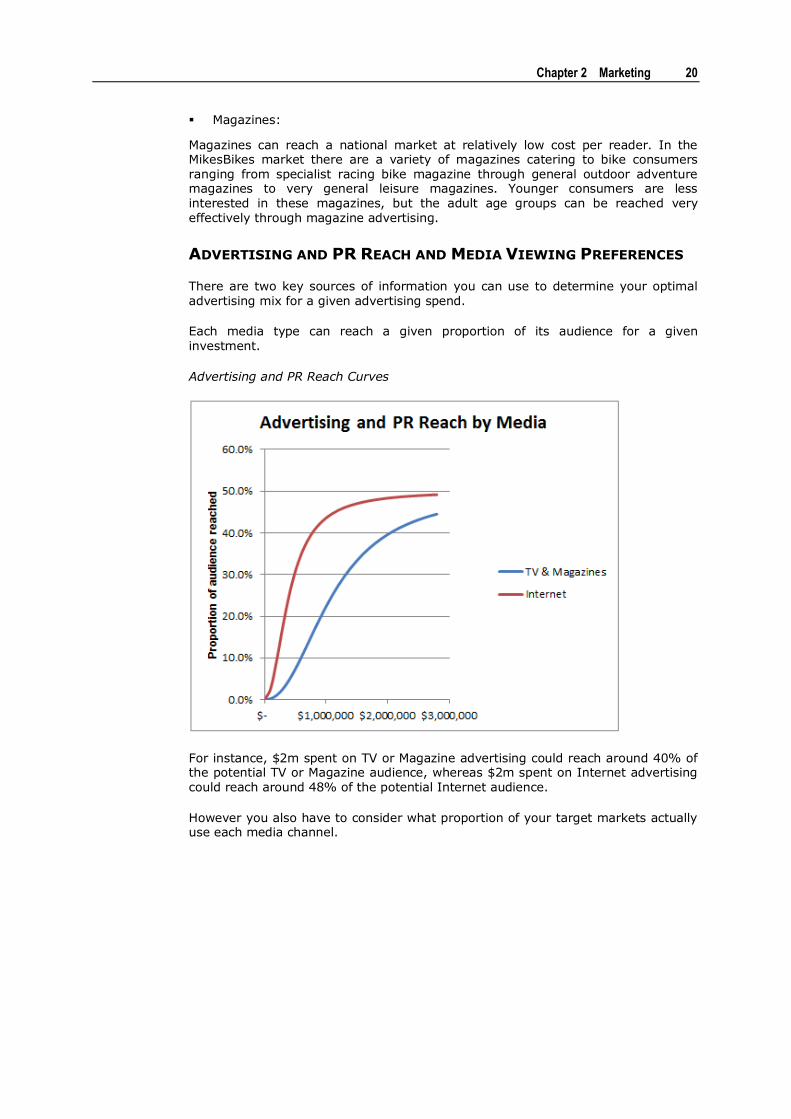
ADVERTISING AND PR REACH AND MEDIA VIEWING PREFERENCES
There are two key sources of information you can use to determine your optimal advertising mix for a given advertising spend.
Each media type can reach a given proportion of its audience for a given investment.
Advertising and PR Reach Curves
For instance, $2m spent on TV or Magazine advertising could reach around 40% of the potential TV or Magazine audience, whereas $2m spent on Internet advertising could reach around 48% of the potential Internet audience.
However you also have to consider what proportion of your target markets actually use each media channel.

Chapter 2 Marketing 21
Media Viewing Habits
Segment TV Internet Magazines Sensitivity to Advertising
Sensitivity to PR
Kids 70% 20% 20% High Low
Racers 10% 40% 60% Low High
Commuters 50% 20% 10% Med Low
Leisure 60% 30% 20% High Low
Adventurers 40% 30% 50% Med Med
Note: Because people watch/read more than one media channel, the rows can add to more than 100%
So lets look at the above example again and assume we have a $2m advertising budget to spend targeting the Adventurer market segment.
50% of the Adventurer segment read magazines. So our $2m spend would reach approximately 40% * 50% = 20% of the Adventurer segment.
But only 40% of the Adventurer segment regularly watch TV. So our $2m spend would reach approximately 40% * 40% = 16% of the Adventurer segment.
And only 30% of the Adventurer segment are reachable via Internet advertising. So our $2m spend would reach approximately 48% * 30% = 14.4% of the Adventurer segment.
So from that, you might think that your best use of your $2m product advertising budget is to spend it all on Magazines.
But maybe we can do better than that still. What happens if we spend half on Internet, and half on Magazines?
If we spent $1m on Internet we could reach approximately 43% of Internet viewers. And 30% of the Adventurer segment is reachable via Internet advertising. So we could reach approximately 43% * 30% = 12.9% of the Standard segment.
If we spend $1m on Magazines we could reach approximately 23% of Magazine viewers. And 50% of the Adventurer segment reads Magazines. So we could reach approximately 23% * 50% = 11.5% of the Adventurer segment.
So together, our $2m budget spent half on Internet and half on Magazine advertising would reach approximately 24.4% of the Adventurer segment. This is obviously a better use of our advertising budget than the first three options.
Note: You should read the Market Segment Scenario Info report under Reports->Scenario Information for more detailed information on the preferences of the market segments.

Chapter 2 Marketing 22
Specific product-related media advertising are budgeted for each product on the Product Decision Screen.
Advertising activity affects the awareness levels of the product. It should be remembered that awareness takes time to build and will decline over time as consumers "forget". Advertising experts estimate that an investment of around $2m is required to achieve initial awareness levels of 25%-50%. Less is required to maintain these levels. In deciding the level of investment in advertising, it is important to remember that certain segments are more responsive to advertising than others. The investment includes money spent on advertising research to develop advertising messages.

Chapter 2 Marketing 23
PRODUCT PUBLIC RELATIONS
Product public relations related to the bike market include product reviews and press releases. The idea is that consumers will give more weight to news and independent reviews than advertisements. Some segments are more sensitive to this kind of product promotion than others. See the Media Viewing Habits Table and Advertising Reach curves above for an indication of which media to use.
Specific product-related public relations are budgeted for each product on the Product Decision Screen.
Product PR works in a similar way to product media advertising. However each market segment's sensitivity to advertising may be different from its sensitivity to PR.
Place (Distribution)
Distribution (place) relates to the ability of the firm to make products accessible to its target segments. This is achieved through distribution channels - in this case through retail outlets.
The number of stores in the channel that decide to stock your products will depend on the retail price, margin, unit sales history, and extra support offered. You must specify what margin and what extra support (e.g. in terms of special promotions and discounts) you are going to offer the retailers in each channel. Note that the retailer margin decision refers to the percentage of the retail price that the retailer keeps. So a percentage of 60% means that they keep 60% of the sales revenue and give you the remaining 40%.

Chapter 2 Marketing 24
Maintaining existing distributors and acquiring new ones requires considerable resources. Extra Support costs are required to enable product training of retailers and providing promotional literature. Distribution costs vary based on the number of stores that currently stock your products.
Vendors of bikes can be broken into three categories: Bike Shops, Sports Stores and Department Stores (Note: Sports Stores are only available in Multi-Player). A brief description of each channel is given below.
BIKE SHOPS
The bike shop is a specialty store dedicated to bikes and bike-related products. Store assistants are trained bike specialists, able to tailor specific bikes to specific customers. People unsure of which bike to buy will usually go to a bike shop, especially if the bike is required for a specific purpose. Bike shops stock an extensive range of different models, catering to all types of purchasers. Bike shops generally stock bikes in the mid to high price range and bikes they stock in common with the department stores are often priced slightly higher than in the department stores. They are thus perceived as the quality bike vendor (at the cost of being perceived as the most expensive bike vendor). Bike shops rely on their higher margin to gain a profit, so are less likely to discount their stock. Their customers tend to be less price sensitive than those of department stores.
SPORTS STORES (MULTI-PLAYER ONLY)
Sports stores stock a wide range of sporting equipment, including bikes that have been designed for active, outdoors people. The staff at these stores do not know much about the bikes' technical aspects, but they are knowledgeable about the purpose for which the bikes will be used. They tend to sell bikes at a higher price than department stores because they have lower turnover and are able to offer extra advice that their customers are prepared to pay for. Consumers who buy from these stores generally know what they are looking for in a bike, or at least the purpose for which they will use the bike. However they are less particular than Racers. They may still buy bikes close to what they want if the bike best suited to their needs is unavailable, especially if it is a well-known brand. Because they buy for a purpose they will also tend to pay more than those segments which are less specific in their requirements.
DEPARTMENT STORES
Department stores stock a wide range of goods - from consumer durables (such as refrigerators and televisions) to apparel and kitchenware. They often specialize in budget or exclusive items. Department stores appeal to people wanting to complete their weekly shopping in one store. The typical shopper at a department store is out with his or her family on Saturday or Sunday afternoon. Often they do not have a definite purchase in mind, but in walking around may see something that appeals.
SUMMARY
Distribution costs include the salaries of head office marketing staff, and any extra support that you allocate to the distribution channels. Estimates of the shopping habits of the different segments in the different distribution channels are also given for you to use in deciding on a distribution strategy.
See: Reports -> Scenario Information -> Retail Distribution Channel Scenario Info.
This will give you specific distribution channel and consumer shopping habit information.

Chapter 2 Marketing 25
MAKING THE DISTRIBUTION DECISION
The Distribution Decision Screen is shown here. This is where you enter your decisions about distributing your products for the coming year. Here you decide the importance of the different channels.
To make decisions for a particular channel, click on either the Bike Shops or Department Stores Icon (In the Multi-Player you will have Sports Stores also). A summary of decisions for the selected distribution channel appears towards the bottom of the screen. Then click the Allocate Button and enter your decision in the dialog box that appears.
You must specify what margin and what extra support (e.g., in terms of special promotions and discounts, point of sale displays, extra sales staff training on your products etc.) you are going to offer the retailers in each channel. This is the margin the retailers keep - so don't increase it too much! eg. if your bike is priced at $1000, and your retail margin is 40%, then the wholesale price that you receive for each bike is only $600.
The number of stores in each channel that decide to stock your products will depend on the retail price, margin, unit sales history, and extra support offered.
DISTRIBUTION, RETAIL MARGIN, AND CONSUMER SHOPPING
HABITS
Note: The market segments all have medium sensitivity to Distribution apart from the Commuter segment, which has low sensitivity to distribution (see the Market Segment Scenario Information report under Reports->Scenario Information).
Your challenge is to decide how to set price and distributor retail margins in order to influence your distribution coverage in a way that results in either increased market share or increased profit.

Chapter 2 Marketing 26
Your distributors look at how much total retail margin they make from stocking all of your products and based on this they decide how many stores will stock your products. This then translates into a Distribution Index which ranges from 0 to 1 (higher is better). In general as your distributors make more money from selling your products, then more stores will stock them and your Distribution Index will increase.
Simple example of Distributor behavior
For instance, if you sold 10,000 bikes at $1000 with a 50% retail margin, then your distributors would make 10,000 * 50% * $1000 = $5m
But perhaps by dropping your price to $900, and your retail margin to 45% you can now sell 12,000 units. Your distributors would then make 12,000 * 45% * $900 = $4.86m
In this case, your Distribution Index would fall slightly as your distributors made less retail margin in total. This may not be an issue in the Commuter market, but it may disadvantage you in the other market segments. And of course, it also depends on your competitor actions. If your competitors have much higher distribution indexes than you, then you will lose more market share.
As you can see, sales volume is also an important component of distribution. So it may be beneficial to keep retail margins slightly higher whilst building initial market share for new products. And it may be possible to gradually reduce margins once you have established products with high sales volumes without adversely affecting your Distribution Index.
Think Strategically - Assess the needs of your Target Markets
Note: See the Retail Distribution Channel Scenario Info report under Reports->Scenario Information for the Shopping Habits of each market segment.
In the MikesBikes Multi-Player, there are five different market segments each with different preferences, sensitivities, price ranges, volume, and shopping habits. In general you should have a consistent strategy to meet the needs of these markets. So for instance if your strategy is to be a low cost, high volume manufacturer then it may may sense to target the Kids, Commuters, and Leisure segments. In this case, part of your high volume strategy might be to increase your margins by gradually reducing your retail margin to distributors as your sales volume climbs.
However what if you wanted to serve both the Racer Segment and the Commuter segment? From looking at the Retail Distribution Channel Scenario Info report we can see that 85% of Racers shop at Bike Shops, and none at Department Stores. But 60% of Commuters shop at Department Stores, and none at Bike Shops. So in this case we could still keep our Retail Margins higher for bike shops to support our primary distributors in the Racer segment whilst gradually reducing margins to Department Stores and Sports Stores.
Alternatively, your strategy could be as a niche manufacturer of high quality bikes for the Racer and Adventurer segments. In this case you might choose to keep your prices and retail margins higher and use distribution as a strategic advantage to increase your market share.
These are the types of distribution related trade-offs that you have to consider in MikesBikes when setting price, retail margin, and deciding which market segments to target and how you wish to compete within those segments. The key thing is that your distribution decisions should always support your overall strategy rather than being viewed in isolation.
27
IN THIS CHAPTER
Current Operational Position ..................................... 27 Operations Decisions ............................................... 28 Responsiveness ...................................................... 28 Quality .................................................................. 36 Ongoing Strategic Control ........................................ 39
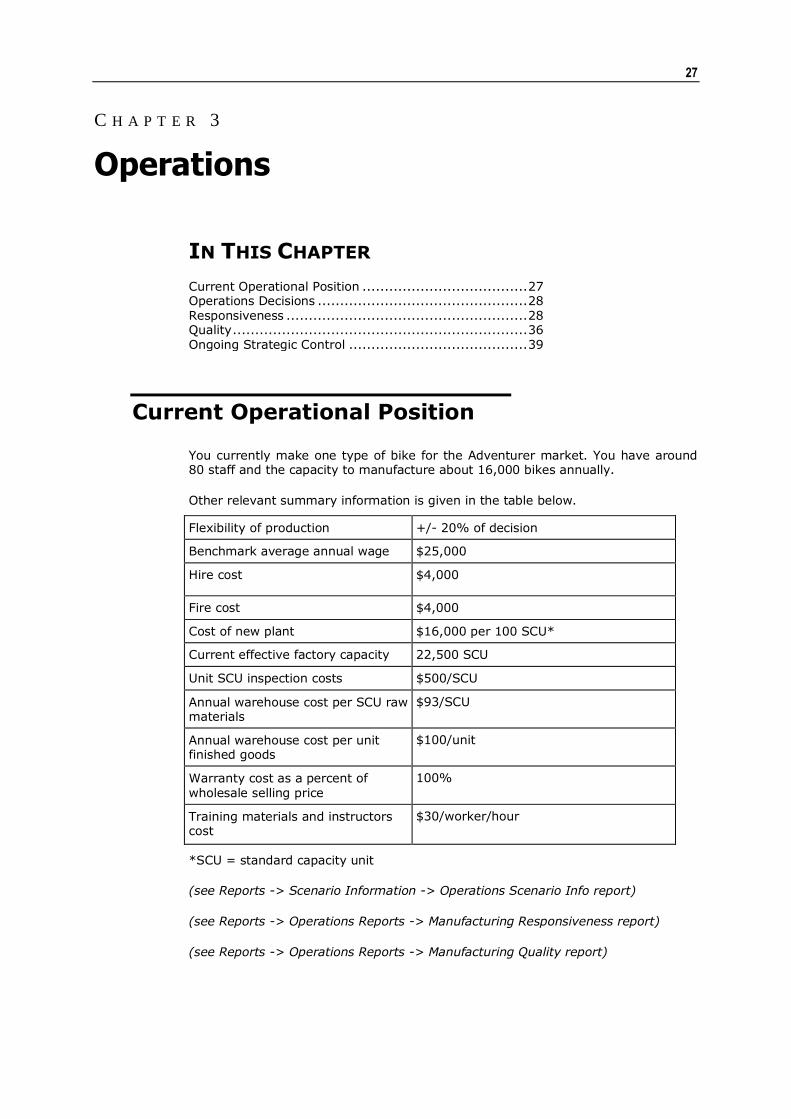
Current Operational Position
You currently make one type of bike for the Adventurer market. You have around 80 staff and the capacity to manufacture about 16,000 bikes annually.
Other relevant summary information is given in the table below.
Flexibility of production +/- 20% of decision
Benchmark average annual wage $25,000
Hire cost $4,000
Fire cost $4,000
Cost of new plant $16,000 per 100 SCU*
Current effective factory capacity 22,500 SCU
Unit SCU inspection costs $500/SCU
Annual warehouse cost per SCU raw materials
$93/SCU
Annual warehouse cost per unit finished goods
$100/unit
Warranty cost as a percent of wholesale selling price
100%
Training materials and instructors cost
$30/worker/hour
*SCU = standard capacity unit
(see Reports -> Scenario Information -> Operations Scenario Info report)
(see Reports -> Operations Reports -> Manufacturing Responsiveness report)
(see Reports -> Operations Reports -> Manufacturing Quality report)
C H A P T E R 3
Operations
Chapter 3 Operations 28
Operations Decisions
The Manufacturing Decision Screen is where you enter your decisions about the money you are going to spend on manufacturing process-related costs. MB-A models two components of operations explicitly - responsiveness and quality. Changes made to these areas apply for all the firm's products.
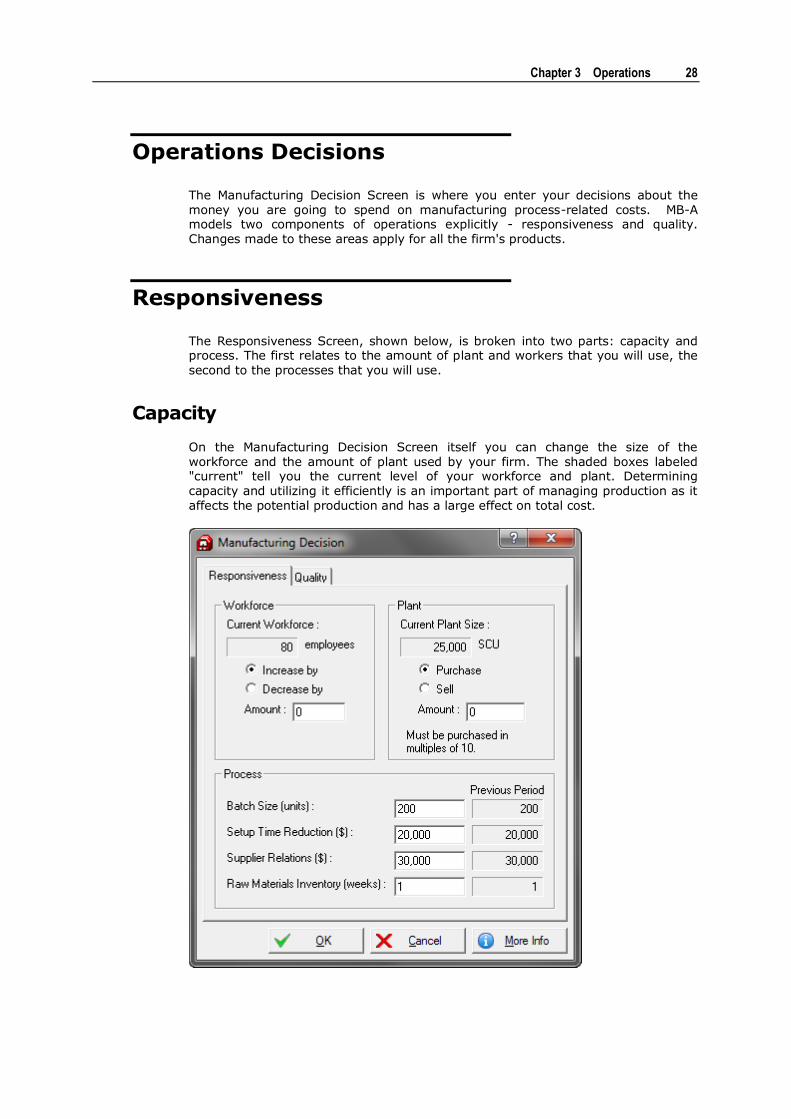
Responsiveness
The Responsiveness Screen, shown below, is broken into two parts: capacity and process. The first relates to the amount of plant and workers that you will use, the second to the processes that you will use.
Capacity
On the Manufacturing Decision Screen itself you can change the size of the workforce and the amount of plant used by your firm. The shaded boxes labeled "current" tell you the current level of your workforce and plant. Determining capacity and utilizing it efficiently is an important part of managing production as it affects the potential production and has a large effect on total cost.
Chapter 3 Operations 29
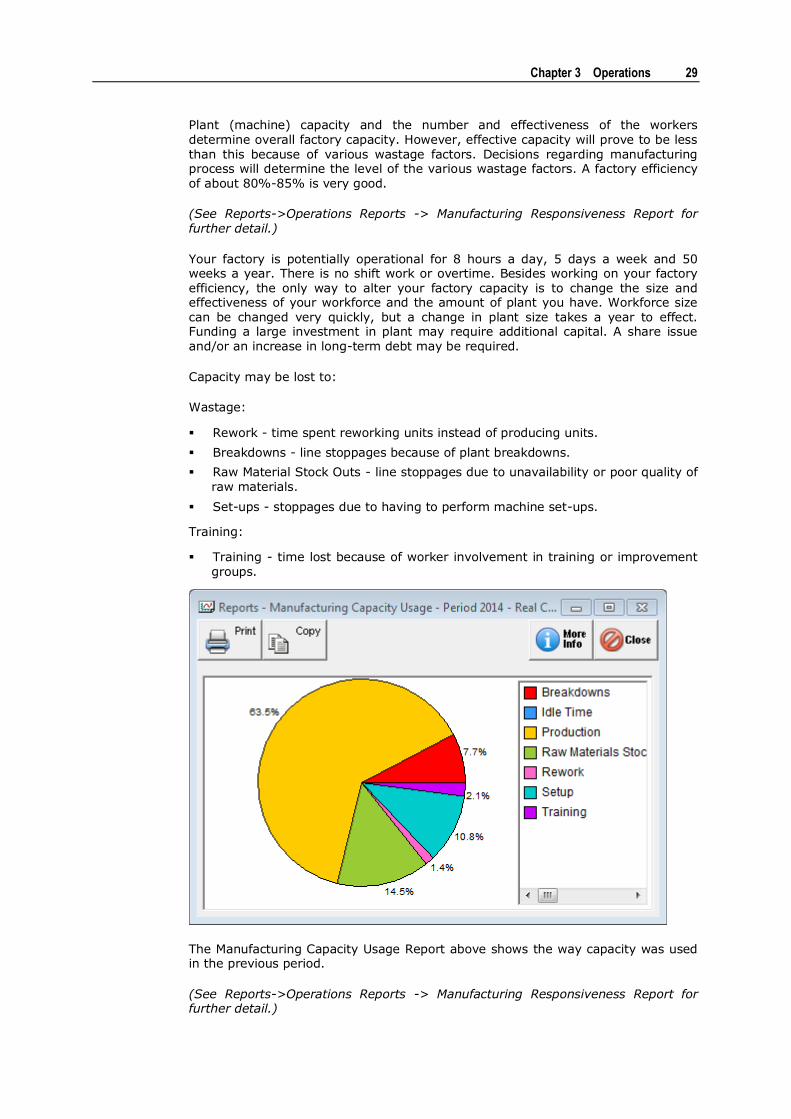
Plant (machine) capacity and the number and effectiveness of the workers determine overall factory capacity. However, effective capacity will prove to be less than this because of various wastage factors. Decisions regarding manufacturing process will determine the level of the various wastage factors. A factory efficiency of about 80%-85% is very good.
(See Reports->Operations Reports -> Manufacturing Responsiveness Report for further detail.)
Your factory is potentially operational for 8 hours a day, 5 days a week and 50 weeks a year. There is no shift work or overtime. Besides working on your factory efficiency, the only way to alter your factory capacity is to change the size and effectiveness of your workforce and the amount of plant you have. Workforce size can be changed very quickly, but a change in plant size takes a year to effect. Funding a large investment in plant may require additional capital. A share issue and/or an increase in long-term debt may be required.
Capacity may be lost to:
Wastage:
Rework - time spent reworking units instead of producing units.
Breakdowns - line stoppages because of plant breakdowns.
Raw Material Stock Outs - line stoppages due to unavailability or poor quality of raw materials.
Set-ups - stoppages due to having to perform machine set-ups.
Training:
Training - time lost because of worker involvement in training or improvement groups.
The Manufacturing Capacity Usage Report above shows the way capacity was used in the previous period.
(See Reports->Operations Reports -> Manufacturing Responsiveness Report for further detail.)

Chapter 3 Operations 30
STANDARD CAPACITY UNITS
The factory capacity required to produce the target volumes of products can be determined using standard capacity units (SCU). This is a standard production term used to represent a unit of work on a product. Each product requires a certain number of SCU to produce, and typical products are in the range of 0.1 to 2 SCU per bike depending on the product specifications and the degree of cost reduction incorporated in the design. The rule is that for each $300 of product prime cost, a product requires 1 SCU to produce. For example, your existing Adventurer Bike has a product prime cost of $275, therefore it requires 0.92 SCU for every unit produced in a given period. The example in the following table demonstrates how overall capacity requirements can be determined with this information.
Product 1 Product 2 Total
Desired production in units 20,000 10,000
SCU per unit 0.92 2
Required capacity in SCU 18,400 20,000
Required capacity for 2 products (SCU)
38,400
Plus wastage estimate (SCU) 10,000
Overall required factory capacity (SCU)
48,400
(Note: See Reports -> Product Development Project Results and Reports -> Products, Sales, Margin, Production for more detailed information on the exact SCU requirements for each product)
Worker and plant capacity can be used in a variety of combinations to produce the same amount of factory capacity. The optimum level of capital and labor intensity will depend on a number of factors.
WORKFORCE
(see Reports -> Operations Reports -> Manufacturing Responsiveness report)
(see Reports -> Operations Reports -> Manufacturing Quality report)
You can increase or decrease the size of your workforce each period. A portion of your workforce is automatically assigned to the office staff roles of administration, production administration and sales. The rest of your workforce is available as factory workers. This means that you need to monitor your factory workforce capacity carefully and increase or decrease it as necessary. For example, if your sales volume increases or your batch size falls then your office staff requirements will increase and you will have fewer staff available for your factory workforce.
Factory workers can contribute a maximum of 625 SCU of capacity each per period, depending on their skill and motivation levels. This capacity affects the overall factory capacity of the firm. However at the start of the first period all of the factory and office staff will be able to produce roughly half (370 SCU) of their potential maximum capacity.

Chapter 3 Operations 31
The average annual factory worker wage cost is $25,000. Administration, production administration and sales staff receive on average twice this amount. In MB-A, the salaries and training programs of your factory and office staff are linked. Specifically, office staff are automatically paid twice the salary that you set for your factory workers and the same level of training applies to all staff. As a result, worker effectiveness is always the same for your entire workforce: you cannot pay or train the office staff more than the factory staff or vice versa.
It costs $4,000 to hire a new person and $4,000 to make one redundant.
MANAGING YOUR WORKFORCE - THE RELATIONSHIP BETWEEN
EMPLOYEE MOTIVATION, TRAINING, STAFF TURNOVER, QUALITY,
AND WORKER CAPACITY
You need to think carefully about the relationship between your overall strategy and how employee motivation and employee skill levels relate to that, especially if your strategy is to be a low cost, high volume manufacturer.
In general, well trained and motivated workers are more productive than poorly trained workers so you need to employ fewer workers to achieve a given level of worker capacity. And in general if your workers are well trained and motivated you need fewer Administration staff.
Well trained workers are a significant factor in improving your internal quality.
Workers are more motivated when they are paid more and when they are well trained. They are less motivated when you fire other workers as their feeling of job security decreases.
Poorly motivated and poorly trained workers can contribute to significant staff turnover (sometimes as high as 40% to 50% per year). That gets expensive because each worker than is replaced costs $4000 to replace. Also each new worker arrives with a minimum level of training, so your average employee skill level is reduced which lowers your internal quality.
So remember to maintain an appropriate balance in managing your workforce rather than using a 'slave labor' model even if your overall strategy is to be a low cost manufacturer.
PLANT
Plant can be purchased or sold each period in multiples of 10 SCU. Each 10 SCU of plant costs $1,600 to buy, and any new plant takes one period to be commissioned and become productive. Plant is depreciated in the annual accounts using the diminishing value method, at a rate of 20% per annum.
Plant can be sold at the end of any period. However the selling price will depend on the age of the plant and how well it has been maintained. Your decisions in the Preventative Maintenance Field will affect this. If there is any difference between the actual selling price of plant and its book value then that will be reported in the accounts as either a loss or gain on sale.
Chapter 3 Operations 32
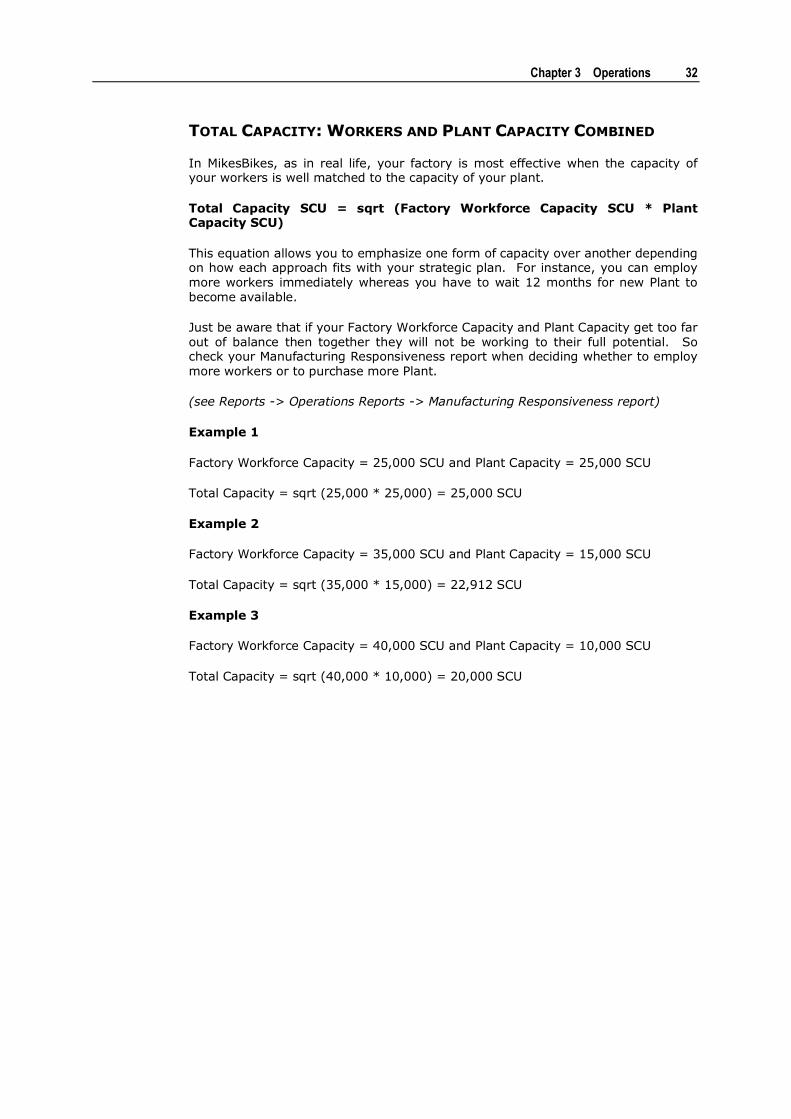
TOTAL CAPACITY: WORKERS AND PLANT CAPACITY COMBINED
In MikesBikes, as in real life, your factory is most effective when the capacity of your workers is well matched to the capacity of your plant.
Total Capacity SCU = sqrt (Factory Workforce Capacity SCU * Plant Capacity SCU)
This equation allows you to emphasize one form of capacity over another depending on how each approach fits with your strategic plan. For instance, you can employ more workers immediately whereas you have to wait 12 months for new Plant to become available.
Just be aware that if your Factory Workforce Capacity and Plant Capacity get too far out of balance then together they will not be working to their full potential. So check your Manufacturing Responsiveness report when deciding whether to employ more workers or to purchase more Plant.
(see Reports -> Operations Reports -> Manufacturing Responsiveness report)
Example 1
Factory Workforce Capacity = 25,000 SCU and Plant Capacity = 25,000 SCU
Total Capacity = sqrt (25,000 * 25,000) = 25,000 SCU
Example 2
Factory Workforce Capacity = 35,000 SCU and Plant Capacity = 15,000 SCU
Total Capacity = sqrt (35,000 * 15,000) = 22,912 SCU
Example 3
Factory Workforce Capacity = 40,000 SCU and Plant Capacity = 10,000 SCU
Total Capacity = sqrt (40,000 * 10,000) = 20,000 SCU

Chapter 3 Operations 33
PRODUCTION VOLUME IN MB-A
The Product Screen allows product-specific decisions to be made.
(See the Marketing Chapter for more information on the Pricing and Advertising decisions)
For each product you must set a target level of production for the year. The following formula provides one means of considering this:
Target Annual Production = Sales Forecast - Beginning Finished Goods + Desired Ending Finished Good
The target level of production is only a desired level of production. Actual production levels during the year may vary slightly from this depending on:
Capacity constraints - if insufficient capacity is available due to a lack of workers/plant or wastage such as breakdowns or reworks then actual production may be less than target production.
Variations in demand - if demand is substantially greater than forecast then the factory may increase production slightly to take advantage of this. Similarly if demand proves to be unexpectedly low, the factory may be able to reduce production to avoid stockpiling excessive quantities of finished goods. The maximum production flexibility is a variation of 20% up or down on the planned figure.

Chapter 3 Operations 34
TARGET FINISHED GOODS INVENTORY (SAFETY STOCK)
In addition to setting a target production level for each product, the firm needs to set a target finished goods inventory level. This inventory level is measured in "weeks of demand". The actual holding in units will vary depending on the levels of actual demand. This is similar to the production decision, in that it indicates only a desired level of finished goods. Actual finished goods inventories may vary depending on demand for the product and actual production levels. For example if demand outstrips production then a firm may be left with no stock in its finished goods warehouses despite desiring to hold a month's worth of inventory.
The planned safety stock level indicates how much stock you would like to keep to cope with fluctuations in demand.
The target finished goods inventory decision is important. These goods are held in warehouses throughout the country and can be used to reduce the delivery time to distributors significantly. However, there is a warehousing cost of around $100 per SCU of finished goods inventory. If there is no finished goods inventory then delivery time depends on the factory lead-time. For this reason, firms with long lead-times may choose to hold large finished goods inventories to improve their delivery responsiveness.
Advantages in delivery time must also be traded off against the cost of warehousing goods and the implicit cost of financing them.
PRODUCTION FLEXIBILITY
Your MB-A scenario has 20% Production Flexibility built in.
To check, see Reports -> Scenario Information -> Operations Scenario Information Report. If your scenario has Production Flexibility activated, you will see a +/- 20% next to “Production Volumes flex according to demand”. A figure here of zero indicates no Production Flexibility.
If activated, this means that your production figures become a target, and your factory can adjust production up or down by up to 20% to try to meet actual demand (assuming sufficient spare capacity). This reduces the impact of poor production planning decisions and reduces the likelihood that your Firm will become bankrupt.
For example: If you planned to produce 20,000 units of a bike then actual production could flex between 18,000 and 22,000 units to meet actual demand (again, provided you don't hit any capacity constraints).
View the Products - Sales, Margin, Production report to compare Planned vs Actual production.

Chapter 3 Operations 35
Process
Decisions on the operations process are also made on the Responsiveness Screen. You will find this screen by clicking on the Manufacturing Decision Screen under the Operations Tab on the Main Decision Screen.
BATCH SIZE
Batch size reflects the average batch size used in the factory. Larger batch sizes will proportionately reduce the number of set-ups and hence increase available capacity. However this comes at the cost of increasing factory lead-time and potentially delivery times. The other main effect of batch size is on the number of administration and production administration staff. Large batch sizes make production scheduling relatively simple. But small batch sizes increase complexity and require more production administration staff. For example, the Accounts Department can process a small number of large batches relatively easily. However, processing a larger number of smaller batches requires more effort. So from a human resources viewpoint, smaller batch sizes require more administration staff. Remember that this will reduce your factory workforce in the MB-A environment unless you hire more staff. (Note that this effect can be offset somewhat by having better trained and motivated workers).
REDUCING SET-UP TIME
You can also spend money to reduce your set-up time. Such expenditure would allow you to analyze set-up procedures, develop and document new operating procedures and modify plant to facilitate quicker changeovers.
Any investment, which you make in reducing set-up time, will enable you to increase effective capacity (provided batch size remains constant).
We assume that there is a baseline standard time needed to complete the set-up of all the machines required to make a batch of bikes. By investing in set-up time reduction you can reduce this time. With the present batch sizes and number of products, each firm is losing about 11% of capacity on set-ups.
SUPPLIER RELATIONS
Firms can also choose to direct resources into improving supplier relations. Such expenditure could be directed at negotiating single source contracts, providing suppliers with demand forecasts and educating suppliers in Just-In-Time and Total Quality Management techniques. It may also extend to paying incentives to suppliers who provide quality products, consulting suppliers when designing new products and paying increased transport costs to enable more frequent deliveries.
The benefits of investing in supplier relations include reducing line stoppages due to reduced unavailability and/or inadequate quality of materials. Current relationships with suppliers are only about half as good as they could be. It will require a significant investment to improve supplier relations, but once improved it will require a lower level to maintain this improvement as the level of accumulated supplier relations deteriorates over time.
(see Reports -> Operations Reports -> Manufacturing Quality report)

Chapter 3 Operations 36
RAW MATERIALS INVENTORY
You must decide on the average level of raw material inventories that you want to hold. This level is expressed in weeks. It is based on weeks of production, and may vary with the level of production. Raw materials inventories provide a buffer to protect against unreliable suppliers and to ensure there are sufficient materials to cover late deliveries.
You should view the Manufacturing Responsiveness Report and if you are losing significant amount of capacity to Raw Materials Stockout, then consider increasing your Raw Materials Inventory.
However, firms incur a warehousing and implicit financing cost when they hold raw material inventories. There is an annual holding cost of $47 per SCU of raw materials inventory ($93 / SCU in Multi-Player).
As your Supplier Relations Index increases, your supply of Raw Materials improves and you can afford to hold lower stocks of Raw Materials Inventory.
Quality
Decisions in this area determine the quality of the products produced. The gray 'Previous Period' Boxes show the values that were used in the previous decision-making period, and they will be the default options for this period.

Chapter 3 Operations 37
AVERAGE SALARY
The average salary level you set will affect not only your bottom line but also worker motivation and effectiveness. Factory workers are paid (on average) the rate you select. Administration staff are paid (on average) twice this rate. For comparison purposes, the average industry salary is $25,000 per year.
(See earlier comments under Responsiveness about the Relationship between Employee Motivation, Training, Staff Turnover, Quality, and Worker Capacity)
TRAINING
You must decide how much time each worker spends on training. For factory workers this training includes specific on-the-job skills training, cross-training to enable them to operate in different areas of the plant, and external training in areas such as quality methods, teamwork and supervisory skills. For administration staff this training includes computer skills, stress management and team development.
Training has a number of significant impacts. In the short term, it will decrease capacity directly since it takes factory workers away from the factory for a time. However, training will increase the skill level of these workers and through the increased effectiveness of improvement groups may actually increase the level of overall capacity in the longer term. In addition, the application of quality methods may reduce the number of defects produced. Training will make office staff more efficient. The result will be that you will need fewer staff for a given level of sales or batch size.
For every worker-hour of training specified in the decision, $30 will be spent on outside trainers and training materials.
If employees spend about 40 hours in the year on training this will equate to 2% of their time (since the total working time is 40 hours per week times 50 weeks per year). In this case, you will incur a cost of $1,200 per year per employee for external trainers and training materials. You will need to increase that to 100 hours or more to significantly improve your workers to improve their skills, knowledge and effectiveness. They are currently working at around half of their potential.
The effect of staff turnover should also be considered when making training decisions. New workers usually have lower skill levels than existing employees.
(See earlier comments under Responsiveness about the Relationship between Employee Motivation, Training, Staff Turnover, Quality, and Worker Capacity)
PREVENTATIVE MAINTENANCE
You should decide on the total amount to spend on preventative maintenance. This is an aggregate amount and so should be varied when a firm changes its plant capacity.
You should look at the Manufacturing Responsiveness Report, and if you are losing a significant amount of time to breakdowns, then consider increasing your spend on Preventative Maintenance.
Expenditure on preventative maintenance has a number of effects. Preventative maintenance reduces the likelihood of plant breakdown and losses in capacity caused by these delays. Adequate maintenance also serves to maintain the resale value of plant. Finally, ensuring the plant is producing within tolerances contributes towards the reduction of defects and improves your internal quality.

Chapter 3 Operations 38
Currently your firm has 25,000 SCU of plant. If it were new it would be worth $4 million. However it is now a few years old and its book value is already only $1.6 million. The plant has been reasonably well maintained, but it is starting to lose a significant proportion of its potential is lost due to breakdowns.
QUALITY SYSTEMS TECHNOLOGY
"Quality systems" refer collectively to the processes that ensure that the firm achieves quality "at source" (i.e. in the factory). They involve installing equipment to monitor the manufacturing processes and to pinpoint problems before they occur.
(see Reports -> Operations Reports -> Manufacturing Quality report)
INSPECTION
Firms need to decide what proportion of their final production they wish to inspect. Sampling techniques eliminate the need for 100% inspection. You can identify about half of defective finished products by sampling only around 10% of those products. However, note that the Adventurer segment is quite sensitive to product quality. Before reducing inspection here, make sure that the underlying product quality is adequate.
The cost of inspection is $500 per SCU for every unit inspected. This is small in comparison with the cost of servicing warranty claims. It is estimated that the average warranty claim costs at least the wholesale price of the bike concerned.
INTERNAL VS EXTERNAL QUALITY
The above quality and HR decisions affect the internal and external failure rates, (ie. the number of defective products produced, and the number of defective products that reach the final customer).
Average Salary and Training Hours will have a significant impact on the average skill and motivation level of your production staff.
Preventative Maintenance, Quality Systems Technology and Supplier Relations will affect the number of defects resulting from machinery.
All of the above factors together will determine the total number of defective products that will be produced. This is your internal defect rate, and is often referred to as 'Quality at the Source'.
The Inspection Decision sets the proportion of finished bikes that will be inspected for defects before leaving the factory to be sold. This affects your external defect rate, or the proportion of faulty products that you ship to customers. This is what determines your Quality Index.
So from this you can see there are two ways of ensuring high quality - Quality at the Source vs a high inspection rate. Depending on your strategy, both approaches are viable. However be aware that having a high inspection rate can be very expensive as your production volume climbs.

Chapter 3 Operations 39
Ongoing Strategic Control
For any period, the capacity usage chart presented above reflects how theoretical capacity was actually used. This is a useful tool for understanding the firm's productive capability.
By looking at the various measures on this chart, an organization is able to monitor its operations. It may use its various decisions on set-ups, batch size, quality, training, salary, workforce size, machine capacity, maintenance, supplier relations and production of the different products to utilize capacity more efficiently and reduce wastage and idle time.
(also see Reports -> Operations Reports -> Manufacturing Responsiveness report)
(also see Reports -> Operations Reports -> Manufacturing Quality report)
Just-In-Time Manufacturing (JIT)
Just-In-Time Manufacturing is a philosophy that attempts to reduce all types of waste. While the original emphasis was on inventory, it later evolved to include all types of waste and especially time.
JIT Manufacturing may become more important as your product range and delivery volumes increase.
For instance, a traditional approach to efficiently using production capacity might be to increase batch sizes, and compensate for longer production lead times and poor supplier relations with increased stocks of finished goods and raw materials.

Chapter 3 Operations 40
A JIT approach to reducing waste might see you focus on investing in setup time reduction and using much smaller batch sizes. You could invest in supplier relations to ensure that your raw materials arrive quickly and without faults. You may then be able to reduce your inventory of finished goods and raw materials whilst still maintaining short delivery times.
Like any management technique though, you need to decide how JIT fits with your long term strategy. If you are only producing a couple of bikes for markets that tolerate longer delivery cycles then you may be better off with a traditional approach to maximizing production utilization.
Total Quality Management (TQM)
Total Quality Management (TQM) was first pioneered by W. Edwards Deming. The basic idea is that if enough time and effort is expended on training and supplier relations, there is no need for final inspection since there is inspection at the source or quality at the source.
Traditional methods of quality control involve sampling or inspecting a proportion of your completed product for faults before it leaves the factory. This can be time consuming and expensive as the inspected items are often damaged or destroyed in the process.
By investing in training of your workers, quality systems, and supplier relations to improve your raw materials you are likely to build fewer faulty products.
Like any management technique though, you need to carefully evaluate how TQM concepts fit with your long term strategy. Depending on the needs of your markets it may be more effective to rely on higher inspection rates to keep the external defect rate at an acceptable level rather than investing heavily in quality.
41
IN THIS CHAPTER
The Product Development Decision ............................ 41 Developing a New Product ........................................ 42
The Product Development
Decision
In the MB-A environment you may choose to undertake product development projects in the coming year to develop designs for new products or modifications for existing ones. The results of these product development projects are available in the year following implementation. ie. you cannot use them until after the next rollover.
TYPES OF PRODUCT DEVELOPMENT PROJECTS
The projects that you undertake may be any combination of the three types described below:
New products - development of a new product, often for a new market segment.
Product modification - modification of an existing product to better satisfy the market.
Value engineering projects - reduction of product prime cost (and required standard capacity units) while maintaining current physical characteristics.
C H A P T E R 4
Product Development

Chapter 4 Product Development 42
Developing a New Product
The Design and Develop Screen is where you enter your decisions about product design and development for your firm for the coming year. Product Development is organized into separate design projects.
Each design project has:
A project name
A set of target product attributes
A prime cost
A project budget
PROJECT NAME
Each new project requires a new name. We suggest that you use similar names for successive projects (e.g. Cruiser1, Cruiser2, etc).
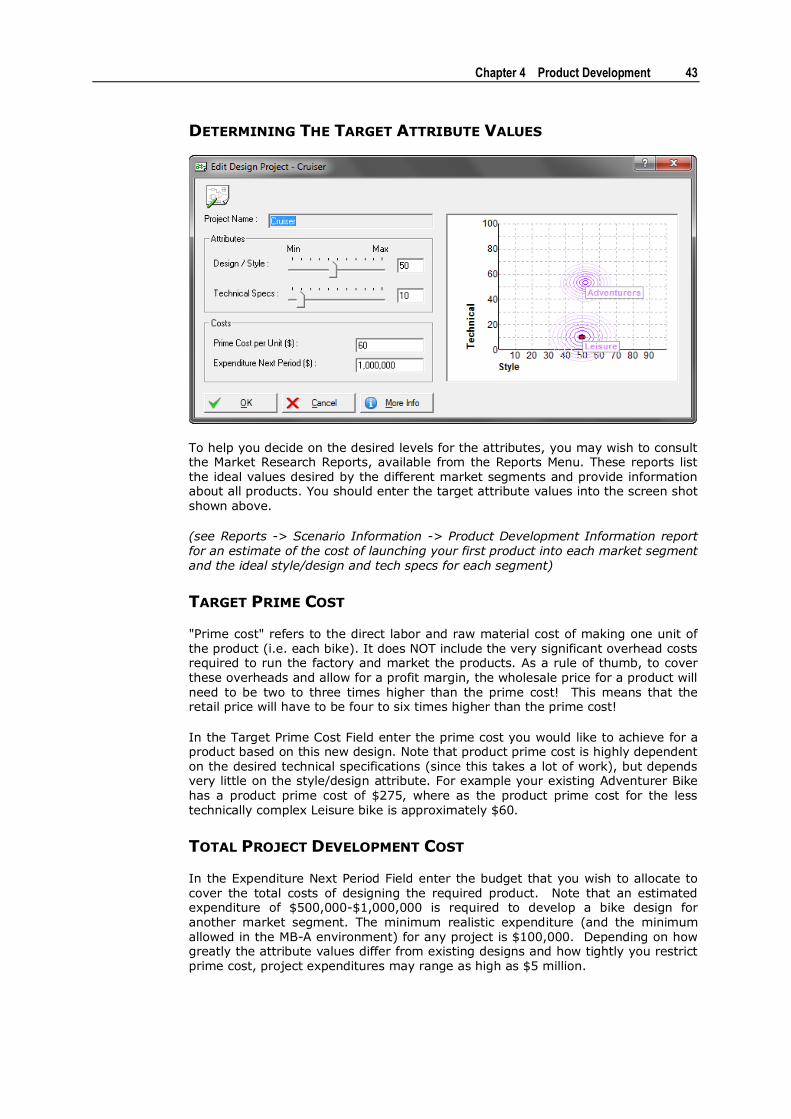
Chapter 4 Product Development 43
DETERMINING THE TARGET ATTRIBUTE VALUES
To help you decide on the desired levels for the attributes, you may wish to consult the Market Research Reports, available from the Reports Menu. These reports list the ideal values desired by the different market segments and provide information about all products. You should enter the target attribute values into the screen shot shown above.
(see Reports -> Scenario Information -> Product Development Information report for an estimate of the cost of launching your first product into each market segment and the ideal style/design and tech specs for each segment)
TARGET PRIME COST
"Prime cost" refers to the direct labor and raw material cost of making one unit of the product (i.e. each bike). It does NOT include the very significant overhead costs required to run the factory and market the products. As a rule of thumb, to cover these overheads and allow for a profit margin, the wholesale price for a product will need to be two to three times higher than the prime cost! This means that the retail price will have to be four to six times higher than the prime cost!
In the Target Prime Cost Field enter the prime cost you would like to achieve for a product based on this new design. Note that product prime cost is highly dependent on the desired technical specifications (since this takes a lot of work), but depends very little on the style/design attribute. For example your existing Adventurer Bike has a product prime cost of $275, where as the product prime cost for the less technically complex Leisure bike is approximately $60.
TOTAL PROJECT DEVELOPMENT COST
In the Expenditure Next Period Field enter the budget that you wish to allocate to cover the total costs of designing the required product. Note that an estimated expenditure of $500,000-$1,000,000 is required to develop a bike design for another market segment. The minimum realistic expenditure (and the minimum allowed in the MB-A environment) for any project is $100,000. Depending on how greatly the attribute values differ from existing designs and how tightly you restrict prime cost, project expenditures may range as high as $5 million.

Chapter 4 Product Development 44
Note that this budget is always spent constructively. For example, if your project has achieved its product specifications then MB-A will put the remaining budget towards further reducing unit prime costs.
It may be financially prudent to spread development costs over a couple of years. For instance in your first year you might spend just enough to create a successful new product with the desired style and tech specs and an average cost. Then in subsequent years you can focus on reducing the prime cost of the product.
ESTIMATED COSTS AND TIME FRAMES
Time to get a new design and development project completed
1 period
Cost per unit of change in Technical Specs $20,000
Cost per unit of change in Style/Design $1,000
Product (prime) cost for each unit of Technical Specs
$4.50-$5.00
Product (prime) cost for each unit of Style/Design 10-15c
Minimum realistic project expenditure $100,000
(see Reports -> Scenario Information -> Product Development Scenario Info)
TECHNICAL SUCCESS OR FAILURE
Projects may not always meet the attributes that you specify. However, the Product Development Team will always provide a design that is adequate for you to use to modify or launch a product. The degree of success of the project will depend on several factors: the similarity of the product to other products, the feasibility of the design in terms of attributes and product prime cost, and the total amount spent on the project. At the end of the project the resulting design may be:
Used to launch a new product
Used to modify an existing product
Used as the starting point for further development (this will require a new project)
Saved for later use
You may run more than one new product development project each year (if you can afford it!)
Note: We recommend that you use the Offline Mode (if available) to test Product Development success rate. Your project should exceed 90% success (as shown in Reports -> Product Development Project Results) before you try to use a project with a new or existing product.
TIME LAGS IN DESIGN AND PRODUCTION
As all design projects take a year to complete, even if the targets are not fully met, you will need to plan for any product launch/modification in advance!
Before a new product can be launched you must complete a Product Development Project in the previous period. Plant capacity will probably have to be altered as well. As there are lead-times in purchasing and installing new capacity, you will have to make the decision to alter capacity in the period before it is required.

Chapter 4 Product Development 45
You will need to go through a similar process if you wish to modify an existing product. However, the advantage in this case is that the modified product will be able to trade on the awareness that the existing product already has in the market.
REPORTS
At the end of the year the Product Development Team will report back on the success of the project, using the Product Development Projects Report on the Reports Menu. You should check this report before you go ahead and use the new product design!
INVESTMENT REQUIRED TO ACHIEVE ATTRIBUTES - EXAMPLE
How difficult it is for the product development team to achieve a design with your target attribute levels is obviously dependent on how different the new product is to be from existing ones. To estimate the investment you will have to make to achieve these new attributes, take your closest existing product and calculate the required change in Style/Design and Technical Specs.
For example, using the data in the table below, if our only existing product has attributes (Style 50, Tech 60) and we want to develop a Leisure bike (Style 50, Tech 10), then the required change for Style/Design is 0 and for Technical Specs is 50.
Assume that the product development department has been able to give precise estimates of the per unit development costs. These are $1,000 for Style/Design and $20,000 for Technical Specs. So, in this case, the total development cost for this specification is calculated to be (0 x $1,000) + (50 x $20,000) = $1,000,000.
Target Segment
Style/Design Technical Specs
Target Prime Cost
Investment
Adventurers 50 60 $250 $0.25m
Commuters 25 10 $50 $1m
Kids 75 10 $60 $1m
Leisure 50 10 $55 $1m
Racers 20 85 $400 $0.5m

46
IN THIS CHAPTER
Shareholder Value ................................................... 46 Raising/Repaying Debt ............................................. 47 Raising/Repurchasing Equity ..................................... 48 Investor Relations ................................................... 49 Corporate Takeovers ............................................... 50
Shareholder Value
The essence of shareholder value added is to create wealth for shareholders. In MB-A you will be evaluated on the cumulative change in shareholder value that your firm generates. Being evaluated on shareholder value is significantly different from being assessed on net profit. To ensure that you are truly creating wealth for your shareholders, you should aim to:
Maximize net profit
Minimize shareholder investment
Minimize risk
Shareholder Value (SHV) is defined here as follows:
SHV = Share Price (SP) + Accumulated Dividend Payments (ADD)
Where:
SP = function {Earnings per share, Debt/Equity ratio}
ADD = the accumulated value of all dividends paid by the firm to date, assuming an average compounding rate of return of alternative investments of 10%
While the firm determines the dividend payment, SP in this simulation is determined by two components:
The first contributor to share price valuation in this simulation is "Earnings per Share (EPS)". This refers to the net profit of a firm after tax, divided by the number of shares currently issued.
The second contributing factor relates to the "Debt to Equity ratio". This refers to the proportion of a firm's total assets that can be 'claimed' by shareholders and debtors. This is included in the share price valuation to account for the fact that the higher the relative debt of a firm the less likely that it will be able to meet its obligations (higher risk).
C H A P T E R 5
Finance

Chapter 5 Finance 47
Raising/Repaying Debt
With the exception (perhaps) of retaining profits, raising debt is often the easiest way for a firm to get additional funds. However, there is an effective limit on how much a firm can raise, due to the burden of high fixed interest charges, which will increase with increasing debt levels.
In MB-A, the firm may choose to raise Long Term Debt. (These sources of finance could be a mixture of debt instruments such as debentures, notes, or mortgages, but we just refer to them all as Long Term Debt). Interest will be charged on these long-term debts based on the level of risk of the firm. This risk is determined by the firm's debt/equity ratio. The higher this ratio the higher the risk, and the more interest the firm will pay. The lowest rate in the MB-A environment is 8%. This rate increases to 20% or more when the debt/equity ratio rises above 2. The financial markets will not allow you to raise debt beyond a debt/equity ratio of 3.
If your firm spends more money than it receives and goes into overdraft then the interest rate applied is 3% higher than the rate you pay on long-term debt. The maximum overdraft facility available is set at 25% of the book value of equity.
Note: Firms which exceed this overdraft limit, are placed under statutory management and must pay additional legal fees. An alternative available to companies owned by a parent firm is to request debt financing from their parent. The interest payable is negotiable (within certain limits!)
The Debt Tab in the Finance Decision Screen shown below contains the tools you need to manage your debt.

Chapter 5 Finance 48
Raising/Repurchasing Equity
As an alternative to raising debt, a firm may choose to issue shares to raise finance. This can dilute ownership and make it more difficult to achieve a high SHV if it fails to achieve the results it anticipates. On the other hand, if the firm has excess cash and no profitable uses for it, it may consider repurchasing some of its shares. This will reduce the number of shares among which the firm's future profits must be distributed.
In MB-A, issues and repurchases of shares occur at current market prices, and incur underwriting and merchant banking fees. There is a 5% issue premium on equity repurchased, and a 5% issue discount on equity raised. This effectively means that the cost of repurchasing or issuing equity is 5% of the value of the repurchase/issue. These costs are automatically added or deducted from the dollar figure you specify in your decision.
In MB-A, firms pay company tax of 30% on profits. Dividend imputation means that there is no effective tax on dividends. Tax credits on losses are carried forward until the next year of profit.

Chapter 5 Finance 49
Investor Relations
More than a mathematical analysis of risks and returns determines the value of a share. It is also affected by how much the investment community knows and understands about the company concerned, and their perceptions of the quality of the firm's management.
Hence to ensure that their shares are fairly valued, firms need to make every effort to ensure that investors and their advisors have recent frequent clear information about the firm's situation and plans. The larger and more complex the firm, the more effort is required.
The Investor PR index essentially acts as a multiplier on your company's share price. So for a very simple example, if your Investor PR index is 1.1, then your Share price will be 10% higher than if your Investor PR index is 1.0 (assuming no other changes). In practice, by spending on Investor PR you will reduce your profit, which will be a drag on your share price, so the effect isn't quite as simple as that.
In general, the larger your company, the more you need to spend to get a higher PR index. The maximum PR index possible is around 1.2, and you have to spend more and more to raise your index the closer you get to that limit.
So your best guide to how much to spend on Investor PR is to look at your current Investor PR index and spend, then decide how much more you are willing to spend on it to try to boost it. Keep in mind that if you spend too much on Investor Relations you may depress your Share Price by reducing your profit and earnings per share. And also decide whether or not there is another better use for the money spent on Investor Relations such as on Product Development.
(see Reports -> Financial Reports -> Financial Results for All Firms to see the Investor PR Index for you and your competitors)
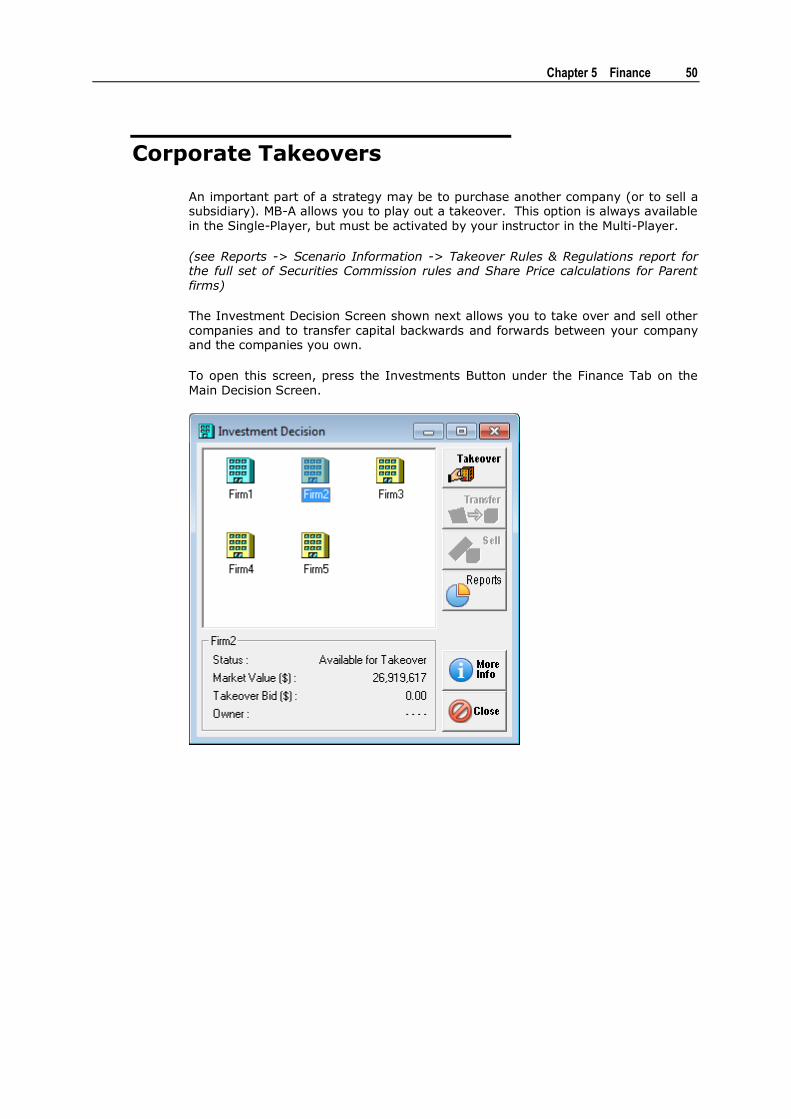
Chapter 5 Finance 50
Corporate Takeovers
An important part of a strategy may be to purchase another company (or to sell a subsidiary). MB-A allows you to play out a takeover. This option is always available in the Single-Player, but must be activated by your instructor in the Multi-Player.
(see Reports -> Scenario Information -> Takeover Rules & Regulations report for the full set of Securities Commission rules and Share Price calculations for Parent firms)
The Investment Decision Screen shown next allows you to take over and sell other companies and to transfer capital backwards and forwards between your company and the companies you own.
To open this screen, press the Investments Button under the Finance Tab on the Main Decision Screen.

Chapter 5 Finance 51
PURCHASING A FIRM
The minimum realistic takeover bid is shown on the Takeover Screen below right. You can access this screen by pressing the Takeover Button on the Investment Decision Screen.
You must pay at least a 40% premium over current market capitalization to achieve a successful takeover. This means that a takeover bid will usually require a significant amount of cash. You will need to evaluate this investment carefully. Remember that there may also be competing bids from other firms, so you may wish to go higher than the realistic minimum. All other things being equal, the highest bidder wins!
Example: if Firm A has 2 million shares outstanding at $50 per share, then its current market capitalization is $100m. The minimum realistic bid for Firm A would then be $140m, although you may wish to bid higher to beat other potential bidders. If you bid $150m for Firm A, and are successful, the $50m premium will appear as a one-off 'Takeover bids premiums and expenses' charge in your Income Statement. So be aware that in addition to requiring a large amount of cash, the takeover premium expense may cause you to record a large one-off loss.
Here we limit shareholdings in other firms to 100 percent takeovers of publicly listed firms. That is, if you take over a firm you must purchase all its shares from the share market at large (at a premium on the previous period's ending share price). You may hold the shares for a period of time (receiving dividends and performing various capital transfers), and sell them back to the share market at large at the current price if you wish.
Note: Antitrust provisions exist in MB-A Multi-Player, this will deny any takeover bid that would cause the total Market Share to exceed 50% (you can view the Market Share report for this information). Partial shareholdings and selling shareholdings directly to other firms are excluded. We also exclude mutual shareholdings and circular ownership. However it is possible to get complicated ownership chains where Firm A owns B who owns Firms C and D, provided that the Anti-Trust limits are not violated.
(see Reports -> Scenario Information -> Takeover Rules & Regulations report for the full set of Securities Commission rules and Share Price calculations for Parent firms)
Chapter 5 Finance 52
In MB-A Single-Player there are no antitrust provisions, so you can buy your competitor if you wish.
CONTROLLING THE OWNED COMPANY'S FINANCES
If you take over a firm, you become responsible for all its finance decisions. To do this effectively you may need to discuss their plans with them and agree on what finance they require. To make this a successful investment you will need to ensure that you are receiving (or will receive in the future) an appropriate return on your investment either in the form of dividends or increasing value of shares.
In the Multi-Player the firm you have taken over still has control of all non-finance decisions, so your acquisition can be seen as a merger, or a hostile takeover depending on how your deal with your new subsidiary.
SELLING YOUR SHAREHOLDING
You may sell your entire shareholding back to the share market at large. This process takes a year, during which you may not play any part in the company's affairs. You will receive the share price at the end of that year, but any loans you have made to the company will be written off as bad debts.
The Equity Transfer Screen is where you decide whether to increase or decrease your equity holding in the owned firm, and set the amount they will pay you as a dividend. You will find this screen by clicking on the Transfer Button on the Investment Decision Screen.
Increase or decrease your equity holding in the owned firm by purchasing shares from a share issue or selling shares back as a share buy-back. Enter the value of the shares you wish to purchase or sell back.
Set the dividend per share the company will pay you.
Takeover Rules & Regulations
Note: the following excerpt comes from the Takeover Rules & Regulations report (see Reports -> Scenario Information -> Takeover Rules & Regulations report).
MINIMUM BIDS & TAKEOVER PREMIUMS AND EXPENSES
The Minimum Bid for a Firm is the current Market Value plus 40%. So if a company is worth $100m, then the Minimum Bid will be $140m. Bids lower than this will not be accepted by the market.
Every dollar you bid above the current Market Value will be booked as a one-off Expense Item in your Income Statement under Takeover Premiums and Expenses.
So if you bid say $150m for a Firm valued at $100m, then you will take a one-off charge of $50m. This may result in short term depression of your share price.
SHARE PRICE OF PARENT FIRM
1. Subsidiaries are treated as non-operating assets for the purposes of valuing a Parent Firm. We value the underlying Share Price of each Firm in a group in isolation, then combine the individual valuations to get the Share Price of the Parent Firm.
Chapter 5 Finance 53
2. The Underlying Share Price is based on the operational and financial performance of a given company and excludes any dividends received from Subsidiaries.
3. Subsidiary Contribution to Parent Share Price = Subsidiary Market Capitalization / Parent Number of Shares Issued
Example
Firm A owns Firm B
Firm A has 100 shares with an underlying Share Price of $50
Firm B has 50 shares with an underlying Share Price of $40
Firm B's contribution to Firm A's Share Price is:
50 Firm B Shares * $40 per share / 100 Firm A Shares = $20
Firm A's Share Price = Underlying Share Price + Subsidiary Contribution = $50 + $20 = $70
SECURITIES COMMISSION RULES
These rules help you understand the reasons why bids are accepted or rejected
1. Firms may only have a single owner at any time
2. Circular ownership is not allowed (A -> B -> C -> A)
3. Long Ownership Chains
A Firm may have at most a Parent and a Grandparent Firm.
or
A Group of Firms may only be 3 Firms deep.
eg. you can have A -> B -> C, but NOT A -> B -> C -> D
It is possible to have both A -> B AND A -> C -> D as the longest chain is still only 3
even though there are 4 Firms in the Group (A, B, C, D).
4. Anti-trust Limits (Multi-Player Only)
No group of firms may control more than 50% of the Wholesale sales for the Industry at the time of the Takeover.
However a group of firms may subsequently control more than 50% of the market as there is no on-going monitoring after purchase.
Note: The Market Share Chart report shows Retail market share, not Wholesale.
Chapter 5 Finance 54
5. Competing Bids
Bids with the highest Bid Ratio are always accepted and settled first.
As each bid is settled, some or all of the remaining bids may no longer be viable.
Bid Ratio = Takeover Bid / Minimum Bid
Example:
Bid X = $25 million, Minimum Bid for Firm is $10 million, so Bid Ratio = 2.5
Bid Y = $50 million, Minimum Bid for Firm is $25 million, so Bid Ratio = 2.0
In this case, Bid X would be accepted and settled first.
Bid Y would then be settled ONLY if it still complies with the above Securities Commission Rules now that Bid X has been completed.
SUBSIDIARY FINANCES - LOANS TO SUBSIDIARIES
Your subsidiaries may need additional cash for a variety of reasons.
The Debt Equity Ratio determines how much Banks are willing to lend to your subsidiaries.
But sometimes you will need to exceed the standard Debt Equity limit in order to prop up a struggling firm or to allow a subsidiary to complete a Takeover of another Firm to increase the size of your group.
So you can exceed the Debt Equity Ratio limit when you lend to your Subsidiaries.
Just be aware that their Share Price will suffer if you load them up with debt, so you should have a long term strategy where the subsidiary can eventually pay the debt back.
If you are unable or unwilling to continue to lend to a struggling subsidiary then you should cut your losses and sell your shareholding.
SELLING YOUR SHAREHOLDING - WRITING OFF LOANS TO
SUBSIDIARIES
1. You can sell your shareholding in a company at any time.
2. The sale price is based on the Share Price of the subsidiary at the end of the period in which you choose to sell.
3. Financial Decisions you make for your subsidiary during the sale period will be ignored.
4. Any loans outstanding when you sell your subsidiary will be written off as a Bad Debt. (Debt to Bank is unaffected)
5. If you are unable or unwilling to continue to lend to a struggling subsidiary then you should cut your losses and sell your shareholding.

55
IN THIS CHAPTER
Drafting a Strategy ................................................. 55
Drafting a Strategy
To be successful in MB-A, it is important to draw up and pursue a coherent strategy. Each of the functional strategies that contribute to this strategy should be internally consistent, consistent with one another and consistent with the overall strategy. The table below illustrates a possible 5-year strategy for MB-A. It is not a model answer! There are many ways of doing well in MB-A.
Topic Issues to cover Example Actions
(Not intended as a model answer!)
Measure
Vision and Overall Strategy
1-2 sentences that capture where you want to take this company
Become a market leader in producing quality bicycles that are moderately priced while taking advantage of a relatively untapped Leisure market segment.
Market share = 60%+
Share price $50 by third roll over
Marketing Strategy
Which segments did you target? What media did you use?
How much did you spend?
Which channels did you target?
How much margin did you give?
Focus on improving market share through increased brand awareness and more effective advertising & magazines;
Improve relationships with bike shop distributors;
Move towards positioning the core product as a reasonably high priced product while not pushing it out of the price range of our target market.
Market share 50%
Selling price $2,600
C H A P T E R 6
Drafting A Strategy

Chapter 6 Drafting A Strategy 56
Operations Strategy
What capacity did you reach?
What delivery performance did you achieve?
What quality did you achieve?
What was your maintenance plan?
What was your training plan?
Steadily increase capacity to produce more units of the core product (Adv) and to prepare to launch a product in the Leisure segment. This can be achieved through purchasing plant and increasing staff numbers;
Increase batch size to reduce set-up costs and increase efficiency;
Focus on quality to reduce re-work through improving supplier relations and commitment to TQM;
Focus on eliminating idle time to increase productivity;
Eliminate maintenance costs and downtime through commitment to preventative maintenance.
Capacity 40,000 SCU
Warranty rate 0.5%
Reduce idle time to 5%
Reduce breakdown time to 5%
Finance Strategy
How much equity did you raise?
How much debt?
What was your dividend strategy?
Repay long-term debt;
Pay out a dividend to shareholders.
Debt/Equity ratio below 0.2
20c dividend per dollar payout in year 4
Product Development Strategy
What products did you develop?
Attributes
Prime cost Development cost
Introduce a new product to take advantage of the untapped Leisure market segment. This would be a low cost, low specification bike.
Cost $100
Budget Revenues
Costs
Profits
See Income Statement under Reports in MB-A.
Profit of $20m by 2012

Chapter 6 Drafting A Strategy 57
Result Shareholder Value
Share price
Market share
Net assets
Shareholder value has increased from $8.85 at start to $50.07 after third roll over;
This increase was greater than budgeted and can be attributed to the strategy outlined above.
Target shareholder value added $40

58
IN THIS CHAPTER
Further Help........................................................... 58
Further Help
The section below will give you some useful tips on how to do well in MB-A. At this point some of these tips may be more detailed than you need, but we include them here for your reference.
Hints And Tips
PURCHASING NEW PLANT
It takes one period to build or acquire new plant. By comparison, new workers can be hired immediately. Remembering this will prevent staffing errors and minimize idle time. It is also important to realize that future capacity requirements must be anticipated a period in advance.
OPERATIONS DECISIONS
Remember to make sure your operational strategy supports your overall strategy. Do you want to produce a few high quality bikes for the racer segment? If so, you're going to have to invest heavily in training, inspection, and other internal systems. Or do you want to produce a large volume of low cost bikes? In this case, you may find flexibility of delivery is more important to your market than quality. Use the data available to you in the reports and via the More Info Button.
PRICING
If your firm is making large losses, check your retail prices. If your price is too low, you may be selling a lot of bikes, but you simply won't be covering your costs. You can check this by looking at COGM & Gross Margin under Financial Reports. If your price is too high relative to your competitors and/or the segment's desires then you will not be selling many bikes. In this case your fixed costs may be causing you problems.
PRIME COST
Prime cost does not include distribution, marketing, or administration costs. As a rule of thumb these will often add up to at least $100 per SCU. To avoid losing money, make sure you think about prime cost and these variable costs when you are calculating a price for your product. Also bear in mind the retailer's margin. One firm discovered the importance of prime cost after they launched a bike design with a prime cost of $110,000 and lost $12 million on sales of just 30 Bikes!
C H A P T E R 7
Appendix A - Additional Help

Chapter 7 Appendix A - Additional Help 59
You can modify a design to reduce its prime cost. Just research the style and tech specs of a design you already have, enter a reduced prime cost and spend $0.5 million to 1.0 million on the project. There is a limit to how far you can reduce the prime cost. As a rough guide you can get it down to about 55-60% of its design prime cost of $5 per tech spec and $0.15 per style spec. For example you can get the prime cost of a $300 Adventurer bike down to about $170-180.
MARKETING DECISIONS
You should be thinking strategically about the game. The more you think and plan, the more you will get out of it (in terms of both success and learning). Make sure that you ask the following questions when you formulate your marketing strategy:
Do we have a clear idea of what markets we are targeting and why?
What is our point of differentiation/competitive advantage? Cost? Quality? Flexibility?
What is most important to the markets we want to move into?
OPERATIONS
The biggest problem here tends to be failing to match capacity to consumer demand. If capacity is too low, you miss out on sales. If it is too high you have idle capacity and your unit overheads rise. Remember that inspecting products costs real money. Keep track of the costs of inspection versus the quality benefit gained.
DISTRIBUTION
Boosting your distribution by increasing your retailer margin slightly may be a good idea, unless you go too far. Check the Market Summary (All Product Details) report to see how your distribution index compares to your competitors. This means that if your proportion of distributors is falling and you are still giving them the same support you have always given them, then this could be because your competitor is spending more money on distribution than you.
RESEARCH & DEVELOPMENT
Failed R&D projects can be a costly mistake. Make sure that you put sufficient but not excessive funding into this area. Click on the More Info Button in the Research and Development Screen to get all the data you need. Good summary information is available in this manual, or by clicking on Data in the More Info Screen and then Product Summary Data.
PLANT MAINTENANCE COST
Maintenance Cost effectiveness is based on the number of dollars you spend per SCU of plant. If you have significantly increased your plant size, make sure that you have increased your maintenance spending proportionately. If you have not done this, the rate of machinery breakdowns is going to rise. The other advantage of a well-maintained plant is that you will get a higher price if you ever need to sell any excess capacity.
Chapter 7 Appendix A - Additional Help 60
SENSITIVITY TO PRICE
A few firms have been caught out using the Market Segment Summary. For the Adventurer segment sensitivity to price is medium. This means that you may be able to increase price slightly without impacting too much on your market share. However, you can only take advantage of this situation for so long. If you sell above the suggested price range of $1,500-$2,500 for Adventurers or if you get more than about $500 above the average price for your market as a whole, then you will struggle to sell many bikes.
MEDIA VIEWING HABITS
A few firms have neglected the Media Viewing Habits Table and their businesses have suffered as a result. The Media Viewing Habits Table gives you an indication of how you should split your advertising between TV, Internet, and Magazines. You should also look at the Advertising Reach Curves (see Marketing Chapter).
Frequently Asked Questions
WHAT IS THE DIFFERENCE BETWEEN FACTORY CAPACITY AND THE
NUMBER OF BIKES I CAN PRODUCE?
Factory capacity has two components - the amount of plant, and the capacity of the workers. This latter component depends in turn on the number of workers and their level of training. Factory capacity is measured in SCU. The number of bikes that can be produced will depend on available capacity and the complexity of the bikes produced. Your initial Adventurer Bike has 1 SCU of complexity. (Note that the SCU required to produce one bike is determined by its prime cost divided by $300.) This means that if you have 10,000 SCU of available capacity you can make 10,000 of your original Adventurer bikes. Remember that some of your total capacity will be taken up with rework, setups, breakdowns, training, and raw material stock outs. Have a look at your Manufacturing Capacity Usage Chart and your Operations Reports like the Manufacturing Responsiveness Report to figure out how much available capacity you have.
WHY DIDN'T WE SELL ANY OF THIS PRODUCT?
Usually this is because the product attributes (style, technical specifications) are out of range for the target segment. Have a look at the Perceptual Map Report. The concentric circles represent the 'radius of influence' of each market segment. The center of each circle matches the consumer's wishes perfectly. The further from the center your product lies, the less 'ideal' it is to that segment. As a result, you will sell fewer units. If your product falls outside the radius of influence for a segment then consumers will not buy any of that product at all.
WHY DID MY PRODUCT DEVELOPMENT PROJECT FAIL?
Failed product development projects can be a costly mistake. In real life would you commit to a product development project without checking that it was sufficiently well funded to succeed and that it would be able to provide an acceptable return on that investment? No? Well, if you want to win, you shouldn't do this here either. Good summary information is available in this manual. Alternatively, you can click on the More Info Button on the Product Development Screen, and then on Data and Product Summary Data to get all the data you need

Chapter 7 Appendix A - Additional Help 61
Also, be careful that the specifications you request for your new product actually fall close to the ideal point of the segment you are targeting. Look under Reports for Perceptual Map of Market Segments to check this. Products outside the radius of influence (ie, outside the circles) will not sell at all.
Be careful to check the results of product development projects (from the Reports Menu). If you have not spent enough money, or if you ran out of cash and the model scaled back your spending, then your project may not have reached the design goals you set.
WHY DO I HAVE THE MOST SALES, BUT THE LEAST PROFIT?
Check that you are not giving away all the retail sales revenue to the distributors in retailer margin. Be very careful about raising the distribution margin above 55%. Remember that you have to make enough unit margin on each bike to cover the prime cost of your product as well as distribution, marketing, and administration costs, otherwise you may be losing money.
(see Reports -> Products, Sales, Margin, Product report)
MY PRODUCTION EFFICIENCY IS LOW.
Check your:
Raw material stock outs - increase raw material stocks or improve your relationships with your suppliers;
Set-up time - increase batch sizes or spend more on reducing set-up times;
Rework time - improve skill levels, machine maintenance, and supplier relations;
Breakdowns - increase preventative maintenance on machines;
Idle time - increase product demand and production levels or reduce factory capacity.
MY SHARE PRICE IS LOW (AND MY SHAREHOLDERS ARE
UNHAPPY!)
Check your:
Profitability and Earnings per share;
Financial risk as measured by debt/equity ratio.
I'M RUNNING OUT OF CASH.
You can either increase long-term debt or issue more shares to raise capital. A hint here is that the Cash Flow Budget (see the Reports Menu) is real-time and reflects all of your decisions as you make them during each rollover period.
If you have totally run out of cash, you may need to ask your instructor for an emergency cash injection.
HOW DO I ROLLOVER OR SUBMIT MY MULTI-PLAYER DECISIONS?
When you are entering in decisions in the Multi-Player you are entering them in live on our servers. You can change your decisions right up until the deadline your instructor has given you. There is no need to upload decisions at the deadline. Once you are happy with your decisions, and have double-checked them, simply wait until just after your deadline to log back into your game and view your results.

Chapter 7 Appendix A - Additional Help 62
CAN OUR TEAM MEET VIRTUALLY OR DO WE HAVE TO USE THE
SAME COMPUTER?
With the Multi-Player teams do not need to be in the same physical room to view and make decisions together. With the Multi-Player each team member is able to log into the game from different locations and view the same information. By using instant messaging or the message board feature in MB-A, teams are able to work together in this virtual world.
Having said that, it is very important that you have good communication within your team for who is responsible for entering the final decisions. We often get student complaints like "someone changed my decisions!" where the problem is simply a lack of communication with their teammates.
DOES EVERY MEMBER OF MY MULTI-PLAYER TEAM NEED TO
REGISTER?
Yes. Each team member must register for MB-A individually. This is the most equitable way to ensure that regardless of team size, all students pay the same price.
I HAVE READ THROUGH THE MANUAL AND I STILL CAN'T FIND THE
ANSWER TO MY QUESTION?
SmartSims offers online assistance for technical issues. Please visit our website www.smartsims.com or use the link in the Help menu of the game. We reply to all enquiries within 24 hours.

Chapter 7 Appendix A - Additional Help 63

65
A
An Overview of the Industry • 10 Analyzing The Market • 13
Appendix A - Additional Help • 58
C
Corporate Takeovers • 50
Current Financial Position • 11
Current Operational Position • 27
D
Developing a New Product • 42
Developing the Marketing Mix • 17 Drafting a Strategy • 55
Drafting A Strategy • 55
F
Finance • 46
Further Help • 58
G
Getting Started with Mikes Bikes • 1
I
Introduction and Overview • 1
Investor Relations • 49
M
Marketing • 13
O
Ongoing Strategic Control • 39
Operations • 27
Operations Decisions • 28
P
Product Development • 41
Q
Quality • 36
R
Raising/Repaying Debt • 47
Raising/Repurchasing Equity • 48
Responsiveness • 28
S
Scenario Information / Reports • 16
Shareholder Value • 46
T
The MB-A Model • 8
The Product Development Decision •
41
U
Using the MB-A Single-Player • 4
W
What is MikesBikes Advanced? • 1
Index