Mike Fortna - vic.wicen.org.au radio RF transmitter ... The conclusion from ... radios’ analog FM...
30
Mike Fortna Senior Product Marketing Engineer Cobham AvComm Rob Barden Director of Product Marketing Cobham AvComm Contributions by: Ken Weipert Senior Systems Technologists Motorola Solutions, Inc. Neil Horden Chief Consultant Federal Engineering, Inc.
Transcript of Mike Fortna - vic.wicen.org.au radio RF transmitter ... The conclusion from ... radios’ analog FM...

Mike FortnaSenior Product Marketing EngineerCobham AvComm
Rob BardenDirector of Product MarketingCobham AvComm
Contributions by:
Ken WeipertSenior Systems TechnologistsMotorola Solutions, Inc.
Neil HordenChief ConsultantFederal Engineering, Inc.

Summary
Digital radio systems operate differently than legacy analog systems. Although digital modulation alignments are similar to alignments used in analog radio systems, digital radios require more precise alignment to achieve optimum performance and must be verified for digital modulation performance. Proper alignment can improve systems performance to maximize and deliver the high performance that it was designed to provide. Improper alignments can cause degraded digital modulation accuracy, which has a significant impact on the receiver’s ability to recover digital data. In some instances, this can affect the range to the same extent as a 75% reduction in power.
This white paper uses statistical data provided through extensive lab testing and through the use of actual recorded digital radio RF transmitter parameters. It shows how modulation alignments of one radio’s transmitter parameters can positively or negatively affect performance of another radio’s receiver. The performance of various radio receivers were measured using popular radios with transmitters that have been aligned using OEM approved techniques. The tests utilized FM deviation meters for aligning modulation balance and modulation-limiting parameters, while accommodating for variations in meter specification and audio filter settings.
The conclusion from these tests indicate that with a proper understanding of digital radio operations, performance can be significantly improved. The proper setting of audio filter parameters and the use of accurate deviation meters can also improve digital radio performance. Conversely, the use of inaccurate FM deviation meters compounded by improper audio filter settings and lack of knowledge of meter specifications and operation, can dramatically and negatively impact digital radio performance.
Introduction
With the rapid expansion of digital radio technologies like DMR, dPMR™, P25, and NXDN™ in both the public safety and commercial land mobile radio markets, many radio operators, engineers and technicians are facing system performance issues that are difficult to analyze. These digital systems operate very differently in comparison to analog FM systems. Understanding how these digital systems work will enable RF professionals to improve their digital radio system operation through the use of better alignment techniques and proper digital verification methods.
Most RF professionals are aware of coverage studies that are related to transmit power variations. Figure 1 shows typical coverage maps of 100 Watts (50 dBm), 50 Watts (47 dBm) and 25 Watts (44 dBm).
Figure 1: Coverage Study with Various Site Transmitter Power Settings
100 Watts (50 dBm) 50 Watts (-3 dBm) 25 Watts (-6 dBm)

Given equivalent performance factors except for power level, we can see that the coverage area becomes smaller as the transmitter power level is decreased. This is expected and would hold true for both analog and digital systems.
With digital systems, there are additional factors that can cause issues with coverage. Coverage is not only affected by the RF power level, but also the quality of the transmitted digital signal. Just because a radio is digital, it does not mean the signal is necessarily good. There are performance metrics of a digital RF transmitter that must be measured to quantify the quality of the digital signal. While digital radios transmit modulation using digital methods, in most radios, the quality of this signal is directly related to proper FM deviation alignment. In addition to sufficient RF level, the receiver must see a good quality digital signal to decode the data properly.
FM deviation alignment is critical to the performance of a radio in the digital mode. This requires precise and accurate measurement to ensure that the radio meets its published specifications. Alignments, when done correctly, will enhance your digital radio system range and performance. Poor FM deviation alignments can create coverage reductions of 3 to 6 dB. This is equivalent to the coverage loss seen in the Transmit Power reductions shown in Figure 1.
How Does Digital Radio Technology Work?
Many of today’s land mobile radio technologies rely on digital modulation based on 4 level Frequency Shift Keying (FSK) to represent the digital ones and zeros used to transmit information over the air. Digital radios use a voice coder/decoder (vocoder) to convert analog voice to digital data. These systems can carry both vocoded audio and data (like short messaging services) using the same modulation method or air interface. The data rates are slow compared to digital systems used in cellular networks like LTE and 4G. This is because almost all land mobile radio frequencies use very narrow bandwidth channels of 6.25 kHz, 12.5 kHz, or 25 kHz in order to maximize the number of users within a given band.
Some technologies utilize Time Division Multiple Access (TDMA) techniques to divide these channels further into slots that have multiple users per RF channel. DMR for example, accommodates two users in a 12.5 kHz RF bandwidth channel. Figure 2 shows a typical block diagram of a digital radio. Here you can see the use of the vocoder, the channel coder, and a modulator that converts the digital data to 4FSK modulation over the air.
A to D Speech Coder
Channel Coder
Modulator Tx Amplifier
D to A Speech Decoder
Channel Decoder
Demod-ulator
Rx Amplifier
Filters & Equalizer
Baseband filters
Duplexer
V.C.O.
64 kB 4.4 kB
Figure 2: A Typical Digital Radio Block Diagram

4FSK modulation means that there are four allowed frequency deviation states of the RF carrier (also called symbols) that represent the digital data. If there are four specific deviation states, then each of these states (or symbols) are called “Dibits” and represent two bits of data, 00, 01, 10, or 11. It is important to understand that these symbols (deviation states) must be precisely synchronized with the symbol clock within the radio. The amount of deviation at the symbol clock time dictates whether that symbol is 00, 01, 10, or 11.
How close the symbols are in relation to their specified deviation state at the symbol clock time affects the quality of the transmitted signal. This is critical to the performance of the system for both range and voice quality. A digital measurement, called Symbol Deviation, tells us how closely a transmitter’s signal is meeting the specification for correct deviation at the symbol clock time.1
Figure 3 shows a P25 C4FM digital signal with deviation levels after demodulation (through an FM discriminator) on an oscilloscope. These deviation points can be plotted at the symbol time using a distribution display that shows the four frequency states and the corresponding “Dibits.”
Figure 3: P25 C4FM Modulation Showing the “Dibits” and the Corresponding Frequency Deviation of Each Symbol
What Goes Wrong with Digital Transmitters and Receivers?
With analog FM technology, our human ear can discern a voice, even in the presence of a high level of noise, at ranges that can sometimes exceed those of digital systems. Digital radios typically exhibit very good voice quality up to the point that the receiver can no longer handle the number of bit errors. Then the call is abruptly dropped. We’ve all experienced cell phone calls where simply moving a few feet can cause the voice quality to quickly degrade or the call to be lost entirely. This is due to excessive bit errors, or errors caused when the signal has so much impairment, that the receiver can no longer determine if the symbol is 00 or 01.
The differences from how analog FM works, as noted above, is why digital systems must be maintained and aligned correctly to ensure the best possible voice quality and coverage range if they are to match the performance of analog FM systems. Digital radio receiver performance is tested using Bit Error Rate, or BER, measurements to determine the receiver sensitivity instead of SINAD as used with analog FM. Besides digital receiver BER performance, the quality of the digital transmission also affects the system range and voice quality. The transmitter must modulate the carrier with 4FSK to the precise symbol deviation at the symbol clock time to correctly impart the digital data onto the carrier. How close these symbols are to the ideal frequency deviation points at the symbol clock time greatly affects the performance of the system.

If the transmitter Symbol Deviation is not precisely where it should be, then the receiver will have a difficult time determining what the symbol value is intended to be. When the receiver cannot accurately determine the value of the symbol, then it will produce an output with a high BER. This will cause problems with voice quality, data integrity and overall range of the radio system.
As you can imagine, transmitting a poorly modulated 4FSK signal may work during a short range “radio check”, since the transmitted signal has sufficient signal strength where the receiver can decode even a poorly modulated signal. However, over any significant distance, the RF air interface between radio transmitters and receivers will cause additional impairment of any RF signal. Effects such as noise, interference, multipath and inter-symbol interference (ISI) will degrade the quality of the received signal. That is why a “Test 1-2-3” voice check at short range does not accurately replicate real world RF scenarios where the quality of the signal is significantly degraded. Figure 4 shows a “good” DMR modulated signal versus a poorly modulated signal. The good signal shows a transmitted DMR signal at full power where the symbol deviation points are clearly aligned to the clock producing a clean transmitted DMR signal. The other displays a signal that has been degraded through improper alignment, yet is still at full power. You can easily see why the receiver will have difficulty decoding the poor signal once the quality is further impaired over its propagated distance.
Figure 4: A Good DMR Modulated Signal Versus a Poorly Modulated Signal
The Effect of Analog Alignment on Digital Radios
Symbol Deviation and Modulation Fidelity or FSK Error performance are greatly affected by P25, DMR, dPMR, and NXDN radios’ analog FM deviation settings that are created during the alignment of the radio. Accurate FM deviation alignments are required to produce a good digital signal when the radio is transmitting in digital mode. In order to validate that the analog FM deviation alignments were made correctly, the radio needs to be tested for Symbol Deviation and Modulation Fidelity, or FSK Error, in a digital mode. Having the proper test equipment is vital in meeting these requirements.
The accuracy of these alignments is significantly affected by the accuracy of the deviation meter used for FM modulation measurements. Both the absolute and the relative accuracy of the meter over the modulating frequency range are important factors for correct FM deviation measurements. In addition, once an alignment has been completed on a radio, you must have the ability to measure the digital modulation performance (Symbol Deviation and Modulation Fidelity, or FSK Error). This will VERIFY that the analog alignment actually produces a good digital transmitter signal. It is only through testing the radio transmitter’s Symbol Deviation and Modulation Fidelity, or FSK Error, that will verify if it will work properly on the radio network. Figure 5 shows the relationship between an analog FM receiver’s sensitivity (measured as SINAD) and a digital radio receiver’s sensitivity (measured as BER) for both a signal with good Modulation Fidelity and Symbol Deviation versus one with poor Modulation Fidelity and Symbol Deviation.

Figure 5: Analog FM Receiver Sensitivity Compared to Digital Receiver Sensitivity
All RF signals, both analog and digital, lose amplitude and are more susceptible to noise as the radio wave propagates over a given distance. However, the effect between analog and digital is substantially different. With analog FM signals, the noise is directly demodulated and present at the speaker. However, with digital 4FSK signals, the noise degrades the quality of the symbols making recovery of the data more difficult. This is the same issue caused by improper FM deviation alignment.
The digital radio receiver will try to decode the bits until the receiver’s forward error correction can no longer correct for the symbol errors, resulting in a rapid roll off of voice quality and range. To visually see how noise impacts a digital signal, Figure 6 shows a view of a demodulated P25 C4FM digital signal with low noise and with high noise.
Figure 6: A Good P25 C4FM Signal at Two Different Signal Strengths
Demodulated P25 C4FM Signal with Low Noise
Demodulated P25 C4FM Signal with High Noise

As you can clearly see, a weak signal becomes more difficult for the receiver to decode due to the noise that is present and this is further complicated when the transmit signal has other impairments, such as those from improper deviation adjustment.
Understanding FM Deviation Meter Operation
FM deviation measurements play an important part in the radio’s digital performance. For this reason, we need to understand how a FM deviation meter operates. This will help us to understand the issues surrounding its use in digital radio deviation adjustments. The meter is a peak responding AC voltmeter that is measuring the audio of the demodulated output from the test receiver. There are two different types of FM deviation measurements that are common in the alignment of digital radios: absolute and relative. Radio deviation alignment is very important as the radio creates its digital signal based on how these deviation settings are made. Improper deviation alignment will result in poor digital signal quality.
Absolute Measurements:
Absolute measurements are measurements that must reference an absolute value. These are typical when specifying a radio performance in hard numbers. RF power, RF frequency error, audio frequency error and deviation are examples of absolute levels or readings referenced to an absolute standard that are taken when measuring a radio. When measuring the absolute deviation level of a transmitter, it is important to consider all of the factors that might impact that measurement. FM deviation meters are peak reading. Therefore, other frequency components, besides the primary frequency being tested, will combine and add to the deviation level displayed on the meter. Noise is the largest additive contributor to deviation measurements. Most test receivers or modulation meters that use a super-heterodyne receiver will have controls for setting the audio frequency (AF) and intermediate frequency (IF) filters to limit the amount of noise that is allowed to pass through the receiver and effect the measurement.
To understand this, we need examine how the filter settings effect the measurements taken. One typical measurement for P25 radios is the setting of the deviation level of a 1.2 kHz signal (1200 Hz audio tone) to 2.83 kHz. This is a common adjustment made on many digital radios. The accuracy of this alignment will directly affect the Symbol Deviation of the transmitter when it transmits a digital signal.
Setting Audio Filters for FM Deviation Measurements
In order to demodulate the audio without causing inaccuracies, the audio filter should be set to a value higher than twice the frequency of the modulating tone. A wider filter will allow more noise to pass through, and that will become part of the measured signal. Therefore, the filter setting should be no wider than necessary to reduce errors caused by letting too much noise pass. It is also important that the test equipment have a clean local oscillator source so that the test equipment itself does not impart too much phase noise or residual FM to the measurement.
In this case, the modulating tone frequency is 1.2 kHz. As an example, we will use an FM deviation meter found in a popular radio test system. On this test system, we would select a 3 kHz Low Pass audio filter. This is typically the first one that is available that is higher than 2.4 kHz (2 times the 1.2 kHz rate that we are going to measure) while still being narrow enough to eliminate excessive noise (as compared to a 15 kHz Low Pass filter, for example).
Setting Intermediate Frequency Filters for FM Deviation Measurements
The correct IF Filter setting can be determined by multiple methods. These methods are used to ensure that the selected IF Filter is wide enough to pass all of the demodulated energy without distortion. For the purpose of this paper, we will utilize Carson’s rule and the spectrum analyzer method as two different methods to determine the proper IF filter settings.

Modified Carson’s Rule Method
For digital systems, the basic rule is to use three times the sum of the Rate and Deviation. This is a variation of Carson’s Bandwidth Rule that states that two times the sum of the Rate and Deviation will pass 98% of the audio energy for an analog system. For digital systems, we need to obtain greater than 98% of the energy to obtain the most accurate reading so three times is used. Using this formula, we would take 3*(1.2 kHz + 2.83 kHz) = 12.09 kHz. This is the minimum IF BW setting for the test equipment or the measuring receiver. For our radio test system example, we will choose the 12.5 kHz IF Filter, with the goal of keeping it as narrow as possible, again to limit the amount of noise that is passed through to the deviation meter.
Spectrum Analyzer Method
Another method to determine the required IF filter setting is to use a spectrum analyzer with markers to measure the bandwidth of the signal. The goal is to capture all sideband energy that is equal to or greater than 20 dB below the first side lobe to determine the required bandwidth. This means that we need to incorporate at least three or four side lobes. Using the spectrum analyzer method as shown in Figure 7, we can see that by using the markers and including the 4th lobes above and below the center frequency, the bandwidth required comes to 10.948 kHz. Again, using this method, we would then choose the closest receiver IF setting that is greater than what is measured. This would confirm our selection of 12.5 kHz as determined by using the modified Carson’s Rule.
Figure 7: Spectrum Analyzer Measurement of Required IF BW for 1.2 kHz Rate at 2.83 kHz Deviation

While the 12.5 kHz IF filter would work well for a rate of 1.2 kHz and a deviation level of 2.83 kHz, it cannot be assumed to work for all radios. For example, one particular DMR radio requires deviation measurements to be made at a 6 kHz rate with 3 kHz deviation. Applying the modified Carson’s rule, we would calculate 3*(6 kHz + 3 kHz) = 27 kHz.
However, using the spectrum analyzer method, that would only include enough bandwidth to include two side lobes. Using the spectrum analyzer method shown in Figure 8, we would include three side lobes, so the bandwidth required comes out to 37.925 kHz.
Figure 8: Spectrum Analyzer Measurement of Required IF BW for 6 kHz Rate at 3 kHz Deviation
The nearest IF Filter setting available on our example radio test system that can accommodate the 37.925 kHz calculated bandwidth is a 100 kHz IF filter selection. Since this audio rate is 6 kHz, our audio filter should now be set to a 15 kHz Low pass filter, as this is the next available audio filter that provides adequate range to cover two times the 6 kHz signal.
Relative Measurements:
Another type of measurement that is made using FM deviation meters is a relative measurement where the deviation of one rate (or tone) is compared to the deviation of another rate. Most digital radios require this type of alignment where a low audio frequency tone (for example 80 Hz) is transmitted and measured followed by a higher audio

frequency tone (for example 3 kHz or 6 kHz). The high tone deviation is then adjusted to be the same level as the low tone. The goal is to ensure maximum flatness across the audio range that the radio uses to modulate the digital signal.The IF and AF filter settings for this type of measurement should be configured for the highest rate to be measured. This setting should be the same for the low rate tone when making relative measurements to reduce any error that may occur due to differences in filter response and settings. This particular measurement will be impacted by the flatness of the measuring device. If the instrument does not have a flat response between the two test tones, the radio will be misaligned by the amount of “slope” that the measuring device has. As an example, a 0.4 dB slope on the measuring device from 80 Hz to 6 kHz will cause approximately 5% error in the adjustment.
From this we can see how complex FM deviation measurements for digital radios are compared to legacy analog FM measurements. Conversations with RF technicians indicate that filter settings are rarely understood. They are typically not calculated or set properly in the field for testing or alignment. This can and will adversely effect digital radio performance.
Understanding FM Deviation Meters Specifications
We are now getting to the core issue of using an FM Deviation Meter designed for analog radios to align a digital radio. Many analog FM deviation meters seem to have an “acceptable” accuracy until you look deeper into the specification for the meter.
As we further investigate the alignment of digital radios, we need to keep in mind that deviation meters typically have a specification of plus (+) or minus (-) for measurement accuracy. Deviation meters that measure LOW result in a radio that has a Positive Calibration Error where the actual deviation is higher (or greater) than the deviation meter indicates. Conversely, deviation meters that measure HIGH result in a radio that has a Negative Calibration Error where the actual deviation is lower (or less) than the deviation meter indicates. That is because the meter is representing a lower level deviation as being higher than the actual deviation of the signal.
Meters that measure high are often the case with analog FM deviation meters, since residual FM, IF and AF filter settings are rarely taken into account. The additional noise that is allowed to pass by wider bandwidth filters result in a reading that is higher than what the signal deviation truly is. Later we will show that deviation meters reading high are more problematic for digital mode performance.
In the following examples, we will use a different set of audio rates and deviations. A 6 kHz tone deviated at 3 kHz is typical for today’s popular DMR radios.
Analog FM Deviation Meters
Older FM deviation meters typically use an analog meter movement. These meters have a needle that moves a certain amount on the meter face to indicate the measured level of FM deviation. A typical specification from this style of a FM deviation meter is as follows:
FM Deviation Meter (analog meter movement type)2:
Meter Range: 2 kHz to 60 kHz (full scale, 2-6-20 sequence) Meter Accuracy: ±5% of reading, ±3% of full scale (1 kHz tone)
You’ll notice that the meter appears to have a fair level of accuracy, with a specification of ±5%. A closer look, however, shows that the specification doesn’t just stop with an accuracy level of ±5%. In order to fully understand the accuracy of this meter, we must also take into consideration the ±3% of full scale term.

For this particular meter, measuring an FM deviation of 3 kHz (on a 6 kHz tone) means that we need to look at the meter ranges available. The available meter ranges are 2 kHz to 60 kHz in a 2-6-20 sequence. If we are going to look at a signal modulated at 3 kHz deviation, we would need to use the 6 kHz range.
With the 6 kHz range, the specification says that you also have to add ±3% of the meter at full scale. Analog meter movements have inaccuracies that need to be included in the overall specification. After doing the math, we can determine the true specification for this meter as follows:
Measuring at 3 kHz deviation:
±5% of 3000 Hz reading = ± 150 Hz±3% of 6000 Hz full scale = ± 180 Hz
Total Potential Error = ± 330 Hz
Actual meter accuracy at 3 kHz deviation = ±330 Hz/3000 Hz = ±11%
A specification of ±5% would seem fairly accurate, but it is actually ±11% due to fact that we must take into account the full scale term in the specification. This means that the meter could read off as much as ±11% and still be in specification. In other words, after coming back from the calibration lab, this meter could read exactly 3000 Hz deviation, but the actual deviation could really be between 2670 Hz (3000 Hz – 330 Hz) and 3330 Hz (3000 Hz + 330 Hz).
Another significant issue that needs to be taken into consideration is that this type of meter is not even specified for performance at audio tones other than 1 kHz. When looking at the relative deviation measurements, we need to know if the meter is flat between our two frequencies of 80 Hz and 6 kHz. With the given specification, we simply do not know the deviation meter accuracy at 80 Hz and 6 kHz.
You may wonder why this meter is not specified at frequencies other than 1 kHz. That’s because in the past days of analog FM, radio measurements for Modulation, Distortion and SINAD, were measured at 1 kHz. Also, since voice modulated information was confined to frequencies below 3.4 kHz, there simply was never a need to measure or align signals at the higher frequencies, such as 6 kHz. Therefore, it was never specified at that frequency.
Testing shows that these types of meters typically roll off significantly above a 4 kHz audio frequency. This causes inaccuracies of over 20% if used on signals other than a 1 kHz tone. Simply stated, if the FM deviation meter does not specify a range of audio signals that it can measure, it cannot be used for frequencies other than that stated in the specification. This meter would be considered unusable for measuring a 6 kHz audio tone as required for aligning digital radio transmitters.
You can see why FM deviation meters using an analog meter movement are probably the poorest method of measuring FM deviation on digital radios.
Digital FM Deviation Meters
But what about some of the relatively newer FM deviation meters that feature a digital display? You would assume that getting rid of the analog meter movement that the meter accuracy would improve. Let’s take a look at a typical specification from a digital FM deviation meter:

FM Deviation Meter (digital meter type)3:
Meter Ranges: 2 kHz, 5 kHz, 10 kHz, 20 kHz, 50 kHz, 100 kHz full scaleResolution: 10 Hz (2, 5 and 10 kHz range), 100 Hz (20, 50, and 100 kHz ranges) Accuracy: ±5% full scale, ± 50 Hz, ± 1 digit + source residual FM (300 kHz IF BW, 1 kHz tone, 5 kHz
deviation, C-Message weighted filter) Modulation Rate: 0 to 20 kHz
Wow, it looks like things got more complicated rather than easier, doesn’t it? To completely understand the accuracy of this meter, we really need to dig into this specification.
You’ll notice that the meter appears to have a fair level of accuracy, with a ±5% specification. It’s very important to note that the specification is ±5% of full scale. The available meter ranges are 2, 5, 10, 20, 50 and 100 kHz. For our particular test, measuring a deviation of 3 kHz means that we need to use the 5 kHz deviation range. Next, we need to look at the other part of the specification which is ±50 Hz for any measurement. We need to also factor that into our calculation of the total accuracy.
For our analysis, we’ve excluded any resolution error (rounding to 10 Hz or 100 Hz), the ±1 digit and the residual FM from the specification. Residual FM should be evaluated for any FM deviation measurement. Any test system that exhibits more than 15 Hz residual FM should have the residual FM taken into account for the accuracy calculation.
Once again, by doing the math, we can determine the true specification of this meter as follows:
Measuring a 3 kHz deviation:
±5% of 5000 Hz full scale = ± 250 Hz±50 Hz = ± 50 Hz
Total error possible = ± 300 Hz
Actual meter accuracy = ± 300 Hz/3000 Hz = ±10.0%
If you factor in resolution, digit, and a residual FM of 10 Hz, the total error can grow to ± 330 Hz or an error of ± 11%. By the way, did you notice the C-Message filter? If you cannot switch it out, what does that do to flatness? On the other hand, if you can switch it out, the specification says nothing about the accuracy in that case! You can see that our digital FM deviation meter isn’t any better than our analog deviation meter.
Deviation Meter Flatness
We discussed absolute meter accuracy specifications and how they can impact FM deviation measurements. The FM deviation meter may also have audio response issues that can impact FM deviation measurements. For example, a ±0.2 dB flatness error represents an additional ±2.3% error. Flatness specifications must also be included in the specification for FM deviation meter accuracy. Let’s take a look at a typical specification where flatness of the audio response is specified.
FM Deviation Measurement (with flatness specified)4:
Demodulation Range: Up to ±75 kHzAccuracy: ±5% plus residual FMAmplitude Flatness: ±0.2 dB (300 Hz to 3 kHz), 1 dB point at 20 kHz

This meter appears to have a fair level of accuracy, with a specification of ±5%. Notice that there is a ±0.2 dB amplitude flatness specification. Also notice that the deviation meter is not specified for flatness below 300 Hz or above 3 kHz. After some calculation, we can determine the specification for this meter as follows:
Measuring a 6 kHz tone at 3 kHz deviation:
±5% of 3000 Hz reading = ± 150 Hz±0.2 dB Flatness or ± 2.3% = ± 70 Hz
Total error possible = + 220 HzActual meter accuracy = ± 220 Hz/3000 Hz = ±7.3%
However, what happens if the meter tilts from +0.2 dB to -0.2 dB (which is the specification). The error is now much worse, as the swing is 0.4 dB. Now let’s do the math again for a true specification of this meter as follows:
Measuring a 6 kHz tone at 3 kHz deviation:
±5% of 3000 Hz = ± 150 Hz+0.2 dB Flatness = ± 70 Hz-0.2 dB Flatness = ± 70 Hz
Total error possible = ± 290 Hz
Actual meter accuracy = ± 290 Hz/3000 Hz = ±9.6%
You can see where the specification of flatness, even if only a couple of tenths of a dB, can significantly impact the real performance of the FM deviation meter. In addition, this specification cannot be used on our radio, since the frequency of the low tone is 100 Hz, and the frequency of the high tone is 6 kHz. This is well outside the specified range of 300 Hz to 3 kHz. The specification gives us a hint at what may happen, since there is 1 dB roll off at 20 kHz. It is apparent that the meter rolls off after the 3 kHz audio frequency. Given a linear roll off, that would mean that the meter at 6 kHz audio frequency would give us an additional 0.4 dB loss, which gives us a total error of 427 Hz or 14.2%.
One radio manufacturer’s specification requires a maximum level difference of the high tone to the low tone to be no more than 0.05 dB or ±1.2%. This means any meter that has more than a 0.05 dB flatness specification is unusable.
We have shown that many FM deviation meters designed for servicing analog radios, whether the display is analog or digital, can have errors over 10% when all of the specification factors are taken into account. Now let’s take this data and see what happens when we attempt to align a radio using these specifications.
Empirical Data
Based on our analysis of FM deviation meter accuracies, alignment errors have been induced to show the impact that these errors can have on digital transmitter performance.
Alignments were made on three types of radios. It is important to note that these radios are perfectly operational. When aligned properly, the radios meet or exceed the performance specified by the OEM and the Technical Standard (TIA/EIA-102 for P25 and ETSI TS 102 361-1 for DMR). They are used simply to illustrate what improper alignment can do to a perfectly good radio:

• Radio 1: MOTOTRBO™ DMR UHF band radio • Radio 2: Motorola APX™ radio with P25 Phase 1 and Phase 2 capabilities • Radio 3: Motorola XTS® radio with P25 Phase 1 capabilities
Test Equipment used:
• The Cobham/Aeroflex 3920B verified with Keysight and Rohde and Schwarz Vector Signal Analyzers with FM Deviation meter flatness = 0 dB, FM Deviation Meter accuracy = ± 3% of reading
Radio 1 – MOTOTRBO DMR UHF Band Radio
The MOTOTRBO DMR UHF radio has a single modulation adjustment called “Modulation Balance.” For this adjustment, the modulation measurement device must have a flat audio response from 100 Hz to 6 kHz. Following the OEM alignment procedure, the radio’s software tuner application was used to command the radio to transmit a 100 Hz tone. This level was measured and kept as a reference value. The radio was then commanded to transmit a 6 kHz tone and adjusted to be the exact same level that was measured at the 100 Hz tone. The adjustment requirement for this radio is to adjust the high tone to be within 0.05 dB (±1.2%) of the low tone. The absolute accuracy of the FM modulation measurement is not as important as is the relative accuracy or flatness for this measurement. The objective here is to have very flat FM deviation from 100 Hz to 6 kHz.
This modulation alignment impacts the digital FSK Error of the radio. The more error introduced during the FM deviation alignment, means more FSK Error when the radio transmits the digital DMR signal.
To show the impact of mis-alignment, the radio was aligned with varying degrees of FM deviation error and the resulting FSK Error was recorded for each alignment. Additionally, the FSK Error was measured at both high and low power levels. Since the radio is DMR, and it also uses TDMA signaling, the FSK Error tends to be higher at the high power setting.
Both the peak FSK Error and average FSK Error measurements were recorded for each alignment case. Table 1 shows the data results for this radio.
Cobham/Aeroflex 3920B settings:
• Receiver: 492 MHz • IF Filter: 100 kHz (see previous calculations for determining IF Filter settings) • AF Filter: 15 kHz LP (see previous calculations for determining AF Filter settings)
Test Tone Deviation Cal Digital FSK Error Avg/Pk
100 Hz 6 kHz % Low Power FSK High Power FSK
2.12 2.12 0 0.6/1.2 1.4/1.7
2.12 2.23 5 1.2/1.7 1.8/2.1
2.12 2.33 10 2.4/3.2 2.7/3.3
2.12 2.44 15 3.9/4.7 4.1/5.0
2.12 2.54 20 5.4/6.4 5.5/6.6
2.12 2.01 -5 1.6/2.1 2.0/2.4
2.12 1.91 -10 2.7/3.5 3.0/3.7
2.12 1.80 -15 4.0/5.0 4.1/5.1
2.12 1.70 -20 5.0/6.4 5.3/6.4
Table 1

Radio 2 – Motorola APX P25 Radio
The Motorola APX radio also has a single modulation adjustment called “TX Deviation Balance,” which is similar to the MOTOTRBO DMR “Modulation Balance.” For this adjustment, the FM deviation meter must have a flat response from 100 Hz to 3 kHz. The nature of the adjustment and measurements are the level of the low tone (100 Hz) versus the level of the high tone (3 kHz). Once again, the absolute accuracy of the deviation measurement is not as critical as the flatness of the deviation measurement.
If the measuring device itself is not flat between these two tones, the radio will be misaligned by the degree of flatness. This modulation alignment impacts the digital P25 Modulation Fidelity of the radio. The more error introduced during the alignment procedure, the more error when the radio transmits a digital signal.
To show the impact of misalignment, a radio was aligned with varying degrees of error, and the resulting C4FM Modulation Fidelity was recorded for each alignment. Modulation Fidelity was measured at low power for P25 Phase 1 and both low and high power levels for P25 Phase 2. P25 Phase 1 C4FM modulation produces constant power signaling, and the Modulation Fidelity tends to be the same at both high and low power settings. P25 Phase 2 modulation uses continuous phase modulation, and the Modulation Fidelity is slightly more at high power settings. Peak and average Modulation Fidelity error measurements were recorded for each alignment case. Table 2 shows the data results for this radio.
Cobham/Aeroflex 3920B settings:
• Receiver: 160.125 MHz • IF Filter: 30 kHz (see previous calculations for determining IF Filter settings) • AF Filter: 15 kHz LP (see previous calculations for determining AF Filter settings)
Test Tone Deviation Cal Modulation Fidelity Measurements Avg/Pk
100 Hz 3 kHz % Phase 1 Phase 2 Low Phase 2 High
3.07 3.08 0 0.5/0.8 1.0/3.3 1.1/5.7
3.07 3.22 5 2.0/2.2 2.2/3.5 2.1/4.3
3.07 3.37 10 4.3/4.7 5.0/6.4 5.1/8.3
3.07 3.53 15 6.7/7.0 7.4/12.3 7.4/11.2
3.07 3.68 20 9.0/9.3 10.5/12 10.7/11.9
3.07 2.92 -5 2.2/2.5 3.0/7.4 3.3/8.0
3.07 2.76 -10 4.7/4.8 5.5/6.7 5.5/7.6
3.07 2.61 -15 7.0/7.4 8.0/9.1 8.3/9.5
3.07 2.46 -20 9.6/10.1 11.0/12.3 11.0/13.3
Table 2
Radio 3 – Motorola XTS P25 Radio
The Motorola XTS-5000 radio has two modulation adjustments. The first is called “TX Deviation Balance” and the second is called “Deviation Limiting”. These two adjustments are typical in most digital radios marketed today.
For the Deviation Balance adjustment, the FM deviation meter must have a flat response from 80 Hz to 3 kHz. The nature of this adjustment and measurement are to ensure that the level of the high tone (3 kHz) is the same as the low tone (80 Hz). Again, the absolute accuracy of the deviation measurement is not as critical as the flatness of the deviation measurement. This modulation alignment impacts the digital Modulation Fidelity of the radio.

The radio was misaligned with varying degrees of error and the resulting C4FM Modulation Fidelity was recorded for each alignment. The Modulation Fidelity was measured at low power levels only. Since C4FM modulation produces constant power signaling, the error tends to be the same at both high and low power settings. Average and peak error measurements were recorded for each alignment case. Table 3 shows the data results for this radio. As with the APX radio in Table 2, the results show that aligning the radio with a meter that reads HIGH will cause more severe C4FM modulation degradation than one that reads LOW.
Cobham/Aeroflex 3920B settings:
• Receiver: 809.0125 MHz • IF Filter: 30 kHz (see previous calculations for determining IF Filter settings) • AF Filter: 15 kHz LP (see previous calculations for determining AF Filter settings)
Since this radio uses 3.62 kHz deviation with an 80 Hz tone for the Deviation Balance measurement, adjusting the deviation level of the 3 kHz tone to exactly match the same deviation level (3.62 kHz) will result in the best Modulation Fidelity performance. Table 3 shows the resulting C4FM Modulation Fidelity error with each of the various calibration errors.
Test Tone Deviation Cal Error Modulation Fidelity
80 Hz Rate 3 kHz % Error Average Peak
3.62 3.62 0 0.8 0.8
3.62 3.801 5 3.1 3.6
3.62 3.982 10 6 6.5
3.62 4.163 15 7.3 8
3.62 4.344 20 11.8 13.4
3.62 3.439 -5 2.8 3.1
3.62 3.258 -10 7.2 7.8
3.62 3.077 -15 10.5 11.6
3.62 2.896 -20 15.4 18.3
Table 3
The second modulation adjustment for this radio is called “Deviation Limiting.” For this adjustment, the FM deviation meter must have a good specification for absolute accuracy. This measurement is using a 1.2 kHz tone and the object is to adjust it to exactly 2.83 kHz deviation. If the FM deviation meter itself does not have good absolute accuracy, the radio will be misaligned. This modulation alignment impacts the digital P25 Phase 1 Symbol Deviation measurement, which should be 1800 Hz.
The more error that is introduced into the alignment will result in poor symmetry between the symbols. This will impact the bandwidth that the signal occupies when the radio transmits a digital signal. Remember that the whole purpose of going to narrower bandwidth channels is to achieve more users in a given spectrum. Over deviation on this measurement will occupy more bandwidth, which impacts adjacent channel performance, which is counter to the objective of these technologies. After alignment, this radio was measured for Symbol Deviation with C4FM modulation.

Cobham/Aeroflex 3920B settings:
• Receiver: 809.0125 MHz • IF Filter: 12.5 kHz (see previous calculations for determining IF Filter settings) • AF Filter: 5 kHz LP (see previous calculations for determining AF Filter settings)
1.2 kHz Rate/2.83 kHz Cal Error 1800 Hz Symbol Deviation
Measured % Error Symbol Symbol Dev.
2.83 0 1764 -36
2.9715 5 1870 70
3.113 10 1956 156
3.2545 15 2050 250
3.396 20 2150 350
2.6885 -5 1675 -125
2.547 -10 1588 -212
2.4055 -15 1495 -305
2.264 -20 1409 -391
Table 4
DMR Transmitter Signal Impairments
Figure 9 shows an ideal 4 level FSK modulated signal for DMR radios. Take notice of how well behaved the modulation is performing with this ideal signal, and how tightly the digital modulator is adhering to the specified frequency deviation points. The FSK Error meter is showing a very small 0.6% error.
Figure 9: An Ideal DMR Signal
For the MOTOTRBO radio, Figures 10 and 11 show actual screen shots of the transmitter signal with each of the signal impairments that were logged in Table 1. The degradation of the modulated waveform is due to misalignment during the deviation balance adjustment. The images are labeled as both positive and negative alignment errors. It is apparent that the signal qualities for each of these misalignments are far from ideal. It is important to note that the error in alignments can easily be seen in the FSK Error measurement. A 20% error in deviation balance alignment causes a 5.5% FSK Error.

Figure 10: DMR Positive Calibration Errors
5%
10
%1
5%
20
%

Figure 11: DMR Negative Calibration Errors
Remember that calibration errors can be caused by a variety of reasons:
1. Meter inaccuracies. 2. Improper receiver IF filtering. 3. Improper receiver audio filtering. 4. Meter flatness. 5. Excessive residual FM on the source local oscillator.
20
%1
5%
10
%5
%

P25 Transmitter Signal Impairments
Figure 12 shows an ideal P25 modulated signal, in this case using C4FM modulation. You’ll notice how well behaved the modulation is performing with this ideal signal, and how tightly the digital modulator is adhering to the specified frequency deviation points. The Modulation Fidelity meter is showing a very small 0.4% error.
Figure 12: An Ideal P25 Signal
For the XTS-5000 radio, Figures 13 and 14 show actual screen shots of the transmitter signal with each of the signal impairments that were logged in Table 3. The degradation of the modulated waveform is due to misalignment during the deviation balance adjustment. The images are labeled as both positive and negative alignment errors.
As you can see, the signal qualities are far from ideal. In the case of a negative calibration error with a -20% FM deviation measurement error, the test system could no longer demodulate the signal and produces an invalid measurement display. It is important to note that the error in alignments can easily be seen in the Modulation Fidelity measurement. A -10% error in analog FM deviation alignment causes a 7.1% Modulation Fidelity error. The standard for P25 (TIA/EIA-102) specifies that Modulation Fidelity must be lower than 5%; however, most radios are capable of performing much better than 2%. The lower the error, the better the radio will perform.
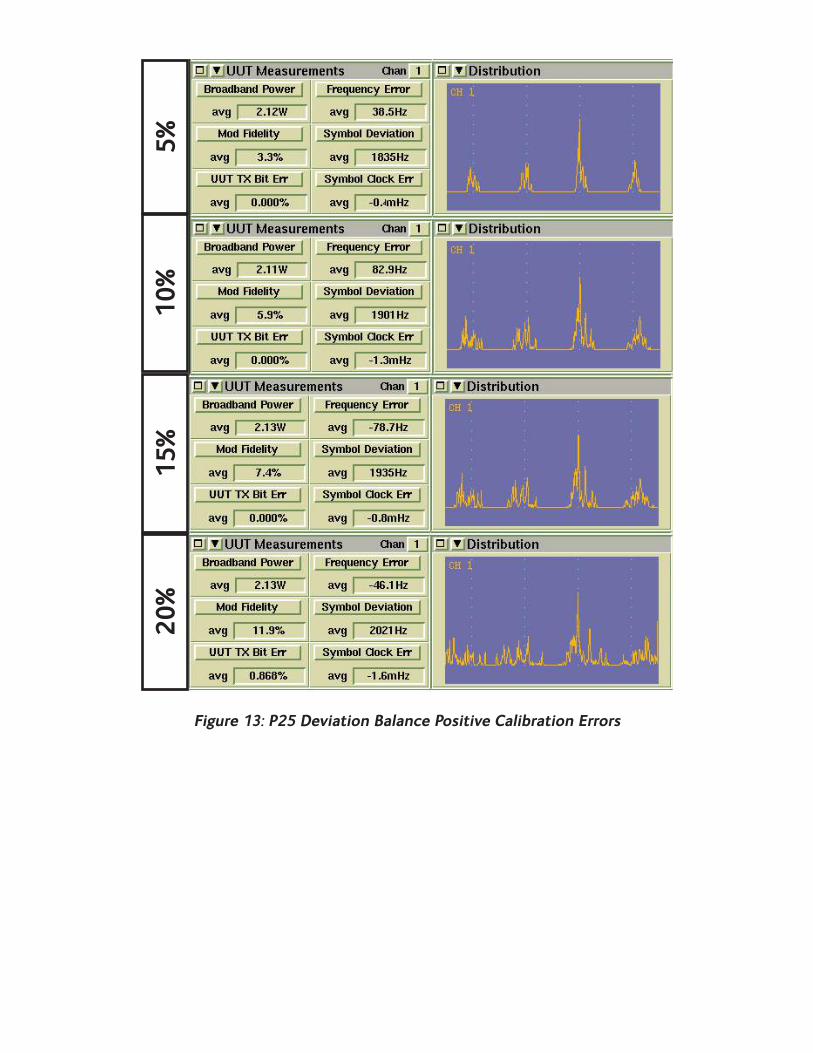
Figure 13: P25 Deviation Balance Positive Calibration Errors
20
%1
5%
10
%5
%

Figure 14: P25 Deviation Balance Negative Calibration Errors
To gauge the impact of the deviation limiting adjustment, we go back to the ideal P25 signal shown in Figure 12. However, this time we note the Symbol Deviation of the radio rather than the Modulation Fidelity. Note that the Symbol Deviation is exactly at 1800 Hz, which is where it should be. For Figures 13 and 14 the Symbol Deviation is not ideal.
Figures 15 and 16 show actual screen shots of the transmitter signal with the signal impairments caused by improper alignment during the deviation limiting adjustment as previously shown in Table 4. The images are labeled as both positive and negative alignment errors. Positive alignment errors would result from a deviation meter that reads LOW with the 1.2 kHz tone. Negative alignment errors would result from a deviation meter that reads HIGH with the 1.2 kHz tone. The results show that aligning the radio with a meter that reads HIGH will cause more severe issues than one that reads LOW.
20
%1
5%
10
%5
%

Figure 15: P25 Deviation Limiting Positive Calibration Errors
20
%1
5%
10
%5
%

Figure 16: P25 Deviation Limiting Negative Calibration Errors
Now that we understand the impact that deviation misalignments have on the radio transmitter performance, we can directly assess the impact of the transmitter digital performance to the effective receiver sensitivity of the radio. This is the critical aspect of this study, since a reduction in effective receiver sensitivity has the same impact as a reduction of power levels. A 3 dB reduction in effective receiver sensitivity reduces the link budget exactly the same as a 3 dB reduction in power (50%) and will affect the range of the radio on the system.
20
%1
5%
10
%5
%

Transmitter Signal Impairments and Their Effect on Receiver Sensitivity
P25 Receiver Sensitivity Impact
We have seen how FM deviation meter measurement errors affect the alignment of the digital transmitter. We have also seen how it impacts the radio’s digital performance measured in Modulation Fidelity and/or FSK Error. From this, we can show the impact that the transmitted signal has on the ability of the receiver to decode the modulation. For the sake of brevity, this example shows the impact on a P25 receiver. However, due to the similarity in modulation types and adjustments, these results are typical for a wide range of digital radios used in the land mobile radio market.
Figures 17 and 18 show the impairment of a P25 receiver’s sensitivity in dB due to the calibration errors induced by improper transmitter FM deviation balance alignments. Negative calibration errors cause more severe issues for the receiver to decode and recover the symbol information. In the worst case scenario, using an FM deviation meter with excessive residual FM, too wide of an IF Filter setting, too wide of an AF Filter, too much slope in the meter flatness and just poor accuracy to begin with, can cause a receiver sensitivity impact that approaches a 6 dB loss (or an effective 75% reduction in power).
Figure 17: P25 RX BER Degradation Due to Deviation Balance Misalignment (POS)
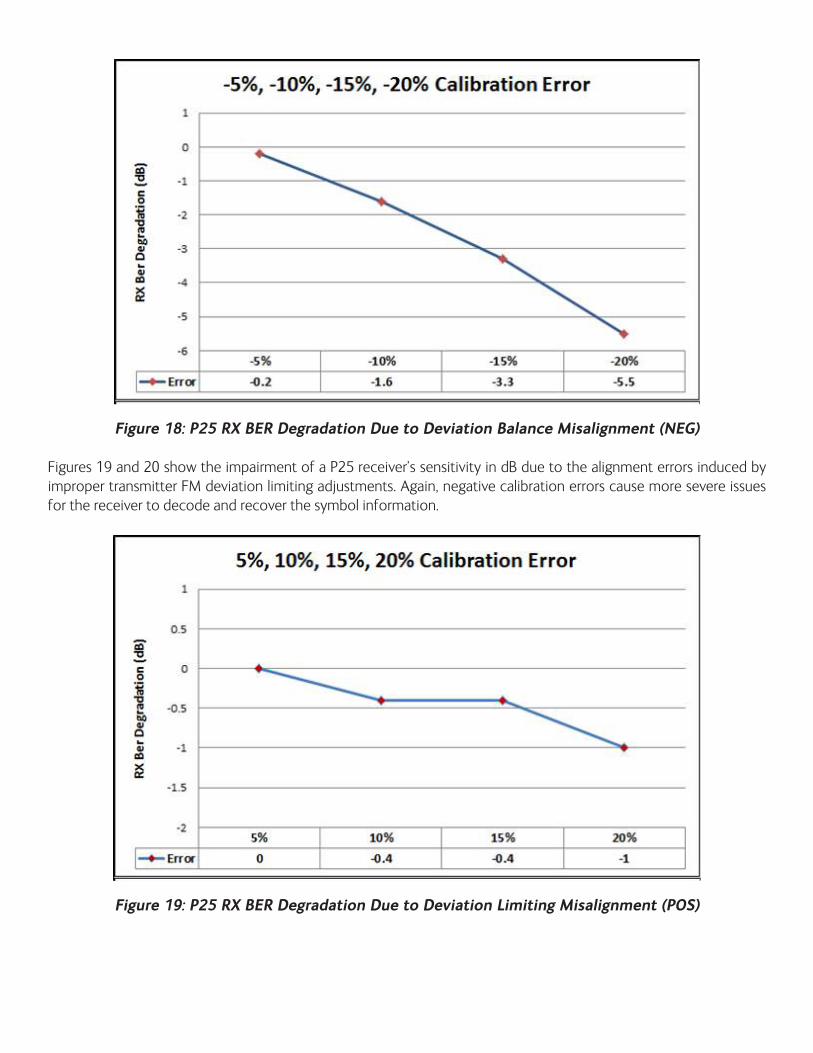
Figure 18: P25 RX BER Degradation Due to Deviation Balance Misalignment (NEG)
Figures 19 and 20 show the impairment of a P25 receiver’s sensitivity in dB due to the alignment errors induced by improper transmitter FM deviation limiting adjustments. Again, negative calibration errors cause more severe issues for the receiver to decode and recover the symbol information.
Figure 19: P25 RX BER Degradation Due to Deviation Limiting Misalignment (POS)

Figure 20: P25 RX BER Degradation Due to Deviation Limiting Misalignment (NEG)
Figure 21 shows the combined effect in the XTS-5000 radio where inaccuracies in both the deviation balance and deviation limiting alignment cause an additive effect. A -10% deviation balance error in alignment, combined with a -10% deviation limiting error in alignment, causes a modulation fidelity to be 8.1% and symbol deviation to be 1448 Hz normalized.

Figure 21: P25 Modulation Fidelity Degradation Due to Both Deviation Balance and Deviation Limiting Alignment Errors (NEG)
These errors combined impact of the receiver sensitivity with a degradation of over 3 dB as shown in Figure 22. This is a very realistic outcome using FM deviation meters without the proper specifications to perform these alignments in digital radios whether they are analog or digital.
Bal
ance
- 1
0%
Lim
itin
g -
10
%B
alan
ce -
10
%Li
mit
ing
- 5
%B
alan
ce -
5%
Lim
itin
g -
10
%B
alan
ce -
5%
Lim
itin
g -
5%

Figure 22: P25 RX BER Degradation Due to Both Deviation Balance and Deviation Limiting Alignment Errors (NEG)
Conclusion:
FM deviation measurements and adjustments are critical to the performance of today’s digital radio technologies. Only by fully understanding the impact of FM deviation meter operation and specifications, can we appreciate the impact that these meters have on the operation of DMR, P25, NXDN and other digital radios systems. There are many factors that we must consider when we work with digital radio systems: Today’s digital radios are designed to optimize bandwidth utilization. Through the use of digital modulation techniques, they provide very good voice quality if aligned correctly. They are not always “perfect,” and improper alignment will cause significant voice and radio range degradation.
1. Digital radio sensitivity is measured in Bit Error Rate (BER). The effective sensitivity of the receiver is directly impacted by the quality of the received digital modulation. Short range voice quality checks are not adequate for determining real world operation over the coverage area of the radio network.
2. Radios that conform to OEM and technical standard specifications can be easily misaligned without an accurate FM deviation meter. Deviation alignments in the analog mode dictate the performance of the radio transmitter in the digital mode. This can affect network performance as much as or more than power level problems. An RF power decrease or receiver sensitivity degradation of 3 dB is equivalent to a 50% reduction in power. A decrease of 6 dB is equivalent to a 75% reduction in power level.
3. FM deviation meter accuracy is impacted by IF and AF Filter settings as well as residual FM.
• Filter bandwidth settings that are excessive as well as poor test system residual FM will cause the meter to read high. This, in turn, forces the radio FM deviation alignment to the negative side. This causes a worst case scenario for effective receiver BER performance and thus, voice quality and range.

• Specification of the FM deviation meter impacts the accuracy of FM deviation measurements and adjustments. In many cases, FM deviation meters designed for analog radios do not have sufficient performance that allows them to be used to align digital radios.
• FM deviation meters must have flat response for relative measurements. Any meter that is not specified to operate in the audio range required (80 Hz to 6 kHz) is unusable for aligning digital transmitters.
• FM deviation meters must have superior absolute measurement accuracy if they are to be used in aligning digital radios. Specifications for total accuracy must be taken into account and if inadequate, cannot be used to align digital radios. A review of the OEM specifications, TIA and ETSI standards indicate that FM deviation meter accuracy should be equal to or better than 3% for DMR, NXDN, dPMR and P25 radios.
4. The combination of meter specifications, IF and AF Filter settings, residual FM and lack of appropriate measurement range shows that traditional analog deviation meters can be in excess of 15% in error and not useable for digital radio alignments.
5. Modulation Fidelity or FSK Error must be checked to verify that the FM deviation alignments did, in fact, produce a good digital signal.
References:
1. For DMR systems, the 4 FSK points are +648 Hz for 00, +1944 Hz for 01, -648 Hz for 10, and -1944 Hz for 11 and are referenced to a symbol clock rate of 4800 symbols/second. dPMR and NXDN use similar modulation with narrower deviations levels. 4FSK modulation quality is determined by using a measurement called FSK Error and is expressed as an error percentage referenced to an ideal signal.
P25 Phase 1 systems use a 4 level FSK signal called “Compatible 4 Level Frequency Modulation” (C4FM) with deviation points of +600 Hz for 00, +1800 Hz for 01, -600 Hz for 10, and -1800 Hz for 11 and also has a symbol clock rate of 4800 symbols/second. P25 modulation quality is determined by a measurement called Modulation Fidelity.
2. Actual specification from an Analog Service Monitor, circa 1999 using an analog display.
3. Actual specification from an Analog Service Monitor, circa 2003 using a digital display.
4. Actual specification from a Digital Service Monitor, circa 2015.