Migrant Networks and Trade: The Vietnamese Boat … NETWORKS AND TRADE: THE VIETNAMESE BOAT PEOPLE...
25
MIGRANT NETWORKS AND TRADE: THE VIETNAMESE BOAT PEOPLE AS A NATURAL EXPERIMENT* Christopher Parsons and Pierre-Louis V ezina We exploit a unique event in human history, the exodus of the Vietnamese Boat People to the US, to provide evidence for the causal pro-trade effect of migrants. This episode represents an ideal natural experiment as the large immigration shock, the first wave of which comprised refugees exogenously allocated across the US, occurred over a 20-year period during which time the US imposed a complete trade embargo on Vietnam. Following the lifting of trade restrictions in 1994, US exports to Vietnam grew most in US states with larger Vietnamese populations, themselves the result of larger refugee inflows 20 years earlier. In this article, we use the exodus of the Vietnamese Boat People as a natural experiment to provide causal evidence of a long-run developmental impact of immigration, i.e. migrant networks promoting trade. Immigrants potentially foster international trade by reducing trade costs. Such frictions are quantitatively large, especially for poor countries (Anderson and van Wincoop, 2004), and are so substantial that they have been advocated as a plausible explanation for the six major puzzles in international economics (Obstfeld and Rogoff, 2001). Recent theoretical and empirical research has singled out information costs in particular as inhibiting trade flows (Steinwender, 2013; Allen, 2014; Chaney, 2014). Immigrants may lower such frictions through their knowledge of their home country’s language, regulations, market opportunities and informal institutions. So too are immigrants argued to decrease the costs of negotiating and enforcing contracts by drawing upon their trusted networks, thereby deterring opportunistic behaviour in weak institutional environments (Greif, 1993; Gould, 1994; Rauch, 2001; Rauch and Trindade, 2002; Dunlevy, 2006). This is important, since weak institutions have been shown to significantly and adversely affect trade volumes (Anderson and Marcouiller, 2002; Berkowitz et al., 2006). Migrants are thus expected to facilitate bilateral trade mostly with developing countries, where firms typically need to navigate myriad bureaucratic and legal hurdles, Vietnam being a case in point. * Corresponding author: Christopher Parsons, Economics (UWA Business School), The University of Western Australia, 35 Stirling Highway, Crawley, WA 6009, Australia. Email: christopher.parsons@ uwa.edu.au. We thank Mary May at the US Census Bureau for dealing with our data purchases. We are also extremely grateful to two anonymous referees, as well as to the editor Frederic Vermeulen for valuable suggestions. We also thank Michel Beine, Andy Bernard, Lorenzo Caliendo, Christian Dustmann, Giovanni Facchini, Gabriel Felbermayr, Tommaso Frattini, Beata Javorcik, Mary Lovely, Friederike Niepmann, Lindsay Oldenski, Thi Thu Tra Pham, Ferdinand Rauch, Richard Upward, Chris Woodruff and Alan Winters as well as participants at the 2013 Midwest Trade Meeting at the University of Michigan, the 2013 Junior Economist Workshop on Migration Research in Munich, the 2014 EITI Conference in Phuket, the 2014 Royal Economic Society Conference in Manchester, the 2014 APSA conference in Washington DC, the 2014 ETSG conference in Munich and the 12th IZA Annual Migration Meeting and 5th Migration Topic Week, Dakar 2015, and at seminars at the Universities of Bournemouth, Nottingham, Oxford, Southampton, Sussex, Birmingham, Kent, at Copenhagen Business School, Moscow’s New Economic School and Royal Holloway for useful comments. [1] The Economic Journal, Doi: 10.1111/ecoj.12457 Ó 2018 Royal Economic Society. Published by John Wiley & Sons, 9600 Garsington Road, Oxford OX4 2DQ, UK and 350 Main Street, Malden, MA 02148, USA.
Transcript of Migrant Networks and Trade: The Vietnamese Boat … NETWORKS AND TRADE: THE VIETNAMESE BOAT PEOPLE...
MIGRANT NETWORKS AND TRADE: THE VIETNAMESEBOAT PEOPLE AS A NATURAL EXPERIMENT*
Christopher Parsons and Pierre-Louis V�ezina
We exploit a unique event in human history, the exodus of the Vietnamese Boat People to the US, toprovide evidence for the causal pro-trade effect of migrants. This episode represents an ideal naturalexperiment as the large immigration shock, the first wave of which comprised refugees exogenouslyallocated across the US, occurred over a 20-year period during which time the US imposed acomplete trade embargo on Vietnam. Following the lifting of trade restrictions in 1994, US exports toVietnam grew most in US states with larger Vietnamese populations, themselves the result of largerrefugee inflows 20 years earlier.
In this article, we use the exodus of the Vietnamese Boat People as a naturalexperiment to provide causal evidence of a long-run developmental impact ofimmigration, i.e. migrant networks promoting trade. Immigrants potentially fosterinternational trade by reducing trade costs. Such frictions are quantitatively large,especially for poor countries (Anderson and van Wincoop, 2004), and are sosubstantial that they have been advocated as a plausible explanation for the six majorpuzzles in international economics (Obstfeld and Rogoff, 2001). Recent theoreticaland empirical research has singled out information costs in particular as inhibitingtrade flows (Steinwender, 2013; Allen, 2014; Chaney, 2014). Immigrants may lowersuch frictions through their knowledge of their home country’s language, regulations,market opportunities and informal institutions. So too are immigrants argued todecrease the costs of negotiating and enforcing contracts by drawing upon theirtrusted networks, thereby deterring opportunistic behaviour in weak institutionalenvironments (Greif, 1993; Gould, 1994; Rauch, 2001; Rauch and Trindade, 2002;Dunlevy, 2006). This is important, since weak institutions have been shown tosignificantly and adversely affect trade volumes (Anderson and Marcouiller, 2002;Berkowitz et al., 2006). Migrants are thus expected to facilitate bilateral trade mostlywith developing countries, where firms typically need to navigate myriad bureaucraticand legal hurdles, Vietnam being a case in point.
* Corresponding author: Christopher Parsons, Economics (UWA Business School), The University ofWestern Australia, 35 Stirling Highway, Crawley, WA 6009, Australia. Email: [email protected].
We thank Mary May at the US Census Bureau for dealing with our data purchases. We are also extremelygrateful to two anonymous referees, as well as to the editor Frederic Vermeulen for valuable suggestions. Wealso thank Michel Beine, Andy Bernard, Lorenzo Caliendo, Christian Dustmann, Giovanni Facchini, GabrielFelbermayr, Tommaso Frattini, Beata Javorcik, Mary Lovely, Friederike Niepmann, Lindsay Oldenski, ThiThu Tra Pham, Ferdinand Rauch, Richard Upward, Chris Woodruff and Alan Winters as well as participantsat the 2013 Midwest Trade Meeting at the University of Michigan, the 2013 Junior Economist Workshop onMigration Research in Munich, the 2014 EITI Conference in Phuket, the 2014 Royal Economic SocietyConference in Manchester, the 2014 APSA conference in Washington DC, the 2014 ETSG conference inMunich and the 12th IZA Annual Migration Meeting and 5th Migration Topic Week, Dakar 2015, and atseminars at the Universities of Bournemouth, Nottingham, Oxford, Southampton, Sussex, Birmingham,Kent, at Copenhagen Business School, Moscow’s New Economic School and Royal Holloway for usefulcomments.
[ 1 ]
The Economic Journal,Doi: 10.1111/ecoj.12457� 2018Royal Economic Society. Published by John Wiley & Sons, 9600 Garsington Road, Oxford OX4
2DQ, UK and 350 Main Street, Malden, MA 02148, USA.

While a large literature examines the pro-trade effect of migration, causality frommigration to trade has yet to be conclusively established (Felbermayr et al., 2015). Studiesalmost ubiquitously uncover a positive correlation between migration and trade (Gencet al., 2012), to the extent that these results are often interpreted as evidence of a positivediaspora externality. Doubts persist however as to whether trading partners’ culturalaffinity or else bilateral economic policies might be driving the observed positivecorrelations (Lucas, 2005; Hanson, 2010). These doubts are valid since the estimatedimpacts of immigration on trade are quantitatively large and therefore represent animportant channel through which migration might lead to gains from trade.
We use the exodus of the Vietnamese Boat People to theUS as a natural experiment toestablish a causal effect from Vietnamese immigration to US trade with Vietnam. Theexodus started in April 1975 following the Fall of Saigon when the USmilitary evacuatedaround 130,000 refugees from South Vietnam. A major part of this evacuation wasOperation FrequentWind, the largest boat and air lift in refugee history. This first wave ofrefugees was, as we will detail in the next Section, exogenously dispersed throughout theUS. It constituted the first of many waves, as subsequently hundreds of thousands ofVietnamese refugees fled Vietnam to escape persecution in ‘re-education camps’ and‘agricultural collectives’. Between 1975 and 1994, around 1.4 million Vietnameserefugees were resettled in the US. Concurrently, the US imposed a trade embargo on allVietnam,under the auspices of the 1917Tradingwith theEnemyAct and the 1969ExportAdministration Act. Our natural experiment thus combines an exogenous dispersion ofVietnamese refugees to the US in tandem with a lasting trade embargo. These eventsconstitute an ideal setting to test the causal link from Vietnamese immigration to USexports to Vietnam following the lifting of the trade embargo in 1994.
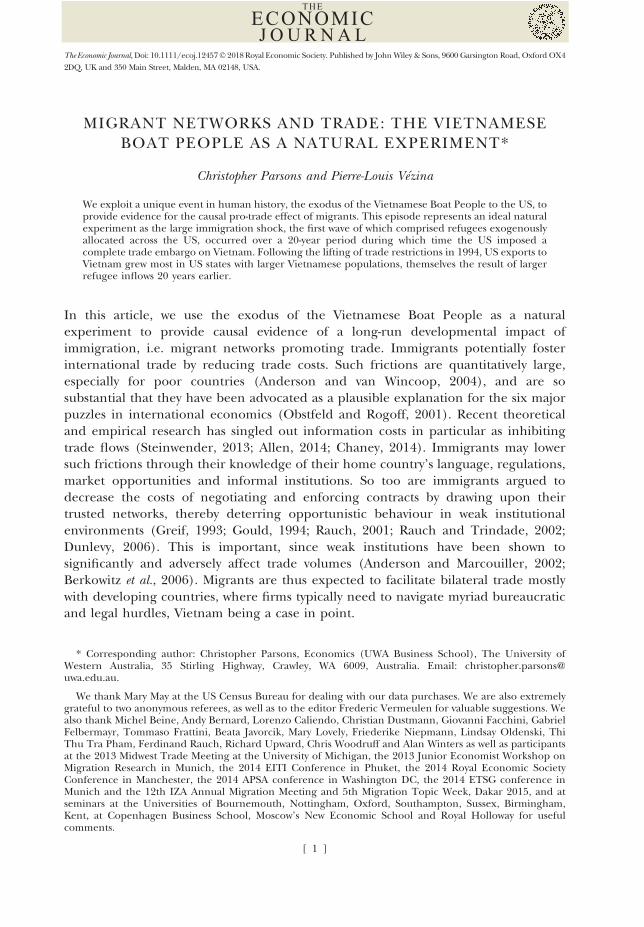
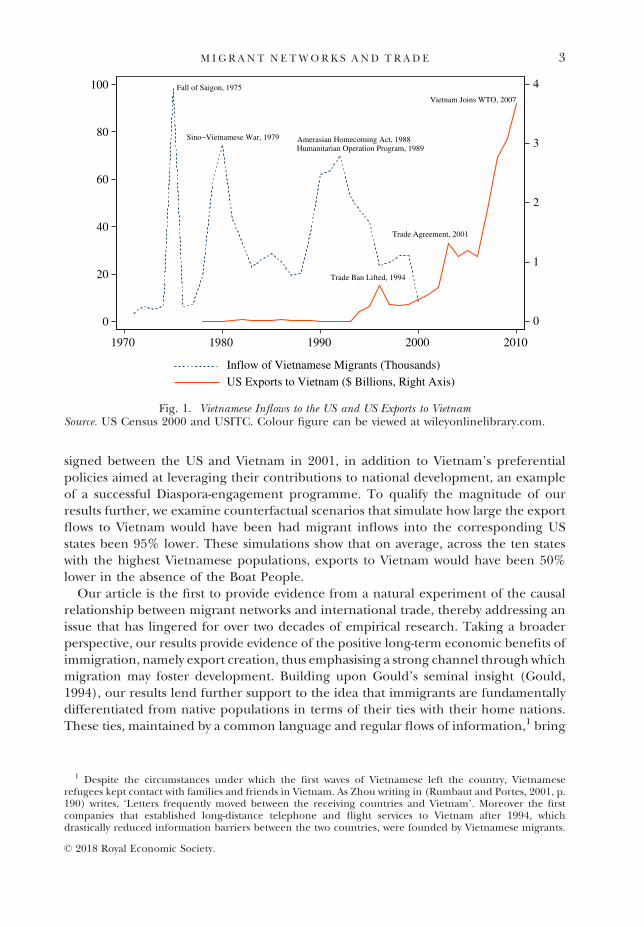
Figures 1 and 2 demonstrate our identification strategy. Figure 1 plots theimmigration waves of Vietnamese to the US (dotted line), with three spikescorresponding to the Fall of Saigon, the Sino-Vietnamese War and the introductionof US policies designed to welcome additional waves of Vietnamese refugees. Theseimmigration shocks preceded the opening up of trade with Vietnam in 1994, which ledto a rise in US exports to Vietnam (bold line) that was particularly pronounced in thelate 2000s. Figure 2 shows that the exogenous allocation of the first wave of 130,000refugees in 1975 is strongly correlated with the location of Vietnamese migrants in theUS in 1995, the first year after the lifting of the trade embargo. We thus use thechronology of events and most importantly the exogenous allocation of the first waveof refugees (as an instrumental variable) to establish a causal link from migrantnetworks in 1995 to trade creation between 1995 and 2010.
Our results show that US exports going to Vietnam over the period 1995–2010, i.e.following the lifting of the trade embargo in 1994, grew most in those US states withlarger Vietnamese populations, themselves the result of larger refugee inflows twodecades earlier. Our 1995-cross-section results suggest that a 10% increase in theVietnamese network raises exports to Vietnam by between 4.5% and 14%. Our resultsare robust when we additionally consider: the extensive margin, expressing exports inshares as opposed to levels, outliers and different types of goods traded. Furthermore,we undertake a number of placebo exercises that further validate our results. In panelregressions, in which we include state fixed effects, we document how the overseasVietnamese, known as the Viet Kieu, took advantage of a bilateral trade agreement
© 2018 Royal Economic Society.
2 T H E E CONOM I C J O U RN A L
signed between the US and Vietnam in 2001, in addition to Vietnam’s preferentialpolicies aimed at leveraging their contributions to national development, an exampleof a successful Diaspora-engagement programme. To qualify the magnitude of ourresults further, we examine counterfactual scenarios that simulate how large the exportflows to Vietnam would have been had migrant inflows into the corresponding USstates been 95% lower. These simulations show that on average, across the ten stateswith the highest Vietnamese populations, exports to Vietnam would have been 50%lower in the absence of the Boat People.
Our article is the first to provide evidence from a natural experiment of the causalrelationship between migrant networks and international trade, thereby addressing anissue that has lingered for over two decades of empirical research. Taking a broaderperspective, our results provide evidence of the positive long-term economic benefits ofimmigration, namely export creation, thus emphasising a strong channel through whichmigration may foster development. Building upon Gould’s seminal insight (Gould,1994), our results lend further support to the idea that immigrants are fundamentallydifferentiated from native populations in terms of their ties with their home nations.These ties, maintained by a common language and regular flows of information,1 bring
Fall of Saigon, 1975
Sino−Vietnamese War, 1979
Vietnam Joins WTO, 2007
Trade Ban Lifted, 1994
Trade Agreement, 2001
Amerasian Homecoming Act, 1988Humanitarian Operation Program, 1989
0
1
2
3
4
0
20
40
60
80
100
1970 1980 1990 2000 2010
Inflow of Vietnamese Migrants (Thousands)
US Exports to Vietnam ($ Billions, Right Axis)
Fig. 1. Vietnamese Inflows to the US and US Exports to VietnamSource. US Census 2000 and USITC. Colour figure can be viewed at wileyonlinelibrary.com.
1 Despite the circumstances under which the first waves of Vietnamese left the country, Vietnameserefugees kept contact with families and friends in Vietnam. As Zhou writing in (Rumbaut and Portes, 2001, p.190) writes, ‘Letters frequently moved between the receiving countries and Vietnam’. Moreover the firstcompanies that established long-distance telephone and flight services to Vietnam after 1994, whichdrastically reduced information barriers between the two countries, were founded by Vietnamese migrants.
© 2018 Royal Economic Society.
M I G R A N T N E TWOR K S A N D T R A D E 3
nations closer together and represent an important channel through which immigrantsnurture long-run development.
Gould (1994) originally hypothesised two channels through which migrants mayfoster trade flows. He argued that immigrants may reduce the transaction costs of tradeby providing foreign market information, the so-called information channel and thatimmigrants’ demand preferences, or nostalgia, may foster imports from their origincountries, what he termed the preference channel. By concentrating on the effect of(Vietnamese) immigration on (United States) exports, we isolate the informationchannel (Felbermayr and Toubal, 2012). Nonetheless, the immigration shock mightalso have led to ‘nostalgia’ imports from Vietnam in addition to the opening of manyrestaurants and other businesses that rely on Vietnamese-specific skills and imports.These potentially translate into gains from variety for US consumers (Chen and Jacks,2012) and export-led poverty reduction in Vietnam (McCaig, 2011).
The following Section provides an account of the events that followed the Fall ofSaigon and elucidates our natural experiment. Section 2 presents our data andempirical model. Our results are then presented in Section 3 and Section 4 concludes.
1. The Natural Experiment
In this Section, we describe the chronology of events surrounding the exodus of theVietnamese Boat People from Vietnam to the US. The Fall of Saigon to the CommunistVietnamese North in April 1975 proved the catalyst for the first wave of refugees from
NM
NV
ND
MT
DC
RI
HIMI OK
MEVT
CONJ
MO
MANY
IN
DE
UT
AK
AZ
SD
OH
MD
NH
AL
PA
WY
FL
KY
VA
ID
MN
WV
CT
WISC
IA
NC
MS
ILLAGA
KS
TN
AR
TX
NE
CA
OR
WA
4
6
8
10
12V
ietn
ames
e M
igra
nts
in 1
995
4 5 6 7 8 9 10Vietnamese Refugees in 1975
Fig. 2. 1995 Vietnamese Migrant Stock Versus 1975 Refugees (thousands)Note. The circles are proportional to the state’s average exports to Vietnam as a share of totalexports during 1995–2010.Source. See Section 3. Colour figure can be viewed at wileyonlinelibrary.com.
© 2018 Royal Economic Society.
4 T H E E CONOM I C J O U RN A L
Vietnam, as the North pursued their wartime enemies, forcing over one million peopleinto ‘re-education camps’ and ‘new economic zones’ i.e. agricultural collectives.Following the first wave, hundreds of thousands of Vietnamese fled overland and by searelying on watercraft, often fishing boats, giving rise to their name ‘The Boat People’.Those Vietnamese that were able to leave, fled overland to Cambodia, Laos andThailand – or else headed for the open seas, to international waters and busy shippinglanes.2 The fortunate were rescued by ships’ crews and taken to refugee camps in HongKong, Malaysia, Thailand, Indonesia and the Philippines, the so-called ‘first asylumcountries’ where they typically faced squalid conditions.
In response to the unfolding crisis, the US President’s Special Interagency TaskForce (IATF) for Indochina refugees was established on 18 April 1975. The refugeeprogram consisted of three separate phases:
(i) the evacuation of 140,767 refugees;(ii) the refugees’ temporary care while they waited to be permanently settled; and(iii) the resettlement of the refugees either in the US (132,421), in third countries,
largely Canada and France (6,632) or else to ensure their successfulrepatriation to Vietnam (1,546).
The vast majority of refugees that ended up residing in the US were processed throughone of four camps on US soil, namely Fort Chaffee (Arkansas, 50,135), CampPendleton (California, 48,418), Fort Indiantown Gap (Pennsylvania, 21,651) and ElginAir force Base (Florida, 8,665). There, 19 voluntary agencies (VOLAGs), predomi-nantly religious organisations, helped the Vietnamese to settle by matching them withsponsors, for example, with US citizens that offered food, clothing and shelter until therefugees were financially independent.3
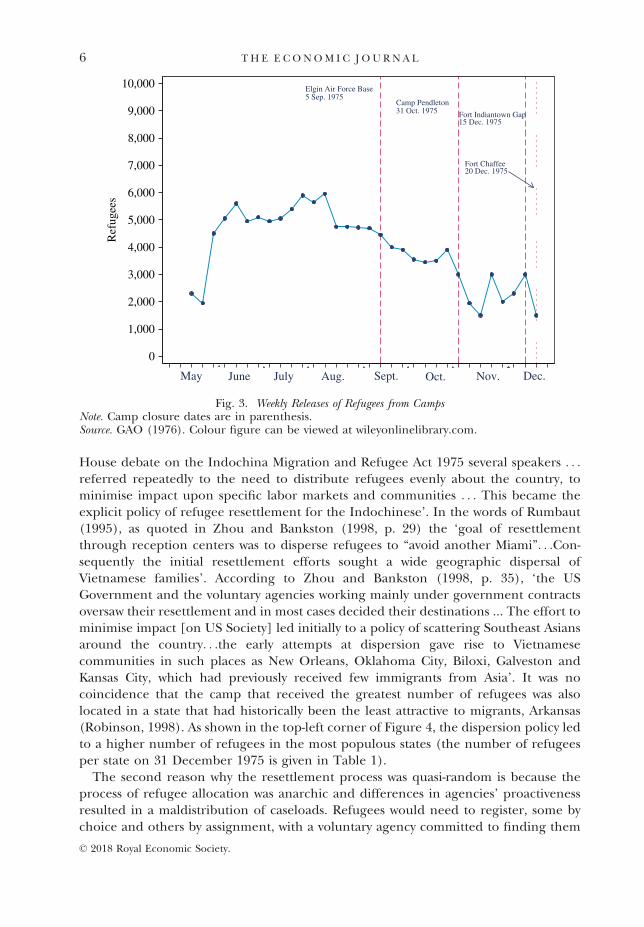
The programme of refugee resettlement began under emergency conditions andwas carried out hurriedly. Due to its unprecedented scale and urgency, citizens,churches and employers across the US were urged to sponsor refugees (Sonnebornand Johnston, 2007). Over a 32-week period, from 11 May to 20 December 1975, onaverage 4,000 Vietnamese refugees were released from the refugee programme eachweek (Figure 3). By 20 December 1975, 130,000 refugees had been resettled in the US.The 1975 resettlement process culminated in an exogenous distribution of Vietnameseacross the US, uncorrelated with immigrants’ choices and economic opportunitiesrelated to trade with Vietnam.
There are two main reasons why we argue this distribution is quasi-random. The firstis that the refugees were dispersed throughout the US as policy makers, drawing on thelesson from the agglomeration of Cubans in Miami, were keen to avoid a similarconcentration of Vietnamese refugees.4 Haines (1996, p. 351) writes that ‘During
2 According to the UNHCR, over 250,000 refugees died on the open sea ‘as a result of storms, illness andstarvation, as well as kidnappings and killings by pirates’ (US House, 2010, p. 2).
3 Since World War II, refugees in the US have been resettled by voluntary agencies, for example, thosefrom Hungary (1956) and Cuba (1960). The Indochinese were no exception as ‘expertise and experiencewere needed, since the US had never before experienced the arrival of so many refugees in so short a time’(GAO, 1977, p. 5).
4 Card (1990) analyses the labour market effect of the Mariel Boatlift of 1980, when around 125,000Cubans settled in Miami and finds little evidence of immigration affecting unemployment or wages.
© 2018 Royal Economic Society.
M I G R A N T N E TWOR K S A N D T R A D E 5
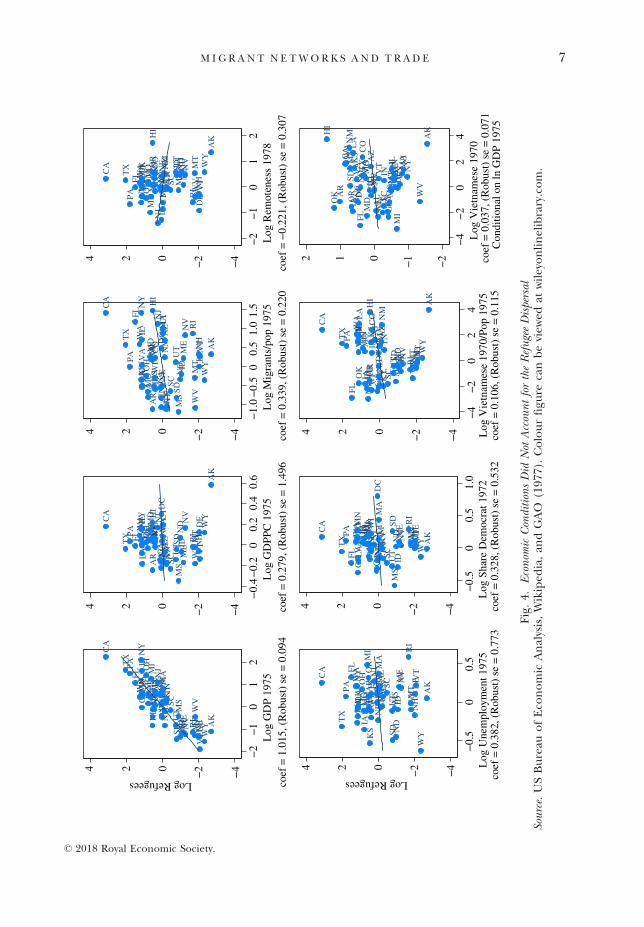
House debate on the Indochina Migration and Refugee Act 1975 several speakers . . .referred repeatedly to the need to distribute refugees evenly about the country, tominimise impact upon specific labor markets and communities . . . This became theexplicit policy of refugee resettlement for the Indochinese’. In the words of Rumbaut(1995), as quoted in Zhou and Bankston (1998, p. 29) the ‘goal of resettlementthrough reception centers was to disperse refugees to “avoid another Miami”. . .Con-sequently the initial resettlement efforts sought a wide geographic dispersal ofVietnamese families’. According to Zhou and Bankston (1998, p. 35), ‘the USGovernment and the voluntary agencies working mainly under government contractsoversaw their resettlement and in most cases decided their destinations ... The effort tominimise impact [on US Society] led initially to a policy of scattering Southeast Asiansaround the country. . .the early attempts at dispersion gave rise to Vietnamesecommunities in such places as New Orleans, Oklahoma City, Biloxi, Galveston andKansas City, which had previously received few immigrants from Asia’. It was nocoincidence that the camp that received the greatest number of refugees was alsolocated in a state that had historically been the least attractive to migrants, Arkansas(Robinson, 1998). As shown in the top-left corner of Figure 4, the dispersion policy ledto a higher number of refugees in the most populous states (the number of refugeesper state on 31 December 1975 is given in Table 1).
The second reason why the resettlement process was quasi-random is because theprocess of refugee allocation was anarchic and differences in agencies’ proactivenessresulted in a maldistribution of caseloads. Refugees would need to register, some bychoice and others by assignment, with a voluntary agency committed to finding them
Elgin Air Force Base5 Sep. 1975
Camp Pendleton31 Oct. 1975 Fort Indiantown Gap
15 Dec. 1975
Fort Chaffee20 Dec. 1975
0
1,000
2,000
3,000
4,000
5,000
6,000
7,000
8,000
9,000
10,000
Ref
ugee
s
May June July Aug. Sept. Oct. Nov. Dec.
Fig. 3. Weekly Releases of Refugees from CampsNote. Camp closure dates are in parenthesis.Source. GAO (1976). Colour figure can be viewed at wileyonlinelibrary.com.
© 2018 Royal Economic Society.
6 T H E E CONOM I C J O U RN A L
VT W
Y
SD NH
ND
DE
MT
NV
ID ME
RI
AKN
M
HI
UTN
EA
R
WV
MS
DC AZ
SCOR
KSOK CO AL
IA KY
CT TNW
AM
DM
NL
A GA
WI
MO
VA
NC
IN MAFL N
JMIOHPA ILTX N
YCA
−4
−2024
Log Refugees
−2
−1
01
2L
og G
DP
1975
coef
= 1
.015
, (R
obus
t) s
e =
0.0
94
MSA
R
SCAL KY
LA
WV
ME
TN
NC
NMGA
UT
VTO
K
AZ
ID NHSDTX
MO
MT
IN RI
FL VA WI
OH
NE
PA OR
KS
IAMN
MI
CO ND
MA
WA
WY
DEMD
NY
IL NV
NJ
CA CTHI D
C
AK
−4
−2024
−0.
4−
0.2
00.
20.
40.
6L
og G
DPP
C 1
975
coef
= 0
.279
, (R
obus
t) s
e =
1.4
96
MS
AR
KY
WV
AL
TNN
C
SDIAM
O
SCIN GA
OK
KS
NE
LA W
Y
MN
NDWI
MT
OH ID
PA DE
VA UTOR
MI
ME
CO
NM
MD
VT AK
NHD
CTX
WA AZ
IL NV RI
MACTN
JFL
CA
NY HI
−4
−2024
−1.
0−
0.5
00.
51.
01.
5L
og M
igra
nts/
pop
1975
coef
= 0
.339
, (R
obus
t) s
e =
0.2
20
NJ DCM
D
DE
CTPA N
Y
MA
RIOH
WV
MI
VA
LA
VTNHIN NC
MS
SCKY
AL
GA
TN
FL IL WI
AR
ME
MO
WA
MN
IATX OK
CA KS NE
SD ND
NV
NM
AZ
CO
MT
OR
UT
WY
ID
AKH
I
−4
−2024
−2
−1
01
2L
og R
emot
enes
s 19
78co
ef =
−0.
221,
(R
obus
t) s
e =
0.3
07
WYK
S SD NDIAT
X MN
NECOVA
NHM
DM
O
UT
WI
ID WV
IL MS
HI
NM
OK
KY
LA DC
MT
AL AKAR
PA TN DE
GA
IN NC
SCCT
OH NV
ME
AZ
NY
WA
VTCA NJOR
FL MAM
I RI
−4
−2024
Log Refugees
−0.
50
0.5
Log
Une
mpl
oym
ent 1
975
coef
= 0
.382
, (R
obus
t) s
e =
0.7
73
MS
OK GA AL
IDUTFL SCLA NC
KS
NE
TNVA
AZ
WY
ARTX
INCO
AK
KY
NHND
NV
WV
VT
NM
NJ
MD
HI
MO
MT
OH
ME
WA
PA DECT
IAILNY
CA
MI
OR WI
SDMN
RIM
AD
C
−4
−2024
−0.
50
0.5
1.0
Log
Sha
re D
emoc
rat 1
972
coef
= 0
.328
, (R
obus
t) s
e =
0.5
32
MI
FL
GA
WI
MD
AL
KY
CTIA SCOK MS
OR
AR WV
NE UT ME
RIID NH
MT
DC
SD ND
NV
DE VT W
YNC
INVA
MO
TNOHPA MA
TX NY
KS
AZ
MN
NJILW
A CO
CA N
M
LA
HI AK
−4
−2024
−4
−2
02
4L
og V
ietn
ames
e 19
70/P
op 1
975
coef
= 0
.106
, (R
obus
t) s
e =
0.1
15
MIFL
WI
GA
MD CT
KY
IA ALOK
OR
SCDC
MS
WV
AR
NE U
T RI
ME
ID NV
MT
DE
ND
NHSD W
YIN NC
VA
VT
MO
OH NY
PATX
TN MA NJ
ILMN
KS AZCA
WA COLAN
M AKH
I
−2
−1012
−4
−2
02
4L
og V
ietn
ames
e 19
70co
ef =
0.0
37, (
Rob
ust)
se
= 0
.071
Con
ditio
nal o
n ln
GD
P 19
75
Fig.4.
Econom
icConditionsDid
Not
AccountfortheRefugeeDispersal
Source.USBureau
ofEco
nomic
Analysis,Wikiped
ia,an
dGAO
(197
7).Colourfigu
recanbeview
edat
wileyonlinelibrary.com.
© 2018 Royal Economic Society.
M I G R A N T N E TWOR K S A N D T R A D E 7
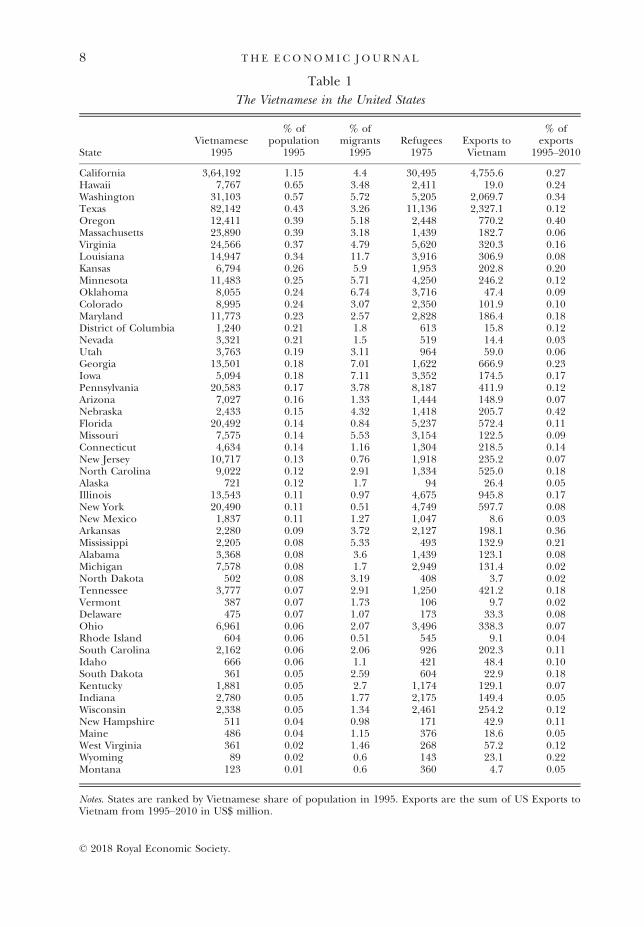
Table 1
The Vietnamese in the United States
StateVietnamese
1995
% ofpopulation
1995
% ofmigrants1995
Refugees1975
Exports toVietnam
% ofexports
1995–2010
California 3,64,192 1.15 4.4 30,495 4,755.6 0.27Hawaii 7,767 0.65 3.48 2,411 19.0 0.24Washington 31,103 0.57 5.72 5,205 2,069.7 0.34Texas 82,142 0.43 3.26 11,136 2,327.1 0.12Oregon 12,411 0.39 5.18 2,448 770.2 0.40Massachusetts 23,890 0.39 3.18 1,439 182.7 0.06Virginia 24,566 0.37 4.79 5,620 320.3 0.16Louisiana 14,947 0.34 11.7 3,916 306.9 0.08Kansas 6,794 0.26 5.9 1,953 202.8 0.20Minnesota 11,483 0.25 5.71 4,250 246.2 0.12Oklahoma 8,055 0.24 6.74 3,716 47.4 0.09Colorado 8,995 0.24 3.07 2,350 101.9 0.10Maryland 11,773 0.23 2.57 2,828 186.4 0.18District of Columbia 1,240 0.21 1.8 613 15.8 0.12Nevada 3,321 0.21 1.5 519 14.4 0.03Utah 3,763 0.19 3.11 964 59.0 0.06Georgia 13,501 0.18 7.01 1,622 666.9 0.23Iowa 5,094 0.18 7.11 3,352 174.5 0.17Pennsylvania 20,583 0.17 3.78 8,187 411.9 0.12Arizona 7,027 0.16 1.33 1,444 148.9 0.07Nebraska 2,433 0.15 4.32 1,418 205.7 0.42Florida 20,492 0.14 0.84 5,237 572.4 0.11Missouri 7,575 0.14 5.53 3,154 122.5 0.09Connecticut 4,634 0.14 1.16 1,304 218.5 0.14New Jersey 10,717 0.13 0.76 1,918 235.2 0.07North Carolina 9,022 0.12 2.91 1,334 525.0 0.18Alaska 721 0.12 1.7 94 26.4 0.05Illinois 13,543 0.11 0.97 4,675 945.8 0.17New York 20,490 0.11 0.51 4,749 597.7 0.08New Mexico 1,837 0.11 1.27 1,047 8.6 0.03Arkansas 2,280 0.09 3.72 2,127 198.1 0.36Mississippi 2,205 0.08 5.33 493 132.9 0.21Alabama 3,368 0.08 3.6 1,439 123.1 0.08Michigan 7,578 0.08 1.7 2,949 131.4 0.02North Dakota 502 0.08 3.19 408 3.7 0.02Tennessee 3,777 0.07 2.91 1,250 421.2 0.18Vermont 387 0.07 1.73 106 9.7 0.02Delaware 475 0.07 1.07 173 33.3 0.08Ohio 6,961 0.06 2.07 3,496 338.3 0.07Rhode Island 604 0.06 0.51 545 9.1 0.04South Carolina 2,162 0.06 2.06 926 202.3 0.11Idaho 666 0.06 1.1 421 48.4 0.10South Dakota 361 0.05 2.59 604 22.9 0.18Kentucky 1,881 0.05 2.7 1,174 129.1 0.07Indiana 2,780 0.05 1.77 2,175 149.4 0.05Wisconsin 2,338 0.05 1.34 2,461 254.2 0.12New Hampshire 511 0.04 0.98 171 42.9 0.11Maine 486 0.04 1.15 376 18.6 0.05West Virginia 361 0.02 1.46 268 57.2 0.12Wyoming 89 0.02 0.6 143 23.1 0.22Montana 123 0.01 0.6 360 4.7 0.05
Notes. States are ranked by Vietnamese share of population in 1995. Exports are the sum of US Exports toVietnam from 1995–2010 in US$ million.
© 2018 Royal Economic Society.
8 T H E E CONOM I C J O U RN A L
(and their families) a sponsor.5 In theory, the matching process ‘consisted of reviewingthe refugees’ occupational background against a Department of Labor’s listing oflabour markets needing additional workers, comparing refugees’ preferences for placeof resettlement against the agency’s opportunities, and assigning the refugees to asponsor in the chosen locality’ (Baker et al., 1984, p. 47). Thompson (2010, p. 84)provides examples of some adverts for workers published in the camp newspaper fromIndiantown Gap: ‘Workers for greenhouses in Maryland and North Carolina. Freehousing, food, assistance, and wages or ‘Two fisherman needed for job in Florida.Position pays $2.10 per hour with sponsorship. Housing to be provided in new housetrailer plus farm animals and garden. Should be able to sex-sort and count fish’.Despite this hypothesised process, the reality on the ground was very different, suchthat nearly three-quarters of the sponsors chosen were either families or individuals asopposed to firms offering jobs (Marsh, 1980).
Thompson (2010) writes that Washington put tremendous pressure on the agencies,emphasising the need for ‘expeditious processing’. He quotes the Department ofHealth, Education and Welfare Director, who noted that ‘Everyone worked 12-hourshifts, 7 days a week, and it was not uncommon to work 15 or 16 hours at a time’(Thompson, 2010, p. 81). Never before had the responsible agencies been required toresettle such unprecedented numbers in such a short space of time. The chaos thatensued in the camps led to confusion among the refugees with regard to which agencyto sign-up with. The signing-up in large part was a function of how proactive agencyemployees were. In Fort Chaffee for example, two agencies registered about 75% of therefugees and other agencies complained of a maldistribution of caseloads (Thompson,2010). Robinson (1998, p. 131) cites a voluntary agency worker at the time as saying‘Nobody quite knew who was doing what. Most of what we were doing wasmatchmaking. . .We felt we were competing with one another to get people out ofthere’.
The organisations responsible for dispersing the Vietnamese had sponsors in specificlocations across the United States. The matching with relocation agencies therefore inpart determined the destination of many of the refugees. Since religious organisationsresettled the vast majority of the refugees (in particular the Catholic Conference(59,901), the Church World Service (18,126) and the Lutheran Immigration andRefugee Service (17,051)), many of the refugees were assigned a state on the basis ofthe location of parishes or dioceses. In the words of Thompson (2010, p. 85), ‘TheLutheran church was strongest in the upper Midwest and resettled many refugees inMinnesota and neighbouring states – and to this day Minnesota is home to manyIndochinese despite its bone-chilling winters’. Moreover, ‘the religiousVOLAGs. . .were less tied to specific job offers in settling refugees. A parish or churchoften sponsored their clients without a commitment on the part of the refugee toaccept a particular job’ (Thompson, 2010, p. 85). This explains why only around 25%of the sponsors chosen were firms offering jobs (Marsh, 1980).
5 In the first months of the programme refugees could turn down offers of sponsorship. As noted byThompson (2010), of the 1,213 offers recorded at Indiantown Gap by the Sponsorship Coordination Center,759 were eventually accepted. From October 1975 onwards, the US government made it almost impossiblefor a refugee to refuse an offer of sponsorship.
© 2018 Royal Economic Society.
M I G R A N T N E TWOR K S A N D T R A D E 9
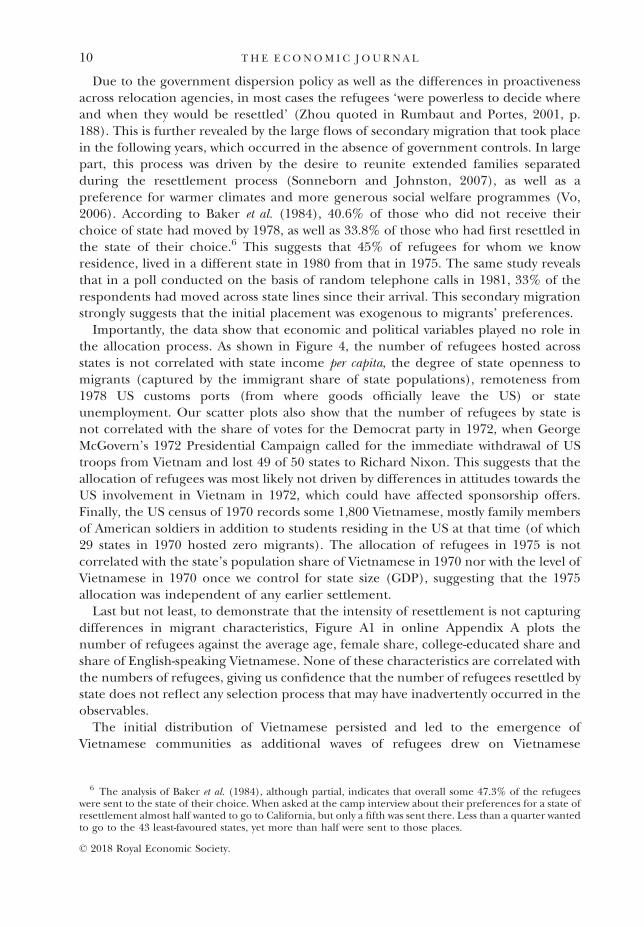
Due to the government dispersion policy as well as the differences in proactivenessacross relocation agencies, in most cases the refugees ‘were powerless to decide whereand when they would be resettled’ (Zhou quoted in Rumbaut and Portes, 2001, p.188). This is further revealed by the large flows of secondary migration that took placein the following years, which occurred in the absence of government controls. In largepart, this process was driven by the desire to reunite extended families separatedduring the resettlement process (Sonneborn and Johnston, 2007), as well as apreference for warmer climates and more generous social welfare programmes (Vo,2006). According to Baker et al. (1984), 40.6% of those who did not receive theirchoice of state had moved by 1978, as well as 33.8% of those who had first resettled inthe state of their choice.6 This suggests that 45% of refugees for whom we knowresidence, lived in a different state in 1980 from that in 1975. The same study revealsthat in a poll conducted on the basis of random telephone calls in 1981, 33% of therespondents had moved across state lines since their arrival. This secondary migrationstrongly suggests that the initial placement was exogenous to migrants’ preferences.
Importantly, the data show that economic and political variables played no role inthe allocation process. As shown in Figure 4, the number of refugees hosted acrossstates is not correlated with state income per capita, the degree of state openness tomigrants (captured by the immigrant share of state populations), remoteness from1978 US customs ports (from where goods officially leave the US) or stateunemployment. Our scatter plots also show that the number of refugees by state isnot correlated with the share of votes for the Democrat party in 1972, when GeorgeMcGovern’s 1972 Presidential Campaign called for the immediate withdrawal of UStroops from Vietnam and lost 49 of 50 states to Richard Nixon. This suggests that theallocation of refugees was most likely not driven by differences in attitudes towards theUS involvement in Vietnam in 1972, which could have affected sponsorship offers.Finally, the US census of 1970 records some 1,800 Vietnamese, mostly family membersof American soldiers in addition to students residing in the US at that time (of which29 states in 1970 hosted zero migrants). The allocation of refugees in 1975 is notcorrelated with the state’s population share of Vietnamese in 1970 nor with the level ofVietnamese in 1970 once we control for state size (GDP), suggesting that the 1975allocation was independent of any earlier settlement.
Last but not least, to demonstrate that the intensity of resettlement is not capturingdifferences in migrant characteristics, Figure A1 in online Appendix A plots thenumber of refugees against the average age, female share, college-educated share andshare of English-speaking Vietnamese. None of these characteristics are correlated withthe numbers of refugees, giving us confidence that the number of refugees resettled bystate does not reflect any selection process that may have inadvertently occurred in theobservables.
The initial distribution of Vietnamese persisted and led to the emergence ofVietnamese communities as additional waves of refugees drew on Vietnamese
6 The analysis of Baker et al. (1984), although partial, indicates that overall some 47.3% of the refugeeswere sent to the state of their choice. When asked at the camp interview about their preferences for a state ofresettlement almost half wanted to go to California, but only a fifth was sent there. Less than a quarter wantedto go to the 43 least-favoured states, yet more than half were sent to those places.
© 2018 Royal Economic Society.
10 T H E E CONOM I C J O U RN A L
networks. As shown in Figure 1, the exodus of the Vietnamese to the US consisted ofthree distinct waves; the initial wave following the Fall of Saigon, the second thatoccurred at the time of the December 1978 Sino-Vietnamese war – which precipitatedthe persecution of the ethnic-Chinese population in Vietnam – and the third thatcoincided with the 1988 Amerasian Home Coming Act and the 1989 HumanitarianOperation Program.7 From 1980 onwards, hundreds of thousands were accepted thathad previously lived in Southeast Asian refugee camps.
Whereas the US Government facilitated movements of Vietnamese Boat People tothe US, their stance towards the movement of goods between the two nations wasquite the reverse. Under the auspices of the 1917 Trading with the Enemy Act andthe 1969 Export Administration Act and following the military conquest of Saigonin 1975 by the Communist North, the US widened trade sanctions from its previousfocus on the North of Vietnam, which had been in place since 1964, henceimposing a trade embargo on the entire country. On 3 February 1994, PresidentClinton lifted the trade embargo at a time of increased lobbying by private domesticfirms who were reported by the Los Angeles Times to be ‘champing at the bit’ to dobusiness in Vietnam.8 The quasi-randomly allocated first-wave of Vietnameserefugees, in tandem with the lasting trade embargo constitute an ideal naturalexperiment with which to establish a causal effect of Vietnamese migrant networkson US exports to Vietnam.
2. Data and Empirical Strategy
As detailed in the previous Section, the 1975 distribution of Vietnamese refugees wasquasi-random and constitutes an ideal instrumental variable with which to establish acausal effect of Vietnamese migrant networks on US exports to Vietnam. Theenduring trade embargo sharpens our natural experiment as the sequence of events,from the exogenous migrant shock to the opening-up of trade, closely mimics anexperimental setting and removes concerns of reverse causality. Nevertheless, it isstrictly the exogenous initial allocation of Vietnamese that matters for ouridentification.
7 The US Government passed several important pieces of legislation to facilitate the arrival of theVietnamese. The 1979 Orderly Departure Program allowed Vietnamese to legally emigrate on the basis offamily reunion and on humanitarian grounds and estimates suggest that by the mid-1990s over two hundredthousand Vietnamese had entered the US under the Program. In 1980, the US Congress passed the RefugeeAct – the most comprehensive piece of refugee legislation in US history – into law, which revised theprovision of the 1965 Hart-Celler Act that previously admitted refugees into the US in limited proportionsrelative to the overall number of immigrants. The Amerasian Homecoming Act was passed in the US in 1988to bring as many Amerasians to the US as possible. The final important piece of legislation passed by the USCongress to aid the Vietnamese was the 1989 Humanitarian Operation Program. In that year, the US andVietnamese Governments agreed for former and current detainees in ‘re-education camps’ to be allowed todepart for the US, the ultimate consequence of which was the arrival of a further 70,000 Vietnamese.
8 See: http://articles.latimes.com/1994-02-04/business/fi-19060_1_trade-embargo. Relations between thetwo nations improved following a sustained effort by the Hanoi Government to assist US forensic teams locateand identify over 2,000 US service personnel that were still listed as missing in action at that time. Anormalisation of diplomatic relations ensued in 1995, with the upgrading of the liaison offices to full embassystatus.
© 2018 Royal Economic Society.
M I G R A N T N E TWOR K S A N D T R A D E 11
Random allocations of refugees have been used for identification purposes inprevious studies. For example: in Sweden by Edin et al. (2003) who estimate thecausal effect of immigration on labour market outcomes, by Dahlberg et al. (2012)to estimate the effect of ethnic diversity on redistribution preferences and, in aslightly different approach, by Damm and Dustmann (2014) who investigate theeffect of exposure to crime on criminal behaviour across Danish neighbourhoods.Our study is the first to use such an allocation to establish a trade-creation effect ofmigrants.9
We use the exogenous allocation of Vietnamese refugees in 1975 as an instrumentfor the stock of Vietnamese migrants across US states in 1995, the first (full) year inwhich the US exported to Vietnam. The 1975 refugee location data are obtainedfrom a US General Accounting Office Report to Congress (GAO, 1977). It providesthe number of refugees resettled by state as of 31 December 1975, just eleven daysafter the last camp closure. Migration data for the year 1995 are taken from the 2000US Census, from the question that asks respondents their place of residence fiveyears hence. In other words, we only include in estimation those migrants in 1995that remained in the US up until the year 2000. These anonymous micro data wereobtained from the The Integrated Public Use Microdata Series (Ruggles et al.,2010).10
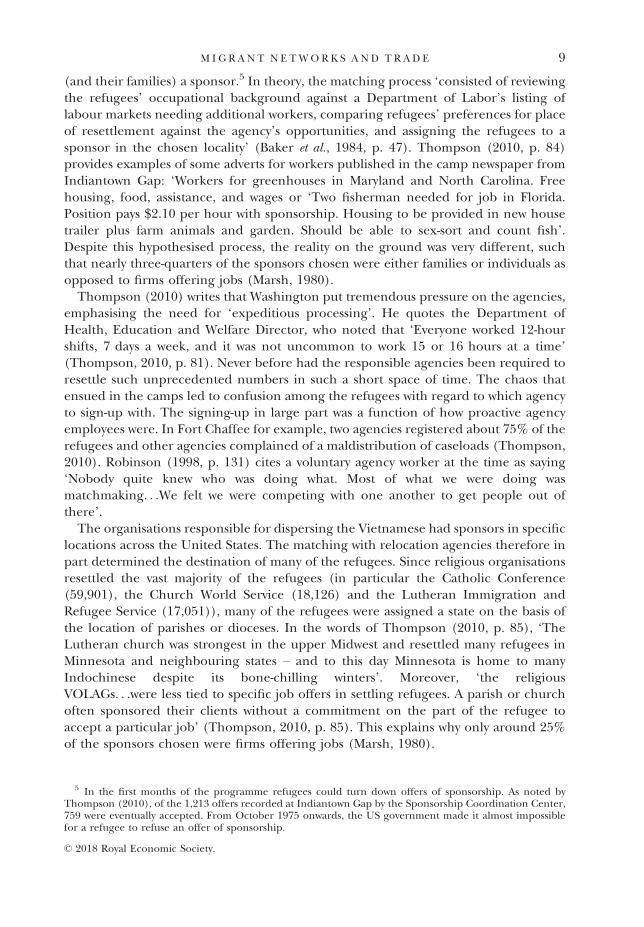
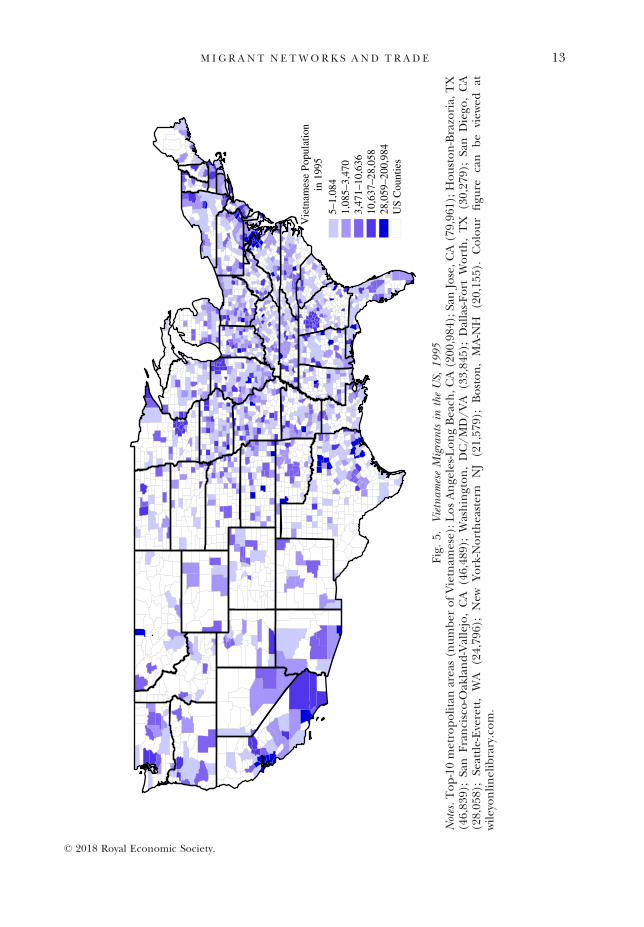
Figure 5 shows the concentrations of Vietnamese across US states in 1995.11 The topten metropolitan areas are listed below Figure 5. Although agglomeration occurred,most notably in California and Texas, the Figure shows the wide dispersion ofVietnamese across the country. It is important to emphasise that many populous citiesdo not feature prominently in Figure 5, for example, San Antonio, Jacksonville,Indianapolis and Columbus. Importantly, as shown in Figure 2, the distribution ofVietnamese in 1995 was in large part determined by the initial allocation of refugees in1975. The correlation between the two data series is 0.98, such that our instrument isstrong. (See our online Appendix A for first-stage results confirming the validity of ourinstrument (Table A3).)
Our baseline cross-section regressions take the following form:
Xi ¼ b0 þ b1Vi þ b2Ci þ �i : (1)
Here Vi is the stock of Vietnamese migrants in 1995, Xi are the exports of state i toVietnam in 1995 and Ci is a set of control variables. We include income per capita – asricher states more likely export more differentiated products to Vietnam – and totalstate exports and state GDP to control for state openness and state size respectively.Our baseline model also includes a variable capturing manufacturing as a percentage
9 Ongoing work by Cohen et al. (2012) uses the formation of World War II Japanese Internment Camps asan instrument to identify the impact of Japanese migrants on US exports to Japan. A particular advantage ofthe current study is the concurrent trade embargo.
10 Our analysis can only be conducted at the state level since more disaggregated data for our instrumentare unavailable.
11 The Figure is constructed by applying the data for Vietnamese immigrants in 1995 from the US Censusof 2000 available at the metropolitan statistical area (MSA) to the corresponding map defined at the countylevel, such that all counties that constitute the same MSA will be defined as being host to the same number ofimmigrants.
© 2018 Royal Economic Society.
12 T H E E CONOM I C J O U RN A L
Vie
tnam
ese
Popu
latio
nin
199
55–
1,08
41,
085–
3,47
03,
471–
10,6
3610
,637
–28,
058
28,0
59–2
00,9
84U
S C
ount
ies
Fig.5.
Vietnam
eseMigrantsin
theUS,
1995
Notes.Top-10metropolitanareas(n
umber
ofVietnam
ese):LosAnge
les-LongBeach
,CA(200
,984
);SanJose,CA(79,96
1);Houston-Brazoria,
TX
(46,83
9);San
Francisco-O
akland-Vallejo,CA
(46,48
9);Washington,DC/MD/VA
(33,84
5);Dallas-Fort
Worth,TX
(30,27
9);San
Diego
,CA
(28,05
8);Se
attle-Everett,WA
(24,79
6);New
York-Northeastern
NJ(21,57
9);Boston,MA-NH
(20,15
5).Colourfigu
recan
be
view
edat
wileyonlinelibrary.com.
© 2018 Royal Economic Society.
M I G R A N T N E TWOR K S A N D T R A D E 13
of state GDP to account for the economic structure of US states as well as East and Westcoast dummy variables that aim to capture the states’ various transport costs forexporting to Vietnam. The bs are parameters to be estimated and �i is the error term(we take the logarithms of continuous variables). We instrument Vi with the stock ofrefugees in 1975.
In light of the seminal paper by Silva and Tenreyro (2006), we use an IV version of aPseudo-Poisson maximum likelihood estimator (PPML), as in Tenreyro (2007). Theuse of this estimator ensures consistent estimates of elasticities in log linear models incases where the log of the error term may not be independent of the regressors. Its useis now widespread in the estimation of gravity equations in international trade, asdiscussed in detail in Head and Mayer (2014). An additional benefit of this estimator isthat unlike log linear models it can be estimated even when the dependent variable isequal to zero.12
Trade data are from the Foreign Trade Division of the US Census Bureau. Exportsare disaggregated into 28 product categories, according to the 3-digit NAICS (NorthAmerican Industry Classification System) from 2002 to 2010 and the 2-digit SIC(Standard Industrial Classification) from 1995 to 2001 (see online Appendix Table A1for the concordance and classification into differentiated or homogenous goods). Themain US exports to Vietnam over the period (in absolute terms) were transportequipment and food and kindred products, while leather and forest products areimportant in relative terms (see online Appendix Table A1). The data for our othercontrol variables are taken from the US Bureau of Economic Analysis. Summarystatistics are provided in online Appendix Table A2.
3. Results
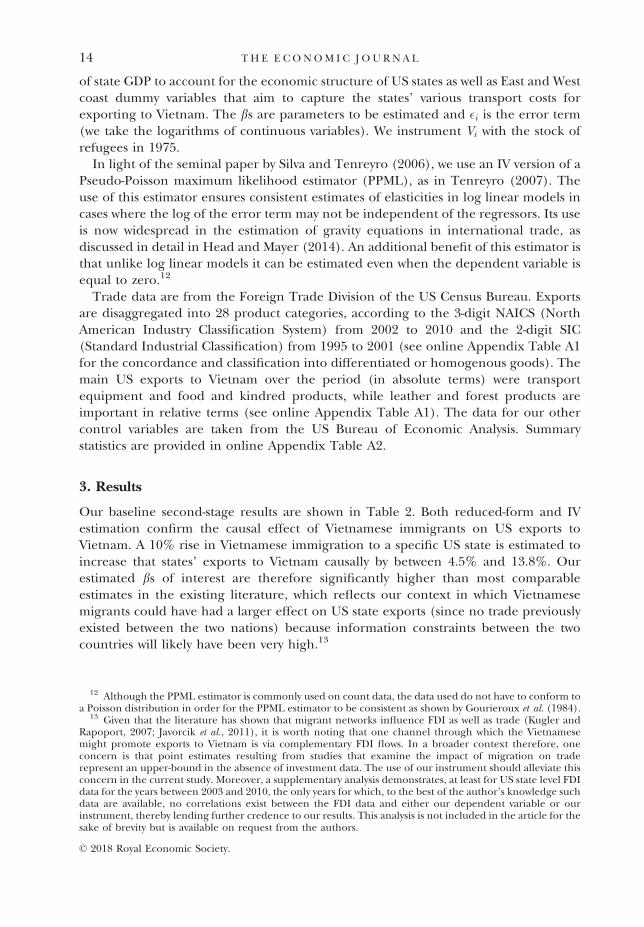
Our baseline second-stage results are shown in Table 2. Both reduced-form and IVestimation confirm the causal effect of Vietnamese immigrants on US exports toVietnam. A 10% rise in Vietnamese immigration to a specific US state is estimated toincrease that states’ exports to Vietnam causally by between 4.5% and 13.8%. Ourestimated bs of interest are therefore significantly higher than most comparableestimates in the existing literature, which reflects our context in which Vietnamesemigrants could have had a larger effect on US state exports (since no trade previouslyexisted between the two nations) because information constraints between the twocountries will likely have been very high.13
12 Although the PPML estimator is commonly used on count data, the data used do not have to conform toa Poisson distribution in order for the PPML estimator to be consistent as shown by Gourieroux et al. (1984).
13 Given that the literature has shown that migrant networks influence FDI as well as trade (Kugler andRapoport, 2007; Javorcik et al., 2011), it is worth noting that one channel through which the Vietnamesemight promote exports to Vietnam is via complementary FDI flows. In a broader context therefore, oneconcern is that point estimates resulting from studies that examine the impact of migration on traderepresent an upper-bound in the absence of investment data. The use of our instrument should alleviate thisconcern in the current study. Moreover, a supplementary analysis demonstrates, at least for US state level FDIdata for the years between 2003 and 2010, the only years for which, to the best of the author’s knowledge suchdata are available, no correlations exist between the FDI data and either our dependent variable or ourinstrument, thereby lending further credence to our results. This analysis is not included in the article for thesake of brevity but is available on request from the authors.
© 2018 Royal Economic Society.
14 T H E E CONOM I C J O U RN A L
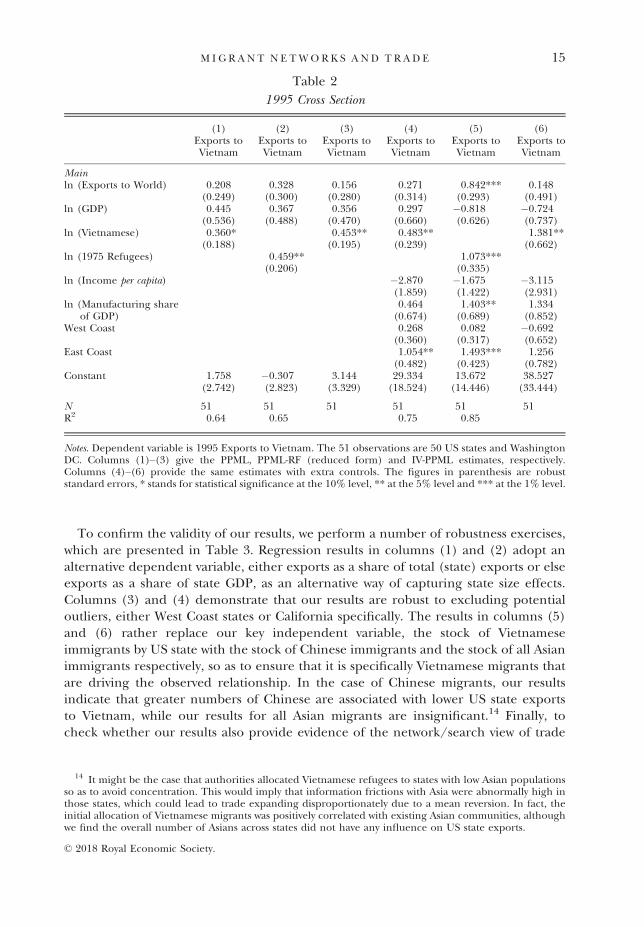
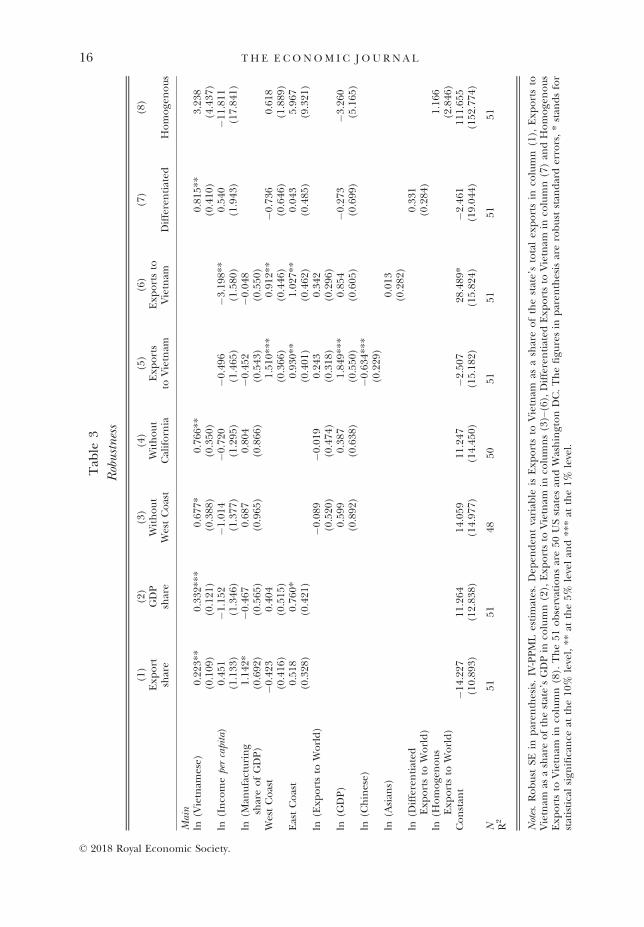
To confirm the validity of our results, we perform a number of robustness exercises,which are presented in Table 3. Regression results in columns (1) and (2) adopt analternative dependent variable, either exports as a share of total (state) exports or elseexports as a share of state GDP, as an alternative way of capturing state size effects.Columns (3) and (4) demonstrate that our results are robust to excluding potentialoutliers, either West Coast states or California specifically. The results in columns (5)and (6) rather replace our key independent variable, the stock of Vietnameseimmigrants by US state with the stock of Chinese immigrants and the stock of all Asianimmigrants respectively, so as to ensure that it is specifically Vietnamese migrants thatare driving the observed relationship. In the case of Chinese migrants, our resultsindicate that greater numbers of Chinese are associated with lower US state exportsto Vietnam, while our results for all Asian migrants are insignificant.14 Finally, tocheck whether our results also provide evidence of the network/search view of trade
Table 2
1995 Cross Section
(1) (2) (3) (4) (5) (6)Exports toVietnam
Exports toVietnam
Exports toVietnam
Exports toVietnam
Exports toVietnam
Exports toVietnam
Mainln (Exports to World) 0.208 0.328 0.156 0.271 0.842*** 0.148
(0.249) (0.300) (0.280) (0.314) (0.293) (0.491)ln (GDP) 0.445 0.367 0.356 0.297 �0.818 �0.724
(0.536) (0.488) (0.470) (0.660) (0.626) (0.737)ln (Vietnamese) 0.360* 0.453** 0.483** 1.381**
(0.188) (0.195) (0.239) (0.662)ln (1975 Refugees) 0.459** 1.073***
(0.206) (0.335)ln (Income per capita) �2.870 �1.675 �3.115
(1.859) (1.422) (2.931)ln (Manufacturing share
of GDP)0.464 1.403** 1.334(0.674) (0.689) (0.852)
West Coast 0.268 0.082 �0.692(0.360) (0.317) (0.652)
East Coast 1.054** 1.493*** 1.256(0.482) (0.423) (0.782)
Constant 1.758 �0.307 3.144 29.334 13.672 38.527(2.742) (2.823) (3.329) (18.524) (14.446) (33.444)
N 51 51 51 51 51 51R2 0.64 0.65 0.75 0.85
Notes. Dependent variable is 1995 Exports to Vietnam. The 51 observations are 50 US states and WashingtonDC. Columns (1)–(3) give the PPML, PPML-RF (reduced form) and IV-PPML estimates, respectively.Columns (4)–(6) provide the same estimates with extra controls. The figures in parenthesis are robuststandard errors, * stands for statistical significance at the 10% level, ** at the 5% level and *** at the 1% level.
14 It might be the case that authorities allocated Vietnamese refugees to states with low Asian populationsso as to avoid concentration. This would imply that information frictions with Asia were abnormally high inthose states, which could lead to trade expanding disproportionately due to a mean reversion. In fact, theinitial allocation of Vietnamese migrants was positively correlated with existing Asian communities, althoughwe find the overall number of Asians across states did not have any influence on US state exports.
© 2018 Royal Economic Society.
M I G R A N T N E TWOR K S A N D T R A D E 15
Tab
le3
Robustness
(1)
(2)
(3)
(4)
(5)
(6)
(7)
(8)
Exp
ort
share
GDP
share
Without
WestCoast
Without
California
Exp
orts
toVietnam
Exp
ortsto
Vietnam
Differentiated
Homoge
nous
Main
ln(V
ietnam
ese)
0.22
3**
0.33
2***
0.67
7*0.76
6**
0.81
5**
3.23
8(0.109
)(0.121
)(0.388
)(0.350
)(0.410
)(4.437
)ln
(Inco
mepercapita)
0.45
1�1
.152
�1.014
�0.720
�0.496
�3.198
**0.54
0�1
1.81
1(1.133
)(1.346
)(1.377
)(1.295
)(1.465
)(1.580
)(1.943
)(17.84
1)ln
(Man
ufacturing
shareofGDP)
1.14
2*�0
.467
0.68
70.80
4�0
.452
�0.048
(0.692
)(0.565
)(0.965
)(0.866
)(0.543
)(0.550
)WestCoast
�0.423
0.40
41.51
0***
0.91
2**
�0.736
0.61
8(0.416
)(0.515
)(0.366
)(0.446
)(0.646
)(1.889
)EastCoast
0.51
80.76
0*0.93
0**
1.02
7**
0.04
35.96
7(0.328
)(0.421
)(0.401
)(0.462
)(0.485
)(9.321
)ln
(Exp
ortsto
World)
�0.089
�0.019
0.24
30.34
2(0.520
)(0.474
)(0.318
)(0.296
)ln
(GDP)
0.59
90.38
71.84
9***
0.85
4�0
.273
�3.260
(0.892
)(0.638
)(0.550
)(0.605
)(0.699
)(5.165
)ln
(Chinese)
�0.634
***
(0.229
)ln
(Asian
s)0.01
3(0.282
)ln
(Differentiated
Exp
ortsto
World)
0.33
1(0.284
)ln
(Homoge
nous
Exp
ortsto
World)
1.16
6(2.846
)Constan
t�1
4.22
711
.264
14.059
11.247
�2.507
28.489
*�2
.461
111.65
5(10.89
3)(12.83
8)(14.97
7)(14.45
0)(15.18
2)(15.82
4)(19.04
4)(152
.774
)
N51
5148
5051
5151
51R2
Notes.Robust
SEin
paren
thesis.IV-PPML
estimates.Dep
enden
tvariab
leis
Exp
ortsto
Vietnam
asashareofthestate’stotalex
portsin
column(1),
Exp
ortsto
Vietnam
asashareofthestate’sGDPin
column(2),Exp
ortsto
Vietnam
inco
lumns(3)–(6),Differentiated
Exp
ortsto
Vietnam
inco
lumn(7)an
dHomoge
nous
Exp
ortsto
Vietnam
inco
lumn(8).
The51
observationsare50
USstates
andWashingtonDC.Thefigu
resin
paren
thesisarerobust
stan
darderrors,*stan
dsfor
statisticalsign
ificance
atthe10
%level,**
atthe5%
levelan
d***at
the1%
level.
© 2018 Royal Economic Society.
16 T H E E CONOM I C J O U RN A L
(Rauch, 1996, 2001), we follow Rauch and Trindade (2002) and run our baselineregression dividing exports into differentiated goods and homogenous goods, whichwe define as both reference-price goods and organised-market goods (see onlineAppendix Table A1 for the matching of NAICS code to Rauch categories). Accordingto the network/search view, prices of differentiated goods fail to transmit fullinformation in terms of their quality and characteristics to international buyers andsellers. Ethnic networks are therefore perfectly placed to be able to exploitinternational informational asymmetries and foster trade. In line with theory andthe existing literature, we only find a robust pro-trade effect for differentiated products(columns (7) and (8)).
As an additional robustness check, we also analyse the impact of Vietnamesemigration on US state exports along a crude measure of the extensive margin, i.e. thenumber of industries (out of 28 (NAICS)) with positive exports to Vietnam. Ourresults (Table A4 in the online Appendix A) indicate that doubling of Vietnamesemigration increases the number of industries exported to Vietnam by around 18%,which is considerable when the breadth of our product categories is taken intoaccount. Further robustness checks including alternate specifications and OLSestimates can be found in the working paper version of this article (Parsons andV�ezina, 2014).
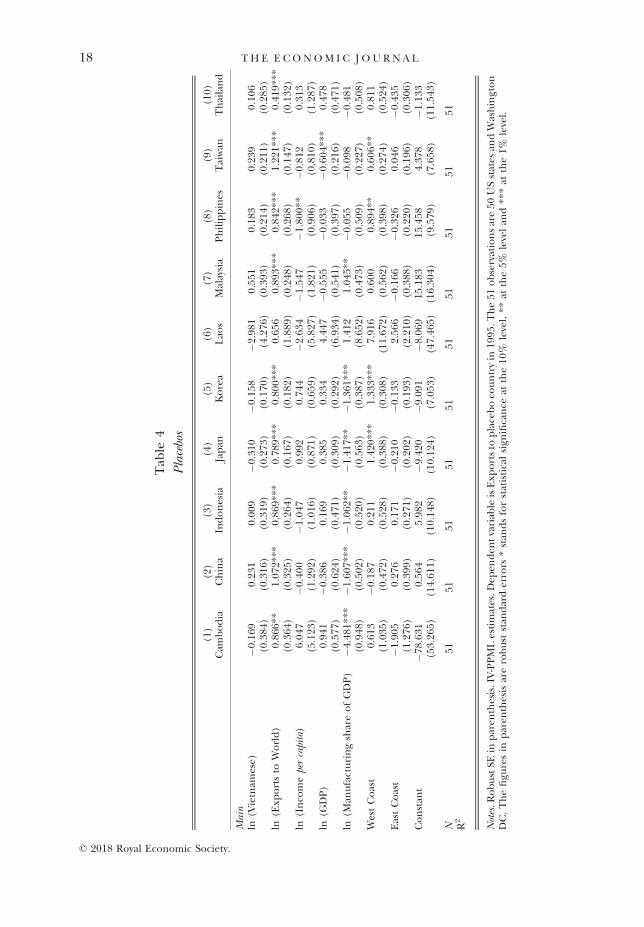
To further corroborate our results, we run placebo regressions to ensure that ourresults capturing network effects are specific to Vietnamese exports. We re-estimate ourbaseline model substituting exports to Vietnam with exports to ten other countries inSouth-East and East Asia, in ten separate specifications. Our results in Table 4, whichshow that Vietnamese migrants exert no effect on trade with any of the other tencountries, provide additional evidence of the causal link between Vietnameseimmigration to US states and US state trade with Vietnam.
To analyse the effect of the Vietnamese migrant network on exports further in the15 years following the lifting of the trade embargo, i.e. from 1995 to 2010, we estimatepanel regressions of the following form:
Xit ¼ ci þ at þ b0Vi � at þ b1Cit þ �it ; (2)
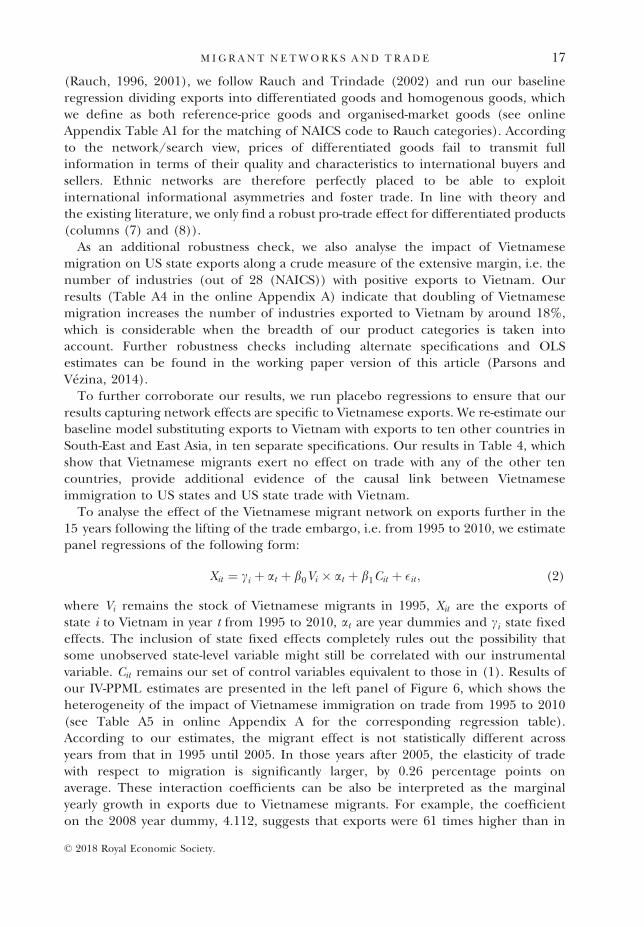
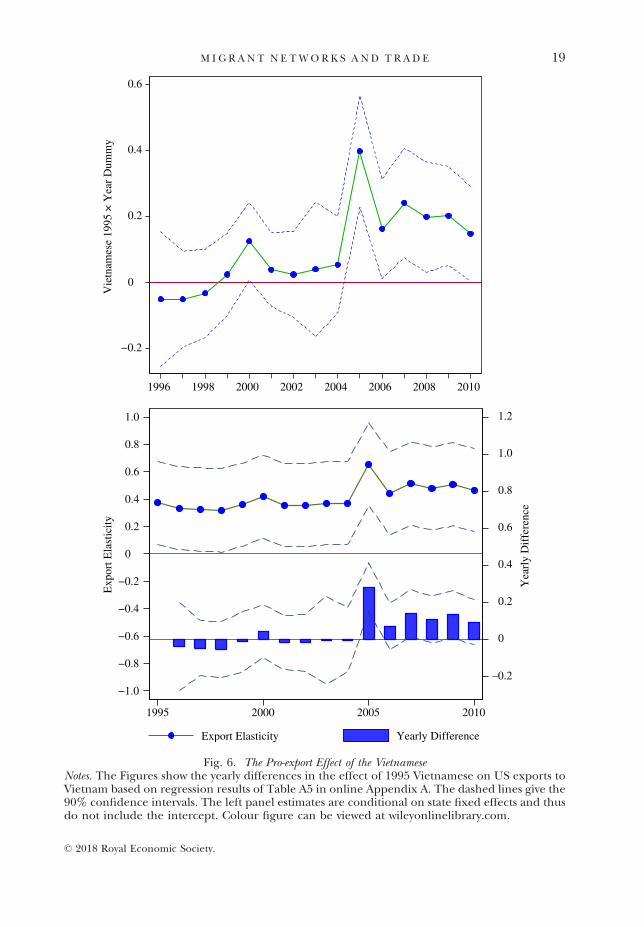
where Vi remains the stock of Vietnamese migrants in 1995, Xit are the exports ofstate i to Vietnam in year t from 1995 to 2010, at are year dummies and ci state fixedeffects. The inclusion of state fixed effects completely rules out the possibility thatsome unobserved state-level variable might still be correlated with our instrumentalvariable. Cit remains our set of control variables equivalent to those in (1). Results ofour IV-PPML estimates are presented in the left panel of Figure 6, which shows theheterogeneity of the impact of Vietnamese immigration on trade from 1995 to 2010(see Table A5 in online Appendix A for the corresponding regression table).According to our estimates, the migrant effect is not statistically different acrossyears from that in 1995 until 2005. In those years after 2005, the elasticity of tradewith respect to migration is significantly larger, by 0.26 percentage points onaverage. These interaction coefficients can be also be interpreted as the marginalyearly growth in exports due to Vietnamese migrants. For example, the coefficienton the 2008 year dummy, 4.112, suggests that exports were 61 times higher than in
© 2018 Royal Economic Society.
M I G R A N T N E TWOR K S A N D T R A D E 17
Tab
le4
Placebos
(1)
(2)
(3)
(4)
(5)
(6)
(7)
(8)
(9)
(10)
Cam
bodia
China
Indonesia
Japan
Korea
Lao
sMalaysia
Philippines
Taiwan
Thailand
Main
ln(V
ietnam
ese)
�0.169
0.23
10.00
9�0
.310
�0.158
�2.981
0.55
10.18
30.23
90.10
6(0.384
)(0.316
)(0.319
)(0.273
)(0.170
)(4.276
)(0.393
)(0.214
)(0.211
)(0.285
)ln
(Exp
ortsto
World)
0.86
6**
1.07
2***
0.86
9***
0.78
9***
0.80
0***
0.65
60.89
3***
0.84
2***
1.22
1***
0.41
9***
(0.364
)(0.325
)(0.264
)(0.167
)(0.182
)(1.889
)(0.248
)(0.268
)(0.147
)(0.132
)ln
(Inco
mepercapita)
6.04
7�0
.400
�1.047
0.99
20.74
4�2
.634
�1.547
�1.800
**�0
.812
0.31
3(5.123
)(1.292
)(1.016
)(0.871
)(0.659
)(5.827
)(1.821
)(0.906
)(0.810
)(1.287
)ln
(GDP)
0.94
1�0
.386
0.16
90.38
50.33
44.44
7�0
.555
�0.033
�0.604
***
0.47
8(0.577
)(0.624
)(0.471
)(0.309
)(0.292
)(6.934
)(0.541
)(0.397
)(0.216
)(0.471
)ln
(Man
ufacturingshareofGDP)
�4.481
***
�1.607
***
�1.062
**�1
.417
**�1
.361
***
1.41
21.04
5**
�0.055
�0.098
�0.481
(0.948
)(0.502
)(0.520
)(0.563
)(0.387
)(8.652
)(0.473
)(0.509
)(0.227
)(0.508
)WestCoast
0.61
3�0
.187
0.21
11.42
0***
1.33
3***
7.91
60.60
00.89
4**
0.60
6**
0.81
1(1.035
)(0.472
)(0.528
)(0.388
)(0.308
)(11.67
2)(0.562
)(0.398
)(0.274
)(0.524
)EastCoast
�1.905
0.27
60.17
1�0
.210
�0.133
2.56
6�0
.166
�0.326
0.04
6�0
.435
(1.276
)(0.399
)(0.271
)(0.202
)(0.193
)(2.210
)(0.388
)(0.220
)(0.196
)(0.306
)Constan
t�7
8.63
10.56
45.98
2�9
.420
�9.091
�8.069
15.183
15.458
4.37
8�1
.133
(53.26
5)(14.61
1)(10.14
8)(10.12
4)(7.053
)(47.46
5)(16.30
4)(9.579
)(7.658
)(11.54
3)
N51
5151
5151
5151
5151
51R2
Notes.R
obustSE
inparen
thesis.IV-PPMLestimates.D
epen
den
tvariab
leisExp
ortsto
placeboco
untryin
1995
.The51
observationsare50
USstates
andWashington
DC.Thefigu
resin
paren
thesisarerobust
stan
darderrors
*stan
dsforstatisticalsign
ificance
atthe10
%level,**
atthe5%
levelan
d**
*at
the1%
level.
© 2018 Royal Economic Society.
18 T H E E CONOM I C J O U RN A L
−0.2
0
0.2
0.4
0.6
Vie
tnam
ese
1995
× Y
ear
Dum
my
1996 1998 2000 2002 2004 2006 2008 2010
–0.2
0
0.2
0.4
0.6
0.8
1.0
1.2
Yea
rly
Dif
fere
nce
−1.0
−0.8
−0.6
−0.4
−0.2
0
0.2
0.4
0.6
0.8
1.0
Exp
ort E
last
icity
1995 2000 2005 2010
Export Elasticity Yearly Difference
Fig. 6. The Pro-export Effect of the VietnameseNotes. The Figures show the yearly differences in the effect of 1995 Vietnamese on US exports toVietnam based on regression results of Table A5 in online Appendix A. The dashed lines give the90% confidence intervals. The left panel estimates are conditional on state fixed effects and thusdo not include the intercept. Colour figure can be viewed at wileyonlinelibrary.com.
© 2018 Royal Economic Society.
M I G R A N T N E TWOR K S A N D T R A D E 19
1995 in a state with one Vietnamese (where ln(Vietnamese) = 0). In an average statewith 10,000 Vietnamese, exports were 406 times higher in 2008 than in 1995. Theright panel of Figure 6 illustrates the results of a similar regression where we do notinclude state fixed effects. This allows us to include Vi in our regression and thus toestimate the effect of the 1995 migrants over time, not just the yearly differences. Itshows that the elasticity is around 0.4 from 1995 to 2005 and increases to around 0.5from 2005 to 2010. The right panel also shows that the yearly differences in thispanel specification are similar to the ones in state fixed effect specification.
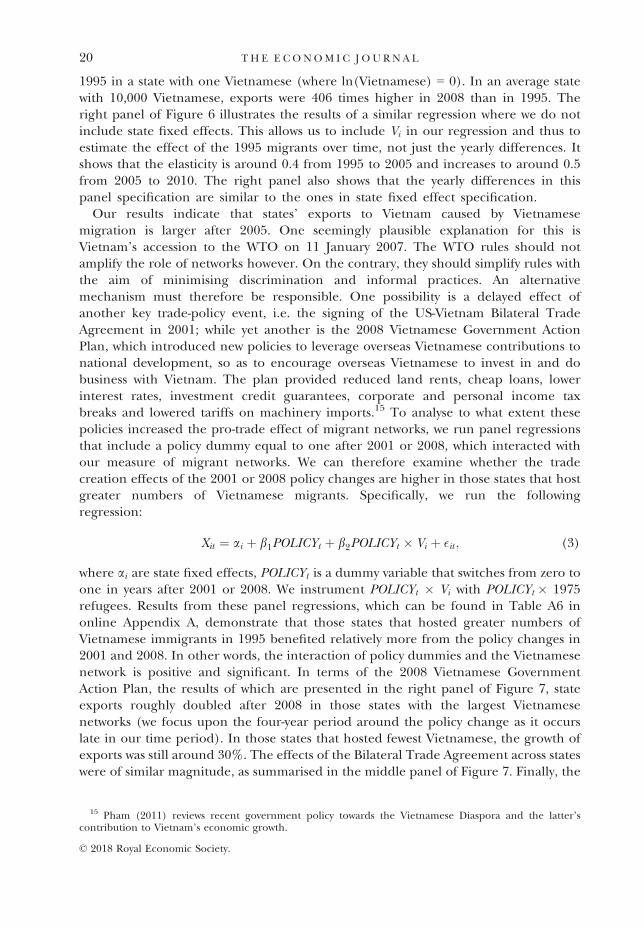
Our results indicate that states’ exports to Vietnam caused by Vietnamesemigration is larger after 2005. One seemingly plausible explanation for this isVietnam’s accession to the WTO on 11 January 2007. The WTO rules should notamplify the role of networks however. On the contrary, they should simplify rules withthe aim of minimising discrimination and informal practices. An alternativemechanism must therefore be responsible. One possibility is a delayed effect ofanother key trade-policy event, i.e. the signing of the US-Vietnam Bilateral TradeAgreement in 2001; while yet another is the 2008 Vietnamese Government ActionPlan, which introduced new policies to leverage overseas Vietnamese contributions tonational development, so as to encourage overseas Vietnamese to invest in and dobusiness with Vietnam. The plan provided reduced land rents, cheap loans, lowerinterest rates, investment credit guarantees, corporate and personal income taxbreaks and lowered tariffs on machinery imports.15 To analyse to what extent thesepolicies increased the pro-trade effect of migrant networks, we run panel regressionsthat include a policy dummy equal to one after 2001 or 2008, which interacted withour measure of migrant networks. We can therefore examine whether the tradecreation effects of the 2001 or 2008 policy changes are higher in those states that hostgreater numbers of Vietnamese migrants. Specifically, we run the followingregression:
Xit ¼ ai þ b1POLICYt þ b2POLICYt � Vi þ �it ; (3)
where ai are state fixed effects, POLICYt is a dummy variable that switches from zero toone in years after 2001 or 2008. We instrument POLICYt � Vi with POLICYt � 1975refugees. Results from these panel regressions, which can be found in Table A6 inonline Appendix A, demonstrate that those states that hosted greater numbers ofVietnamese immigrants in 1995 benefited relatively more from the policy changes in2001 and 2008. In other words, the interaction of policy dummies and the Vietnamesenetwork is positive and significant. In terms of the 2008 Vietnamese GovernmentAction Plan, the results of which are presented in the right panel of Figure 7, stateexports roughly doubled after 2008 in those states with the largest Vietnamesenetworks (we focus upon the four-year period around the policy change as it occurslate in our time period). In those states that hosted fewest Vietnamese, the growth ofexports was still around 30%. The effects of the Bilateral Trade Agreement across stateswere of similar magnitude, as summarised in the middle panel of Figure 7. Finally, the
15 Pham (2011) reviews recent government policy towards the Vietnamese Diaspora and the latter’scontribution to Vietnam’s economic growth.
© 2018 Royal Economic Society.
20 T H E E CONOM I C J O U RN A L
15
20
25
30
35
40
Yea
rly
Exp
ort G
row
th (
%)
0.1 0.3 1 3 10 30 100 300Vietnamese in 1995 (’000) (Log Scale)
0
2
4
6
8
Fact
or I
ncre
ase
in E
xpor
ts A
fter
200
1 B
TA
0.1 0.3 1 3 10 30 100 300Vietnamese in 1995 (’000) (Log Scale)
1.0
1.5
2.0
2.5
3.0
Fact
or I
ncre
ase
in E
xpor
ts A
fter
200
8
0.1 0.3 1 3 10 30 100 300Vietnamese in 1995 (’000) (Log Scale)
Fig. 7. The Pro-export Effect of the VietnameseNotes. The Figures show the variation in the effect of a time trend, a BTA dummy and a 2008-policy dummy on US exports to Vietnam across states according to the number of 1995Vietnamese. These are based on the IV-PPML regression results of Table A6 in onlineAppendix A. The dashed lines give the 90% confidence intervals. Colour figure can be viewed atwileyonlinelibrary.com.
© 2018 Royal Economic Society.
M I G R A N T N E TWOR K S A N D T R A D E 21
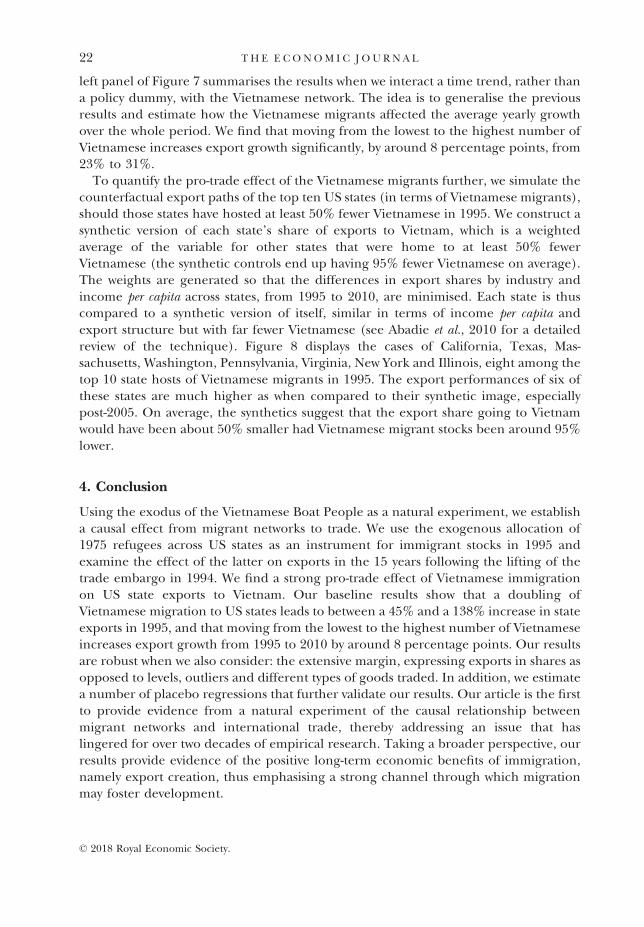
left panel of Figure 7 summarises the results when we interact a time trend, rather thana policy dummy, with the Vietnamese network. The idea is to generalise the previousresults and estimate how the Vietnamese migrants affected the average yearly growthover the whole period. We find that moving from the lowest to the highest number ofVietnamese increases export growth significantly, by around 8 percentage points, from23% to 31%.
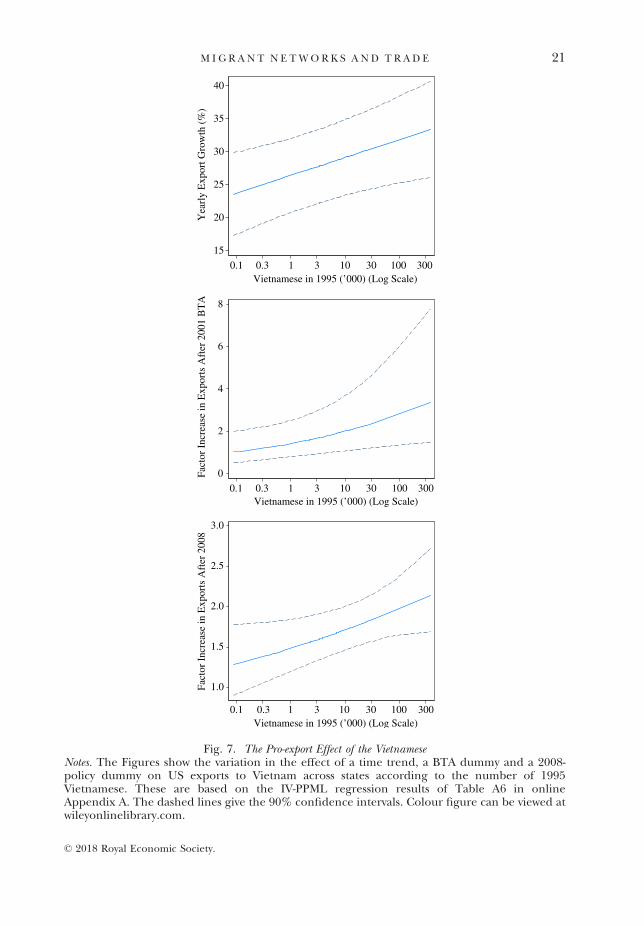
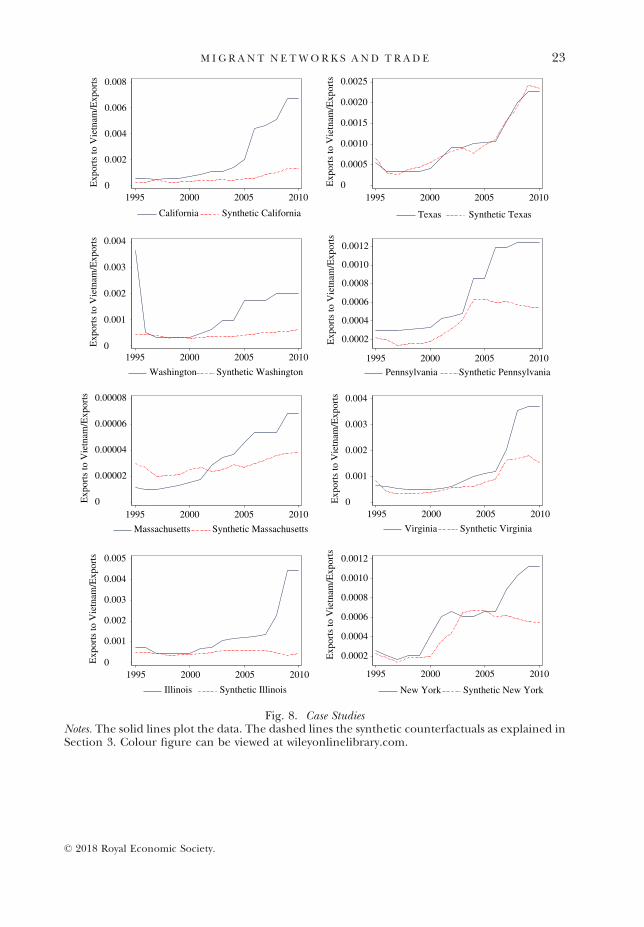
To quantify the pro-trade effect of the Vietnamese migrants further, we simulate thecounterfactual export paths of the top ten US states (in terms of Vietnamese migrants),should those states have hosted at least 50% fewer Vietnamese in 1995. We construct asynthetic version of each state’s share of exports to Vietnam, which is a weightedaverage of the variable for other states that were home to at least 50% fewerVietnamese (the synthetic controls end up having 95% fewer Vietnamese on average).The weights are generated so that the differences in export shares by industry andincome per capita across states, from 1995 to 2010, are minimised. Each state is thuscompared to a synthetic version of itself, similar in terms of income per capita andexport structure but with far fewer Vietnamese (see Abadie et al., 2010 for a detailedreview of the technique). Figure 8 displays the cases of California, Texas, Mas-sachusetts, Washington, Pennsylvania, Virginia, New York and Illinois, eight among thetop 10 state hosts of Vietnamese migrants in 1995. The export performances of six ofthese states are much higher as when compared to their synthetic image, especiallypost-2005. On average, the synthetics suggest that the export share going to Vietnamwould have been about 50% smaller had Vietnamese migrant stocks been around 95%lower.
4. Conclusion
Using the exodus of the Vietnamese Boat People as a natural experiment, we establisha causal effect from migrant networks to trade. We use the exogenous allocation of1975 refugees across US states as an instrument for immigrant stocks in 1995 andexamine the effect of the latter on exports in the 15 years following the lifting of thetrade embargo in 1994. We find a strong pro-trade effect of Vietnamese immigrationon US state exports to Vietnam. Our baseline results show that a doubling ofVietnamese migration to US states leads to between a 45% and a 138% increase in stateexports in 1995, and that moving from the lowest to the highest number of Vietnameseincreases export growth from 1995 to 2010 by around 8 percentage points. Our resultsare robust when we also consider: the extensive margin, expressing exports in shares asopposed to levels, outliers and different types of goods traded. In addition, we estimatea number of placebo regressions that further validate our results. Our article is the firstto provide evidence from a natural experiment of the causal relationship betweenmigrant networks and international trade, thereby addressing an issue that haslingered for over two decades of empirical research. Taking a broader perspective, ourresults provide evidence of the positive long-term economic benefits of immigration,namely export creation, thus emphasising a strong channel through which migrationmay foster development.
© 2018 Royal Economic Society.
22 T H E E CONOM I C J O U RN A L
0
0.002
0.004
0.006
0.008E
xpor
ts to
Vie
tnam
/Exp
orts
1995 2000 2005 2010
California Synthetic California
0
0.0005
0.0010
0.0015
0.0020
0.0025
Exp
orts
to V
ietn
am/E
xpor
ts
1995 2000 2005 2010
Texas Synthetic Texas
0
0.001
0.002
0.003
0.004
Exp
orts
to V
ietn
am/E
xpor
ts
1995 2000 2005 2010
Washington Synthetic Washington
0.0002
0.0004
0.0006
0.0008
0.0010
0.0012
Exp
orts
to V
ietn
am/E
xpor
ts
1995 2000 2005 2010
Pennsylvania Synthetic Pennsylvania
0
0.00002
0.00004
0.00006
0.00008
Exp
orts
to V
ietn
am/E
xpor
ts
1995 2000 2005 2010
Massachusetts Synthetic Massachusetts
0
0.001
0.002
0.003
0.004
Exp
orts
to V
ietn
am/E
xpor
ts
1995 2000 2005 2010
Virginia Synthetic Virginia
0
0.001
0.002
0.003
0.004
0.005
Exp
orts
to V
ietn
am/E
xpor
ts
1995 2000 2005 2010
Illinois Synthetic Illinois
0.0002
0.0004
0.0006
0.0008
0.0010
0.0012
Exp
orts
to V
ietn
am/E
xpor
ts
1995 2000 2005 2010
New York Synthetic New York
Fig. 8. Case StudiesNotes. The solid lines plot the data. The dashed lines the synthetic counterfactuals as explained inSection 3. Colour figure can be viewed at wileyonlinelibrary.com.
© 2018 Royal Economic Society.
M I G R A N T N E TWOR K S A N D T R A D E 23

The University of Western AustraliaKing’s College London
Additional Supporting Information may be found in the online version of this article:
Appendix A. Supplementary Material.Data S1.
ReferencesAbadie, A., Diamond, A. and Hainmueller, J. (2010). ‘Synthetic control methods for comparative case studies:
estimating the effect of Californias Tobacco Control Program’, Journal of the American StatisticalAssociation, vol. 105, pp. 493–505.
Allen, T. (2014). ‘Information frictions in trade’, Econometrica, vol. 82(6), pp. 2041–83.Anderson, J.E. and Marcouiller, D. (2002). ‘Insecurity and the pattern of trade: an empirical investigation’,
Review of Economics and Statistics, vol. 84(2), pp. 342–52.Anderson, J.E. and van Wincoop, E. (2004). ‘Trade costs’, Journal of Economic Literature, vol. 42,
pp. 691–751.Baker, R., North, D. and Foundation, N.T. (1984). The 1975 Refugees: Their First Five Years in America,
Washington, DC: New TransCentury Foundation.Berkowitz, D., Moenius, J. and Pistor, K. (2006). ‘Trade, law, and product complexity’, Review of Economics and
Statistics, vol. 88, pp. 363–73.Card, D. (1990). ‘The impact of the Mariel boatlift on the Miami labor market’, Industrial and Labor Relations
Review, vol. 43, pp. 245–57.Chaney, T. (2014). ‘The network structure of international trade’, American Economic Review, vol. 104(11), pp.
3600–34.Chen, B. and Jacks, D.S. (2012). ‘Trade, variety, and immigration’, Economics Letters, vol. 117(1), pp. 243–6.Cohen, L., Gurun, U.G. and Malloy, C.J. (2012). ‘Resident networks and firm trade’, Working Paper No.
18312, National Bureau of Economic Research.Dahlberg, M., Edmark, K. and Lundqvist, H. (2012). ‘Ethnic diversity and preferences for redistribution’,
Journal of Political Economy, vol. 120, pp. 41–76.Damm, A.P. and Dustmann, C. (2014). ‘Does growing up in a high crime neighborhood affect youth criminal
behavior?’, American Economic Review, vol. 104, pp. 1806–32.Dunlevy, J.A. (2006). ‘The influence of corruption and language on the protrade effect of immigrants:
evidence from the American states’, Review of Economics and Statistics, vol. 88(1), pp. 182–6.Edin, P.-A., Fredriksson, P. and Aslund, O. (2003). ‘Ethnic enclaves and the economic success of immigrants
– evidence from a natural experiment’, Quarterly Journal of Economics, vol. 118(1), pp. 329–57.Felbermayr, G.J. and Toubal, F. (2012). ‘Revisiting the trade-migration nexus: evidence from new OECD
data’, World Development, vol. 40(5), pp. 928–37.Felbermayr, G., Grossmann, V. and Kohler, W. (2015). ‘Migration, international trade, and capital formation:
cause or effect?’, in (B.R. Chiswick and P.W. Miller, eds.), Handbook of the Economics of InternationalMigration, vol. 1, pp. 913–1025, Amsterdam: North-Holland.
GAO (1976). ‘Evacuation and temporary care afforded Indochinese refugees–operation new life’, Report tothe congress, US General Accounting Office.
GAO (1977). ‘Domestic resettlement of indochinese refugees: struggle for self-reliance’, Report to thecongress, US General Accounting Office.
Genc, M., Gheasi, M., Nijkamp, P. and Poot, J. (2012). ‘The impact of immigration on international trade: ameta-analysis’, in (P. Nijkamp, J. Poot and M. Sahin eds.), Migration Impact Assessment, pp. 301–37,Cheltenham: Edward Elgar.
Gould, D.M. (1994). ‘Immigrant links to the home country: empirical implications for US bilateral tradeflows’, Review of Economics and Statistics, vol. 76, pp. 302–16.
Gourieroux, C., Monfort, A. and Trognon, A. (1984). ‘Pseudo maximum likelihood methods: applications toPoisson models’, Econometrica, vol. 52, pp. 701–20.
Greif, A. (1993). ‘Contract enforceability and economic institutions in early trade: the Maghribi traders’coalition’, American Economic Review, vol. 83, pp. 525–48.
Haines, D. (1996). Refugees in America in the 1990s: A Reference Handbook, Westport, CT: Greenwood Press.Hanson, G.H. (2010). ‘International migration and the developing world’, in (D. Rodrik and M. Rosenzweig,
eds.), Handbooks in Economics, pp. 4363–414, vol. 5 of Handbook of Development Economics, Amsterdam:Elsevier.
© 2018 Royal Economic Society.
24 T H E E CONOM I C J O U RN A L
Head, K. and Mayer, T. (2014). Gravity equations: workhorse, toolkit, and cookbook, in (G. Gopinath, E.Helpman and K. Rogoff eds.), Handbook of International Economics, vol. 4, pp. 131–95, Amsterdam:Elsevier.
Javorcik, B.S., Ozden, A., Spatareanu, M. and Neagu, C. (2011). ‘Migrant networks and foreign directinvestment’, Journal of Development Economics, vol. 94(2), pp. 231–41.
Kugler, M. and Rapoport, H. (2007). ‘International labor and capital flows: complements or substitutes?’,Economics Letters, vol. 94(2), pp. 155–62.
Lucas (2005). International Migration and Economic Development: Lessons from Low-income Countries, Cheltenham:Edward Elgar.
Marsh, R.E. (1980). ‘Socioeconomic status of indochinese refugees in the United States: progress andproblems’, Social Security Bulletin, vol. 43(10), pp. 11–20.
McCaig, B. (2011). ‘Exporting out of poverty: provincial poverty in Vietnam and US market access’, Journal ofInternational Economics, vol. 85(1), pp. 102–13.
Obstfeld, M. and Rogoff, K. (2001). ‘The six major puzzles in international macroeconomics: is there acommon cause?’, in (B. S. Bernanke and K. Rogoff eds.), NBER Macroeconomics Annual 2000, Vol. 15, pp.339–412, NBER Chapters, Cambridge, MA: National Bureau of Economic Research, Inc.
Parsons, C. and V�ezina, P.-L. (2014). ‘Migrant networks and trade: the vietnamese boat people as a naturalexperiment’, Economics Series Working Papers No. 705, University of Oxford, Department ofEconomics.
Pham, A.T. (2011). ‘The returning diaspora: analyzing overseas Vietnamese (Viet Kieu) contributions towardVietnam’s economic growth’, Working Papers No. 20, Development and Policies Research Center(DEPOCEN).
Rauch, J.E. (1996). ‘Trade and search: social capital, sogo shosha, and spillovers’, Working Papers No. 5618,National Bureau of Economic Research.
Rauch, J.E. (2001). ‘Business and social networks in international trade’, Journal of Economic Literature, vol. 39,pp. 1177–203.
Rauch, J.E. and Trindade, V. (2002). ‘Ethnic Chinese networks in international trade’, Review of Economics andStatistics, vol. 84, pp. 116–30.
Robinson, C. (1998). Terms of Refuge: The Indochinese Exodus & the International Response, London: Politics incontemporary Asia, Zed Books.
Ruggles, S., Alexander, J.T., Genadek, K., Goeken, R., Schroeder, M.B. and Sobek, M. (2010). ‘IntegratedPublic Use Microdata Series: Version 5.0’, Machine-readable database, Minneapolis: University ofMinnesota.
Rumbaut, R.G. (1995). ‘Vietnamese, Laotian and Cambodian Americans’, in (P.G. Min, ed.), Asian Americans:Contemporary Trends and Issues, pp. 262–89, London: Sage Publications.
Rumbaut, R.G. and Portes, A. (2001). Ethnicities: Children of immigrants in America, Berkeley: University ofCalifornia Press.
Silva, J.M.C.S. and Tenreyro, S. (2006). ‘The log of gravity’, Review of Economics and Statistics, vol. 88, pp. 641–58.
Sonneborn, L. and Johnston, R. (2007). Vietnamese Americans: The New Immigrants, New York: Chelsea House.Steinwender, C. (2013). ‘Information frictions and the law of one price: when the States and the Kingdom
became United’, CEPREMAP Working Papers (Docweb) No. 1314, CEPREMAP.Tenreyro, S. (2007). ‘On the trade impact of nominal exchange rate volatility’, Journal of Development
Economics, vol. 82(2), pp. 485–508.Thompson, L. (2010). Refugee Workers in the Indochina Exodus, 1975–1982, Jefferson, NC: McFarland,
Incorporated, Publishers.US House. (2010). ‘Recognizing and appreciating the historical significance and the heroic struggle and
sacrifice of the Vietnamese people...’, 111th congress, 2nd session, house representatives 1331,Washington, DC.
Vo, N. (2006). The Vietnamese Boat People, 1954 and 1975–1992, Jefferson, NC: Asian and Asian AmericanStudies, McFarland.
Zhou, M. and Bankston, C.L. (1998). Growing Up American: How Vietnamese Children Adapt to Life in the UnitedStates, New York City: Russell Sage Foundation Press.
© 2018 Royal Economic Society.
M I G R A N T N E TWOR K S A N D T R A D E 25