Migración y Desarrollo en México: hacia un nuevo enfoque analítico ...
21
Ruben Puentes/Alejandro Canales/ Héctor Rodríguez/Raúl Delgado Wise/Stephen Castles Towards an Assessment of Migration, Development and Human Rights : New Strategic Indicators
Transcript of Migración y Desarrollo en México: hacia un nuevo enfoque analítico ...

Ruben Puentes/Alejandro Canales/ Héctor Rodríguez/Raúl Delgado Wise/Stephen Castles
Towards an Assessment of Migration, Development and Human Rights : New Strategic Indicators

• Overrating remittances
• Many costs and benefits ignored
• Human rights off the radar screen
• Causes of migration out of the debate
The Current Debate
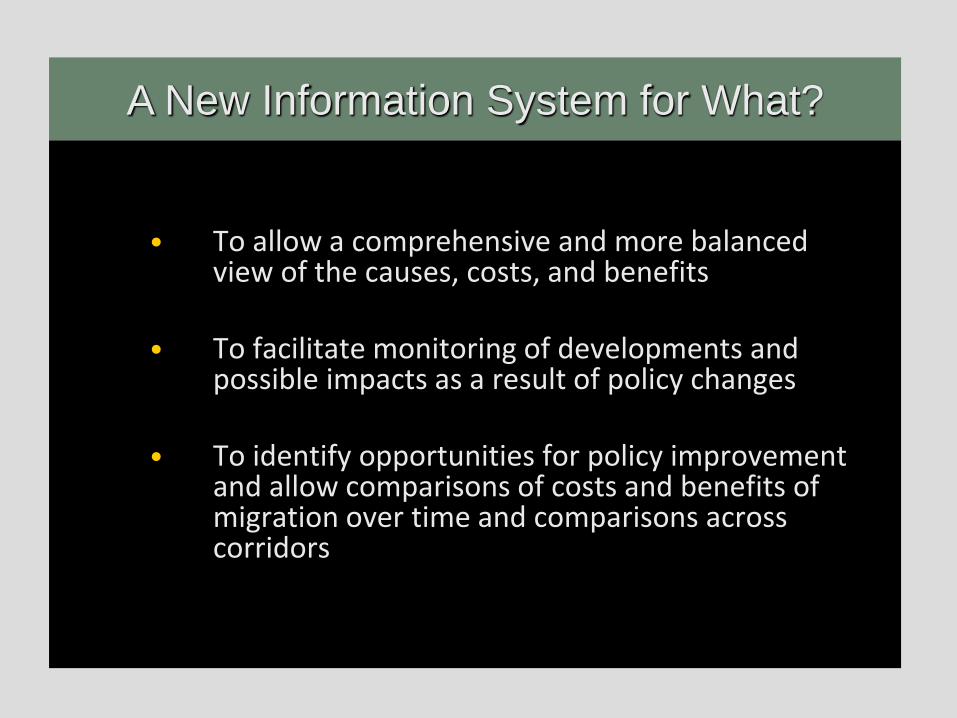
• To allow a comprehensive and more balanced view of the causes, costs, and benefits
• To facilitate monitoring of developments and possible impacts as a result of policy changes
• To identify opportunities for policy improvement and allow comparisons of costs and benefits of migration over time and comparisons across corridors
A New Information System for What?

• Identify dimensions and unit of analysis
• Select key variables and indicators for each dimension
• Develop a methodology
• Gathering data on indicators
• Weighting and integration. A migration and human development index?
• Possible key role of UN agencies
The Challenges

Key Analytical Dimensions
IMPACTS ON COUNTRIES OF
ORIGIN
IMPACTS ON COUNTRIES OF DESTINATION
IMPACTS ON MIGRANTS AND THEIR FAMILIES
ROOT CAUSES

Methodological Challenges
IMPACTS ON COUNTRIES OF ORIGIN
IMPACTS ON COUNTRIES OF DESTINATION
IMPACTS ON MIGRANTS AND THEIR FAMILIES
Threshold of acceptability
Index for a dimension
CAUSES

Comparative Analysis
CORRIDOR B
TIME 2
Across Corridors
Analytical Possibilities
CORRIDOR A
TIME 1
Over time

Comparative Analysis Top Migration Corridors, 2010 (Millions)
Source: World Bank

US: Latin American Immigrants, 2009
Source: SIMDE, based on CPS March supplement
38
42
60
74
98
118
164
164
174
350
358
378
381
447
546
705
796
1,066
1,101
11,869
Paraguay
Uruguay
Bolivia
Costa Rica
Chile
Panamá
Venezuela
Argentina
Nicaragua
Brazil
Peru
Haití
Ecuador
Honduras
Colombia
Guatemala
Rep. Dominicana
Cuba
El Salvador
México
Thousands

US: Growth of Mexican Immigrants
Source: SIMDE, based on US Census, 1960, 1970, 1980 y 1990, y CPS, March Supplement, 2000 and 2010.
Millions

Growing asymmetries US-Mexico 2000-2008 R
oo
t C
ause
s
Source: SIMDE, Productivity Index, estimation based on OECD Statistics, 1995-2009; Emigration rate, estimations based on CPS, March Supplement, 1995 to 2009, and CONAPO.

Labor market imbalances 2000-2008 R
oo
t C
ause
s
Deficit in US
6.7 Millions
Superavit in
Mexico
6.0 millions
Sources: SIMDE, US deficit: estimation based on CPS, March Supplement, 2000 and 2008; Latin America superavit: estimation based on CPS, March Supplement, 2000 and 2008; and CEPALSTAT, Estadísticas de Empleo para América Latina, 2000-2008.

Demographic growth rates in the US, 2000-2008
Source: SIMDE, based on CPS, March supplements Imp
licat
ion
s fo
r d
est
inat
ion

Sources: SIMDE based on CEPALSTAT, Estadísticas de América Latina y el Caribe; and US Census Bureau, Current Population Survey, March Supplement, 2000 and 2008.
Imp
licat
ion
s fo
r o
rigi
n
Demographic dividend export to the US, 2000-2008

Contribution of Mexicans to US GDP
Sources: SIMDE, based on BEA, Gross Domestic Product by Industry Accounts and CPS, March supplement
Billion US dollars
Imp
licat
ion
s fo
r d
est
inat
ion

Contribution to US GDP Growth 2000-2007
All Immigrants
31.7%
Sources: SIMDE, estimation based on US Bureau of Economic Analysis, Gross Domestic Product by Industry
Accounts, 1995 a 2007, and US Bureau of Census, CPS, March supplement, 1995 to 2007.
Imp
licat
ion
s fo
r d
est
inat
ion

Wage transferences 2005-2007
Sources: SIMDE, estimation based on the US Bureau of Economic Analysis, Gross Domestic Product by Industry Accounts, 2000 to 2007, and US Bureau of Census, CPS, March Supplement, 2000 to 2007. Im
plic
atio
ns
for
de
stin
atio
n

Ratio between taxes to benefits received from public social services in the US (2008)
Source: SIMDE based on US Bureau of Census, CPS, March Supplement, 2008 Imp
licat
ion
s fo
r d
est
inat
ion
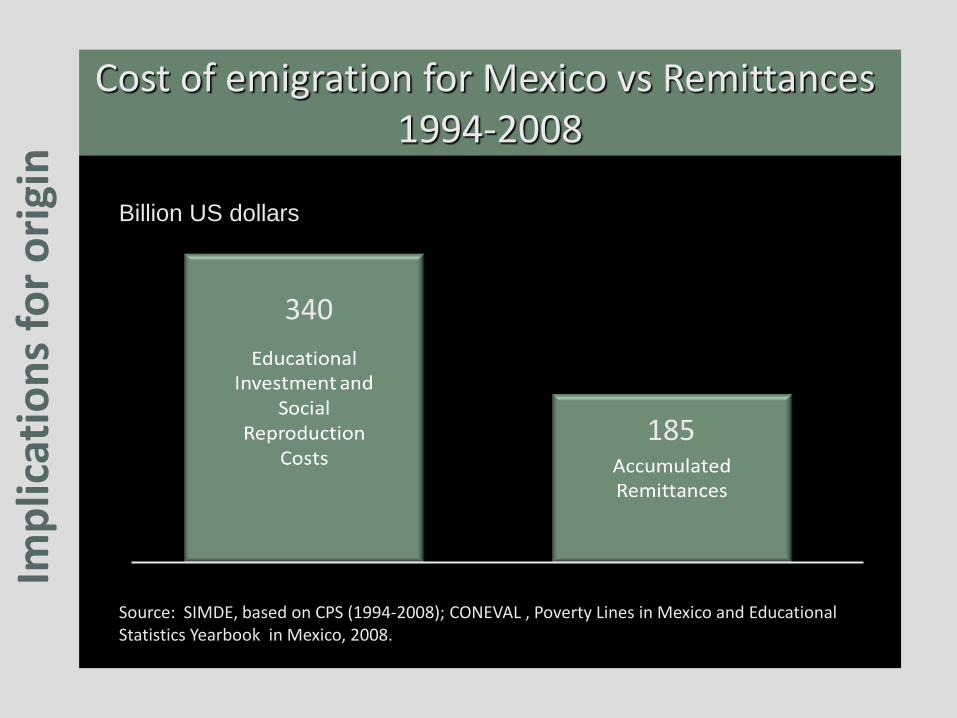
Source: SIMDE, based on CPS (1994-2008); CONEVAL , Poverty Lines in Mexico and Educational Statistics Yearbook in Mexico, 2008.
Cost of emigration for Mexico vs Remittances 1994-2008
Billion US dollars
Imp
licat
ion
s fo
r o
rigi
n
340
185

Source: SIMDE, estimation based on CPS, March Supplement, 2010
US: Population below poverty 2010
Imp
licat
ion
s fo
r m
igra
nts

• The traditional indicators for analyzing the relationship between migration and development distort reality and foster the dominant mythology underlying the social and political construction of migrants as public enemies
• There is an urgent need to construct new indicators capable of capturing the true nature of the phenomenon from a comprehensive, inclusive and more balanced perspective
• This will necessarily lead to reverse the terms of the relationship displacing migration concerns from the national security agenda and focusing more on development and international cooperation
Concluding Remarks