MIDYEAR BUDGET STATEMENT REPORT 2016/2017 Reports/MP324 MID YEAR REPORT... · NLM Mid-Year Budget...
46
NLM Mid-Year Budget Performance Report (2016/17) as at 31 December 2016 Page 1 MIDYEAR BUDGET STATEMENT REPORT 2016/2017 NKOMAZI LOCAL MUNICIPALITY MP324 Copies of this document can be viewed: At www.nkomazi.gov.za
Transcript of MIDYEAR BUDGET STATEMENT REPORT 2016/2017 Reports/MP324 MID YEAR REPORT... · NLM Mid-Year Budget...
NLM Mid-Year Budget Performance Report (2016/17) as at 31 December 2016 Page 1
MIDYEAR BUDGET STATEMENT REPORT 2016/2017
NKOMAZI LOCAL MUNICIPALITY MP324
Copies of this document can be viewed:
At www.nkomazi.gov.za

NLM Mid-Year Budget Performance Report (2016/17) as at 31 December 2016 Page 2
Table of Contents
PART 1 IN YEAR REPORT ................................................................................................................................ 3
COUNCIL RESOLUTIONS ............................................................................................................................ 4
REPORT BY THE ACTING CHIEF FINANCIAL OFFICER .................................................................................. 5
Executive Summary ............................................................................................................................... 6
Recommendations by the Municipal Manager ................................................................................... 14
IN YEAR BUDGET STATEMENT TABLES .................................................................................................... 15
Table C1 Monthly Budget Statement Summary .................................................................................. 16
Table C2 Monthly Budget Statement –Financial Performance (revenue and expenditure by standard classification) ....................................................................................................................................... 17
Table C3 Monthly Budget Statement –Financial performance (revenue and expenditure by municipal vote) .................................................................................................................................... 20
Table C4 Monthly Budget Statement–Financial Performance (revenue and expenditure) ................. 23
Table C5 Monthly budget statement-Capital Expenditure (municipal vote, standard classification and funding) ............................................................................................................................................... 24
Table C6 Monthly Budget Statement-Financial Position ..................................................................... 26
Table C7 Monthly Budget Statement-Cash flow .................................................................................. 26
PART 2 - SUPPORTING DOCUMENTATION ................................................................................................... 28
Table SC1 –SC13 Supporting Documentation ...................................................................................... 28
OTHER SUPPORTING DOCUMENTATION ............................................................................................. 44
MFMA Section 66 Report .................................................................................................................... 45
Municipal Manager’s Quality Certification .......................................................................................... 46
NLM Mid-Year Budget Performance Report (2016/17) as at 31 December 2016 Page 3
PART 1 IN YEAR REPORT

NLM Mid-Year Budget Performance Report (2016/17) as at 31 December 2016 Page 4
COUNCIL RESOLUTIONS
To be submitted after this report is tabled to council.

NLM Mid-Year Budget Performance Report (2016/17) as at 31 December 2016 Page 5
REPORT BY THE ACTING CHIEF FINANCIAL OFFICER
The 2016/17 Mid-Year Budget Report presents the annual budget results for the first six months’ period
ending 31 December 2016. The report has been prepared in accordance with the Municipal Finance
Management Act and regulations made under that Act.
Section 72(1) of the Municipal Finance Management Act, Act 56 of 2003 states that the accounting officer
must, by 25 January of each year, assess the performance of the municipality during the first half of the
financial year.
The mid-year budget and performance assessment report must be consistent with the monthly budget
statements referred to in section 71(1) on the implementation of the annual budget in accordance with
the Service Delivery Budget Implementation Plan (SDBIP) for the first half of the financial year, also the
past year’s annual report and progress on resolving problems identified in the annual report. The report
must be submitted to the Executive Mayor, National Treasury and the relevant Provincial Treasury.
Section 72(3) states that as part of the review the accounting officer must recommend whether an
adjustment budget is necessary, and recommend revised projections for revenue and expenditure to the
extent that this may be necessary.
In compliance with section 75 of the Municipal Finance Management Act this report must be publicized
on the municipal website within five days after the approval by council.
The actual results presented in this report are compared with the original budget estimates as approved
in the 2016/17 annual budget. The expected 2016/17 full year forecast cannot be extrapolated from the
half year results due to seasonal and other factors impacting on the timing of activity and transactions
particularly the government grants expected to be received in the third quarter of the financial year.

NLM Mid-Year Budget Performance Report (2016/17) as at 31 December 2016 Page 6
Executive Summary
Table C1: Monthly Budget Statement Summary – Mid Year Assessment
The table below represent the summary of the budget performance at mid-year, the overall operational
results for the period ending 31 December 2016 reflects a surplus of R166.9 million that is 13% more than
the year-to -date budget surplus of R147.2 million.
MP324 Nkomazi - Table C1 Monthly Budget Statement Summary - Mid-Year Assessment2015/16
Audited
Outcome
Original
Budget
Adjusted
BudgetMonthly actual YearTD actual YearTD budget
YTD
variance
YTD
variance
Full Year
Forecast
R thousands %
Financial Performance
Property rates 107,043 117,929 117,929 9,432 53,798 58,709 (4,911) -8% 117,929
Service charges 105,243 116,566 116,566 10,369 58,553 58,020 533 1% 116,566
Investment revenue 7,003 4,310 4,310 23 2,338 – 2,338 #DIV/0! 4,310
Transfers recognised - operational 437,255 460,207 460,207 147,154 334,091 368,491 (34,400) -9% 460,207
Other own revenue 92,715 44,118 44,118 4,494 17,452 24,196 (6,744) -28% 44,118
Total Revenue (excluding capital transfers and
contributions)
749,259 743,130 743,130 171,472 466,232 509,416 (43,183) -8% 743,130
Employee costs 291,986 287,455 287,455 23,927 157,151 151,072 6,079 4% 287,455
Remuneration of Councillors 21,329 24,299 24,299 1,593 10,345 12,149 (1,804) -15% 24,299
Depreciation & asset impairment 63,701 69,068 69,068 – – 34,534 (34,534) -100% 69,068
Finance charges 8,349 469 469 39 421 235 186 79% 469
Materials and bulk purchases 103,876 90,417 90,417 6,255 47,123 45,209 1,914 4% 90,417
Transfers and grants 311 235 235 – – – – 235
Other expenditure 271,430 238,002 238,002 5,695 84,266 119,001 (34,735) -29% 238,002
Total Expenditure 760,982 709,944 709,944 37,509 299,306 362,200 (62,894) -17% 709,944
Surplus/(Deficit) (11,724) 33,185 33,185 133,963 166,927 147,216 19,711 13% 33,185
Transfers recognised - capital 300,580 324,571 324,571 – – 259,657 (259,657) -100% 324,571
Contributions & Contributed assets – – – – – – – –
Surplus/(Deficit) after capital transfers &
contributions
288,856 357,756 357,756 133,963 166,927 406,873 (239,946) -59% 357,756
Share of surplus/ (deficit) of associate – – – – – – – –
Surplus/ (Deficit) for the year 288,856 357,756 357,756 133,963 166,927 406,873 (239,946) -59% 357,756
Capital expenditure & funds sources
Capital expenditure 335,999 354,405 354,405 (7,373) 130,246 177,202 (46,956) -26% 354,405
Capital transfers recognised 317,121 324,571 324,571 (9,101) 123,086 162,285 (39,199) -24% 324,571
Public contributions & donations – – – – – – – –
Borrowing – – – – – – – –
Internally generated funds 18,878 29,834 29,834 1,728 7,160 14,917 (7,757) -52% 29,834
Total sources of capital funds 335,999 354,405 354,405 (7,373) 130,246 177,202 (46,956) -26% 354,405
Financial position
Total current assets 296,189 318,185 318,185 417,620 318,185
Total non current assets 1,642,572 2,396,553 2,396,553 1,772,736 2,396,553
Total current liabilities 362,063 138,365 138,365 485,103 138,365
Total non current liabilities 39,674 60,054 60,054 1,302 60,054
Community wealth/Equity 1,537,025 2,516,318 2,516,318 1,703,952 2,516,318
Cash flows
Net cash from (used) operating 366,721 374,800 374,800 113,558 269,951 420,227 150,276 36% 374,800
Net cash from (used) investing (338,802) (354,405) (354,405) (7,373) (148,918) (177,202) (28,285) 16% (354,405)
Net cash from (used) financing (954) (291) (291) – – – – (291)
Cash/cash equivalents at the month/year end 65,080 74,980 74,980 – 186,113 297,901 111,788 38% 85,183
Debtors & creditors analysis 0-30 Days 31-60 Days 61-90 Days 91-120 Days 121-150 Dys 151-180 Dys181 Dys-1
YrOver 1Yr Total
Debtors Age Analysis
Total By Income Source 15,914 7,844 6,031 125,489 – – – – 155,278
Creditors Age Analysis
Total Creditors 32,144 6,333 139 18,957 – – – – 57,573
Description
Budget Year 2016/17
NLM Mid-Year Budget Performance Report (2016/17) as at 31 December 2016 Page 7
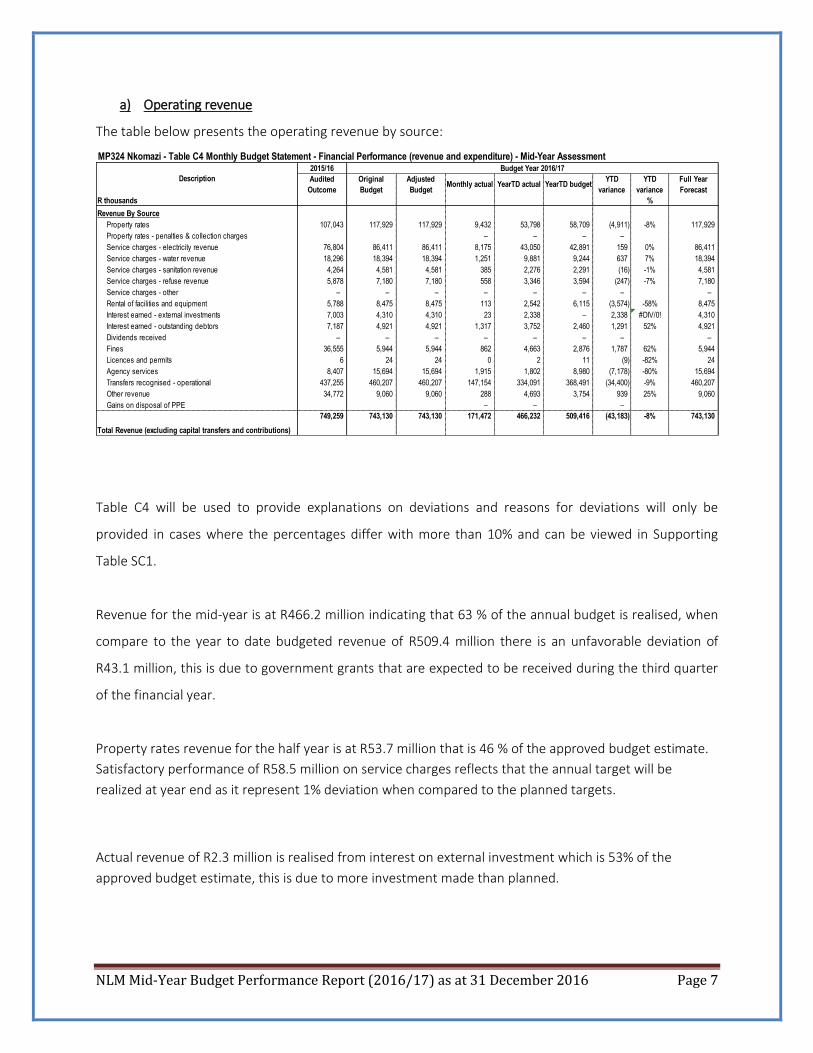
a) Operating revenue
The table below presents the operating revenue by source:
2015/16
Audited
Outcome
Original
Budget
Adjusted
BudgetMonthly actual YearTD actual YearTD budget
YTD
variance
YTD
variance
Full Year
Forecast
R thousands %
Revenue By Source
Property rates 107,043 117,929 117,929 9,432 53,798 58,709 (4,911) -8% 117,929
Property rates - penalties & collection charges – – – –
Service charges - electricity revenue 76,804 86,411 86,411 8,175 43,050 42,891 159 0% 86,411
Service charges - water revenue 18,296 18,394 18,394 1,251 9,881 9,244 637 7% 18,394
Service charges - sanitation revenue 4,264 4,581 4,581 385 2,276 2,291 (16) -1% 4,581
Service charges - refuse revenue 5,878 7,180 7,180 558 3,346 3,594 (247) -7% 7,180
Service charges - other – – – – – – – –
Rental of facilities and equipment 5,788 8,475 8,475 113 2,542 6,115 (3,574) -58% 8,475
Interest earned - external investments 7,003 4,310 4,310 23 2,338 – 2,338 #DIV/0! 4,310
Interest earned - outstanding debtors 7,187 4,921 4,921 1,317 3,752 2,460 1,291 52% 4,921
Dividends received – – – – – – – –
Fines 36,555 5,944 5,944 862 4,663 2,876 1,787 62% 5,944
Licences and permits 6 24 24 0 2 11 (9) -82% 24
Agency services 8,407 15,694 15,694 1,915 1,802 8,980 (7,178) -80% 15,694
Transfers recognised - operational 437,255 460,207 460,207 147,154 334,091 368,491 (34,400) -9% 460,207
Other revenue 34,772 9,060 9,060 288 4,693 3,754 939 25% 9,060
Gains on disposal of PPE – – –
Total Revenue (excluding capital transfers and contributions)
749,259 743,130 743,130 171,472 466,232 509,416 (43,183) -8% 743,130
Description
Budget Year 2016/17
MP324 Nkomazi - Table C4 Monthly Budget Statement - Financial Performance (revenue and expenditure) - Mid-Year Assessment
Table C4 will be used to provide explanations on deviations and reasons for deviations will only be
provided in cases where the percentages differ with more than 10% and can be viewed in Supporting
Table SC1.
Revenue for the mid-year is at R466.2 million indicating that 63 % of the annual budget is realised, when
compare to the year to date budgeted revenue of R509.4 million there is an unfavorable deviation of
R43.1 million, this is due to government grants that are expected to be received during the third quarter
of the financial year.
Property rates revenue for the half year is at R53.7 million that is 46 % of the approved budget estimate.
Satisfactory performance of R58.5 million on service charges reflects that the annual target will be
realized at year end as it represent 1% deviation when compared to the planned targets.
Actual revenue of R2.3 million is realised from interest on external investment which is 53% of the
approved budget estimate, this is due to more investment made than planned.

NLM Mid-Year Budget Performance Report (2016/17) as at 31 December 2016 Page 8
The actual Interest on outstanding debtors is 3.7 million is deviated by R1.2 million which is 52% when
compared with the estimated target of 2.4 million, this is as a result of non-payment of Leopard creek
account that is handled by the valuation appeal board.
Issuing of summons to long outstanding traffic fines has resulted to an over collection of 1.8 million and
that is 78 % of the approved budget estimate
Although the performance of revenue collection is favorable, the following under collection on rental of
facilities and equipment should be noted:
Rental income on facilities and equipment is 2.5 million. This is a 58 % unfavorable performance when
compared to the targeted performance of 6.1 million. The poor performance during the period under
review is due rental income from a farm JU 182 /R not yet received from RCL Foods; Sugar and Milling Pty
Ltd.
The analysis indicates that the budgeted revenue targets will be realized at year-end if revenue collection
is enhanced on rental of facilities and equipment and sale of water.
b) Operational expenditure
The table below presents the operating expenditure by type:
2015/16
Audited
Outcome
Original
Budget
Adjusted
BudgetMonthly actual YearTD actual YearTD budget
YTD
variance
YTD
variance
Full Year
Forecast
R thousands %
Expenditure By Type
Employee related costs 291,986 287,455 287,455 23,927 157,151 151,072 6,079 4% 287,455
Remuneration of councillors 21,329 24,299 24,299 1,593 10,345 12,149 (1,804) -15% 24,299
Debt impairment 41,687 18,936 18,936 – 125 9,468 (9,343) -99% 18,936
Depreciation & asset impairment 63,701 69,068 69,068 – – 34,534 (34,534) -100% 69,068
Finance charges 8,349 469 469 39 421 235 186 79% 469
Bulk purchases 102,341 88,048 88,048 6,200 46,379 44,024 2,355 5% 88,048
Other materials 1,535 2,369 2,369 55 744 1,185 (440) -37% 2,369
Contracted services 77,765 33,221 33,221 (686) 12,961 16,611 (3,650) -22% 33,221
Transfers and grants 311 235 235 – – – – 235
Other expenditure 151,978 185,845 185,845 6,382 71,180 92,922 (21,742) -23% 185,845
Loss on disposal of PPE – – – –
Total Expenditure 760,982 709,944 709,944 37,509 299,306 362,200 (62,894) -17% 709,944
Description
Budget Year 2016/17
MP324 Nkomazi - Table C4 Monthly Budget Statement - Financial Performance (revenue and expenditure) - Mid-Year Assessment

NLM Mid-Year Budget Performance Report (2016/17) as at 31 December 2016 Page 9
Operating expenditure actual and the year-to-date actuals for the period under review amounts to
R299.3 million against the budgeted expenditure of R362.2 million. This reflects an un-favorable deviation
of 17%.
Deviations on debt impairment, depreciation and asset impairment, constitute the main
deviation and this is due to the accounting treatment that requires the municipality to account
for these items at year end.
Delays in paying Eskom accounts has resulted to finance charges amounting to R421 thousands
and that is 90% of the budgeted estimate.
Overtime and standby payments have already been overspent by 1.5 million when compared to
the original budget of 12.1 million as the year -to -date actual is at 13.6. This pattern of spending
will result to an over-expenditure of 15.1 million by year end
Cost containment measures implemented has managed to save 23% on general expenses
without delaying service delivery.
Other material is underspent with 441 million when compared to the targeted expenditure for
the period under review amounting to 1185 million

NLM Mid-Year Budget Performance Report (2016/17) as at 31 December 2016 Page 10
c) Capital expenditure
The mid-year capital expenditure per department is presented on a high-level summary as follows:
2015/16 Budget Year 2016/17
Audited
Outcome
Original
Budget
Adjusted
BudgetMonthly actual YearTD actual YearTD budget
YTD
variance
YTD
variance
Full Year
Forecast
R thousands %
Multi-Year expenditure appropriation
Vote 1 - Vote 1 - EXECUTIVE & COUNCIL – – – – – – – –
Vote 2 - Vote 2 - BUDGET & TREASURY OFFICE – – – – – – – –
Vote 5 - Vote 5 - COMMUNITY & SOCIAL SERVICES 9,818 31,466 31,466 1,611 13,675 15,733 (2,059) -13% 31,466
Vote 6 - Vote 6 - INFRASTRUCTURE & DEVELOPMENT 223,533 261,185 261,185 (16,838) 95,068 130,593 (35,525) -27% 261,185
Total Capital Multi-year expenditure 233,352 292,652 292,652 (15,226) 108,743 146,326 (37,583) -26% 292,652
Single Year expenditure appropriation
Vote 1 - Vote 1 - EXECUTIVE & COUNCIL – 1,000 1,000 – 930 500 430 86% 1,000
Vote 2 - Vote 2 - BUDGET & TREASURY OFFICE 1,900 210 210 – 152 105 47 44% 210
Vote 3 - Vote 3 - CORPORATE SERVICES 1,473 3,406 3,406 1,539 1,582 1,703 (121) -7% 3,406
Vote 4 - Vote 4 - PLANNING AND DEVELOPMENT 2,671 4,665 4,665 – 589 2,333 (1,743) -75% 4,665
Vote 5 - Vote 5 - COMMUNITY & SOCIAL SERVICES 29,618 9,043 9,043 189 2,628 4,522 (1,894) -42% 9,043
Vote 6 - Vote 6 - INFRASTRUCTURE & DEVELOPMENT 66,986 43,429 43,429 6,125 15,623 21,715 (6,091) -28% 43,429
Total Capital single-year expenditure 102,648 61,753 61,753 7,854 21,504 30,877 (9,373) -30% 61,753
Total Capital Expenditure 335,999 354,405 354,405 (7,373) 130,246 177,202 (46,956) -26% 354,405
Funded by:
National Government 317,121 324,571 324,571 (9,101) 123,086 162,285 (39,199) -24% 324,571
Provincial Government –
District Municipality –
Other transfers and grants –
Transfers recognised - capital 317,121 324,571 324,571 (9,101) 123,086 162,285 (39,199) -24% 324,571
Public contributions & donations –
Borrowing –
Internally generated funds 18,878 29,834 29,834 1,728 7,160 14,917 (7,757) -52% 29,834
Total Capital Funding 335,999 354,405 354,405 (7,373) 130,246 177,202 (46,956) -26% 354,405
MP324 Nkomazi - Table C5 Monthly Budget Statement - Capital Expenditure (municipal vote, standard classification and funding) - Mid-Year Assessment
Vote Description
Expenditure on capital budget for the mid-term amounts to R130.2 million which reflects an unfavorable
deviation of 26 % against the year-to -date budget of R177.2 million. The spending pattern indicates that
the municipality may not meet its year-end target as the actual half- yearly capital expenditure is only
37% of the approved capital budget.
Capital conditional grant expenditure is at R123.1 million and its mainly spent on MIG projects. The
actual amount is deviated by 24 % less than the targeted amount of R162.3 million for this period. This
underspending has a negative impact on the municipality’s future allocations on conditional grants and
may result to funds being with-held on the allocation of this current financial year.
R7.1 million was spent from internally generated funds indicating an unfavorable performance of R7.7
million which is 52% of the year -to-date target and this may be attributed to delays on Bid processes.

NLM Mid-Year Budget Performance Report (2016/17) as at 31 December 2016 Page 11
d) Cash Flow performance
The cash flow budget statement reflects a favorable net cash and cash equivalents of R186.1 million for
the period ended on the 31st of December 2016 which reflect an underperformance of 38 % from the
projected cash-flow balance of 297.9 million. The under-performance is due to non-cash backed accruals
from previous financial
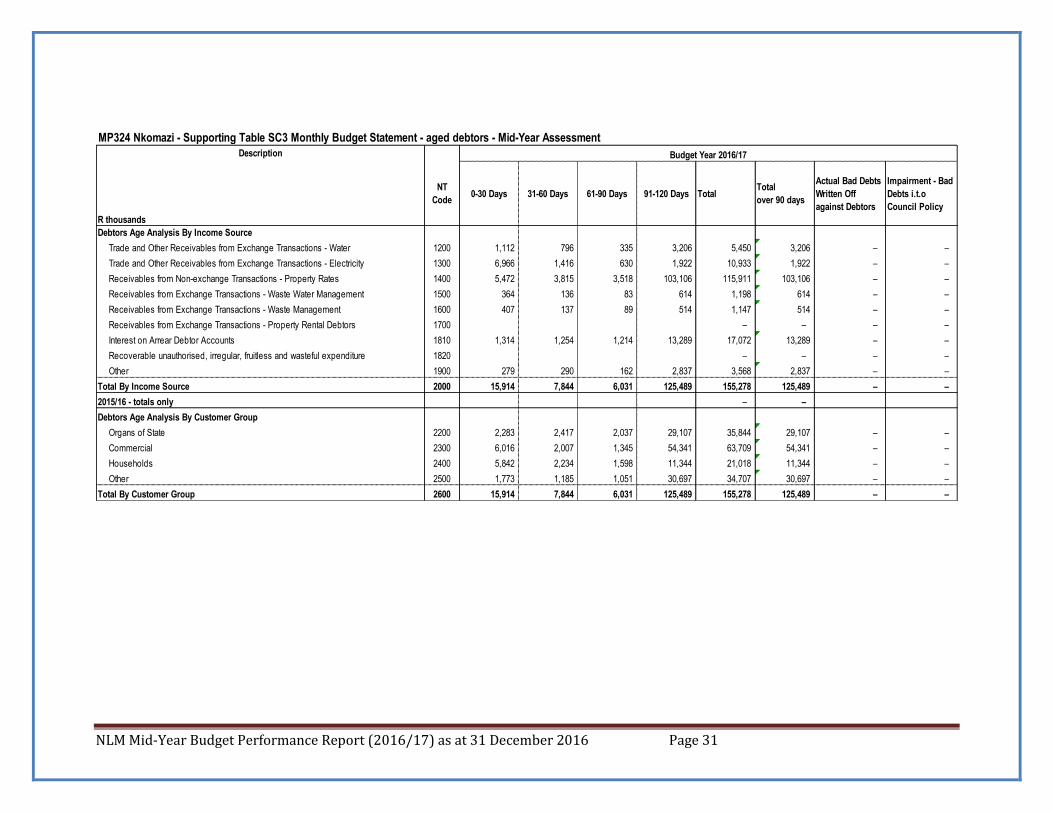
e) Account receivables (Debtors)
Outstanding debtors or Receivables as at 31 December 2016 amounted to R155.3 million, reflecting an increase of R 14.5 million (4 per cent) from June 2016 which had a balance of R140.8 million. The major contribution factors on the debtor’s book are as follows:
Leopard Creek owing R45.4 million due to the dispute which is still under litigation on the general
valuation roll done during 2010/11 financial year, the dispute is being handled by the valuation
board. The 2014/15 valuation roll was not disputed, however, the municipality is not receiving
any payments for this account, to-date R21.8 million on the current valuation is still owing, the
overall outstanding debt amounts to R67.2 million.
A total number of 1603 defaulting customers valued at R30.6 million were subjected to collection
actions through debt collectors of the municipality and the following were collected
DEBT COLLECTOR NUMBER OF ACCOUNTS
HANDED OVER
VALUE OF ACCOUNTS
HANDED OVER
AMOUNT COLLECTED/RECOVERED
PERCENTAGE OF RECOVERED
AMOUNT
FRANS MEYER 403 R8,965,322.27 R2,185,388.09 24%
TWIXA TRADING CC 1,200 R21,663,007.74 R8,375,768.55 39%
TOTAL 1,603 R30,628,330.01 R10,561,156.64 34%
Farms with an outstanding balance of R29 million that were incorrectly allocated on the debtors’
book were identified as belonging to the department of rural development through internal data
cleansing and Invoices were submitted to the department.
No debts were impaired during the month. Refer to table SC3 for an age analysis

NLM Mid-Year Budget Performance Report (2016/17) as at 31 December 2016 Page 12
f) Account payables (creditors)
There has been a slight improvement on the payment of creditors since the beginning of the financial
year amounting to R1.5 million (R52.5 million -R51 million). Trade creditors unpaid as at 30
December 2016 amounted to R51 million. The municipality needs to effectively manage its cashflow
in order to ensure that section 65(e) of the Municipal Finance Management Act is complied with.
Table SC4 outlines the creditors’ age analysis.
g) Investment Portfolio Analysis
As at 31 December, investments amounted to R25 million and this is classified as follows:
Account description Invested amount
Fixed Deposit -Call Account 20 Million
Fixed Deposit- Eskom Guarantee 5 Million
Accrued Interest 476 (reported in thousands)
h) ALLOCATION AND GRANT RECEIPTS AND EXPENDITURE
Supporting tables SC 6 & 7 provides details of transfers and grants received and appropriations thereof. On the receipt of grants, the year-to-date actual amounts to R596.7 million (R343.4 million operational grants and R253.2 million conditional grants) which is attributed to equitable share, as well as other major operating grants such as Financial Management Grant, EPWP Incentive Grant and MIG-PMU Operational Grant and conditional grants as reflected on table SC6. On the other hand the year-to-date grant expenditure amounts to R232.1 million for operational grants and 210.1 million for capital grants.
i) Capital and Operational Grants Approved Rollovers
The outcome of 2015/2016 unspent conditional grant roll-over application process has resulted in an approval of R29.1 million by the National Treasury for Municipal. The year -to- date expenditure on the approved roll-over is R16.8 million. The Municipal Water Infrastructure Grant amounting to R12.3 million is still committed.

NLM Mid-Year Budget Performance Report (2016/17) as at 31 December 2016 Page 13
j) COUNCILLOR ALLOWANCES AND EMPLOYEE BENEFITS
This table (SC8) below provides the detail for councilor and employee benefits. The actual councilors’ allowance expenditure to date amounts to R10.3 million against a projected expenditure of R12.1 million.
The actual expenditure to date on employees’ salaries and allowances is 167.4 million against a projected expenditure of 163.2, resulting to a R4.2 million (3 percent) over-expenditure. The significant variance is due to the actual overtime expenditure which was overspent by 5.4 (65 percent) when compared to the projected expenditure ( R8.2 million – R13.6 million)
k) Conclusion
The performance assessment conducted and detailed provided above reflects that an adjustments budget will need to be done to ensure the challenges of under-collection on revenue, overspending on certain operating expenditure items, underperformance on cash flow and capital expenditure are addressed.
Recommendation by the Acting Chief Financial Officer
In considering the above mentioned facts, it is recommended that:
That revenue and expenditure for the financial year be revised in an adjustment budget as per
Regulation 23 of the Municipal Budget and Reporting Regulations, such adjustment budget must
be tabled in the Municipal Council not later than 28 February 2017.
The Management needs to exercise cost curtailment measures to address the pattern of spending
on overtime and standby.
The Management must strictly enforce credit control measures to address the challenge of
under-collection on revenue and cash backing of conditional grants.
Management must exercise strict control on procurement of goods and services over the next six
months and beyond to ensure that it continues to meet its monthly commitments.
The Management must develop an acceleration plan on projects funded by conditional grants for
the 2016/17 financial year to avoid unspent conditional grants at year-end.
The Management must ensure that project implementation plans for future financial years of the
2016/17 MTREF are developed to avoid the situation of non-spending on conditional grants.

NLM Mid-Year Budget Performance Report (2016/17) as at 31 December 2016 Page 14
The Management must ensure that the departmental operations are conducted within budget to
avoid overspending by the end of June 2017.
Recommendations by the Municipal Manager
1. That the midyear budget and performance assessment report as submitted by the Chief Financial
Officer be noted as tabled.
2. That the 2016/17 annual budget be adjusted during February 2017.
3. That the Municipal Manager must submit the midyear budget and performance assessment
report to the Executive Mayor 25 January 2017.
4. That the midyear budget and performance assessment report be placed on the municipal website
within five working days after approval by council.
5. That the recommendations of the Acting Chief Financial Officer be approved and implemented.

NLM Mid-Year Budget Performance Report (2016/17) as at 31 December 2016 Page 15
IN YEAR BUDGET STATEMENT
TABLES

NLM Mid-Year Budget Performance Report (2016/17) as at 31 December 2016 Page 16
Table C1 Monthly Budget Statement Summary
MP324 Nkomazi - Table C1 Monthly Budget Statement Summary - Mid-Year Assessment2015/16
Audited
Outcome
Original
Budget
Adjusted
BudgetMonthly actual YearTD actual YearTD budget
YTD
variance
YTD
variance
Full Year
Forecast
R thousands %
Financial Performance
Property rates 107,043 117,929 117,929 9,432 53,798 58,709 (4,911) -8% 117,929
Service charges 105,243 116,566 116,566 10,369 58,553 58,020 533 1% 116,566
Investment revenue 7,003 4,310 4,310 23 2,338 – 2,338 #DIV/0! 4,310
Transfers recognised - operational 437,255 460,207 460,207 147,154 334,091 368,491 (34,400) -9% 460,207
Other own revenue 92,715 44,118 44,118 4,494 17,452 24,196 (6,744) -28% 44,118
Total Revenue (excluding capital transfers and
contributions)
749,259 743,130 743,130 171,472 466,232 509,416 (43,183) -8% 743,130
Employee costs 291,986 287,455 287,455 23,927 157,151 151,072 6,079 4% 287,455
Remuneration of Councillors 21,329 24,299 24,299 1,593 10,345 12,149 (1,804) -15% 24,299
Depreciation & asset impairment 63,701 69,068 69,068 – – 34,534 (34,534) -100% 69,068
Finance charges 8,349 469 469 39 421 235 186 79% 469
Materials and bulk purchases 103,876 90,417 90,417 6,255 47,123 45,209 1,914 4% 90,417
Transfers and grants 311 235 235 – – – – 235
Other expenditure 271,430 238,002 238,002 5,695 84,266 119,001 (34,735) -29% 238,002
Total Expenditure 760,982 709,944 709,944 37,509 299,306 362,200 (62,894) -17% 709,944
Surplus/(Deficit) (11,724) 33,185 33,185 133,963 166,927 147,216 19,711 13% 33,185
Transfers recognised - capital 300,580 324,571 324,571 – – 259,657 (259,657) -100% 324,571
Contributions & Contributed assets – – – – – – – –
Surplus/(Deficit) after capital transfers &
contributions
288,856 357,756 357,756 133,963 166,927 406,873 (239,946) -59% 357,756
Share of surplus/ (deficit) of associate – – – – – – – –
Surplus/ (Deficit) for the year 288,856 357,756 357,756 133,963 166,927 406,873 (239,946) -59% 357,756
Capital expenditure & funds sources
Capital expenditure 335,999 354,405 354,405 (7,373) 130,246 177,202 (46,956) -26% 354,405
Capital transfers recognised 317,121 324,571 324,571 (9,101) 123,086 162,285 (39,199) -24% 324,571
Public contributions & donations – – – – – – – –
Borrowing – – – – – – – –
Internally generated funds 18,878 29,834 29,834 1,728 7,160 14,917 (7,757) -52% 29,834
Total sources of capital funds 335,999 354,405 354,405 (7,373) 130,246 177,202 (46,956) -26% 354,405
Financial position
Total current assets 296,189 318,185 318,185 417,620 318,185
Total non current assets 1,642,572 2,396,553 2,396,553 1,772,736 2,396,553
Total current liabilities 362,063 138,365 138,365 485,103 138,365
Total non current liabilities 39,674 60,054 60,054 1,302 60,054
Community wealth/Equity 1,537,025 2,516,318 2,516,318 1,703,952 2,516,318
Cash flows
Net cash from (used) operating 366,721 374,800 374,800 113,558 269,951 420,227 150,276 36% 374,800
Net cash from (used) investing (338,802) (354,405) (354,405) (7,373) (148,918) (177,202) (28,285) 16% (354,405)
Net cash from (used) financing (954) (291) (291) – – – – (291)
Cash/cash equivalents at the month/year end 65,080 74,980 74,980 – 186,113 297,901 111,788 38% 85,183
Debtors & creditors analysis 0-30 Days 31-60 Days 61-90 Days 91-120 Days 121-150 Dys 151-180 Dys181 Dys-1
YrOver 1Yr Total
Debtors Age Analysis
Total By Income Source 15,914 7,844 6,031 125,489 – – – – 155,278
Creditors Age Analysis
Total Creditors 32,144 6,333 139 18,957 – – – – 57,573
Description
Budget Year 2016/17

NLM Mid-Year Budget Performance Report (2016/17) as at 31 December 2016 Page 17
Table C2 Monthly Budget Statement –Financial Performance (revenue and expenditure by standard
classification)
2015/16 Budget Year 2016/17
Audited
Outcome
Original
Budget
Adjusted
BudgetMonthly actual YearTD actual YearTD budget
YTD
variance
YTD
variance
Full Year
Forecast
R thousands %
Revenue - Standard
Governance and administration 327,187 316,910 316,910 66,965 192,887 211,237 (18,350) -9% 316,910
Executive and council 4,762 5,917 5,917 – – 4,734 (4,734) -100% 5,917
Budget and treasury office 289,153 302,180 302,180 66,777 188,630 200,248 (11,618) -6% 302,180
Corporate services 33,272 8,813 8,813 188 4,257 6,255 (1,998) -32% 8,813
Community and public safety 36,657 6,145 6,145 865 4,722 2,959 1,763 60% 6,145
Community and social services 92 131 131 4 55 54 1 2% 131
Sport and recreation – 59 59 – – 24 (24) -100% 59
Public safety 36,565 5,955 5,955 862 4,666 2,881 1,786 62% 5,955
Housing – – – – – – – –
Health – – – – – – – –
Economic and environmental services 17,538 25,938 25,938 2,038 3,183 15,144 (11,962) -79% 25,938
Planning and development 7,888 7,817 7,817 25 795 5,158 (4,363) -85% 7,817
Road transport 8,424 15,706 15,706 1,915 1,802 8,985 (7,183) -80% 15,706
Environmental protection 1,226 2,416 2,416 98 586 1,001 (415) -41% 2,416
Trading services 668,106 718,708 718,708 101,604 265,441 539,732 (274,291) -51% 718,708
Electricity 142,365 154,219 154,219 27,505 86,883 97,137 (10,254) -11% 154,219
Water 454,512 493,518 493,518 53,695 128,806 389,345 (260,539) -67% 493,518
Waste water management 9,002 4,585 4,585 385 2,276 2,291 (16) -1% 4,585
Waste management 62,229 66,386 66,386 20,019 47,476 50,958 (3,482) -7% 66,386
Other – – – – – – – –
Total Revenue - Standard 1,049,489 1,067,701 1,067,701 171,472 466,232 769,072 (302,840) -39% 1,067,701
Expenditure - Standard
Governance and administration 224,906 226,696 226,696 9,105 85,559 114,915 (29,356) -26% 226,696
Executive and council 48,863 58,462 58,462 3,693 24,722 29,578 (4,856) -16% 58,462
Budget and treasury office 122,880 121,871 121,871 2,775 38,209 61,653 (23,444) -38% 121,871
Corporate services 53,162 46,363 46,363 2,637 22,628 23,684 (1,056) -4% 46,363
Community and public safety 52,938 56,972 56,972 1,632 25,857 29,142 (3,285) -11% 56,972
Community and social services 6,731 7,420 7,420 506 3,548 3,897 (349) -9% 7,420
Sport and recreation 176 250 250 37 113 125 (12) -10% 250
Public safety 46,031 49,301 49,301 1,089 22,196 25,120 (2,924) -12% 49,301
Housing – – – – – – – –
Health – – – – – – – –
Economic and environmental services 128,951 136,678 136,678 7,636 51,479 70,644 (19,165) -27% 136,678
Planning and development 52,138 66,685 66,685 3,701 23,781 34,382 (10,602) -31% 66,685
Road transport 65,817 58,870 58,870 3,355 23,360 30,490 (7,129) -23% 58,870
Environmental protection 10,997 11,122 11,122 580 4,338 5,772 (1,434) -25% 11,122
Trading services 353,837 289,599 289,599 19,136 136,410 147,499 (11,089) -8% 289,599
Electricity 121,509 115,249 115,249 7,708 55,248 57,917 (2,669) -5% 115,249
Water 158,432 131,577 131,577 9,177 59,494 67,499 (8,005) -12% 131,577
Waste water management 26,820 4,339 4,339 77 931 2,197 (1,265) -58% 4,339
Waste management 47,076 38,434 38,434 2,175 20,736 19,885 851 4% 38,434
Other – – – – – – – –
Total Expenditure - Standard 760,632 709,944 709,944 37,509 299,306 362,200 (62,894) -17% 709,944
Surplus/ (Deficit) for the year 288,856 357,756 357,756 133,963 166,927 406,873 (239,946) -59% 357,756
Description
MP324 Nkomazi - Table C2 Monthly Budget Statement - Financial Performance (standard classification) - Mid-Year Assessment

NLM Mid-Year Budget Performance Report (2016/17) as at 31 December 2016 Page 18
2015/16 Budget Year 2016/17
Audited
Outcome
Original
Budget
Adjusted
BudgetMonthly actual YearTD actual YearTD budget YTD variance YTD variance
Full Year
Forecast
R thousands %
Revenue - Standard
Municipal governance and administration 327,187 316,910 316,910 66,965 192,887 211,237 (18,350) -9% 316,910
Executive and council 4,762 5,917 5,917 – – 4,734 (4,734) (0) 5,917
Mayor and Council –
Municipal Manager –
Extended Public Works Programme
(EPWP) 4,762 5,917 5,917 – – 4,734 5,917
Budget and treasury office 289,153 302,180 302,180 66,777 188,630 200,248 (11,618) (0) 302,180
Corporate services 33,272 8,813 8,813 188 4,257 6,255 (1,998) (0) 8,813
Human Resources 27,164 338 338 75 516 140 376 0 338
Information Technology –
Property Services 8,475 8,475 –
Other Admin 6,108 113 3,741 6,115 (2,374) (0) 8,475
Community and public safety 36,657 6,145 6,145 865 4,722 2,959 1,763 0 6,145
Community and social services 92 131 131 4 55 54 1 0 131
Libraries and Archives 45 69 69 2 28 29 (1) (0) 69
Museums & Art Galleries etc –
Community halls and Facilities –
Cemeteries & Crematoriums 47 62 62 2 28 26 2 0 62
Child Care –
Aged Care –
Other Community –
Other Social –
Sport and recreation – 59 59 – – 24 (24) (0) 59
Public safety 36,565 5,955 5,955 862 4,666 2,881 1,786 0 5,955
Police 36,555 5,944 5,944 862 4,663 2,876 1,787 0 5,944
Fire 10 11 11 – 4 5 (1) (0) 11
Civil Defence –
Street Lighting –
Other –
Housing –
Health – – – – – – – –
Clinics –
Ambulance –
Other –
Economic and environmental services 17,538 25,938 25,938 2,038 3,183 15,144 (11,962) (0) 25,938
Planning and development 7,888 7,817 7,817 25 795 5,158 (4,363) (0) 7,817
Economic Development/Planning 5,046 4,976 4,976 – – 3,981 (3,981) (0) 4,976
Town Planning/Building enforcement 962 2,840 2,840 25 395 1,178 (783) (0) 2,840
Licensing & Regulation 1,880 – – – 400 – 400 #DIV/0! –
Road transport 8,424 15,706 15,706 1,915 1,802 8,985 (7,183) (0) 15,706
Roads 17 12 12 – – 5 (5) (0) 12
Public Buses –
Parking Garages –
Vehicle Licensing and Testing 8,407 15,694 15,694 1,915 1,802 8,980 (7,178) (0) 15,694
Other –
Environmental protection 1,226 2,416 2,416 98 586 1,001 (415) (0) 2,416
Pollution Control –
Biodiversity & Landscape 1,226 2,416 2,416 98 586 1,001 (415) (0) 2,416
Other –
Trading services 668,106 718,708 718,708 101,604 265,441 539,732 (274,291) (0) 718,708
Electricity 142,365 154,219 154,219 27,505 86,883 97,137 (10,254) (0) 154,219
Electricity Distribution 142,365 154,219 154,219 27,505 86,883 97,137 (10,254) (0) 154,219
Electricity Generation –
Water 454,512 493,518 493,518 53,695 128,806 389,345 (260,539) (0) 493,518
Water Distribution 454,512 493,518 493,518 53,695 128,806 389,345 (260,539) (0) 493,518
Water Storage –
Waste water management 9,002 4,585 4,585 385 2,276 2,291 (16) (0) 4,585
Sewerage 9,002 4,585 4,585 385 2,276 2,291 (16) (0) 4,585
Storm Water Management –
Public Toilets –
Waste management 62,229 66,386 66,386 20,019 47,476 50,958 (3,482) (0) 66,386
Solid Waste 62,229 66,386 66,386 20,019 47,476 50,958 (3,482) (0) 66,386
Other – – – – – – – –
Air Transport –
Abattoirs –
Tourism –
Forestry –
Markets –
Total Revenue - Standard 1,049,489 1,067,701 1,067,701 171,472 466,232 769,072 (302,840) (0) 1,067,701
MP324 Nkomazi - Table C2 Monthly Budget Statement - Financial Performance (standard classification) - Mid-Year Assessment
Description

NLM Mid-Year Budget Performance Report (2016/17) as at 31 December 2016 Page 19
2015/16 Budget Year 2016/17
Audited
Outcome
Original
Budget
Adjusted
BudgetMonthly actual YearTD actual YearTD budget YTD variance YTD variance
Full Year
Forecast
R thousands %
Expenditure - Standard
Municipal governance and administration 224,906 226,696 226,696 9,105 85,559 114,915 (29,356) (0) 226,696
Executive and council 48,863 58,462 58,462 3,693 24,722 29,578 (4,856) (0) 58,462
Mayor and Council 28,880 36,180 36,180 1,966 12,625 18,090 (5,465) (0) 36,180
Municipal Manager 14,372 16,365 16,365 1,060 7,224 8,530 (1,306) (0) 16,365
Extended Public Works Programme
(EPWP) 5,611 5,917 5,917 668 4,874 2,959 5,917
Budget and treasury office 122,880 121,871 121,871 2,775 38,209 61,653 (23,444) (0) 121,871
Corporate services 53,162 46,363 46,363 2,637 22,628 23,684 (1,056) (0) 46,363
Human Resources 52,565 43,918 43,918 2,637 22,432 22,462 (30) (0) 46,363
Information Technology 570 2,445 2,445 – 193 1,222 (1,030) (0)
Property Services 27 – – – 3 – 3 #DIV/0! –
Other Admin –
Community and public safety 52,938 56,972 56,972 1,632 25,857 29,142 (3,285) (0) 56,972
Community and social services 6,731 7,420 7,420 506 3,548 3,897 (349) (0) 7,420
Libraries and Archives 1,727 2,048 2,048 121 944 1,073 (129) (0) 2,048
Museums & Art Galleries etc –
Community halls and Facilities –
Cemeteries & Crematoriums 5,004 5,372 5,372 385 2,604 2,824 (220) (0) 5,372
Child Care –
Aged Care –
Other Community –
Other Social –
Sport and recreation 176 250 250 37 113 125 (12) (0) 250
Public safety 46,031 49,301 49,301 1,089 22,196 25,120 (2,924) (0) 49,301
Police 16,404 17,699 17,699 1,360 9,005 9,204 (199) (0) 17,699
Fire 46 70 70 30 63 35 28 0 70
Civil Defence –
Street Lighting –
Other 29,581 31,532 31,532 (301) 13,128 15,881 (2,752) (0) 31,532
Housing –
Health – – – – – – – –
Clinics –
Ambulance –
Other –
Economic and environmental services 128,951 136,678 136,678 7,636 51,479 70,644 (19,165) (0) 136,678
Planning and development 52,138 66,685 66,685 3,701 23,781 34,382 (10,602) (0) 66,685
Economic Development/Planning 10,885 15,612 15,612 879 5,666 8,077 (2,410) (0) 15,612
Town Planning/Building enforcement 20,931 31,588 31,588 1,300 9,288 16,234 (6,946) (0) 31,588
Licensing & Regulation 20,323 19,485 19,485 1,523 8,826 10,071 (1,246) (0) 19,485
Road transport 65,817 58,870 58,870 3,355 23,360 30,490 (7,129) (0) 58,870
Roads 51,641 42,469 42,469 2,339 16,076 21,930 (5,854) (0) 42,469
Public Buses –
Parking Garages –
Vehicle Licensing and Testing 14,175 16,401 16,401 1,016 7,285 8,560 (1,275) (0) 16,401
Other –
Environmental protection 10,997 11,122 11,122 580 4,338 5,772 (1,434) (0) 11,122
Pollution Control –
Biodiversity & Landscape 10,997 11,122 11,122 580 4,338 5,772 (1,434) (0) 11,122
Other –
Trading services 353,837 289,599 289,599 19,136 136,410 147,499 (11,089) (0) 289,599
Electricity 121,509 115,249 115,249 7,708 55,248 57,917 (2,669) (0) 115,249
Electricity Distribution 121,509 115,249 115,249 7,708 55,248 57,917 (2,669) (0) 115,249
Electricity Generation –
Water 158,432 131,577 131,577 9,177 59,494 67,499 (8,005) (0) 131,577
Water Distribution 158,432 131,577 131,577 9,177 59,494 67,499 (8,005) (0) 131,577
Water Storage –
Waste water management 26,820 4,339 4,339 77 931 2,197 (1,265) (0) 4,339
Sewerage 26,820 4,339 4,339 77 931 2,197 (1,265) (0) 4,339
Storm Water Management –
Public Toilets –
Waste management 47,076 38,434 38,434 2,175 20,736 19,885 851 0 38,434
Solid Waste 47,076 38,434 38,434 2,175 20,736 19,885 851 0 38,434
Other – – – – – – – –
Air Transport –
Abattoirs –
Tourism –
Forestry –
Markets –
Total Expenditure - Standard 760,632 709,944 709,944 37,509 299,306 362,200 (62,894) (0) 709,944
Surplus/ (Deficit) for the year 288,856 357,756 357,756 133,963 166,927 406,873 (239,946) (0) 357,756
MP324 Nkomazi - Table C2 Monthly Budget Statement - Financial Performance (standard classification) - Mid-Year Assessment
Description
NLM Mid-Year Budget Performance Report (2016/17) as at 31 December 2016 Page 20
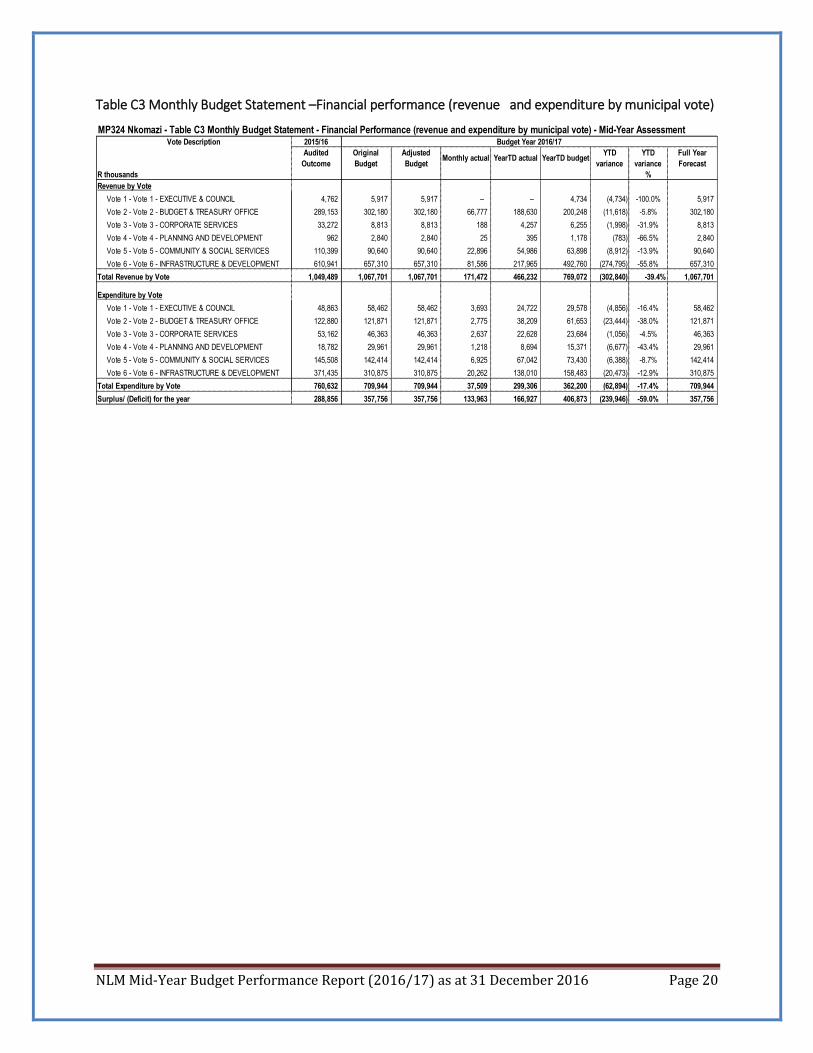
Table C3 Monthly Budget Statement –Financial performance (revenue and expenditure by municipal vote)
Vote Description 2015/16
Audited
Outcome
Original
Budget
Adjusted
BudgetMonthly actual YearTD actual YearTD budget
YTD
variance
YTD
variance
Full Year
Forecast
R thousands %
Revenue by Vote
Vote 1 - Vote 1 - EXECUTIVE & COUNCIL 4,762 5,917 5,917 – – 4,734 (4,734) -100.0% 5,917
Vote 2 - Vote 2 - BUDGET & TREASURY OFFICE 289,153 302,180 302,180 66,777 188,630 200,248 (11,618) -5.8% 302,180
Vote 3 - Vote 3 - CORPORATE SERVICES 33,272 8,813 8,813 188 4,257 6,255 (1,998) -31.9% 8,813
Vote 4 - Vote 4 - PLANNING AND DEVELOPMENT 962 2,840 2,840 25 395 1,178 (783) -66.5% 2,840
Vote 5 - Vote 5 - COMMUNITY & SOCIAL SERVICES 110,399 90,640 90,640 22,896 54,986 63,898 (8,912) -13.9% 90,640
Vote 6 - Vote 6 - INFRASTRUCTURE & DEVELOPMENT 610,941 657,310 657,310 81,586 217,965 492,760 (274,795) -55.8% 657,310
Total Revenue by Vote 1,049,489 1,067,701 1,067,701 171,472 466,232 769,072 (302,840) -39.4% 1,067,701
Expenditure by Vote
Vote 1 - Vote 1 - EXECUTIVE & COUNCIL 48,863 58,462 58,462 3,693 24,722 29,578 (4,856) -16.4% 58,462
Vote 2 - Vote 2 - BUDGET & TREASURY OFFICE 122,880 121,871 121,871 2,775 38,209 61,653 (23,444) -38.0% 121,871
Vote 3 - Vote 3 - CORPORATE SERVICES 53,162 46,363 46,363 2,637 22,628 23,684 (1,056) -4.5% 46,363
Vote 4 - Vote 4 - PLANNING AND DEVELOPMENT 18,782 29,961 29,961 1,218 8,694 15,371 (6,677) -43.4% 29,961
Vote 5 - Vote 5 - COMMUNITY & SOCIAL SERVICES 145,508 142,414 142,414 6,925 67,042 73,430 (6,388) -8.7% 142,414
Vote 6 - Vote 6 - INFRASTRUCTURE & DEVELOPMENT 371,435 310,875 310,875 20,262 138,010 158,483 (20,473) -12.9% 310,875
Total Expenditure by Vote 760,632 709,944 709,944 37,509 299,306 362,200 (62,894) -17.4% 709,944
Surplus/ (Deficit) for the year 288,856 357,756 357,756 133,963 166,927 406,873 (239,946) -59.0% 357,756
MP324 Nkomazi - Table C3 Monthly Budget Statement - Financial Performance (revenue and expenditure by municipal vote) - Mid-Year AssessmentBudget Year 2016/17

NLM Mid-Year Budget Performance Report (2016/17) as at 31 December 2016 Page 21
MP324 Nkomazi - Table C3 Monthly Budget Statement - Financial Performance (revenue and expenditure by municipal vote) - A - Mid-Year Assessment
Vote Description 2015/16
R thousandAudited
Outcome
Original
Budget
Adjusted
BudgetMonthly actual YearTD actual YearTD budget YTD variance YTD variance
Full Year
Forecast
%
Revenue by Vote
Vote 1 - Vote 1 - EXECUTIVE & COUNCIL 4,762 5,917 5,917 – – 4,734 (4,734) -100% 5,917
1.1 - Mayor & Council – – – – – – – –
1.2 - Office of the Speaker – – – – – – – –
1.3 - Office of the Chief Whip – – – – – – – –
1.4 - Municipal Manager – – – – – – – –
1.5 - Extended Public Works Programme (EPWP) 4,762 5,917 5,917 – – 4,734 (4,734) -100% 5,917
–
Vote 2 - Vote 2 - BUDGET & TREASURY OFFICE 289,153 302,180 302,180 66,777 188,630 200,248 (11,618) -6% 302,180
2.1 - Finance 18,825 12,504 12,504 1,426 8,029 3,817 4,212 110% 12,504
2.2 - Assessment Rates 267,797 288,051 288,051 65,351 180,601 194,806 (14,205) -7% 288,051
2.3 - Finance Management Grant (FMG) 1,600 1,625 1,625 – – 1,625 (1,625) -100% 1,625
2.4 - Municipal Systems Improvement Grant (MSIG) 930 – – – – – – –
–
Vote 3 - Vote 3 - CORPORATE SERVICES 33,272 8,813 8,813 188 4,257 6,255 (1,998) -32% 8,813
3.1 - Corporate Services 27,164 338 338 75 516 140 376 268% 338
3.2 - Property Services 6,108 8,475 8,475 113 3,741 6,115 (2,374) -39% 8,475
–
Vote 4 - Vote 4 - PLANNING AND DEVELOPMENT 962 2,840 2,840 25 395 1,178 (783) -66% 2,840
4.1 - Town Planning 962 2,840 2,840 25 395 1,178 (783) -66% 2,840
4.2 - Local Economic Development (LED) – – – – – – – –
4.3 - Integrated Development Planning (IDP) – – – – – – – –
4.4 - Performance Management System (PMS) – – – – – – – –
–
Vote 5 - Vote 5 - COMMUNITY & SOCIAL SERVICES 110,399 90,640 90,640 22,896 54,986 63,898 (8,912) -14% 90,640
5.1 - Socio Economic & Development (Licencing & Regulation) 1,880 – – – 400 – 400 #DIV/0! –
5.2 - Libriaries & Archives 45 69 69 2 28 29 (1) -3% 69
5.3 - Cemeteries 47 62 62 2 28 26 2 8% 62
5.4 - Disaster Management – – – – – – – –
5.5 - Protection Services (Police) 36,555 5,944 5,944 862 4,663 2,876 1,787 62% 5,944
5.6 - Fire 10 11 11 – 4 5 (1) -22% 11
5.7 - Parks – 59 59 – – 24 (24) -100% 59
5.8 - Nature conservation 1,226 2,416 2,416 98 586 1,001 (415) -41% 2,416
5.9 - Solid waste 62,229 66,386 66,386 20,019 47,476 50,958 (3,482) -7% 66,386
5.10 - Vehicle Licensing & Testing 8,407 15,694 15,694 1,915 1,802 8,980 (7,178) -80% 15,694
Vote 6 - Vote 6 - INFRASTRUCTURE & DEVELOPMENT 610,941 657,310 657,310 81,586 217,965 492,760 (274,795) -56% 657,310
6.1 - Civil Administration – – – – – – – –
6.2 - Sewerage 9,002 4,585 4,585 385 2,276 2,291 (16) -1% 4,585
6.3 - Roads 17 12 12 – – 5 (5) -100% 12
6.4 - water Distribution 454,512 493,518 493,518 53,695 128,806 389,345 (260,539) -67% 493,518
6.5 - Electricity Distribution 142,365 154,219 154,219 27,505 86,883 97,137 (10,254) -11% 154,219
6.6 - Project Management Unit (PMU) 5,046 4,976 4,976 – – 3,981 (3,981) -100% 4,976
–
Total Revenue by Vote 1,049,489 1,067,701 1,067,701 171,472 466,232 769,072 (302,840) -39% 1,067,701 –
Budget Year 2016/17

NLM Mid-Year Budget Performance Report (2016/17) as at 31 December 2016 Page 22
MP324 Nkomazi - Table C3 Monthly Budget Statement - Financial Performance (revenue and expenditure by municipal vote) - A - Mid-Year Assessment
Vote Description 2015/16
R thousandAudited
Outcome
Original
Budget
Adjusted
BudgetMonthly actual YearTD actual YearTD budget YTD variance YTD variance
Full Year
Forecast
%–
Expenditure by Vote –
Vote 1 - Vote 1 - EXECUTIVE & COUNCIL 48,863 58,462 58,462 3,693 24,722 29,578 (4,856) -16% 58,462
1.1 - Mayor & Council 26,688 29,257 29,257 1,857 11,828 14,629 (2,800) -19% 29,257
1.2 - Office of the Speaker 1,554 6,172 6,172 57 485 3,086 (2,601) -84% 6,172
1.3 - Office of the Chief Whip 639 751 751 52 311 376 (64) -17% 751
1.4 - Municipal Manager 14,372 16,365 16,365 1,060 7,224 8,530 (1,306) -15% 16,365
1.5 - Extended Public Works Programme (EPWP) 5,611 5,917 5,917 668 4,874 2,959 1,915 65% 5,917
–
Vote 2 - Vote 2 - BUDGET & TREASURY OFFICE 122,880 121,871 121,871 2,775 38,209 61,653 (23,444) -38% 121,871
2.1 - Finance 120,773 120,248 120,248 2,619 37,583 60,813 (23,229) -38% 120,248
2.2 - Assessment Rates – – – – – – – –
2.3 - Finance Management Grant (FMG) 1,462 1,624 1,624 156 625 840 (214) -26% 1,624
2.4 - Municipal Systems Improvement Grant (MSIG) 645 – – – – – – –
–
Vote 3 - Vote 3 - CORPORATE SERVICES 53,162 46,363 46,363 2,637 22,628 23,684 (1,056) -4% 46,363
3.1 - Corporate Services 53,135 46,363 46,363 2,637 22,625 23,684 (1,060) -4% 46,363
3.2 - Property Services 27 – – – 3 – 3 #DIV/0! –
–
Vote 4 - Vote 4 - PLANNING AND DEVELOPMENT 18,782 29,961 29,961 1,218 8,694 15,371 (6,677) -43% 29,961
4.1 - Town Planning 11,486 20,608 20,608 722 5,387 10,507 (5,120) -49% 20,608
4.2 - Local Economic Development (LED) 4,137 6,040 6,040 363 2,104 3,132 (1,028) -33% 6,040
4.3 - Integrated Development Planning (IDP) 2,161 2,205 2,205 132 1,034 1,150 (116) -10% 2,205
4.4 - Performance Management System (PMS) 999 1,107 1,107 – 169 581 (412) -71% 1,107
–
Vote 5 - Vote 5 - COMMUNITY & SOCIAL SERVICES 145,508 142,414 142,414 6,925 67,042 73,430 (6,388) -9% 142,414
5.1 - Socio Economic & Development (Licencing & Regulation)20,323 19,485 19,485 1,523 8,826 10,071 (1,246) -12% 19,485
5.2 - Libriaries & Archives 1,727 2,048 2,048 121 944 1,073 (129) -12% 2,048
5.3 - Cemeteries 5,004 5,372 5,372 385 2,604 2,824 (220) -8% 5,372
5.4 - Disaster Management 29,581 31,532 31,532 (301) 13,128 15,881 (2,752) -17% 31,532
5.5 - Protection Services (Police) 16,404 17,699 17,699 1,360 9,005 9,204 (199) -2% 17,699
5.6 - Fire 46 70 70 30 63 35 28 80% 70
5.7 - Parks 176 250 250 37 113 125 (12) -10% 250
5.8 - Nature conservation 10,997 11,122 11,122 580 4,338 5,772 (1,434) -25% 11,122
5.9 - Solid waste 47,076 38,434 38,434 2,175 20,736 19,885 851 4% 38,434
5.10 - Vehicle Licensing & Testing 14,175 16,401 16,401 1,016 7,285 8,560 (1,275) -15% 16,401
Vote 6 - Vote 6 - INFRASTRUCTURE & DEVELOPMENT 371,435 310,875 310,875 20,262 138,010 158,483 (20,473) -13% 310,875
6.1 - Civil Administration 8,446 9,873 9,873 578 3,733 5,146 (1,413) -27% 9,873
6.2 - Sewerage 26,820 4,339 4,339 77 931 2,197 (1,265) -58% 4,339
6.3 - Roads 51,641 42,469 42,469 2,339 16,076 21,930 (5,854) -27% 42,469
6.4 - water Distribution 158,432 131,577 131,577 9,177 59,494 67,499 (8,005) -12% 131,577
6.5 - Electricity Distribution 121,509 115,249 115,249 7,708 55,248 57,917 (2,669) -5% 115,249
6.6 - Project Management Unit (PMU) 4,588 7,367 7,367 383 2,528 3,794 (1,266) -33% 7,367
–
Total Expenditure by Vote 760,632 709,944 709,944 37,509 299,306 362,200 (62,894) (0) 709,944 –
Surplus/ (Deficit) for the year 288,856 357,756 357,756 133,963 166,927 406,873 (239,946) (0) 357,756
Budget Year 2016/17

NLM Mid-Year Budget Performance Report (2016/17) as at 31 December 2016 Page 23
Table C4 Monthly Budget Statement–Financial Performance (revenue and expenditure)
2015/16
Audited
Outcome
Original
Budget
Adjusted
BudgetMonthly actual YearTD actual YearTD budget
YTD
variance
YTD
variance
Full Year
Forecast
R thousands %
Revenue By Source
Property rates 107,043 117,929 117,929 9,432 53,798 58,709 (4,911) -8% 117,929
Property rates - penalties & collection charges – – – –
Service charges - electricity revenue 76,804 86,411 86,411 8,175 43,050 42,891 159 0% 86,411
Service charges - water revenue 18,296 18,394 18,394 1,251 9,881 9,244 637 7% 18,394
Service charges - sanitation revenue 4,264 4,581 4,581 385 2,276 2,291 (16) -1% 4,581
Service charges - refuse revenue 5,878 7,180 7,180 558 3,346 3,594 (247) -7% 7,180
Service charges - other – – – – – – – –
Rental of facilities and equipment 5,788 8,475 8,475 113 2,542 6,115 (3,574) -58% 8,475
Interest earned - external investments 7,003 4,310 4,310 23 2,338 – 2,338 #DIV/0! 4,310
Interest earned - outstanding debtors 7,187 4,921 4,921 1,317 3,752 2,460 1,291 52% 4,921
Dividends received – – – – – – – –
Fines 36,555 5,944 5,944 862 4,663 2,876 1,787 62% 5,944
Licences and permits 6 24 24 0 2 11 (9) -82% 24
Agency services 8,407 15,694 15,694 1,915 1,802 8,980 (7,178) -80% 15,694
Transfers recognised - operational 437,255 460,207 460,207 147,154 334,091 368,491 (34,400) -9% 460,207
Other revenue 34,772 9,060 9,060 288 4,693 3,754 939 25% 9,060
Gains on disposal of PPE – – –
Total Revenue (excluding capital transfers and contributions)
749,259 743,130 743,130 171,472 466,232 509,416 (43,183) -8% 743,130
Expenditure By Type
Employee related costs 291,986 287,455 287,455 23,927 157,151 151,072 6,079 4% 287,455
Remuneration of councillors 21,329 24,299 24,299 1,593 10,345 12,149 (1,804) -15% 24,299
Debt impairment 41,687 18,936 18,936 – 125 9,468 (9,343) -99% 18,936
Depreciation & asset impairment 63,701 69,068 69,068 – – 34,534 (34,534) -100% 69,068
Finance charges 8,349 469 469 39 421 235 186 79% 469
Bulk purchases 102,341 88,048 88,048 6,200 46,379 44,024 2,355 5% 88,048
Other materials 1,535 2,369 2,369 55 744 1,185 (440) -37% 2,369
Contracted services 77,765 33,221 33,221 (686) 12,961 16,611 (3,650) -22% 33,221
Transfers and grants 311 235 235 – – – – 235
Other expenditure 151,978 185,845 185,845 6,382 71,180 92,922 (21,742) -23% 185,845
Loss on disposal of PPE – – – –
Total Expenditure 760,982 709,944 709,944 37,509 299,306 362,200 (62,894) -17% 709,944
Surplus/(Deficit) (11,724) 33,185 33,185 133,963 166,927 147,216 19,711 0 33,185
Transfers recognised - capital 300,580 324,571 324,571 259,657 (259,657) (0) 324,571
Contributions recognised - capital – – – –
Contributed assets –
Surplus/(Deficit) after capital transfers & contributions 288,856 357,756 357,756 133,963 166,927 406,873 357,756
Taxation –
Surplus/(Deficit) after taxation 288,856 357,756 357,756 133,963 166,927 406,873 357,756
Attributable to minorities
Surplus/(Deficit) attributable to municipality 288,856 357,756 357,756 133,963 166,927 406,873 357,756
Share of surplus/ (deficit) of associate
Surplus/ (Deficit) for the year 288,856 357,756 357,756 133,963 166,927 406,873 357,756
Description
Budget Year 2016/17
MP324 Nkomazi - Table C4 Monthly Budget Statement - Financial Performance (revenue and expenditure) - Mid-Year Assessment

NLM Mid-Year Budget Performance Report (2016/17) as at 31 December 2016 Page 24
Table C5 Monthly budget statement-Capital Expenditure (municipal vote, standard classification and funding)
2015/16 Budget Year 2016/17
Audited
Outcome
Original
Budget
Adjusted
BudgetMonthly actual YearTD actual YearTD budget
YTD
variance
YTD
variance
Full Year
Forecast
R thousands %
Multi-Year expenditure appropriation
Vote 1 - Vote 1 - EXECUTIVE & COUNCIL – – – – – – – –
Vote 2 - Vote 2 - BUDGET & TREASURY OFFICE – – – – – – – –
Vote 5 - Vote 5 - COMMUNITY & SOCIAL SERVICES 9,818 31,466 31,466 1,611 13,675 15,733 (2,059) -13% 31,466
Vote 6 - Vote 6 - INFRASTRUCTURE & DEVELOPMENT 223,533 261,185 261,185 (16,838) 95,068 130,593 (35,525) -27% 261,185
Total Capital Multi-year expenditure 233,352 292,652 292,652 (15,226) 108,743 146,326 (37,583) -26% 292,652
Single Year expenditure appropriation
Vote 1 - Vote 1 - EXECUTIVE & COUNCIL – 1,000 1,000 – 930 500 430 86% 1,000
Vote 2 - Vote 2 - BUDGET & TREASURY OFFICE 1,900 210 210 – 152 105 47 44% 210
Vote 3 - Vote 3 - CORPORATE SERVICES 1,473 3,406 3,406 1,539 1,582 1,703 (121) -7% 3,406
Vote 4 - Vote 4 - PLANNING AND DEVELOPMENT 2,671 4,665 4,665 – 589 2,333 (1,743) -75% 4,665
Vote 5 - Vote 5 - COMMUNITY & SOCIAL SERVICES 29,618 9,043 9,043 189 2,628 4,522 (1,894) -42% 9,043
Vote 6 - Vote 6 - INFRASTRUCTURE & DEVELOPMENT 66,986 43,429 43,429 6,125 15,623 21,715 (6,091) -28% 43,429
Total Capital single-year expenditure 102,648 61,753 61,753 7,854 21,504 30,877 (9,373) -30% 61,753
Total Capital Expenditure 335,999 354,405 354,405 (7,373) 130,246 177,202 (46,956) -26% 354,405
Capital Expenditure - Standard Classification
Governance and administration 3,373 4,616 4,616 1,539 2,663 2,308 355 15% 4,616
Executive and council – 1,000 1,000 – 930 500 430 86% 1,000
Budget and treasury office 1,900 210 210 – 152 105 47 44% 210
Corporate services 1,473 3,406 3,406 1,539 1,582 1,703 (121) -7% 3,406
Community and public safety 376 2,800 2,800 – 2,153 1,400 753 54% 2,800
Community and social services 376 – – – – – – –
Sport and recreation – – – – – – – –
Public safety – 2,800 2,800 – 2,153 1,400 753 54% 2,800
Housing –
Health –
Economic and environmental services 122,842 86,180 86,180 (7,955) 45,210 43,090 2,120 5% 86,180
Planning and development 37,141 32,274 32,274 1,800 13,726 16,137 (2,411) -15% 32,274
Road transport 83,510 52,825 52,825 (9,756) 31,484 26,413 5,072 19% 52,825
Environmental protection 2,190 1,080 1,080 – – 540 (540) -100% 1,080
Trading services 209,408 260,809 260,809 (957) 80,219 130,404 (50,185) -38% 260,809
Electricity 14,310 18,615 18,615 – 2,065 9,308 (7,242) -78% 18,615
Water 192,770 204,494 204,494 (382) 76,976 102,247 (25,271) -25% 204,494
Waste water management – 30,800 30,800 (575) 166 15,400 (15,234) -99% 30,800
Waste management 2,328 6,900 6,900 – 1,012 3,450 (2,438) -71% 6,900
Other –
Total Capital Expenditure - Standard Classification 335,999 354,405 354,405 (7,373) 130,246 177,202 (46,956) -26% 354,405
Funded by:
National Government 317,121 324,571 324,571 (9,101) 123,086 162,285 (39,199) -24% 324,571
Provincial Government –
District Municipality –
Other transfers and grants –
Transfers recognised - capital 317,121 324,571 324,571 (9,101) 123,086 162,285 (39,199) -24% 324,571
Public contributions & donations –
Borrowing –
Internally generated funds 18,878 29,834 29,834 1,728 7,160 14,917 (7,757) -52% 29,834
Total Capital Funding 335,999 354,405 354,405 (7,373) 130,246 177,202 (46,956) -26% 354,405
MP324 Nkomazi - Table C5 Monthly Budget Statement - Capital Expenditure (municipal vote, standard classification and funding) - Mid-Year Assessment
Vote Description

NLM Mid-Year Budget Performance Report (2016/17) as at 31 December 2016 Page 25
Vote Description 2015/16
R thousandAudited
Outcome
Original
Budget
Adjusted
BudgetMonthly actual YearTD actual YearTD budget YTD variance YTD variance
Full Year
Forecast
%
Capital expenditure - Municipal Vote
Expenditure of multi-year capital appropriation
Vote 5 - Vote 5 - COMMUNITY & SOCIAL SERVICES 9,818 31,466 31,466 1,611 13,675 15,733 (2,059) -13% 31,466
5.1 - Socio Economic & Development (Licencing & Regulation) 9,792 26,466 26,466 1,611 12,662 13,233,221 (571) -4% 26,466
5.9 - Solid waste 26 5,000 5,000 – 1,012 2,500 (1,488) -60% 5,000
5.10 - Vehicle Licensing & Testing – – – – –
Vote 6 - Vote 6 - INFRASTRUCTURE & DEVELOPMENT 223,533 261,185 261,185 (16,838) 95,068 130,593 (35,525) -27% 261,185
6.1 - Civil Administration – – – – –
6.2 - Sewerage 30,000 30,000 (575) 166 15,000 (14,834) -99% 30,000
6.3 - Roads 60,739 50,165 50,165 (9,756) 31,484 25,083 6,402 26% 50,165
6.4 - water Distribution 162,472 181,020 181,020 (6,507) 63,418 90,510 (27,092) -30% 181,020
6.5 - Electricity Distribution 322 – – – –
6.6 - Project Management Unit (PMU) – – – –
–
–
Total multi-year capital expenditure 233,352 292,652 292,652 (15,226) 108,743 146,326 (37,583) -26% 292,652 –
Capital expenditure - Municipal Vote
Expenditue of single-year capital appropriation –
Vote 1 - Vote 1 - EXECUTIVE & COUNCIL – 1,000 1,000 – 930 500 430 86% 1,000
1.1 - Mayor & Council 1,000 1,000 – 930 500 430 86% 1,000
1.2 - Office of the Speaker –
1.3 - Office of the Chief Whip –
1.4 - Municipal Manager –
1.5 - Extended Public Works Programme (EPWP) –
–
Vote 2 - Vote 2 - BUDGET & TREASURY OFFICE 1,900 210 210 – 152 105 47 44% 210
2.1 - Finance 1,900 210 210 – 152 105 47 44% 210
2.2 - Assessment Rates – – – –
2.3 - Finance Management Grant (FMG) – – – –
2.4 - Municipal Systems Improvement Grant (MSIG) – – – –
–
Vote 3 - Vote 3 - CORPORATE SERVICES 1,473 3,406 3,406 1,539 1,582 1,703 (121) -7% 3,406
3.1 - Corporate Services 1,473 3,406 3,406 1,539 1,582 1,703 (121) -7% 3,406
3.2 - Property Services –
–
Vote 4 - Vote 4 - PLANNING AND DEVELOPMENT 2,671 4,665 4,665 – 589 2,333 (1,743) -75% 4,665
4.1 - Town Planning 2,671 4,465 4,465 – 589 2,233 (1,643) -74% 4,465
4.2 - Local Economic Development (LED) 200 200 – – 100 (100) -100% 200
4.3 - Integrated Development Planning (IDP) –
4.4 - Performance Management System (PMS) –
–
Vote 5 - Vote 5 - COMMUNITY & SOCIAL SERVICES 29,618 9,043 9,043 189 2,628 4,522 (1,894) -42% 9,043
5.1 - Socio Economic & Development (Licencing & Regulation) 24,678 1,063 1,063 189 474 532 (57) -11% 1,063
5.2 - Libriaries & Archives – –
5.3 - Cemeteries 376 – –
5.4 - Disaster Management 1,200 1,200 600 (600) -100% 1,200
5.5 - Protection Services (Police) 1,600 1,600 800 (800) -100% 1,600
5.6 - Fire – – – 2,153 – 2,153 #DIV/0! –
5.7 - Parks – – – – –
5.8 - Nature conservation 2,190 1,080 1,080 540 (540) -100% 1,080
5.9 - Solid waste 2,302 1,900 1,900 950 (950) -100% 1,900
5.10 - Vehicle Licensing & Testing 71 2,200 2,200 1,100 (1,100) -100% 2,200
Vote 6 - Vote 6 - INFRASTRUCTURE & DEVELOPMENT 66,986 43,429 43,429 6,125 15,623 21,715 (6,091) -28% 43,429
6.1 - Civil Administration 80 80 40 (40) -100% 80
6.2 - Sewerage 800 800 400 (400) -100% 800
6.3 - Roads 22,700 460 460 230 (230) -100% 460
6.4 - water Distribution 30,297 23,474 23,474 6,125 13,558 11,737 1,821 16% 23,474
6.5 - Electricity Distribution 13,989 18,615 18,615 – 2,065 9,308 (7,242) -78% 18,615
6.6 - Project Management Unit (PMU) –
–
Total single-year capital expenditure 102,648 61,753 61,753 7,854 21,504 30,877 (9,373) (0) 61,753 –
Total Capital Expenditure 335,999 354,405 354,405 (7,373) 130,246 177,202 (46,956) (0) 354,405
Budget Year 2016/17
MP324 Nkomazi - Table C5 Monthly Budget Statement - Capital Expenditure (municipal vote, standard classification and funding) - A - Mid-Year Assessment

NLM Mid-Year Budget Performance Report (2016/17) as at 31 December 2016 Page 26
Table C6 Monthly Budget Statement-Financial Position
2015/16 Budget Year 2016/17
Audited
Outcome
Original
Budget
Adjusted
BudgetYearTD actual
Full Year
Forecast
R thousands
ASSETS
Current assets
Cash 60,080 69,980 69,980 216,046 69,980
Call investment deposits 5,000 5,000 5,000 – 5,000
Consumer debtors 140,827 227,043 227,043 138,250 227,043
Other debtors 87,292 6,323 6,323 56,357 6,323
Current portion of long-term receivables – 9,016 9,016 9,016
Inventory 2,991 822 822 6,967 822
Total current assets 296,189 318,185 318,185 417,620 318,185
Non current assets
Long-term receivables
Investments
Investment property 44,495 44,798 44,798 46,446 44,798
Investments in Associate
Property, plant and equipment 1,595,982 2,348,924 2,348,924 1,724,278 2,348,924
Agricultural
Biological assets
Intangible assets 390 1,080 1,080 390 1,080
Other non-current assets 1,704 1,752 1,752 1,622 1,752
Total non current assets 1,642,572 2,396,553 2,396,553 1,772,736 2,396,553
TOTAL ASSETS 1,938,761 2,714,738 2,714,738 2,190,357 2,714,738
LIABILITIES
Current liabilities
Bank overdraft
Borrowing 922 291 291 13,583 291
Consumer deposits 3,556 2,990
Trade and other payables 316,743 94,390 94,390 402,351 94,390
Provisions 40,841 43,683 43,683 66,179 43,683
Total current liabilities 362,063 138,365 138,365 485,103 138,365
Non current liabilities
Borrowing 1,612 1,439 1,439 1,302 1,439
Provisions 38,061 58,615 58,615 58,615
Total non current liabilities 39,674 60,054 60,054 1,302 60,054
TOTAL LIABILITIES 401,736 198,419 198,419 486,405 198,419
NET ASSETS 1,537,025 2,516,318 2,516,318 1,703,952 2,516,318
COMMUNITY WEALTH/EQUITY
Accumulated Surplus/(Deficit) 1,537,025 2,516,318 2,516,318 1,703,952 2,516,318
Reserves – – –
TOTAL COMMUNITY WEALTH/EQUITY 1,537,025 2,516,318 2,516,318 1,703,952 2,516,318
Description
MP324 Nkomazi - Table C6 Monthly Budget Statement - Financial Position - Mid-Year Assessment
Table C7 Monthly Budget Statement-Cash flow

NLM Mid-Year Budget Performance Report (2016/17) as at 31 December 2016 Page 27
2015/16 Budget Year 2016/17
Audited
Outcome
Original
Budget
Adjusted
BudgetMonthly actual YearTD actual YearTD budget
YTD
variance
YTD
variance
Full Year
Forecast
R thousands %
CASH FLOW FROM OPERATING ACTIVITIES
Receipts
Property rates, penalties & collection charges 94,705 64,606 64,606 4,630 33,089 32,163 926 3% 64,606
Service charges 103,396 109,868 109,868 11,201 54,123 54,676 (553) -1% 109,868
Other revenue 85,446 30,404 30,404 25,958 182,633 16,914 165,720 980% 30,404
Government - operating 438,983 460,207 460,207 147,154 339,457 368,166 (28,709) -8% 460,207
Government - capital 300,580 324,571 324,571 77,138 257,211 259,657 (2,446) -1% 324,571
Interest 7,003 7,085 7,085 – 920 1,888 (969) -51% 7,085
Dividends – – – – – –
Payments
Suppliers and employees (655,003) (621,237) (621,237) (152,485) (597,066) (313,002) 284,065 -91% (621,237)
Finance charges (8,388) (469) (469) (39) (416) (235) 181 -77% (469)
Transfers and Grants (235) (235) – – – – (235)
NET CASH FROM/(USED) OPERATING ACTIVITIES 366,721 374,800 374,800 113,558 269,951 420,227 150,276 36% 374,800
CASH FLOWS FROM INVESTING ACTIVITIES
Receipts
Proceeds on disposal of PPE 1,976 –
Decrease (Increase) in non-current debtors (4,779) –
Decrease (increase) other non-current receivables –
Decrease (increase) in non-current investments –
Payments
Capital assets (335,999) (354,405) (354,405) (7,373) (148,918) (177,202) (28,285) 16% (354,405)
NET CASH FROM/(USED) INVESTING ACTIVITIES (338,802) (354,405) (354,405) (7,373) (148,918) (177,202) (28,285) 16% (354,405)
CASH FLOWS FROM FINANCING ACTIVITIES
Receipts
Short term loans –
Borrowing long term/refinancing –
Increase (decrease) in consumer deposits –
Payments
Repayment of borrowing (954) (291) (291) – – – – (291)
NET CASH FROM/(USED) FINANCING ACTIVITIES (954) (291) (291) – – – – (291)
NET INCREASE/ (DECREASE) IN CASH HELD 26,965 20,103 20,103 106,186 121,033 243,024 20,103
Cash/cash equivalents at beginning: 38,114 54,877 54,877 65,080 54,877 65,080
Cash/cash equivalents at month/year end: 65,080 74,980 74,980 186,113 297,901 85,183
Description
MP324 Nkomazi - Table C7 Monthly Budget Statement - Cash Flow - Mid-Year Assessment

NLM Mid-Year Budget Performance Report (2016/17) as at 31 December 2016 Page 28
PART 2 - SUPPORTING
DOCUMENTATION
Table SC1 –SC13 Supporting Documentation
NLM Mid-Year Budget Performance Report (2016/17) as at 31 December 2016 Page 29
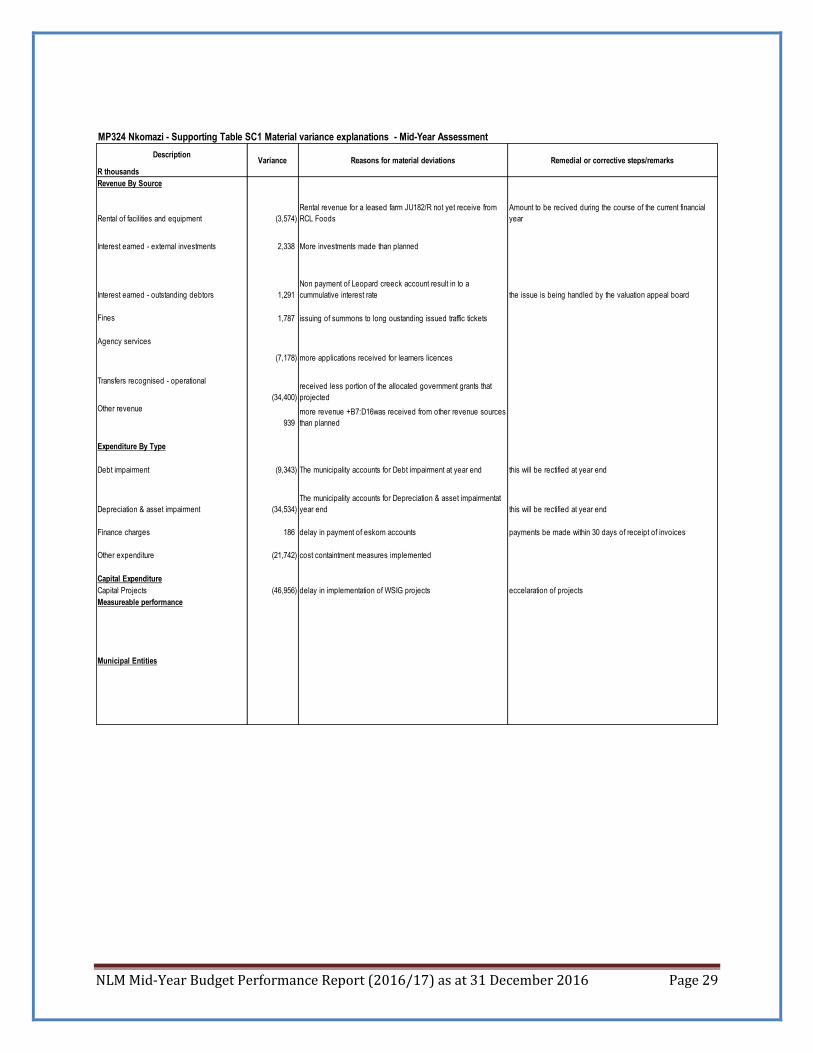
Variance Reasons for material deviations Remedial or corrective steps/remarks
R thousands
Revenue By Source
Rental of facilities and equipment (3,574)
Rental revenue for a leased farm JU182/R not yet receive from
RCL Foods
Amount to be recived during the course of the current financial
year
Interest earned - external investments 2,338 More investments made than planned
Interest earned - outstanding debtors 1,291
Non payment of Leopard creeck account result in to a
cummulative interest rate the issue is being handled by the valuation appeal board
Fines 1,787 issuing of summons to long oustanding issued traffic tickets
Agency services
(7,178) more applications received for learners licences
Transfers recognised - operational
(34,400)
received less portion of the allocated government grants that
projected
Other revenue
939
more revenue +B7:D16was received from other revenue sources
than planned
Expenditure By Type
Debt impairment (9,343) The municipality accounts for Debt impairment at year end this will be rectified at year end
Depreciation & asset impairment (34,534)
The municipality accounts for Depreciation & asset impairmentat
year end this will be rectified at year end
Finance charges 186 delay in payment of eskom accounts payments be made within 30 days of receipt of invoices
Other expenditure (21,742) cost containtment measures implemented
Capital Expenditure
Capital Projects (46,956) delay in implementation of WSIG projects eccelaration of projects
Measureable performance
Municipal Entities
Description
MP324 Nkomazi - Supporting Table SC1 Material variance explanations - Mid-Year Assessment

NLM Mid-Year Budget Performance Report (2016/17) as at 31 December 2016 Page 30
2015/16 Budget Year 2016/17
Audited
Outcome
Original
Budget
Adjusted
BudgetYearTD actual
Full Year
Forecast
Borrowing Management
Capital Charges to Operating Expenditure Interest & principal paid/Operating Expenditure 1.0% 9.8% 9.8% 0.1% 3.5%
Borrowed funding of 'own' capital expenditure Borrowings/Capital expenditure excl. transfers and
grants
0.0% 0.0% 0.0% 0.0% 0.0%
Safety of Capital
Debt to Equity Loans, Accounts Payable, Overdraft & Tax Provision/
Funds & Reserves
20.8% 3.8% 3.8% 24.5% 3.8%
Gearing Long Term Borrowing/ Funds & Reserves 0.0% 0.0% 0.0% 0.0% 0.0%
Liquidity
Current Ratio Current assets/current liabilities 81.8% 230.0% 230.0% 86.1% 230.0%
Liquidity Ratio Monetary Assets/Current Liabilities 18.0% 54.2% 54.2% 44.5% 54.2%
Revenue Management
Annual Debtors Collection Rate
(Payment Level %)
Last 12 Mths Receipts/ Last 12 Mths Billing
Outstanding Debtors to Revenue Total Outstanding Debtors to Annual Revenue 30.4% 32.6% 32.6% 41.7% 32.6%
Longstanding Debtors Recovered Debtors > 12 Mths Recovered/Total Debtors >
12 Months Old
0.0% 0.0% 0.0% 0.0% 0.0%
Creditors Management
Creditors System Efficiency % of Creditors Paid Within Terms (within MFMA s 65(e))
Funding of Provisions
Percentage Of Provisions Not Funded Unfunded Provisions/Total Provisions
Other Indicators
Electricity Distribution Losses % Volume (units purchased and generated less units
sold)/units purchased and generated
Water Distribution Losses % Volume (units purchased and own source less units
sold)/Total units purchased and own source
Employee costs Employee costs/Total Revenue - capital revenue 39.0% 38.7% 38.7% 33.7% 38.7%
Repairs & Maintenance R&M/Total Revenue - capital revenue 0.0% 0.0% 0.0% 0.0% 0.0%
Interest & Depreciation I&D/Total Revenue - capital revenue 9.6% 9.4% 9.4% 0.1% 3.3%
IDP regulation financial viability indicators
i. Debt coverage (Total Operating Revenue - Operating Grants)/Debt
service payments due within financial year)
ii. O/S Service Debtors to Revenue Total outstanding service debtors/annual revenue
received for services
iii. Cost coverage (Available cash + Investments)/monthly fixed
operational expenditure
Monetary assets 65,080 74,980 74,980 216,046 74,980
Total Revenue (excluding capital transfers and contributions) 749,259 743,130 743,130 466,232 743,130
Transfers recognised - operational 437,255 460,207 460,207 334,091 460,207
Transfers recognised - capital 300,580 324,571 324,571 324,571
Debt service payments 6,049 6,793 6,793 (416) (761)
Outstanding debtors (receivables) 228,119 242,382 242,382 194,608 242,382
Annual services revenue 105,243 116,566 116,566 58,553
Cash + investments Including LT investments 65,080 74,980 74,980 216,046 74,980
Fixed operational expend. (monthly)
Longstanding debtors outstanding
Longstanding debtors recovered
Attorney collections
Description of financial indicator Basis of calculation
MP324 Nkomazi - Supporting Table SC2 Monthly Budget Statement - performance indicators - Mid-Year Assessment
NLM Mid-Year Budget Performance Report (2016/17) as at 31 December 2016 Page 31
Description
R thousands
NT
Code0-30 Days 31-60 Days 61-90 Days 91-120 Days Total
Total
over 90 days
Actual Bad Debts
Written Off
against Debtors
Impairment - Bad
Debts i.t.o
Council Policy
Debtors Age Analysis By Income Source
Trade and Other Receivables from Exchange Transactions - Water 1200 1,112 796 335 3,206 5,450 3,206 – –
Trade and Other Receivables from Exchange Transactions - Electricity 1300 6,966 1,416 630 1,922 10,933 1,922 – –
Receivables from Non-exchange Transactions - Property Rates 1400 5,472 3,815 3,518 103,106 115,911 103,106 – –
Receivables from Exchange Transactions - Waste Water Management 1500 364 136 83 614 1,198 614 – –
Receivables from Exchange Transactions - Waste Management 1600 407 137 89 514 1,147 514 – –
Receivables from Exchange Transactions - Property Rental Debtors 1700 – – – –
Interest on Arrear Debtor Accounts 1810 1,314 1,254 1,214 13,289 17,072 13,289 – –
Recoverable unauthorised, irregular, fruitless and wasteful expenditure 1820 – – – –
Other 1900 279 290 162 2,837 3,568 2,837 – –
Total By Income Source 2000 15,914 7,844 6,031 125,489 155,278 125,489 – –
2015/16 - totals only – –
Debtors Age Analysis By Customer Group
Organs of State 2200 2,283 2,417 2,037 29,107 35,844 29,107 – –
Commercial 2300 6,016 2,007 1,345 54,341 63,709 54,341 – –
Households 2400 5,842 2,234 1,598 11,344 21,018 11,344 – –
Other 2500 1,773 1,185 1,051 30,697 34,707 30,697 – –
Total By Customer Group 2600 15,914 7,844 6,031 125,489 155,278 125,489 – –
MP324 Nkomazi - Supporting Table SC3 Monthly Budget Statement - aged debtors - Mid-Year Assessment
Budget Year 2016/17

NLM Mid-Year Budget Performance Report (2016/17) as at 31 December 2016 Page 32
Budget Year 2016/17
R thousands
Creditors Age Analysis By Customer Type
Bulk Electricity 0100 1,938 – – – 1,938
Bulk Water 0200 292 – – – 292
PAYE deductions 0300 3,425 – – – 3,425
VAT (output less input) 0400 – – – – –
Pensions / Retirement deductions 0500 3,085 – – – 3,085
Loan repayments 0600 – – – – –
Trade Creditors 0700 23,403 6,333 139 18,957 48,832
Auditor General 0800 – – – – –
Other 0900 – – – – –
Total By Customer Type 1000 32,144 6,333 139 18,957 57,573
NT
Code0 -
30 Days
31 -
60 Days
Prior year totals
for chart (same
period)
MP324 Nkomazi - Supporting Table SC4 Monthly Budget Statement - aged creditors - Mid-Year Assessment
Total61 -
90 Days
91 -
120 Days
Description

NLM Mid-Year Budget Performance Report (2016/17) as at 31 December 2016 Page 33
Investments by maturity
Name of institution & investment ID
Period of
Investment
R thousands Yrs/Months
Municipality
Absa 365 days fixed 29/11/2017 314 7.5% 5,000 5,000
Absa 61 days fixed 23/01/2017 158 7.6% 20,000 20,000
Municipality sub-total 473 25,000 – 25,000
Entities
Entities sub-total – – – –
TOTAL INVESTMENTS AND INTEREST 473 25,000 – 25,000
MP324 Nkomazi - Supporting Table SC5 Monthly Budget Statement - investment portfolio - Mid-Year AssessmentType of
Investment
Expiry date of
investment
Market value
at end of the
month
Accrued
interest to-
date
Yield for the
month 1
(%)
Market value
at beginning
of the month
Change in
market value

NLM Mid-Year Budget Performance Report (2016/17) as at 31 December 2016 Page 34
2015/16 Budget Year 2016/17
Audited
Outcome
Original
Budget
Adjusted
BudgetMonthly actual YearTD actual YearTD budget
YTD
variance
YTD
variance
Full Year
Forecast
R thousands %
RECEIPTS:
Operating Transfers and Grants
National Government: 435,375 460,207 460,207 147,154 343,438 368,491 (24,460) -6.6% 460,207
Local Government Equitable Share 423,037 447,689 447,689 147,154 333,691 358,151 (24,460) -6.8% 447,689
Finance Management 1,600 1,625 1,625 – 1,625 1,625 1,625
EPWP Incentive 4,762 5,917 5,917 – 4,141 4,734 5,917
MIG-PMU Operational 5,046 4,976 4,976 – 3,981 3,981 4,976
–
Municipal Systems Infrastructure Grant 930 –
Provincial Government: – – – – – – – –
–
Other grant providers: 3,608 – – – – – – –
LGSETA Learnership grant 1,728 –
HIV Grant (IOM) 1,880
Total Operating Transfers and Grants 438,983 460,207 460,207 147,154 343,438 368,491 (24,460) -6.6% 460,207
Capital Transfers and Grants
National Government: 300,580 324,571 324,571 20,000 253,230 259,657 (12,227) -4.7% 324,571
Municipal Infrastructure Grant (MIG) 214,334 211,379 211,379 – 203,182 169,103 34,079 20.2% 211,379
Intergrated National Electrification Programmee 10,229 9,000 9,000 – 9,000 7,200 9,000
Municipal Disaster Recovery Grant 20,000 20,000 20,000 20,000 20,000 16,000 20,000
Water Services Infrastructure Grant – 84,192 84,192 – 21,048 67,354 (46,306) -68.8% 84,192
Municipal Water Infrastrucutre Grant 51,279 –
Rural Household Infrastructure Grant 4,737 –
–
–
Total Capital Transfers and Grants 300,580 324,571 324,571 20,000 253,230 259,657 (12,227) -4.7% 324,571
TOTAL RECEIPTS OF TRANSFERS & GRANTS 739,563 784,778 784,778 167,154 596,668 628,147 (36,687) -5.8% 784,778
Description
MP324 Nkomazi - Supporting Table SC6 Monthly Budget Statement - transfers and grant receipts - Mid-Year Assessment

NLM Mid-Year Budget Performance Report (2016/17) as at 31 December 2016 Page 35
2015/16 Budget Year 2016/17
Audited
Outcome
Original
Budget
Adjusted
BudgetMonthly actual YearTD actual YearTD budget
YTD
variance
YTD
variance
Full Year
Forecast
R thousands %
EXPENDITURE
Operating expenditure of Transfers and Grants
National Government: 435,375 460,207 460,207 38,587 232,071 230,104 1,968 0.9% 460,207
Local Government Equitable Share 423,037 447,689 447,689 37,307 223,845 223,845 – 447,689
Finance Management 1,600 1,625 1,625 93 588 813 (225) -27.7% 1,625
EPWP Incentive 4,762 5,917 5,917 803 5,111 2,959 2,153 72.8% 5,917
MIG-PMU Operational 5,046 4,976 4,976 383 2,528 2,488 40 1.6% 4,976
– –
Municipal Systems Infrastructure Grant 930 –
Other grant providers: 3,608 – – – – – – –
LGSETA Learnership grant 1,728 –
HIV Grant (IOM) 1,880 –
Total operating expenditure of Transfers and Grants: 438,983 460,207 460,207 38,587 232,071 230,104 1,968 0.9% 460,207
Capital expenditure of Transfers and Grants
National Government: 300,580 324,571 324,571 94,714 210,164 162,285 47,878 29.5% 324,571
Municipal Infrastructure Grant (MIG) 214,334 211,379 211,379 78,514 189,517 105,689 83,828 79.3% 211,379
Intergrated National Electrification Programmee 10,229 9,000 9,000 – 895 4,500 (3,605) -80.1% 9,000
Municipal Disaster Recovery Grant 20,000 20,000 20,000 13,595 15,133 10,000 5,133 51.3% 20,000
Water Services Infrastructure Grant – 84,192 84,192 2,605 4,618 42,096 (37,478) -89.0% 84,192
Municipal Water Infrastrucutre Grant 51,279
Rural Household Infrastructure Grant 4,737 –
–
–
Total capital expenditure of Transfers and Grants 300,580 324,571 324,571 94,714 210,164 162,285 47,878 29.5% 324,571
TOTAL EXPENDITURE OF TRANSFERS AND GRANTS 739,563 784,778 784,778 133,301 442,235 392,389 49,846 12.7% 784,778
Description
MP324 Nkomazi - Supporting Table SC7(1) Monthly Budget Statement - transfers and grant expenditure - Mid-Year Assessment

NLM Mid-Year Budget Performance Report (2016/17) as at 31 December 2016 Page 36
Approved
Rollover 2015/16Monthly actual YearTD actual YTD variance YTD variance
R thousands %
EXPENDITURE
Operating expenditure of Approved Roll-overs
National Government: – – – –
Local Government Equitable Share –
Finance Management –
EPWP Incentive –
MIG-PMU Operational –
–
–
Municipal Systems Infrastructure Grant –
Provincial Government: – – – –
–
–
–
–
Other transfers and grants [insert description] –
District Municipality: – – – –
–
[insert description] –
Other grant providers: – – – –
–
LGSETA Learnership grant –
Total operating expenditure of Approved Roll-overs – – – –
Capital expenditure of Approved Roll-overs
National Government: 29,125 6,472 16,834 12,291 42.2%
Municipal Infrastructure Grant (MIG) –
Water Services Infrastructure Grant –
Municipal Water Infrastrucutre Grant 29,125 6,472 16,834 12,291 42.2%
Rural Household Infrastructure Grant –
–
–
Provincial Government: – – – –
–
–
District Municipality: – – – –
–
–
Other grant providers: – – – –
–
–
Total capital expenditure of Approved Roll-overs 29,125 6,472 16,834 12,291 42.2%
TOTAL EXPENDITURE OF APPROVED ROLL-OVERS 29,125 6,472 16,834 12,291 42.2%
MP324 Nkomazi - Supporting Table SC7(2) Monthly Budget Statement - Expenditure against approved rollovers - Mid-Year Assessment
Description
Budget Year 2016/17

NLM Mid-Year Budget Performance Report (2016/17) as at 31 December 2016 Page 37
2015/16 Budget Year 2016/17
Audited
Outcome
Original
Budget
Adjusted
BudgetMonthly actual YearTD actual YearTD budget
YTD
variance
YTD
variance
Full Year
Forecast
R thousands %
A B C D
Councillors (Political Office Bearers plus Other)
Basic Salaries and Wages 12,530 14,267 14,267 952 6,111 7,133 (1,023) -14% 14,267
Pension and UIF Contributions 1,879 2,136 2,136 143 882 1,068 (186) -17% 2,136
Medical Aid Contributions 521 627 627 20 174 313 (139) -44% 627
Motor Vehicle Allowance 5,045 5,741 5,741 365 2,441 2,870 (429) -15% 5,741
Cellphone Allowance 1,354 1,529 1,529 113 737 765 (27) -4% 1,529
Housing Allowances – – – – – – –
Other benefits and allowances – – – – – – –
Sub Total - Councillors 21,329 24,299 24,299 1,593 10,345 12,149 (1,804) -15% 24,299
% increase 13.9% 13.9%
Senior Managers of the Municipality
Basic Salaries and Wages 3,386 5,530 5,530 217 1,302 2,765 (1,464) -53% 5,530
Pension and UIF Contributions 662 1,134 1,134 57 343 567 (223) -39% 1,134
Medical Aid Contributions 122 141 141 14 85 70 14 20% 141
Overtime – – – – – – – –
Performance Bonus 278 461 461 – – 230 (230) -100% 461
Motor Vehicle Allowance 452 815 815 32 193 408 (214) -53% 815
Cellphone Allowance – 51 51 – – 26 (26) -100% 51
Housing Allowances – – – – – – – –
Other benefits and allowances 27 1 1 – – 0 (0) -100% 1
Payments in lieu of leave – – – – – – –
Long service awards – – – – – – – –
Post-retirement benefit obligations – – – – – – – –
Sub Total - Senior Managers of Municipality 4,926 8,133 8,133 321 1,923 4,066 (2,143) -53% 8,133
% increase 65.1% 65.1%
Other Municipal Staff
Basic Salaries and Wages 167,183 175,912 175,912 15,351 92,253 87,956 4,297 5% 175,912
Pension and UIF Contributions 33,590 37,559 37,559 3,030 18,038 18,779 (742) -4% 37,559
Medical Aid Contributions 13,159 12,092 12,092 898 5,791 6,046 (255) -4% 12,092
Overtime 35,273 16,489 16,489 2,104 13,629 8,245 5,385 65% 16,489
Performance Bonus 13,212 14,229 14,229 – 13,197 14,229 (1,032) -7% 14,229
Motor Vehicle Allowance 11,139 12,801 12,801 1,116 6,521 6,401 120 2% 12,801
Cellphone Allowance 1,764 1,962 1,962 167 992 981 10 1% 1,962
Housing Allowances 2,628 1,244 1,244 208 932 622 310 50% 1,244
Other benefits and allowances 2,433 2,741 2,741 732 3,388 1,601 1,787 112% 2,741
Payments in lieu of leave 4,113 1,692 1,692 – 360 846 (486) -57% 1,692
Long service awards 2,413 2,451 2,451 – 127 1,226 (1,099) -90% 2,451
Post-retirement benefit obligations 153 150 150 – – 75 (75) -100% 150
Sub Total - Other Municipal Staff 287,060 279,322 279,322 23,606 155,228 147,006 8,222 6% 279,322
% increase -2.7% -2.7%
Total Parent Municipality 313,315 311,754 311,754 25,520 167,497 163,222 4,275 3% 311,754
-0.5% -0.5% -0.5%Unpaid salary, allowances & benefits in arrears:
TOTAL SALARY, ALLOWANCES & BENEFITS 313,315 311,754 311,754 25,520 167,497 163,222 4,275 3% 311,754
% increase 100.0% -0.5% -0.5%
TOTAL MANAGERS AND STAFF 291,986 287,455 287,455 23,927 157,151 151,072 6,079 4% 287,455
Summary of Employee and Councillor remuneration
MP324 Nkomazi - Supporting Table SC8 Monthly Budget Statement - councillor and staff benefits - Mid-Year Assessment

NLM Mid-Year Budget Performance Report (2016/17) as at 31 December 2016 Page 38
MP324 Nkomazi - Supporting Table SC9 Monthly Budget Statement - actuals and revised targets for cash receipts - Mid-Year Assessment
July August Sept October Nov Dec January Feb March April May June
R thousands Outcome Outcome Outcome Outcome Outcome Outcome Budget Budget Budget Budget Budget Budget
Cash Receipts By Source
Property rates 3,941 5,233 9,969 4,227 5,088 4,630 6,231 5,642 5,164 4,679 5,307 4,493 64,606 68,353 72,318
Property rates - penalties & collection charges – – – – – – – – – – – – – – –
Service charges - electricity revenue 4,458 6,451 6,401 6,458 7,561 7,594 6,902 7,024 6,987 7,266 6,902 9,428 83,434 90,109 97,467
Service charges - water revenue 1,426 1,451 1,430 1,463 1,844 2,876 1,371 1,396 1,381 1,354 1,324 (951) 16,364 17,510 18,736
Service charges - sanitation revenue 374 349 350 340 392 339 357 357 357 357 357 357 4,287 4,587 4,908
Service charges - refuse 404 485 432 390 463 392 482 481 482 481 480 811 5,782 6,361 6,997
Service charges - other – – – – – – – – – – – – – – –
Rental of facilities and equipment 2 116 112 1,959 130 113 552 242 255 274 280 2,791 6,826 7,304 7,815
Interest earned - external investments – – – – – – – – – – – 3,308 3,308 3,540 3,787
Interest earned - outstanding debtors 137 783 – – – – 315 315 315 315 315 1,283 3,777 4,041 4,324
Dividends received – – – – – – – – – – – – – 0 0
Fines 735 730 649 554 783 862 368 393 394 401 393 (1,700) 4,562 4,881 5,223
Licences and permits 0 1 – 1 – 0 1 1 2 2 2 8 18 20 21
Agency services 1,528 2,494 4,199 1,501 3,375 1,325 723 964 1,204 482 964 (6,713) 12,045 12,888 13,790
Transfer receipts - operating 186,537 3,104 – – 2,662 147,154 – – 92,041 – – 28,709 460,207 501,202 542,022
Other revenue 8,649 10,973 31,829 50,798 35,558 23,659 707 719 626 843 417 (157,824) 6,953 7,659 8,423
Cash Receipts by Source 208,192 32,170 55,371 67,690 57,855 188,944 18,010 17,534 109,209 16,452 16,741 (115,998) 672,170 728,453 785,830 –
Other Cash Flows by Source –
Transfer receipts - capital 84,615 – 65,410 29,648 400 77,138 – – 64,914 – – 2,446 324,571 367,807 369,035
Contributions & Contributed assets –
Proceeds on disposal of PPE –
Short term loans –
Borrowing long term/refinancing –
Increase in consumer deposits –
Receipt of non-current debtors –
Receipt of non-current receivables –
Change in non-current investments –
Total Cash Receipts by Source 292,807 32,170 120,781 97,338 58,255 266,082 18,010 17,534 174,123 16,452 16,741 (113,553) 996,740 1,096,260 1,154,865 –
Cash Payments by Type –
Employee related costs 23,714 23,825 23,503 24,182 37,640 23,927 22,730 22,730 22,730 22,730 22,730 17,012 287,455 306,910 327,939
Remuneration of councillors 2,295 2,033 2,181 1,597 1,601 1,593 2,025 2,025 2,025 2,025 2,025 2,874 24,299 25,951 27,716
Interest paid 4 42 251 30 51 39 39 39 39 39 39 (142) 469 496 525
Bulk purchases - Electricity 3 7,215 8,381 4,972 5,257 6,112 7,229 7,229 7,229 7,229 7,229 18,667 86,753 93,694 101,189
Bulk purchases - Water & Sewer – 98 – 123 13 – 108 108 108 108 108 521 1,295 1,370 1,449
Other materials 30 171 376 11 107 55 197 197 197 197 197 633 2,369 2,506 2,652
Contracted services – 5,136 2,729 2,701 3,073 686 2,768 2,768 2,768 2,768 2,768 5,054 33,221 35,148 37,187
Grants and subsidies paid - other municipalities – – – – – – – – – –
Grants and subsidies paid - other – – – – – – 235 – 235 248 263
General expenses 110,321 25,938 63,186 28,020 34,152 120,112 15,487 15,487 15,487 15,487 15,487 (273,318) 185,845 194,193 205,448
Cash Payments by Type 136,366 64,457 100,607 61,635 81,894 152,523 50,819 50,585 50,585 50,585 50,585 (228,699) 621,941 660,517 704,367 –
Other Cash Flows/Payments by Type
Capital assets 31,968 32,981 32,541 19,196 24,859 7,373 29,534 29,534 29,534 29,534 29,534 57,818 354,405 374,722 375,995
Repayment of borrowing – 73 218 291 482 885
Other Cash Flows/Payments –
Total Cash Payments by Type 168,334 97,437 133,148 80,831 106,754 159,896 80,353 80,191 80,118 80,118 80,118 (170,662) 976,637 1,035,720 1,081,248 –
NET INCREASE/(DECREASE) IN CASH HELD 124,473 (65,267) (12,366) 16,507 (48,498) 106,186 (62,343) (62,657) 94,005 (63,666) (63,377) 57,110 20,103 60,539 73,618
Cash/cash equivalents at the month/year beginning: 65,080 189,552 124,285 111,919 128,426 79,927 186,113 123,770 61,112 155,117 91,450 28,073 65,080 85,183 145,722
Cash/cash equivalents at the month/year end: 189,552 124,285 111,919 128,426 79,927 186,113 123,770 61,112 155,117 91,450 28,073 85,183 85,183 145,722 219,340
Budget Year
+1 2017/18
Budget Year
+2 2018/19
Description
Budget Year
2016/17
Budget Year 2016/172016/17 Medium Term Revenue &
Expenditure Framework

NLM Mid-Year Budget Performance Report (2016/17) as at 31 December 2016 Page 39
2015/16
Audited
Outcome
Original
Budget
Adjusted
BudgetMonthly actual YearTD actual YearTD budget
YTD
variance
YTD
variance
% spend of
Original
Budget
R thousands %
Monthly expenditure performance trend
July 24,388 24,388 28,042 28,042 24,388 (3,655) -15.0% 10%
August 24,388 24,388 32,981 61,023 48,775 (12,247) -25.1% 21%
September 24,388 24,388 32,541 93,564 73,163 (20,401) -27.9% 32%
October 24,388 24,388 19,196 112,760 97,551 (15,209) -15.6% 39%
November 24,388 24,388 24,859 137,619 121,938 (15,681) -12.9% 47%
December 24,388 24,388 (7,373) 146,326 –
January 24,388 24,388 170,714 –
February 24,388 24,388 195,101 –
March 24,388 24,388 219,489 –
April 24,388 24,388 243,877 –
May 24,388 24,388 268,264 –
June 24,388 24,388 292,652 –
Total Capital expenditure – 292,652 292,652 130,246
Month
MP324 Nkomazi - Supporting Table SC12 Monthly Budget Statement - capital expenditure trend - Mid-Year AssessmentBudget Year 2016/17

NLM Mid-Year Budget Performance Report (2016/17) as at 31 December 2016 Page 40
2015/16 Budget Year 2016/17
Audited
Outcome
Original
Budget
Adjusted
BudgetMonthly actual YearTD actual YearTD budget
YTD
variance
YTD
variance
Full Year
Forecast
R thousands %
Capital expenditure on new assets by Asset Class/Sub-class
Infrastructure 199,895 173,461 173,461 (15,381) 65,801 86,731 20,929 24.1% 173,461
Infrastructure - Road transport 81,106 52,165 52,165 (3,845) 31,316 26,083 (5,233) -20.1% 52,165
Roads, Pavements & Bridges 81,106 52,165 52,165 (3,845) 31,316 26,083 (5,233) -20.1% 52,165
Storm water –
Infrastructure - Electricity 12,086 6,500 6,500 – 387 3,250 2,863 88.1% 6,500
Generation –
Transmission & Reticulation 12,086 6,500 6,500 – 387 3,250 2,863 88.1% 6,500
Street Lighting –
Infrastructure - Water 106,703 103,996 103,996 (13,820) 30,802 51,998 21,196 40.8% 103,996
Dams & Reservoirs 20,499 – – – –
Water purification –
Reticulation 86,203 103,996 103,996 (13,820) 30,802 51,998 21,196 40.8% 103,996
Infrastructure - Sanitation – 10,800 10,800 2,285 3,297 5,400 2,103 38.9% 10,800
Reticulation 10,800 10,800 2,285 3,297 5,400 2,103 38.9% 10,800
Sewerage purification –
Infrastructure - Other – – – – – – – –
Waste Management – – – –
Transportation –
Gas –
Other –
Community 29,628 62,314 62,314 1,735 13,613 31,157 17,544 56.3% 62,314
Parks & gardens –
Sportsfields & stadia 5,138 3,979 3,979 258 1,288 1,989 701 35.2% 3,979
Swimming pools –
Community halls 24,490 19,255 19,255 2,052 11,374 9,628 (1,746) -18.1% 19,255
Libraries –
Recreational facilities –
Fire, safety & emergency –
Security and policing –
Buses –
Clinics –
Museums & Art Galleries –
Cemeteries –
Social rental housing –
Other 39,080 39,080 (575) 951 19,540 18,589 95.1% 39,080
Heritage assets – – – – – – – –
Buildings –
Other – –
Investment properties – – – – – – – –
Housing development –
Other –
Other assets 11,913 15,904 15,904 1,728 5,275 7,952 2,677 33.7% 15,904
General vehicles 6,580 1,400 1,400 – 3,083 700 (2,383) -340.4% 1,400
Specialised vehicles 2,302 2,700 2,700 – – 1,350 1,350 100.0% 2,700
Plant & equipment 108 4,255 4,255 2,128 2,128 100.0% 4,255
Computers - hardware/equipment 497 5,623 5,623 1,539 1,889 2,812 923 32.8% 5,623
Furniture and other office equipment 800 926 926 189 304 463 159 34.4% 926
Abattoirs –
Markets –
Civic Land and Buildings –
Other Buildings 1,000 1,000 500 500 100.0% 1,000
Other Land –
Surplus Assets - (Investment or Inventory) –
Other 1,626 –
Agricultural assets – – – – – – – –
List sub-class –
–
Biological assets – – – – – – – –
List sub-class –
–
Intangibles 266 650 650 – 16 325 309 95.1% 650
Computers - software & programming 266 650 650 – 16 325 309 95.1% 650
Other –
Total Capital Expenditure on new assets 241,702 252,329 252,329 (11,917) 84,706 126,165 41,459 32.9% 252,329
Specialised vehicles 2,302 2,700 2,700 – – 1,350 1,350 0 2,700
Refuse 2,302 1,500 1,500 – – 750 750 0 1,500
Fire 1,200 1,200 – – 600 600 0 1,200
Conservancy –
Ambulances –
Description
MP324 Nkomazi - Supporting Table SC13a Monthly Budget Statement - capital expenditure on new assets by asset class - Mid-Year Assessment

NLM Mid-Year Budget Performance Report (2016/17) as at 31 December 2016 Page 41
2015/16 Budget Year 2016/17
Audited
Outcome
Original
Budget
Adjusted
BudgetMonthly actual YearTD actual YearTD budget
YTD
variance
YTD
variance
Full Year
Forecast
R thousands %
Capital expenditure on renewal of existing assets by Asset Class/Sub-class
Infrastructure 88,287 74,943 74,943 (882) 31,393 37,471 6,078 16.2% 74,943
Infrastructure - Road transport 4,827 – – (3,874) 169 – (169) #DIV/0! –
Roads, Pavements & Bridges 4,827 (3,874) 169 (169) #DIV/0!
Storm water –
Infrastructure - Electricity 2,224 – – – 893 – (893) #DIV/0! –
Generation –
Transmission & Reticulation 2,224 – 893 (893) #DIV/0!
Street Lighting –
Infrastructure - Water 81,209 74,943 74,943 2,991 30,332 37,471 7,140 19.1% 74,943
Dams & Reservoirs 2,299 –
Water purification –
Reticulation 78,910 74,943 74,943 2,991 30,332 37,471 7,140 19.1% 74,943
Infrastructure - Sanitation – – – – – – – –
Reticulation –
Sewerage purification –
Infrastructure - Other 26 – – – – – – –
Waste Management 26 –
Transportation –
Gas –
Other –
Community 4,655 23,232 23,232 5,427 13,558 11,616 (1,942) -16.7% 23,232
Parks & gardens – 3,232
Sportsfields & stadia 4,655 3,232 3,232 (699) 0 1,616 1,616 100.0%
Swimming pools –
Community halls –
Libraries –
Recreational facilities –
Fire, safety & emergency –
Security and policing –
Buses –
Clinics –
Museums & Art Galleries –
Cemeteries –
Social rental housing – 20,000
Other 20,000 20,000 6,125 13,558 10,000 (3,558) -35.6%
Heritage assets – – – – – – – –
Buildings –
Other – –
Investment properties – – – – – – – –
Housing development –
Other –
Other assets 1,356 3,900 3,900 – 589 1,950 1,361 69.8% 3,900
General vehicles –
Specialised vehicles – – – – – – – –
Plant & equipment –
Computers - hardware/equipment –
Furniture and other office equipment –
Abattoirs –
Markets –
Civic Land and Buildings –
Other Buildings 1,356 3,900 3,900 – 589 1,950 1,361 69.8% 3,900
Other Land –
Surplus Assets - (Investment or Inventory) –
Other –
Agricultural assets – – – – – – – –
List sub-class –
–
Biological assets – – – – – – – –
List sub-class –
–
Intangibles – – – – – – – –
Computers - software & programming –
Other –
Total Capital Expenditure on renewal of existing assets 94,298 102,075 102,075 4,544 45,541 51,038 5,497 10.8% 102,075
MP324 Nkomazi - Supporting Table SC13b Monthly Budget Statement - capital expenditure on renewal of existing assets by asset class - Mid-Year
Description

NLM Mid-Year Budget Performance Report (2016/17) as at 31 December 2016 Page 42
2015/16 Budget Year 2016/17
Audited
Outcome
Original
Budget
Adjusted
BudgetMonthly actual YearTD actual YearTD budget
YTD
variance
YTD
variance
Full Year
Forecast
R thousands %
Repairs and maintenance expenditure by Asset Class/Sub-class
Infrastructure 16,317 22,565 22,565 1,128 6,311 11,282 4,971 44.1% 22,565
Infrastructure - Road transport 3,671 4,000 4,000 144 640 2,000 1,360 68.0% 4,000
Roads, Pavements & Bridges 3,671 4,000 4,000 144 640 2,000 1,360 68.0% 4,000
Storm water –
Infrastructure - Electricity 2,811 5,000 5,000 335 1,147 2,500 1,353 54.1% 5,000
Generation –
Transmission & Reticulation 2,811 5,000 5,000 335 1,147 2,500 1,353 54.1% 5,000
Street Lighting –
Infrastructure - Water 6,998 8,387 8,387 477 3,439 4,194 754 18.0% 8,387
Dams & Reservoirs –
Water purification –
Reticulation 6,998 8,387 8,387 477 3,439 4,194 754 18.0% 8,387
Infrastructure - Sanitation 1,999 2,868 2,868 – 388 1,434 1,046 72.9% 2,868
Reticulation 1,999 2,868 2,868 – 388 1,434 1,046 72.9% 2,868
Sewerage purification –
Infrastructure - Other 837 2,310 2,310 171 696 1,155 459 39.7% 2,310
Waste Management 837 2,310 2,310 171 696 1,155 459 39.7% 2,310
Transportation –
Gas –
Other –
Community 25 200 200 – 32 100 68 67.6% 200
Parks & gardens 25 200 200 – 32 100 68 67.6% 200
Sportsfields & stadia –
Swimming pools –
Community halls –
Libraries –
Recreational facilities –
Fire, safety & emergency –
Security and policing –
Buses –
Clinics –
Museums & Art Galleries –
Cemeteries –
Social rental housing –
Other –
Heritage assets – – – – – – – –
Buildings –
Other – –
Investment properties – – – – – – – –
Housing development –
Other –
Other assets 10,882 7,664 7,664 – 6,030 3,832 (2,198) -57.3% 7,664
General vehicles 10,110 5,096 5,096 – 5,039 2,548 (2,491) -97.8% 5,096
Specialised vehicles – – – – – – – –
Plant & equipment 46 180 180 – – 90 90 100.0% 180
Computers - hardware/equipment –
Furniture and other office equipment 388 388 – 1 194 193 99.4% 388
Abattoirs –
Markets –
Civic Land and Buildings –
Other Buildings 598 1,700 1,700 – 639 850 211 24.8% 1,700
Other Land –
Surplus Assets - (Investment or Inventory) –
Other 128 300 300 – 350 150 (200) -133.6% 300
Agricultural assets – – – – – – – –
List sub-class –
–
Biological assets – – – – – – – –
List sub-class –
–
Intangibles – – – – – – – –
Computers - software & programming –
Other –
Total Repairs and Maintenance Expenditure 27,224 30,429 30,429 1,128 12,373 15,214 2,841 18.7% 30,429
MP324 Nkomazi - Supporting Table SC13c Monthly Budget Statement - expenditure on repairs and maintenance by asset class - Mid-Year Assessment
Description

NLM Mid-Year Budget Performance Report (2016/17) as at 31 December 2016 Page 43
2015/16 Budget Year 2016/17
Audited
Outcome
Original
Budget
Adjusted
BudgetMonthly actual YearTD actual YearTD budget
YTD
variance
YTD
variance
Full Year
Forecast
R thousands %
Depreciation by Asset Class/Sub-class
Infrastructure 53,288 45,773 45,773 – – 22,886 22,886 100.0% 45,773
Infrastructure - Road transport 20,751 10,301 10,301 – – 5,151 5,151 100.0% 10,301
Roads, Pavements & Bridges 20,751 10,301 10,301 5,151 5,151 100.0% 10,301
Storm water –
Infrastructure - Electricity 1,985 3,356 3,356 – – 1,678 1,678 100.0% 3,356
Generation –
Transmission & Reticulation 1,985 3,356 3,356 1,678 1,678 100.0% 3,356
Street Lighting –
Infrastructure - Water 29,781 31,723 31,723 – – 15,862 15,862 100.0% 31,723
Dams & Reservoirs –
Water purification –
Reticulation 29,781 31,723 31,723 15,862 15,862 100.0% 31,723
Infrastructure - Sanitation 150 243 243 – – 121 121 100.0% 243
Reticulation 150 243 243 121 121 100.0% 243
Sewerage purification –
Infrastructure - Other 621 150 150 – – 75 75 100.0% 150
Waste Management 621 150 150 75 75 100.0% 150
Transportation –
Gas –
Other –
Community – – – – – – – –
Parks & gardens –
Sportsfields & stadia –
Swimming pools –
Community halls –
Libraries –
Recreational facilities –
Fire, safety & emergency –
Security and policing –
Buses –
Clinics –
Museums & Art Galleries –
Cemeteries –
Social rental housing –
Other –
Heritage assets – – – – – – – –
Buildings –
Other – –
Investment properties – – – – – – – –
Housing development –
Other –
Other assets 10,413 23,295 23,295 – – 11,647 11,647 100.0% 23,295
General vehicles 2,141 5,042 5,042 2,521 2,521 100.0% 5,042
Specialised vehicles – – – – – – – –
Plant & equipment 2,308 3,992 3,992 1,996 1,996 100.0% 3,992
Computers - hardware/equipment 692 2,369 2,369 1,185 1,185 100.0% 2,369
Furniture and other office equipment 545 1,454 1,454 727 727 100.0% 1,454
Abattoirs – –
Markets – –
Civic Land and Buildings – –
Other Buildings 4,510 6,338 6,338 3,169 3,169 100.0% 6,338
Other Land – –
Surplus Assets - (Investment or Inventory) – –
Other 217 4,100 4,100 2,050 2,050 100.0% 4,100
Agricultural assets – – – – – – – –
List sub-class –
–
Biological assets – – – – – – – –
List sub-class –
–
Intangibles 105 – – – – – – –
Computers - software & programming 105 –
Other –
Total Depreciation 63,805 69,068 69,068 – – 34,534 34,534 100.0% 69,068
MP324 Nkomazi - Supporting Table SC13d Monthly Budget Statement - depreciation by asset class - Mid-Year Assessment
Description

NLM Mid-Year Budget Performance Report (2016/17) as at 31 December 2016 Page 44
OTHER SUPPORTING
DOCUMENTATION
NLM Mid-Year Budget Performance Report (2016/17) as at 31 December 2016 Page 45
MFMA Section 66 Report
In terms of section 66 of the MFMA the accounting officer of a municipality must report to the council on
all expenditure incurred on staff salaries, wages, allowances and benefits, and in a manner that such
expenditure per type of expenditure. Please refer to table SC8 for such expenditure.
NLM Mid-Year Budget Performance Report (2016/17) as at 31 December 2016 Page 46
Municipal Manager’s Quality Certification
I Mr. Muzi Daniel Ngwenya in my capacity as a Municipal Manager of Nkomazi Municipality confirm that
the Mid-year budget report and performance assessment for the first half of the 2016/2017 financial year
period ending 31 December 2016 has been prepared in accordance with the Municipal Finance
Management Act and regulations made under that Act.
M.D. NGWENYA 25 January 2017 MUNICIPAL MANAGER DATE NKOMAZI LOCAL MUNICIPALITY – MP324