![Marry Poppins Conflict Calendar - Brightstone Productions · 2020-01-31 · Marry Poppins Conflict Calendar Read ALL notes below before filling out conflict calendar. [ ] Check](https://static.fdocuments.net/doc/165x107/5ee39e3cad6a402d666d5cb2/marry-poppins-coniict-calendar-brightstone-productions-2020-01-31-marry-poppins.jpg)
Midfrontal conflict-related theta-band power reflects neural...
12
Midfrontal conflict-related theta-band power reflects neural oscillations that predict behavior Michael X Cohen 1,2,3 * and Tobias H. Donner 1,2,4 * 1 Department of Psychology, University of Amsterdam, Amsterdam, the Netherlands; 2 Cognitive Science Center Amsterdam, University of Amsterdam, Amsterdam, the Netherlands; 3 Department of Physiology, University of Arizona, Tucson, Arizona; and 4 Bernstein Center for Computational Neuroscience, Charité Universitätsmedizin, Berlin, Germany Submitted 3 July 2013; accepted in final form 20 September 2013 Cohen MX, Donner TH. Midfrontal conflict-related theta-band power reflects neural oscillations that predict behavior. J Neuro- physiol 110: 2752–2763, 2013. First published September 25, 2013; doi:10.1152/jn.00479.2013.—Action monitoring and conflict resolu- tion require the rapid and flexible coordination of activity in multiple brain regions. Oscillatory neural population activity may be a key physiological mechanism underlying such rapid and flexible network coordination. EEG power modulations of theta-band (4 – 8 Hz) activ- ity over the human midfrontal cortex during response conflict have been proposed to reflect neural oscillations that support conflict detection and resolution processes. However, it has remained unclear whether this frequency-band-specific activity reflects neural oscilla- tions or nonoscillatory responses (i.e., event-related potentials). Here, we show that removing the phase-locked component of the EEG did not reduce the strength of the conflict-related modulation of the residual (i.e., non-phase-locked) theta power over midfrontal cortex. Furthermore, within-subject regression analyses revealed that the non-phase-locked theta power was a significantly better predictor of the conflict condition than was the time-domain phase-locked EEG component. Finally, non-phase-locked theta power showed robust and condition-specific (high- vs. low-conflict) cross-trial correlations with reaction time, whereas the phase-locked component did not. Taken together, our results indicate that most of the conflict-related and behaviorally relevant midfrontal EEG signal reflects a modulation of ongoing theta-band oscillations that occurs during the decision pro- cess but is not phase-locked to the stimulus or to the response. cognitive control; midfrontal; non-phase-locked; oscillations; theta RESPONSE CONFLICT OCCURS WHEN competing responses are acti- vated but only one can be selected, and it elicits a cascade of cognitive processes including conflict detection, action selection, selective suppression, and postresponse monitoring. These pro- cesses (among others) are referred to as cognitive control and rely critically on structures along the medial frontal wall, including the anterior cingulate cortex and surrounding medial frontal cortical areas. A commonly held view is that frontal midline structures detect activations of competing actions and recruit other brain regions to help resolve the conflict and avoid errors (Carter and van Veen 2007; Miller and Cohen 2001; Ridderinkhof et al. 2004). In human electrophysiology, response conflict and cognitive control are often studied using event-related potentials (ERPs), defined as the time-domain average voltage deflection that is phase-locked to external events. During correct trials in con- flict tasks, there is an enhancement of a negative-going ERP deflection that peaks around 200 –300 ms after stimulus onset, called the “N2,” in high-conflict compared with low-conflict trials (Botvinick et al. 2001; Folstein and Van Petten 2008; Hughes and Yeung 2011; Yeung et al. 2004). The N2 can be observed after stimulus onset and before response, suggesting that it reflects conflict processing that occurs between stimulus detection and response execution. Other studies have reported that response conflict modulates EEG activity in the theta (4 – 8 Hz) frequency range between stimulus onset and manual re- sponse (Cavanagh et al. 2012; Cohen and Cavanagh 2011; Cohen et al. 2008; Nigbur et al. 2012; Wang et al. 2005; Womelsdorf et al. 2010). The midfrontal theta modulations and the ERP signatures such as the N2 tend to occur at similar times, however, the relationship between these two midfrontal conflict-related EEG signatures is not well-understood. It has been argued that brief modulations of low-frequency EEG power may not reflect actual neural oscillations but rather transient ERP components (Yeung et al. 2004), which tend to have dominant power in the low-frequency range. Disambiguating the ERP from neural oscillations has important implications for understanding the neural mechanisms of cognitive control: establishing that con- flict-related midfrontal theta power reflects neural oscillations would set the stage for linking this human EEG signature to neurophysiological mechanisms implicated in information pro- cessing and large-scale network functioning, including mech- anisms thought to underlie top-down attention and sensory- motor decision-making (Akam and Kullmann 2012; Donner and Siegel 2011; Fries 2005; Miller and Wilson 2008; Siegel et al. 2012). In contrast, the neurophysiological mechanism that produces the N2 is not established nor are there prevailing theories that link the N2 to neurophysiology. Here, we tested the hypothesis that conflict-related midfron- tal EEG modulations primarily reflect a modulation of ongoing theta-band oscillations, which is neither phase-locked to stim- ulus onset nor to response and, therefore, cannot be attributed to the ERP. To identify oscillations, we applied two criteria that have been commonly applied in sensory and motor phys- iology: the modulation of time-frequency power should be 1) band-limited, and 2) non-phase-locked to stimulus or response (Donner and Siegel 2011; Pfurtscheller and Lopes da Silva 1999; Tallon-Baudry and Bertrand 1999). We analyzed two existing EEG data sets (n 40) and compared non-phase- locked theta-band power to the ERP in terms of condition modulations at the within-subject and across-subjects levels, * M. X. Cohen and T. H. Donner contributed equally to this study. Address for reprint requests and other correspondence: M. X. Cohen, 4 Weesperplein, Amsterdam 1018 XA, the Netherlands (e-mail: mikexcohen @gmail.com). J Neurophysiol 110: 2752–2763, 2013. First published September 25, 2013; doi:10.1152/jn.00479.2013. 2752 0022-3077/13 Copyright © 2013 the American Physiological Society www.jn.org
Transcript of Midfrontal conflict-related theta-band power reflects neural...

Midfrontal conflict-related theta-band power reflects neural oscillations thatpredict behavior
Michael X Cohen1,2,3* and Tobias H. Donner1,2,4*1Department of Psychology, University of Amsterdam, Amsterdam, the Netherlands; 2Cognitive Science Center Amsterdam,University of Amsterdam, Amsterdam, the Netherlands; 3Department of Physiology, University of Arizona, Tucson, Arizona;and 4Bernstein Center for Computational Neuroscience, Charité Universitätsmedizin, Berlin, Germany
Submitted 3 July 2013; accepted in final form 20 September 2013
Cohen MX, Donner TH. Midfrontal conflict-related theta-bandpower reflects neural oscillations that predict behavior. J Neuro-physiol 110: 2752–2763, 2013. First published September 25, 2013;doi:10.1152/jn.00479.2013.—Action monitoring and conflict resolu-tion require the rapid and flexible coordination of activity in multiplebrain regions. Oscillatory neural population activity may be a keyphysiological mechanism underlying such rapid and flexible networkcoordination. EEG power modulations of theta-band (4–8 Hz) activ-ity over the human midfrontal cortex during response conflict havebeen proposed to reflect neural oscillations that support conflictdetection and resolution processes. However, it has remained unclearwhether this frequency-band-specific activity reflects neural oscilla-tions or nonoscillatory responses (i.e., event-related potentials). Here,we show that removing the phase-locked component of the EEG didnot reduce the strength of the conflict-related modulation of theresidual (i.e., non-phase-locked) theta power over midfrontal cortex.Furthermore, within-subject regression analyses revealed that thenon-phase-locked theta power was a significantly better predictor ofthe conflict condition than was the time-domain phase-locked EEGcomponent. Finally, non-phase-locked theta power showed robust andcondition-specific (high- vs. low-conflict) cross-trial correlations withreaction time, whereas the phase-locked component did not. Takentogether, our results indicate that most of the conflict-related andbehaviorally relevant midfrontal EEG signal reflects a modulation ofongoing theta-band oscillations that occurs during the decision pro-cess but is not phase-locked to the stimulus or to the response.
cognitive control; midfrontal; non-phase-locked; oscillations; theta
RESPONSE CONFLICT OCCURS WHEN competing responses are acti-vated but only one can be selected, and it elicits a cascade ofcognitive processes including conflict detection, action selection,selective suppression, and postresponse monitoring. These pro-cesses (among others) are referred to as cognitive control andrely critically on structures along the medial frontal wall,including the anterior cingulate cortex and surrounding medialfrontal cortical areas. A commonly held view is that frontalmidline structures detect activations of competing actions andrecruit other brain regions to help resolve the conflict and avoiderrors (Carter and van Veen 2007; Miller and Cohen 2001;Ridderinkhof et al. 2004).
In human electrophysiology, response conflict and cognitivecontrol are often studied using event-related potentials (ERPs),defined as the time-domain average voltage deflection that isphase-locked to external events. During correct trials in con-
flict tasks, there is an enhancement of a negative-going ERPdeflection that peaks around 200–300 ms after stimulus onset,called the “N2,” in high-conflict compared with low-conflicttrials (Botvinick et al. 2001; Folstein and Van Petten 2008;Hughes and Yeung 2011; Yeung et al. 2004). The N2 can beobserved after stimulus onset and before response, suggestingthat it reflects conflict processing that occurs between stimulusdetection and response execution. Other studies have reportedthat response conflict modulates EEG activity in the theta (4–8Hz) frequency range between stimulus onset and manual re-sponse (Cavanagh et al. 2012; Cohen and Cavanagh 2011;Cohen et al. 2008; Nigbur et al. 2012; Wang et al. 2005;Womelsdorf et al. 2010).
The midfrontal theta modulations and the ERP signaturessuch as the N2 tend to occur at similar times, however, therelationship between these two midfrontal conflict-related EEGsignatures is not well-understood. It has been argued that briefmodulations of low-frequency EEG power may not reflectactual neural oscillations but rather transient ERP components(Yeung et al. 2004), which tend to have dominant power in thelow-frequency range. Disambiguating the ERP from neuraloscillations has important implications for understanding theneural mechanisms of cognitive control: establishing that con-flict-related midfrontal theta power reflects neural oscillationswould set the stage for linking this human EEG signature toneurophysiological mechanisms implicated in information pro-cessing and large-scale network functioning, including mech-anisms thought to underlie top-down attention and sensory-motor decision-making (Akam and Kullmann 2012; Donnerand Siegel 2011; Fries 2005; Miller and Wilson 2008; Siegel etal. 2012). In contrast, the neurophysiological mechanism thatproduces the N2 is not established nor are there prevailingtheories that link the N2 to neurophysiology.
Here, we tested the hypothesis that conflict-related midfron-tal EEG modulations primarily reflect a modulation of ongoingtheta-band oscillations, which is neither phase-locked to stim-ulus onset nor to response and, therefore, cannot be attributedto the ERP. To identify oscillations, we applied two criteriathat have been commonly applied in sensory and motor phys-iology: the modulation of time-frequency power should be 1)band-limited, and 2) non-phase-locked to stimulus or response(Donner and Siegel 2011; Pfurtscheller and Lopes da Silva1999; Tallon-Baudry and Bertrand 1999). We analyzed twoexisting EEG data sets (n � 40) and compared non-phase-locked theta-band power to the ERP in terms of conditionmodulations at the within-subject and across-subjects levels,
*M. X. Cohen and T. H. Donner contributed equally to this study.Address for reprint requests and other correspondence: M. X. Cohen, 4
Weesperplein, Amsterdam 1018 XA, the Netherlands (e-mail: [email protected]).
J Neurophysiol 110: 2752–2763, 2013.First published September 25, 2013; doi:10.1152/jn.00479.2013.
2752 0022-3077/13 Copyright © 2013 the American Physiological Society www.jn.org

within-subjects correlations with behavior, and statisticalpower.
We found a robust non-phase-locked and band-limited mid-frontal theta-band power modulation that was not affected byremoving the phase-locked part of the signal (the ERP). Fur-thermore, the non-phase-locked theta power modulation wasmore closely linked to the conflict manipulation and to itseffects on reaction time compared with the ERP. We concludethat non-phase-locked theta oscillations in the human medialfrontal cortex are a sensitive marker of response conflict duringdecision-making tasks. These neural oscillations may play acrucial mechanistic role in orchestrating the online monitoringand adaptation of task performance during tasks that elicitresponse conflict.
MATERIALS AND METHODS
Participants. Forty subjects from the University of Amsterdampsychology undergraduate program volunteered in exchange forcourse credit or money (€14). Subjects had normal or corrected-to-normal vision and no reported history of psychosis, brain disease, orpsychiatric illness and were self-reported right-handed. The localethics committee at the University of Amsterdam approved bothexperiments, and subjects provided informed, written consent beforethe start of the experiment.
Task design. We pooled data from two separate conflict tasks. Alldata analyses were identical for both experiments. Details of bothexperimental designs are published elsewhere and are briefly de-scribed below (see Fig. 1A for an overview of events and timing ofeach experiment). Experiment 1 (Cohen and Ridderinkhof 2013) wasa Simon task in which a circle was presented in the left or the rightvisual hemifield. Subjects were instructed to respond, as quickly aspossible, to the color of the stimulus while ignoring its location.Conflict occurs when the response hand is opposite to the visualpresentation hemifield. Four colors were used, two mapped to the lefthand and two mapped to the right hand. All manipulations were
pseudorandomized, as was the order of color and stimulus presenta-tion side, which avoids stimulus-repetition effects (Wuhr and Ansorge2005). Each subject performed 1,500 trials. Experiment 2 (Cohen2011) was an auditory-visual Simon task. A separate group of 20subjects that did not participate in experiment 1 responded accordingto the physical location of a visual stimulus while ignoring thesimultaneous auditory beep that was presented to each ear via in-ear,EEG-compatible air tubes or vice versa (attended features were cuedin separate blocks). Subjects pressed a button with the left hand forstimuli on the left and with their right hand for stimuli on the right.Conflict is introduced when, for example, the stimulus is in the lefthemifield while the tone is played in the right ear. Each subjectperformed 2,400 trials over 2 sessions.
We use the term high conflict to indicate trials in which theirrelevant task feature was associated with the opposite response asthe relevant task (e.g., when the tone was played in the right ear, butthe subject had to respond with the left hand), and we use the term lowconflict to indicate trials in which both task dimensions were associ-ated with the same response hand. Although the conflict may arise dueto different factors from the two experiments (response-spatial loca-tion vs. bimodal integration), several previous studies suggest that theconflict- and error-related computations performed by the medialfrontal cortex are independent of input and output modalities (Holroydet al. 1998; Riesel et al. 2013).
The purpose of pooling data from two separate but similar taskswas to increase statistical power. Statistical power is increasinglydiscussed as a major limiting factor in interpreting and generalizingresults from cognitive neuroscience experiments (Button et al. 2013).Typical EEG studies include 10–20 subjects. Increasing our samplesize to 40 ensured robust group-level statistics and increases confi-dence about the findings and their generalizability to other studies. InRESULTS, we report the post hoc statistical power of several effects.These were computed using the G*Power 3.1 software, which isfreely available online (Faul et al. 2007). We use the term statisticalpower to refer to the probability of correctly rejecting the nullhypothesis (that is, 1 � �, where � is the probability of making a typeII error) and power to indicate EEG time-frequency power.
B Total power C Non-phase-locked power D Phase-locked power
Time (ms)
Freq
uenc
y (H
z)
−2
+2
dB vs. baseline
0 200 400 600 800 10002
4
8
15
30
60
0 200 400 600 800 1000 0 200 400 600
ERP
800 1000
+
+
+
200 ms
A Trial timing for experiment 1 (left) and experiment 2 (right)
1000 msor response
700-1200 ms
+
+
+
50 ms
1150 msor response
1000-1500 ms
))
Fig. 1. Overview of task timing and illustrationof total vs. non-phase-locked activity from 1subject, electrode Oz (177 trials). Note that thetone in experiment 2 was played into the ear (inthis example, the right ear); there was no visualdepiction of the tone location on the screen.Time 0 in the time-frequency plots refers tostimulus onset. B shows total activity (the un-adulterated data from all trials; this is the typ-ical analysis approach), and C shows non-phase-locked power (also sometimes called“induced” activity), which was created by sub-tracting the event-related potential (ERP) fromsingle trials. This procedure annihilates theERP (by definition) while leaving the non-phase-locked power intact. D shows the phase-locked power, defined as the difference be-tween total and non-phase-locked power. TheERP is overlaid (y-axis scaling is arbitrary).
2753CONFLICT-RELATED THETA IS NON-PHASE-LOCKED
J Neurophysiol • doi:10.1152/jn.00479.2013 • www.jn.org

EEG acquisition and preprocessing. EEG data were acquired at2,048 Hz (512 Hz in experiment 2) from 64 channels placed accordingto the international 10�20 system using Biosemi equipment (seehttp://www.biosemi.com for hardware details). Additional electrodeswere placed to acquire horizontal eye movements and electromyo-graphic signals from the thumbs. Electrodes were placed on bothearlobes to serve as offline average reference. Offline, EEG data werehigh-pass filtered at 0.5 Hz and then epoched from �1 to �1.5 ssurrounding each trial. All trials were visually inspected, and thosecontaining EMG or other artifacts not related to blinks were manuallyremoved. Independent components analysis was computed using theEEGLAB toolbox for MATLAB (Makeig et al. 2004), and compo-nents containing blink/oculomotor artifacts or other artifacts thatcould be clearly distinguished from brain-driven EEG signals weresubtracted from the data.
The following trials were removed before analyses: error andposterror trials, trials with reaction times �200 ms or �3 SD aboveeach subject’s median reaction time, trials with partial errors (detailsbelow), trials with horizontal eye movements indicating saccadesaway from fixation, and the first trial following each rest period orinstruction change. Partial errors were when subjects made the correctresponse but twitched the muscle corresponding to the incorrectresponse and elicit a qualitatively distinct pattern of brain oscillatorydynamics compared with pure correct responses (Cohen and van Gaal,in press; Holroyd and Coles 2002). We identified a trial as containinga partial error if the z-transformed derivative of the EMG signalexceeded 2 SD between stimulus onset and the button press and if thepeak of the EMG response was more than two times the largest peakfrom �300 ms to stimulus onset. Trials with horizontal eye move-ments were defined as those in which the horizontal electrooculogram(low-pass filtered at 20 Hz) exceeded 5 SD to either direction relativeto prestimulus baseline activity. Finally, conditions were trial- andreaction-time-matched within subject, such that the condition with thefewest trials was identified, and reaction-time-matched trials from allother conditions were selected. This procedure minimizes the possi-bility of condition differences in EEG activity resulting from differ-ences in trial count, signal-to-noise ratio (which depends on trialcount), or global differences in time-on-task (Cavanagh et al. 2009;Cohen and Cavanagh 2011). After preprocessing, there were onaverage 274 (18.8 SE) trials per condition per subject used in the dataanalyses.
We also compared the results with and without applying a surfaceLaplacian (also sometimes called current source density or currentscalp density) to the preprocessed single-trial EEG data. The surfaceLaplacian is a spatial band-pass filter that attenuates activity fromdistant sources or activity that is highly spatially distributed andtemporal coherent (Cohen 2014). Comparing EEG results with andwithout the surface Laplacian provides support for the notion that theEEG-measured conflict modulations of theta power were due to afocal and source with a likely radially oriented dipole in medial frontalcortex rather than being due to volume conduction from other brainregions.
EEG analyses. We defined the ERP as the phase-locked componentof trial-related EEG modulations as obtained by averaging acrosstrials in the time-domain.
EEG data were decomposed into their time-frequency representa-tion via wavelet convolution performed in the frequency domain (notethat the convolution theorem guarantees that the following method isequivalent to time-domain convolution). The power spectrum of theEEG (obtained from the fast Fourier transform) signal was multipliedby the power spectrum of complex Morlet wavelets [ei2�tf e�t2
/(2�2),where t is time, f is frequency, which increased from 2 to 60 Hz in 30logarithmically spaced steps, and � defines the width of each fre-quency band, set according to n/(2�f), where n is the number ofwavelet cycles, and increased from 3 to 10 in logarithmic steps], andthe inverse fast Fourier transform was then taken. Note that this wasdone on the single-trial data, not the ERP. From the resulting complex
signal (the analytic signal), an estimate of frequency-band-specificpower at each time point was defined as the squared magnitude of theresult of the convolution {real[z(t)]2 � imaginary[z(t)]2}. All powervalues in the time-frequency representation were normalized to theaverage prestimulus baseline power at each frequency band. We useda decibel (dB) transform for normalization [dB power � 10 �log10(power/baseline)]. The baseline power was computed as theaverage power across all experiment conditions, from �300 to �100ms prestimulus. A prestimulus baseline period was used for bothstimulus-locked and response-locked analyses.
The non-phase-locked power was obtained in the following way.First, we computed the ERP (the time-domain trial average), and thensubtracted the ERP from the time-domain EEG signal on each trial(Kalcher and Pfurtscheller 1995). This was done separately for eachcondition, electrode, and subject. After this single-trial subtraction ofthe ERP, the time-frequency dynamics were extracted as described inthe previous paragraph. Figure 1 shows an overview of the procedurefor one subject. We did not apply a low-pass filter on the ERPs for tworeasons. First, trial averaging itself acts as a low-pass filter, particu-larly with an average of 274 trials per condition/subject. Second,low-pass filtering removes a valid part of the signal and thus wouldinvolve less signal removal when computing the non-phase-lockedpower. Thus applying a low-pass filter would invite the risk ofdifferences between phase-locked and non-phase-locked activity be-ing due to the low-pass filtering of the ERP.
The method described in the previous paragraph assumes that theERP is both amplitude- and shape-invariant on each trial (that is, thatthe ERP on each trial is the same as the trial-averaged ERP). Wetherefore tried an alternative method of subtracting the non-phase-locked activity while assuming only that the ERP is shape-invariantbut not amplitude-invariant. This was done by scaling the amplitudeof the ERP on each trial according to the normalized dot productbetween the ERP and the single-trial EEG trace (Donner et al. 2008).Thus the amplitude of the ERP can vary on each trial, although itsshape remains the same. Results were similar to when subtracting theunweighted ERP and are thus not shown here. The assumptionsunderlying single-trial ERP subtraction are addressed further in DIS-CUSSION. Phase-locked power was computed by subtracting the non-phase-locked from the total power.
Cross-trial within-subject regression. Typically in cognitive neu-roscience tasks, data are averaged over all trials within subject, andthen statistics are performed at the group level. This procedureincreases signal-to-noise but also ignores within-subject variability.We thus tested whether EEG features (time-frequency power andsingle-trial ERP) were reliable predictors of low- vs. high-conflicttrials within subjects. Therefore, we applied a within-subject cross-trial logistic regression analysis. The following procedure was con-ducted separately for each time point or time-frequency point for eachsubject. We first constructed a linear model over trials, � � (XT X)�1
XT D, where X is the design matrix (1 column for the intercept and 1column for the condition labels, dummy-coded to 0 and 1 for low- andhigh-conflict), T and �1 indicate the matrix transpose and inverse, andD is the vector of data from all trials at that time or time-frequencypoint. The � term is vector of regression coefficients that describe therelationship between the data and the design matrix. For each subject,the conflict-� coefficient (the 1st coefficient is the intercept and is notof interest here) was binarized as 1 if it indicated that increased powerover trials at that time-frequency point predicted a high-conflict trialand 0 if increased power predicted a low-conflict trial. Thus, at thegroup level, a value of 90% indicates that, for 90% of subjects, thewithin-subject regression over trials predicts that more time-frequencypower or ERP amplitude predicts a high-conflict condition at that timeor time-frequency point. Results were tested against 0.5 using one-sample Mann-Whitney U (also known as Wilcoxon rank sum) non-parametric t-tests and were considered significant if they exceeded athreshold of P � 0.001. This analysis complements the typical
2754 CONFLICT-RELATED THETA IS NON-PHASE-LOCKED
J Neurophysiol • doi:10.1152/jn.00479.2013 • www.jn.org

group-level analyses because it incorporates the cross-trial, within-subject variance that is typically ignored in group-level analyses.
Cross-trial EEG-reaction-time correlations. The purpose of thiswithin-subjects analysis was to test whether the EEG time- or time-frequency-domain features were related to trial-varying task perfor-mance as measured through reaction time. For each subject, EEG datawere correlated with reaction time over trials at each time point ortime-frequency point. This produced a time-course or time-frequencymap of correlation coefficients for each subject. Correlation coeffi-cients were then tested against zero at the group level after first beingFisher z-transformed. Spearman correlations were used because poweris nonnormally distributed.
Statistics. Statistical analyses of the EEG data relied on nonpara-metric permutation testing, correcting for multiple comparisons acrossall time-frequency space or across all time points. At each of 1,000iterations during permutation testing, the effect (all conditions vs.baseline or high- vs. low-conflict trials) time-course or time-frequencymap was multiplied by �1 for a random subset of subjects. Note thatthis is equivalent to randomly swapping the order of the conditionsubtraction (A-B vs. B-A) and provides an appropriate test against thenull hypothesis of no condition differences (Maris and Oostenveld
2007). Next, a t-statistic was calculated as X/��n, where X is theeffect of interest, � is the SD at each time point (across subjects), andn is the number of subjects (40). From each null-hypothesis iteration,the maximum and minimum t values from the entire map were stored;thus, after 1,000 iterations, a distribution of minimum and maximumt values expected under the null hypothesis could be created. In thetrue t-statistic map, any pixel with a t value greater than or less than99.999% of the null-distribution t values was considered a significanteffect. This corresponds to a P value of 0.001, correcting for multiplecomparisons across all time points or time-frequency points. For thecorrelation results, we used a P value threshold of 0.01 (also correct-ing for multiple comparisons over time-frequency space or over timepoints). A conservative threshold was used because we had manysubjects and relatively small variances.
RESULTS
Behavioral results. Behavioral performance for experiment1 has been reported previously (Cohen and Ridderinkhof2013). Briefly, the expected conflict effect (longer reactiontimes and higher error rates) was observed in the high-conflictcompared with the low-conflict condition (mean/SE reactiontimes for high-/low-conflict trials: 503/10 and 466/14 ms;mean/SE accuracy for high-/low-conflict trials: 88/2 and 96/5%). The conflict effect in experiment 2 has not been reportedbefore [the Cohen (2011) paper focused on errors vs. correcttrials]. Reaction times for high- and low-conflict trials were359 and 319 ms (10- and 7-ms SE; t19 � 10.78, P � 0.001).Accuracy for high- and low-conflict trials was 85.5 and 98.4%(1.5 and 0.4% SE; t19 � 10.7, P � 0.001).
EEG dynamics during sensory-motor task performance. Taskperformance was associated with a number of well-known EEGsignatures reflecting the 1) encoding of the visual stimulus inoccipitoparietal cortex, 2) conflict processing in medial frontalcortex, and 3) response preparation in (pre)motor cortex (Cohenand Cavanagh 2011; Donner and Siegel 2011; Donner et al. 2009;Pfurtscheller and Lopes da Silva 1999; Tallon-Baudry and Ber-trand 1999). These signatures were most evident in the threepredefined electrode groups highlighted in Fig. 2, and each ofthem comprised non-phase-locked (top panels) and phase-locked(i.e., ERP; bottom panels) features.
The brief (50 or 200 ms; Fig. 1A) visual stimuli elicited aphase-locked (ERP) response over visual cortex (Fig. 2B,
bottom), which was largely confined to the �8-Hz range andaccompanied by non-phase-locked (“induced”) suppression ofalpha-band (8–15 Hz) power (Fig. 2A, top). As expected, bothof these stimulus-related components were more closelyaligned to the stimulus compared with the response (compareleft and middle in Fig. 2A). Motor response preparation, on theother hand, was associated with two movement-selective com-ponents evident in the EEG lateralization over the motorcortices (i.e., contralateral vs. ipsilateral to the response hand):a phase-locked enhancement of contralateral low-frequencypower (Fig. 2C, bottom) and a non-phase-locked suppressionof contralateral beta-band (10–20 Hz) power (Fig. 2C, top). Asexpected, both of these response-related components weremore closely aligned to the motor response than to the stimulusonset (compare middle and left in Fig. 2C).
Finally, electrodes over midfrontal cortex exhibited both phase-locked and non-phase-locked components of power modulations,which were about equally well-aligned to stimulus onset and themotor response (compare middle and left in Fig. 2B). There weretwo significant midfrontal non-phase-locked components: apower enhancement in the theta-band (4–8 Hz) and a powersuppression in the beta-band (15–30 Hz). The theta-band powermodulation was specific to midfrontal electrodes; the beta-bandsuppression may reflect distributed activity from the motor corti-ces (see topographic map in top right of Fig. 2C).
To quantify how much of the time-frequency power isnon-phase-locked, we computed the percentage of the totalpower that is phase-locked [computed as 100 � (total-non-phase-locked)/total]. This was computed within time-fre-quency windows that were selected based on the conflict effect(see below; this window was selected to be orthogonal topossible differences between total and non-phase-lockedpower). For the stimulus-locked analysis from 300 to 600 msand 4 to 8 Hz, 84.6% of the total power was non-phase-locked(9.9% SD, 60.7–96.5% range). For the response-locked anal-ysis from �200 to 0 ms and 4 to 8 Hz, 80.6% of total powerwas non-phase-locked (36.0% SD, 25.9–98.2% range). In therest of this paper, we show that this non-phase-locked thetapower modulation specifically relates to conflict processingand is a good predictor of task condition and reaction time.
Conflict modulation of non-phase-locked midfrontal EEGpower. Theta power (peak at 6.5 Hz) increased after stimulusonset and around the time of response for high-conflict trialscompared with low-conflict trials (Fig. 3). We next computedthe post hoc statistical power of the theta-band conflict effect(200–600 ms, 4–8 Hz). With 40 subjects and assuming an �of 0.001, the effect size was 1.25 for the total power and 1.29for the non-phase-locked power (condition difference means/SEs 0.5506/0.4262 and 0.5949/0.4368 and intervariable corre-lations 0.9254/0.9105 for total and non-phase-locked, respec-tively), and the statistical power (1 � �) was �0.99. Indeed,with this effect size, even 18 subjects would have produced astatistical power of �0.9, which is generally considered a largeeffect.
There were no statistically significant differences betweenthe conflict effect in the total power analysis vs. that in thenon-phase-locked analysis. The analyses presented in Fig. 3demonstrate that the conflict effect in the EEG signal is drivenby non-phase-locked activity and is therefore unchanged whenremoving the ERP from the data. This pattern of effects wasconsistent across both experiments (results not shown).
2755CONFLICT-RELATED THETA IS NON-PHASE-LOCKED
J Neurophysiol • doi:10.1152/jn.00479.2013 • www.jn.org
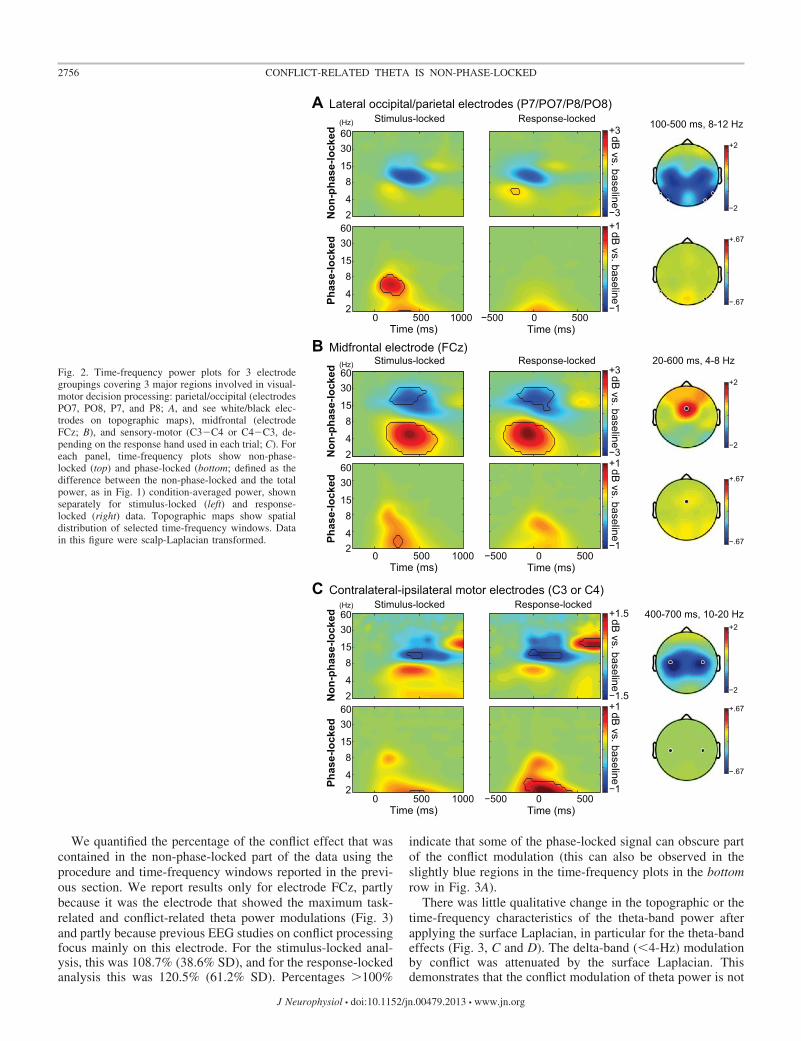
We quantified the percentage of the conflict effect that wascontained in the non-phase-locked part of the data using theprocedure and time-frequency windows reported in the previ-ous section. We report results only for electrode FCz, partlybecause it was the electrode that showed the maximum task-related and conflict-related theta power modulations (Fig. 3)and partly because previous EEG studies on conflict processingfocus mainly on this electrode. For the stimulus-locked anal-ysis, this was 108.7% (38.6% SD), and for the response-lockedanalysis this was 120.5% (61.2% SD). Percentages �100%
indicate that some of the phase-locked signal can obscure partof the conflict modulation (this can also be observed in theslightly blue regions in the time-frequency plots in the bottomrow in Fig. 3A).
There was little qualitative change in the topographic or thetime-frequency characteristics of the theta-band power afterapplying the surface Laplacian, in particular for the theta-bandeffects (Fig. 3, C and D). The delta-band (�4-Hz) modulationby conflict was attenuated by the surface Laplacian. Thisdemonstrates that the conflict modulation of theta power is not
0 500 1000 −500 0 500
A Lateral occipital/parietal electrodes (P7/PO7/P8/PO8)
B Midfrontal electrode (FCz)
Stimulus-lockedC Contralateral-ipsilateral motor electrodes (C3 or C4)
Response-locked
Stimulus-locked Response-locked
Stimulus-locked Response-locked 100-500 ms, 8-12 Hz
20-600 ms, 4-8 Hz
400-700 ms, 10-20 Hz
Non
-pha
se-lo
cked
Phas
e-lo
cked
24
815
3060(Hz)
(Hz)
(Hz)
24
815
3060
Non
-pha
se-lo
cked
Phas
e-lo
cked
24
815
3060
24
815
3060
Non
-pha
se-lo
cked
Phas
e-lo
cked
24
815
3060
24
815
3060
Time (ms) Time (ms)
0 500 1000 −500 0 500Time (ms) Time (ms)
0 500 1000 −500 0 500Time (ms) Time (ms)
−1
+1dB vs. baseline
−3
+3dB vs. baseline
−1
+1dB vs. baseline
−1.5
+1.5dB vs. baseline
−1
+1dB vs. baseline
−3
+3dB vs. baseline
−2
+2
−.67
+.67
−2
+2
−.67
+.67
−2
+2
−.67
+.67
Fig. 2. Time-frequency power plots for 3 electrodegroupings covering 3 major regions involved in visual-motor decision processing: parietal/occipital (electrodesPO7, PO8, P7, and P8; A, and see white/black elec-trodes on topographic maps), midfrontal (electrodeFCz; B), and sensory-motor (C3�C4 or C4�C3, de-pending on the response hand used in each trial; C). Foreach panel, time-frequency plots show non-phase-locked (top) and phase-locked (bottom; defined as thedifference between the non-phase-locked and the totalpower, as in Fig. 1) condition-averaged power, shownseparately for stimulus-locked (left) and response-locked (right) data. Topographic maps show spatialdistribution of selected time-frequency windows. Datain this figure were scalp-Laplacian transformed.
2756 CONFLICT-RELATED THETA IS NON-PHASE-LOCKED
J Neurophysiol • doi:10.1152/jn.00479.2013 • www.jn.org

driven by distant or distributed sources and is consistent witha neural source in medial prefrontal cortical regions close to theskull, underlying electrode FCz (the surface Laplacian wouldhave attenuated activity from deep sources such as the anteriorcingulate).
Conflict modulation of the midfrontal phase-locked EEG compo-nent (ERP). The ERP at midfrontal electrode FCz (Fig. 4A) ap-peared qualitatively similar to previous reports of conflict-related ERPs (e.g., Yeung et al. 2004). The ERPs for high- vs.low-conflict trials were significantly different around 400–600ms in the stimulus-locked ERPs and around �150 to 0 ms in
the response-locked ERPs (Fig. 4A). In the time period inwhich an N2 was visually apparent (�175–250 ms), there wasno statistically significant condition difference when correctingfor multiple comparisons across time points. However, a posthoc t-test at the time of the N2 peak revealed a statisticallysignificant effect (250 ms; t39 � �2.84, P � 0.007, uncor-rected for multiple comparisons, but see below for statisticalpower analysis). Topographically, the ERPs diverged from thetheta power. The condition-averaged ERP was maximal overcentral posterior sites rather than midfrontal sites, and theconflict modulation showed a spatially multipeaked central-
−0.5
+0.5
−1
+1
Conflict effect
Phas
e-lo
cked
24
815
3060
Non
-pha
se-lo
cked
24
815
3060
Tota
l
Non
-pha
se-lo
cked
Tota
l
24
815
3060
stim. 500250 750 1000 -250 250resp. 500750Time (ms) Time (ms)
Stimulus-locked Response-locked
A No spatial filter: Time-frequency power from FCz B No spatial filter: Topographical maps of theta (4-8 Hz) power
D Scalp Laplacian filter: Topographical maps of theta (4-8 Hz) powerC Scalp Laplacian filter: Time-frequency power from FCz
Conditionaverage
Stimulus-locked: 200-500 ms
Conflicteffect
Conditionaverage
Response-locked: -200-0 ms
Conflicteffect
Tota
l
Conditionaverage
Stimulus-locked: 200-500 ms
Conflicteffect
Conditionaverage
Response-locked: -200-0 ms
Conflicteffect
Conditionaverage
Response-locked: -200-0 ms
Conflicteffect
Conditionaverage
Stimulus-locked: 200-500 ms
Conflicteffect
Non
-pha
se-lo
cked
Conditionaverage
Response-locked: -200-0 ms
Conflicteffect
Conditionaverage
Stimulus-locked: 200-500 ms
Conflicteffect
−0.5
+0.5
−1
+1
Conflict effect
Phas
e-lo
cked
24
815
3060
Non
-pha
se-lo
cked
24
815
3060
Tota
l
24
815
3060
stim. 500250 750 1000 -250 250resp. 500750Time (ms) Time (ms)
Stimulus-locked Response-locked
Phase-locked conf.
Phase-locked conf.
Fig. 3. The conflict effect (time-frequency power of high- vs. low-conflict trials) on time-frequency theta-band power. Results are shown for stimulus- andresponse-locked analyses separately for the spatially unfiltered data (A and B) and for the surface Laplacian data (C and D). Note that the theta-bandtime-frequency characteristics and topographic distributions are qualitatively very similar with and without the Laplacian. conf., Conflict.
2757CONFLICT-RELATED THETA IS NON-PHASE-LOCKED
J Neurophysiol • doi:10.1152/jn.00479.2013 • www.jn.org

parietal distribution rather than identifying a single source (Fig.4B). Statistical power analyses on the stimulus-locked ERP com-ponents revealed low statistical power for the N2 component(condition difference mean/SE at 250 ms: �0.9466/2.1056, inter-variable correlation: 0.8993, effect size � �0.4495, power �0.26) and high statistical power for the later P3-type compo-nent (condition difference mean/SE from 380 to 550 ms:1.8026/1.1884, effect size � 1.5168, power � 1.0). Note thatfor the N2 component, with the present effect size and � of0.001, a sample size of �100 would be required to obtain astatistical power of 0.9, which is generally considered a largeeffect.
In contrast to the theta power results, the ERP was stronglyaffected by applying the surface Laplacian. This can be seen inFig. 4, C and D, both in the overall shape of the ERPs and inthe topographic distributions. When data appear qualitativelydifferent before vs. after the surface Laplacian, one can inter-pret this as demonstrating that the activity was not generated bybrain tissue beneath the electrode but rather by deep or distantsources that were volume-conducted or by large and distributedcortical networks that are highly temporally coherent (Cohen2014). Importantly, the topography of the conflict modulationof the ERP was qualitatively distinct from that of the thetapower.
Our results so far indicate that the conflict-related midfrontaltheta power and ERP components are two distinct, superim-posed physiological phenomena that overlap in time duringconflict processing. We next quantified whether these two EEGmanifestations were correlated with each other over subjectsusing bivariate Spearman correlation. Importantly, we alsocomputed partial correlations, holding constant the conflictmodulation on the ERP at P9 in the same time window as usedfor the N2 modulation. P9 was selected because it is far awayfrom FCz and showed no conflict effect (t39 � 0.47, P � 0.63).
The idea here is that if the N2 and the theta power are simplydifferent ways of measuring the same midfrontal neural pro-cess, they should be highly correlated, and thus partialing outthe nonsignificant conflict modulation at P9 should have noeffect on the FCz N2-theta correlation. In contrast, if the N2and theta power reflect distinct midfrontal neural processes,any correlation between them may simply reflect nonspecificfactors that affect the EEG signal (e.g., skull thickness andelectrode impedance); thus partialing out P9 variance shouldreduce the N2-theta correlation. It is important to take thesegeneral and potentially mediating factors into account, other-wise correlations across subjects (Harper et al. 2013) or acrossconditions based on subject averages (Hajihosseini and Hol-royd 2013) could be misleading.
For the stimulus-locked ERP, we used the N2 time periodrather than the later and more statistically significant periodbecause most ERP research on response conflict focuses on theN2; thus the N2 is the most theoretically relevant component.For the theta power effect, we selected the same time-fre-quency window that we used to compute the percentage ofnon-phase-locked power. There was a significant negativecorrelation between the N2 conflict effect and theta power(Spearman r � �0.37, P � 0.017) in the stimulus-lockedanalyses, which became nonsignificant when partialing outERP effects at P9 (r � �0.28, P � 0.08). For correlations inthe response-locked analyses, we selected �25 ms for the ERP,and �200 to 0 for the theta-band power. There was a nonsig-nificant trend toward a positive correlation (Spearman r �0.28, P � 0.075), which became even weaker when partialingout shared variance with the ERP from P9 at the same timewindow (r � 0.25, P � 0.11).
In sum, the conflict effects in the ERP and in the non-phase-locked theta power appear to reflect distinct components of theEEG signal. The reduction in correlation when partialing out
stim. 200 400Time (ms)
Vol
tage
(µV
/m2 )
Vol
tage
(µV
)
Time (ms)600 800
−12
−8
−4
0
4
−400 −200 resp. 200 400 600
−16
−12
−8
−4
0
stim. 200 400 600 800
CongruentIncongruent−2
0
2
4
−400 −200 resp. 200 400
Conditionaverage
Stimulus-locked: 380-550 ms Response-locked: -50-0 ms
Stimulus-locked: 380-550 ms Response-locked: -50-0 ms
Conflicteffect
Conflicteffect
Conflicteffect
Conflicteffect
Conditionaverage
Conditionaverage
Conditionaverage
600
−2
0
2
4
A No spatial filter: ERPs from FCz B No spatial filter: topographical maps
C Scalp Laplacian spatial filter: ERPs from FCz D Scalp Laplacian spatial filter: topographical maps
±9 ±5
±8 ±2 ±8 ±1.5
±7 ±6
Fig. 4. ERP results. A and C show grand-averaged ERPs from electrode FCz, and B and D show the topographic maps of ERPs from time windows correspondingto statistically significant condition differences in the FCz ERPs (see black regions in A and C). Note that the ERP waveforms are qualitatively different beforevs. after applying the surface Laplacian and that the topographic distributions are qualitatively distinct from the theta-band power shown in Fig. 3. Note also thateach topographic map has its own color scaling. “stim.” Is stimulus onset, and “resp.” is the time of button press.
2758 CONFLICT-RELATED THETA IS NON-PHASE-LOCKED
J Neurophysiol • doi:10.1152/jn.00479.2013 • www.jn.org

ERP variance at electrode P9 suggests that any shared variancebetween the N2 and theta power reflects nonspecific individualEEG signal factors, perhaps including skull thickness, elec-trode impedance, or overall levels of cortical activation.
Within-subject cross-trial regression from midfrontal EEGcomponents. Thus far, all of our analyses have involved firstaveraging over all trials within each subject and then perform-ing group-level analyses. However, it is also useful to deter-mine how well the phase-locked and non-phase-locked parts ofthe EEG relate to the single-trial data within each subject. Thuswe performed two sets of within-subjects analyses to quantifythe link between the different EEG signatures and conflictconditions and behavioral performance.
The first set of analyses was based on within-subject logisticregressions to predict the condition of each trial (low- orhigh-conflict) based on the single-trial non-phase-locked time-frequency power or on the single-trial time-domain EEG signal(the single-trial ERP). Results from midfrontal electrode FCzare shown in Fig. 5. Values indicate the percentage of subjectsfor whom the cross-trial regression indicated that increasedpower was associated with high- compared with low-conflicttrials. In the time-frequency regression, highest performancewas seen in the theta band, peaking at around 400 ms and 6.5Hz for the stimulus-locked analyses and at the response timeand 6.5 Hz for the response-locked analyses. Average regres-sion performance was significantly greater than chance (P �0.001; see gray patches in line plots of Fig. 5) for theta power
from around 175 to 750 ms in the stimulus-locked analysis andfrom around �450 to �200 ms in the response-lockedanalyses.
Averaged regression performance based on the single-trialERP (that is, the time-domain EEG signal on each trial) wassignificant (P � 0.001; see green patches in line plots in Fig.5) from around 400 to 550 ms in the stimulus-locked analysisand around �50 ms in the response-locked analyses.
Averaged regression performance was significantly greaterfor theta compared with the ERP (P � 0.001; see thick red barunder line plots in Fig. 5) from around 150 to 750 ms in thestimulus-locked analysis and from around �425 to �50 ms in theresponse-locked analysis. Overall, these findings indicate thatboth theta power and the ERP can be used to predict the conflictcondition at the within-subject level and that the non-phase-lockedtheta power significantly outperforms the ERP as a statisticalpredictor.
Correlating cross-trial reaction time with midfrontal EEGcomponents. The second set of within-subject cross-trial anal-yses linked the EEG data to conflict processing by means ofcross-trial correlations with behavior. Here, the idea was that ifconflict-related midfrontal activity reflects neural mechanismsof detecting and resolving conflict, then trial-to-trial fluctua-tions in midfrontal activity should predict trial-to-trial fluctu-ations in task performance as measured by reaction time.Although fluctuations in reaction time may reflect a variety ofprocesses including attention, motivation, and time since thelast rest break, differences in brain-reaction-time correlationsacross conflict conditions should result in a subtraction of thesegeneral factors, thus isolating conflict-specific processes (Co-hen and Cavanagh 2011).
We computed cross-trial correlations between time-frequencypower and reaction time separately for the total power and thenon-phase-locked power. Significant correlations across condi-tions were seen in the delta-theta bands from around 500 to 1,000ms in the stimulus-locked analyses and in the theta band fromaround �500 to �100 ms in the response-locked analyses (Fig. 6,A and B). There were significant increases in the correlationcoefficients for high- compared with low-conflict trials in the thetaband in both stimulus- and response-locked analyses. In none ofthe analyses was there significant differences in correlation coef-ficients between total vs. non-phase-locked power. Statisticalpower analyses on the difference in Fisher z-transformed correla-tion coefficients between high- and low-conflict conditions fortotal power (using an � of 0.01 and a time-frequency window of4–8 Hz, 350–450 ms) revealed a mean/SE of 0.0513/0.0843, aneffect size of 0.6085, and a statistical power of 0.8659. Thestatistical power for the same time-frequency window in thenon-phase-locked power-reaction-time correlations was 0.6168.
We next computed within-subject cross-trial correlations be-tween reaction times and the single-trial ERPs (the time-domainEEG signal on each trial). The single-trial ERPs significantlycorrelated with reaction times in both conditions from around 200to 900 ms in the stimulus-locked plots and from around �80 to�600 ms in the response-locked plots (Fig. 6, C and D). However,there were no significant differences in correlation coefficientsbetween high- and low-conflict trials. In a subsequent analysis, wequantified the extent to which the EEG on each trial resembled thetrial-averaged ERP (see MATERIALS AND METHODS). These single-trial weights were then correlated with reaction time within sub-ject. At the group level, the correlation coefficients were weakly
theta
theta≠.5erp
erp≠.5theta≠erp
−200 stim 200 400Time (ms) Time (ms)
600 800
0.5
0.6
0.7
0.8
0.9
stim
A Stimulus-related B Response-related
200 400
Freq
uenc
y (H
z)A
vera
ge b
inar
ized
β-c
oeffi
cien
t 600 8002
4
8
15
30
60
−400 −200 resp 200 400 600
−400 −200 resp 200 400 600
theta
theta≠.5erp
erp≠.5theta≠erp
0.2
0.4
0.6
0.8
Fig. 5. Results from within-subject logistic regression analyses shown forelectrode FCz. Based on EEG time-frequency power or time-domain ampli-tude, a logistic regression was applied to classify each trial as being low- orhigh-conflict. �-Coefficients were binarized for each subject and averaged. .5Indicates chance-level performance, values �0.5 indicate that greater power/amplitude predicts high-conflict trials, and values �0.5 indicate that greaterpower/amplitude predicts low-conflict trials. A and B show results fromstimulus-related and response-related analyses, respectively. Results weretested at P � 0.001 against 0.5 using nonparametric t-tests (dark gray andgreen bars) and for the theta accuracy against the ERP accuracy (red bar onbottom of plot).
2759CONFLICT-RELATED THETA IS NON-PHASE-LOCKED
J Neurophysiol • doi:10.1152/jn.00479.2013 • www.jn.org

but reliably different from zero for both conditions (low-conflicttrials, mean r � �0.059, t39 � �3.87, P � 0.0004; high-conflicttrials, mean r � �0.068, t39 � �3.98, P � 0.0002). However, thecondition difference in correlation coefficients was not significantacross subjects (t39 � �0.49, P � 0.623). Note that it is difficultto interpret the sign of a correlation coefficient with an ERPbecause its polarity is related to the orientation of the dipole. Incontrast, the sign of a correlation coefficient with band-specificpower has a clear interpretation because trial-varying fluctuationsin power are not dependent on dipole orientation.
DISCUSSION
Midfrontal EEG components and conflict processing. Twoelectrophysiological signatures of response conflict that aremost commonly studied are the N2 (Gajewski et al. 2008; vanVeen and Carter 2002; Yeung et al. 2004) and midfrontal thetapower (Cavanagh et al. 2012; Nigbur et al. 2012). So far, it hasremained unclear how these two signatures are related to eachother. In some papers, authors conflate the two as if theymeasure the same neurocognitive process, but this has been
−400 −200 RT 200 400 600−400 −200 RT 200 400 600
All conditions vs. baseline
A Stimulus-locked time-frequency correlations
B Response-locked time-frequency correlations
stim 200Time (ms)
400 600 800 1000
High conflict - low conflict
All conditions vs. baseline
Time (ms)
High conflict - low conflict
stim 200 400 600 800 1000
−.2
+.2
correl. with R
T
−.1
+.1
correl. with R
T
−.2
+.2
correl. with R
T
−.1
+.1
correl. with R
T
Tota
l N
on-p
hase
-lock
ed
Hz
Tota
l N
on-p
hase
-lock
ed
Hz
C Stimulus-locked ERP correlations D Response-locked ERP correlations
Cor
rela
tion
(rho
)
stim 200 400Time (ms)
600 800 1000
2
4
8
15
30
60
2
4
8
15
30
60
2
4
8
15
30
60
2
4
8
15
30
60
-.2
-.1
0
−200 RT 200 400 600
2
4
8
15
30
60
2
4
8
15
30
60
2
4
8
15
30
60
2
4
8
15
30
60
−0.12
−0.08
−0.04
0
0.04
High conflictLow conflict
High conflictLow conflict
Fig. 6. Correlation (correl.) coefficients (y-axis orcolor scale) over time or time-frequency betweensingle-trial EEG data and reaction time (RT) plot-ted separately for stimulus-locked (A and C) andresponse-locked (B and D) data. Black contoursin A and B outline regions of statistical signifi-cance. Difference maps between total and non-phase-locked power are not shown because therewere no significant differences in any of the 4plots. In C and D, gray patches indicate signifi-cant time-domain EEG-RT correlation coeffi-cients. Although the correlation coefficientsacross subjects differed significantly from 0 whenaveraging over both conditions, there were nodifferences in correlation coefficients betweenhigh- and low-conflict trials (hence, the graypatches are drawn to the average of the 2conditions).
2760 CONFLICT-RELATED THETA IS NON-PHASE-LOCKED
J Neurophysiol • doi:10.1152/jn.00479.2013 • www.jn.org

purely speculative and not based on quantitative assessments.Some authors have suggested that midfrontal theta-band activ-ity during cognitive control tasks may be the result of applyingfilters to a transient ERP waveform (Yeung et al. 2007),whereas others have shown that a substantial portion of theEEG activity time-locked to errors is non-phase-locked (Tru-jillo and Allen 2007) and seems to correlate only weakly withthe error-related negativity (Cavanagh et al. 2012). Thoseprevious studies focused on the error-related negativity, and itwas not clear whether the conflict-related EEG signal alsocomprises largely non-phase-locked activity. Furthermore, thefunctional significance of the ERP vs. the non-phase-lockedactivity with respect to task performance has not been previ-ously investigated, nor was their statistical robustness evalu-ated in terms of within-subject dynamics or statistical power.Other studies that directly compared ERP and time-frequencydynamics underlying cognitive control processes are moredifficult to interpret. For example, Harper and colleagues(2013) computed the time-frequency dynamics from the ERP,thus ignoring the single-trial data; furthermore, the authors didnot control for possible global effects as we did with the partialcorrelation approach. Another study attempted to compare theN2 to midfrontal theta (Hajihosseini and Holroyd 2013), butthis comparison is difficult to interpret because the data wereaveraged over subjects per task and condition, thus using only6 data points to compute correlation coefficients (each datapoint corresponded to 1 task/condition, and 1 data point is anoutlier that seems to drive the effect; see Fig. 3 in their paper).Furthermore, the tasks across which data were compared werequalitatively distinct (“oddball” infrequent event detection vs.valenced feedback during learning), and it is not reasonable toassume that a brain oscillation speed reflects the same high-level psychological process in all tasks.
Here, we show that: 1) a major component (�80%) oftask-related theta power modulations over midfrontal cortex istime-locked but not phase-locked to stimulus onset or response(the specific modulation by conflict condition was �100%non-phase-locked); 2) this non-phase-locked theta power re-flected conflict conditions more reliably than the phase-lockedEEG component in within-subject regression analyses; and 3)non-phase-locked theta power also showed robust and condi-tion-specific (high- vs. low-conflict) single-trial correlationswith reaction time, whereas the phase-locked EEG componentdid not. These findings suggest that most of the task-relevantEEG signal during response conflict reflects frequency band-limited non-phase-locked theta-band oscillations within themedial frontal cortex (see also Nigbur et al. 2012). Specifically,our findings suggest a more important functional role of mid-frontal theta-band oscillations in conflict monitoring and top-down control of sensory-motor decision-making than the typ-ically studied ERP correlates of response conflict, the N2 andsubsequent P3.
Modulations of EEG power have been interpreted as reflect-ing oscillations if they are band-limited and non-phase-lockedto an external stimulus or motor movement [Donner and Siegel2011; Pfurtscheller and Lopes da Silva 1999; Tallon-Baudryand Bertrand 1999; but see David et al. (2006) for a morecomplex distinction between evoked and induced neural activ-ity]. The conflict-related midfrontal theta activity clearly meetsthese criteria. The conflict-related changes in power werespectrally localized to the theta band (with a distinct spectral
peak at 6.5 Hz), and they remained nearly unchanged whensubtracting the ERP (using 2 different methods for subtractingthe ERP: assuming amplitude invariance over trials or assum-ing shape-invariance and fitting the amplitude of the ERP toeach trial separately). Consequently, our findings are consistentwith conflict-related theta power modulations reflecting non-phase-locked oscillations.
There are several explanations for why conflict-related thetaactivity has previously been suspected to reflect the ERP: boththe theta power increase and the ERP occur at roughly the sametime, the increase in theta power relative to the prestimulusbaseline lasts a few hundred milliseconds, and ERPs aregenerally dominated by low-frequency activity overlappingwith (although typically extending beyond) the theta band. Ourpresent findings decouple the theta-band modulations from theERP, suggesting that these two EEG signatures reflect distinctneural processes. This is consistent with previous reports ofweak and often nonsignificant correlations between ERP andtime-frequency measures of conflict and feedback learning(Cavanagh et al. 2012; Cohen et al. 2007) and is consistentwith the conflict modulation primarily affecting power and notintertrial phase clustering (that is, the phase-locked part of thesignal; Nigbur et al. 2012). It remains to be determined pre-cisely what neurocognitive processes are measured by the ERPvs. the non-phase-locked theta, although it is clear that discuss-ing the 2 as if they were different reflections of the same neuralprocess is inappropriate. In the present data set (comprising 2experiments), the theta-band activity, compared with the ERP,was more closely linked to trial-varying task performance asmeasured by reaction time (Fig. 6) and was a more robuststatistical predictor of single-trial conflict condition (Fig. 5). Incontrast, the N2 did not outperform the time-frequency repre-sentation in any link to behavior or in statistical robustness.
The brevity of the conflict modulation of theta power likelyreflects the phasic nature of some aspects of cognitive controlprocesses in response conflict tasks, in particular, those top-down control processes that are maximally engaged betweenthe stimulus and response. Invasive recordings have shown thatstimulus- and task-related modulations of neural oscillations inother frequency bands tend to occur in brief bursts, both in thevisual cortex (Gray and Singer 1989) and in motor cortex(Murthy and Fetz 1992). Furthermore, sensory-motor decisionprocesses are associated with brief bursts of non-phase-lockedoscillatory long-range synchronization between frontal andparietal cortex (Pesaran et al. 2008). Our findings suggest thatthe medial frontal cortex produces brief bursts of theta-bandoscillations during top-down control. These bursts are time-locked, but not phase-locked, to stimulus onset and responseand have a duration of a few (about 2–4) cycles of the thetarhythm. It is likely that these transient theta dynamics serve asa communication medium to coordinate long-range networksas demonstrated by several findings linking interregional theta-band phase synchrony to cognitive control and related pro-cesses (Cavanagh et al. 2009; Cohen 2011; Phillips et al. 2013;Polania et al. 2012).
Defining the ERP as the phase-locked time-domain compo-nent of the EEG, our findings are clearly inconsistent with thenotion that the conflict-related frontal theta power results fromfiltering the ERP. Our definition of the ERP as comprisingphase-locked activity relies on the assumption that the ERPexists at the single-trial level and has roughly the same time
2761CONFLICT-RELATED THETA IS NON-PHASE-LOCKED
J Neurophysiol • doi:10.1152/jn.00479.2013 • www.jn.org

course on each trial (although we allowed the amplitude to varyon each trial, and this did not qualitatively affect the results).One might still argue that an ERP with a random latency jitteron each trial would produce a band-limited and non-phase-locked time-frequency feature. However, this “moving-target”interpretation of the ERP simply sidesteps the issue by makingthe ERP an unquantifiable phenomenon that is difficult todisprove or use in single-trial analyses. Furthermore, thisaccount does not provide a compelling neurophysiologicallyplausible mechanism for the theta-band signal that remainsafter subtracting the phase-locked ERP. In contrast, acceptingthat the theta-band conflict modulation reflects brain oscillatoryprocesses provides a number of compelling interpretations,links to animal physiology and computational studies, and newhypotheses as we outline in the next section. We stress herethat our interpretations and conclusions concern only the con-flict-related EEG modulations; the extent to which other ERPcomponents may or may not exist on single trials, and howthey might be related to oscillatory mechanisms, is a separatematter that should be addressed for each ERP component (e.g.,Makeig et al. 2002). Indeed, it is not reasonable to assume thatall ERP components are generated by the same neurophysio-logical mechanisms.
Implications and conclusions. Our results have several im-portant implications. The first implication is that they establisha direct link between high-level studies of conflict processingin human decision-making and in vivo and in vitro neurophys-iology studies of oscillations. Neural oscillations are evidentacross many spatial and temporal scales of the brain, frommembrane potentials of individual neurons to intracortical fieldpotentials to large-scale scalp EEG measurements (Donner andSiegel 2011; Siegel et al. 2012; Varela et al. 2001). Theunderlying biophysical cellular and network mechanisms ofoscillations are increasingly well-understood (Wang 2010),and these oscillations may provide the scaffolding for flexiblelocal and long-range neural communication in large-scale brainnetworks (Akam and Kullmann 2012; Fries 2005; Miller andWilson 2008; Siegel et al. 2012). Specifically, medial prefron-tal regions act as a key node in a network that monitorsongoing behavior for potential conflicts and engages otherbrain systems to perform online and goal-directed behavioradaptations. We speculate that theta-band oscillations reflectthe medium of communication within this network (Cavanaghet al. 2009; Cohen 2011; Cohen et al. 2011).
The second implication of our findings is to set the stage fortesting the causal role of theta-band oscillations in conflictprocessing. For example, if theta-band oscillations underlieconflict monitoring and resolution, then exogenously boostingtheta-band oscillations should boost conflict task performance(in contrast, it is difficult to imagine how to boost an ERPwithout a task). Furthermore, if theta-band oscillatory synchro-nization is a mechanism by which information can be inte-grated over large-scale brain networks (Cohen 2011), thenentraining large-scale brain networks in the theta band shouldimprove performance on cognitive control tasks. In fact, thiswas recently demonstrated in humans (Polania et al. 2012).Finally, if the increase in non-phase-locked theta power is briefbecause cognitive control requirements are brief, then theduration of the theta power increase should correlate with theduration of time in which cognitive control remains active.
The third implication of our findings is that they clearlyhighlight the utility of spectral analysis of EEG data in thestudy of conflict processing. Even if one is not interested inbrain oscillations or neurophysiological mechanisms, fromsignal-processing and statistical perspectives, analysis ap-proaches that are strongly linked to task conditions and behav-ioral performance (non-phase-locked theta dynamics) shouldbe preferred over analysis approaches that are weakly ornonsignificantly correlated with task conditions and behavior(ERP) and that have little neurophysiological interpretability.
In conclusion, we demonstrated that the human EEG signa-ture of response conflict is centered over midfrontal topo-graphic regions and reflects theta-band activity that is time-locked, but not phase-locked, to stimulus onset and response.These findings indicate that conflict effects in human medialfrontal cortex primarily reflect non-phase-locked neural theta-band oscillations. These oscillations may facilitate coordina-tion of neural processing in the sensorimotor pathways of thebrain to support efficient decision-making.
ACKNOWLEDGMENTS
Thanks to Irene van de Vijver and Jessika Buitenweg for help programmingthe tasks and collecting data and to Rasa Gulbinaite for help with the statisticalpower analyses. Thanks also to John J. B. Allen for helpful comments on themanuscript.
GRANTS
M. X. Cohen is funded by a VIDI Grant from the Netherlands Organizationfor Scientific Research (NWO).
DISCLOSURES
No conflicts of interest, financial or otherwise, are declared by the author(s).
AUTHOR CONTRIBUTIONS
M.X.C. conception and design of research; M.X.C. performed experiments;M.X.C. analyzed data; M.X.C. and T.H.D. interpreted results of experiments;M.X.C. and T.H.D. prepared figures; M.X.C. drafted manuscript; M.X.C. andT.H.D. edited and revised manuscript; M.X.C. and T.H.D. approved finalversion of manuscript.
REFERENCES
Akam TE, Kullmann DM. Efficient “communication through coherence”requires oscillations structured to minimize interference between signals.PLoS Comput Biol 8: e1002760, 2012.
Botvinick MM, Braver TS, Barch DM, Carter CS, Cohen JD. Conflictmonitoring and cognitive control. Psychol Rev 108: 624–652, 2001.
Button KS, Ioannidis JP, Mokrysz C, Nosek BA, Flint J, Robinson ES,Munafo MR. Power failure: why small sample size undermines the reli-ability of neuroscience. Nat Rev Neurosci 14: 365–376, 2013.
Carter CS, van Veen V. Anterior cingulate cortex and conflict detection: anupdate of theory and data. Cogn Affect Behav Neurosci 7: 367–379, 2007.
Cavanagh JF, Cohen MX, Allen JJ. Prelude to and resolution of an error:EEG phase synchrony reveals cognitive control dynamics during actionmonitoring. J Neurosci 29: 98–105, 2009.
Cavanagh JF, Zambrano-Vazquez L, Allen JJ. Theta lingua franca: acommon mid-frontal substrate for action monitoring processes. Psychophys-iology 49: 220–238, 2012.
Cohen MX. Analyzing Neural Time Series Data: Theory and Practice.Cambridge, MA: MIT Press, 2014.
Cohen MX. Error-related medial frontal theta activity predicts cingulate-related structural connectivity. Neuroimage 55: 1373–1383, 2011.
Cohen MX, Cavanagh JF. Single-trial regression elucidates the role ofprefrontal theta oscillations in response conflict. Front Psychol 2: 30, 2011.
2762 CONFLICT-RELATED THETA IS NON-PHASE-LOCKED
J Neurophysiol • doi:10.1152/jn.00479.2013 • www.jn.org

Cohen MX, Elger CE, Ranganath C. Reward expectation modulates feed-back-related negativity and EEG spectra. Neuroimage 35: 968–978, 2007.
Cohen MX, Ridderinkhof KR. EEG source reconstruction reveals frontal-parietal dynamics of spatial conflict processing. PLoS One 8: e57293, 2013.
Cohen MX, Ridderinkhof KR, Haupt S, Elger CE, Fell J. Medial frontalcortex and response conflict: evidence from human intracranial EEG andmedial frontal cortex lesion. Brain Res 1238: 127–142, 2008.
Cohen MX, Wilmes K, Vijver I. Cortical electrophysiological networkdynamics of feedback learning. Trends Cogn Sci 15: 558–566, 2011.
Cohen MX, van Gaal S. Subthreshold muscle twitches dissociate oscillatoryneural signatures of conflicts from errors. Neuroimage. In press.
David O, Kilner JM, Friston KJ. Mechanisms of evoked and inducedresponses in MEG/EEG. Neuroimage 31: 1580–1591, 2006.
Donner TH, Sagi D, Bonneh YS, Heeger DJ. Opposite neural signatures ofmotion-induced blindness in human dorsal and ventral visual cortex. JNeurosci 28: 10298–10310, 2008.
Donner TH, Siegel M. A framework for local cortical oscillation patterns.Trends Cogn Sci 15: 191–199, 2011.
Donner TH, Siegel M, Fries P, Engel AK. Buildup of choice-predictiveactivity in human motor cortex during perceptual decision making. CurrBiol 19: 1581–1585, 2009.
Faul F, Erdfelder E, Lang AG, Buchner A. G*Power 3: a flexible statisticalpower analysis program for the social, behavioral, and biomedical sciences.Behav Res Methods 39: 175–191, 2007.
Folstein JR, Van Petten C. Influence of cognitive control and mismatch onthe N2 component of the ERP: a review. Psychophysiology 45: 152–170,2008.
Fries P. A mechanism for cognitive dynamics: neuronal communicationthrough neuronal coherence. Trends Cogn Sci 9: 474–480, 2005.
Gajewski PD, Stoerig P, Falkenstein M. ERP–correlates of response selec-tion in a response conflict paradigm. Brain Res 1189: 127–134, 2008.
Gray CM, Singer W. Stimulus-specific neuronal oscillations in orientationcolumns of cat visual cortex. Proc Natl Acad Sci USA 86: 1698–1702, 1989.
Hajihosseini A, Holroyd CB. Frontal midline theta and N200 amplitudereflect complementary information about expectancy and outcome evalua-tion. Psychophysiology 50: 550–562, 2013.
Harper J, Malone SM, Bernat EM. Theta and delta band activity explain N2and P3 ERP component activity in a go/no-go task. Clin Neurophysiol. Firstpublished July 25, 2013; doi:10.1016/j.clinph.2013.06.025.
Holroyd CB, Coles MG. The neural basis of human error processing:reinforcement learning, dopamine, and the error-related negativity. PsycholRev 109: 679–709, 2002.
Holroyd CB, Dien J, Coles MG. Error-related scalp potentials elicited byhand and foot movements: evidence for an output-independent error-pro-cessing system in humans. Neurosci Lett 242: 65–68, 1998.
Hughes G, Yeung N. Dissociable correlates of response conflict and errorawareness in error-related brain activity. Neuropsychologia 49: 405–415,2011.
Kalcher J, Pfurtscheller G. Discrimination between phase-locked and non-phase-locked event-related EEG activity. Electroencephalogr Clin Neuro-physiol 94: 381–384, 1995.
Makeig S, Debener S, Onton J, Delorme A. Mining event-related braindynamics. Trends Cogn Sci 8: 204–210, 2004.
Makeig S, Westerfield M, Jung TP, Enghoff S, Townsend J, CourchesneE, Sejnowski TJ. Dynamic brain sources of visual evoked responses.Science 295: 690–694, 2002.
Maris E, Oostenveld R. Nonparametric statistical testing of EEG- andMEG-data. J Neurosci Methods 164: 177–190, 2007.
Miller EK, Cohen JD. An integrative theory of prefrontal cortex function.Annu Rev Neurosci 24: 167–202, 2001.
Miller EK, Wilson MA. All my circuits: using multiple electrodes to under-stand functioning neural networks. Neuron 60: 483–488, 2008.
Murthy VN, Fetz EE. Coherent 25- to 35-Hz oscillations in the sensorimotorcortex of awake behaving monkeys. Proc Natl Acad Sci USA 89: 5670–5674, 1992.
Nigbur R, Cohen MX, Ridderinkhof KR, Sturmer B. Theta dynamicsreveal domain-specific control over stimulus and response conflict. J CognNeurosci 24: 1264–1274, 2012.
Pesaran B, Nelson MJ, Andersen RA. Free choice activates a decision circuitbetween frontal and parietal cortex. Nature 453: 406–409, 2008.
Pfurtscheller G, Lopes da Silva FH. Event-related EEG/MEG synchroniza-tion and desynchronization: basic principles. Clin Neurophysiol 110: 1842–1857, 1999.
Phillips JM, Vinck M, Everling S, Womelsdorf T. A long-range fronto-parietal 5- to 10-Hz network predicts “top-down” controlled guidance in atask-switch paradigm. Cereb Cortex. First published February 28, 2013;doi:10.1093/cercor/bht050.
Polania R, Nitsche MA, Korman C, Batsikadze G, Paulus W. The impor-tance of timing in segregated theta phase-coupling for cognitive perfor-mance. Curr Biol 22: 1314–1318, 2012.
Ridderinkhof KR, van den Wildenberg WP, Segalowitz SJ, Carter CS.Neurocognitive mechanisms of cognitive control: the role of prefrontalcortex in action selection, response inhibition, performance monitoring, andreward-based learning. Brain Cogn 56: 129–140, 2004.
Riesel A, Weinberg A, Endrass T, Meyer A, Hajcak G. The ERN is theERN is the ERN? Convergent validity of error-related brain activity acrossdifferent tasks. Biol Psychol 93: 377–385, 2013.
Siegel M, Donner TH, Engel AK. Spectral fingerprints of large-scale neuro-nal interactions. Nat Rev Neurosci 13: 121–134, 2012.
Tallon-Baudry C, Bertrand O. Oscillatory gamma activity in humans and itsrole in object representation. Trends Cogn Sci 3: 151–162, 1999.
Trujillo LT, Allen JJ. Theta EEG dynamics of the error-related negativity.Clin Neurophysiol 118: 645–668, 2007.
van Veen V, Carter CS. The anterior cingulate as a conflict monitor: fMRIand ERP studies. Physiol Behav 77: 477–482, 2002.
Varela F, Lachaux JP, Rodriguez E, Martinerie J. The brainweb: phasesynchronization and large-scale integration. Nat Rev Neurosci 2: 229–239,2001.
Wang C, Ulbert I, Schomer DL, Marinkovic K, Halgren E. Responses ofhuman anterior cingulate cortex microdomains to error detection, conflictmonitoring, stimulus-response mapping, familiarity, and orienting. J Neu-rosci 25: 604–613, 2005.
Wang XJ. Neurophysiological and computational principles of corticalrhythms in cognition. Physiol Rev 90: 1195–1268, 2010.
Womelsdorf T, Johnston K, Vinck M, Everling S. Theta-activity in anteriorcingulate cortex predicts task rules and their adjustments following errors.Proc Natl Acad Sci USA 107: 5248–5253, 2010.
Wuhr P, Ansorge U. Exploring trial-by-trial modulations of the Simon effect.Q J Exp Psychol A 58: 705–731, 2005.
Yeung N, Bogacz R, Holroyd CB, Nieuwenhuis S, Cohen JD. Theta phaseresetting and the error-related negativity. Psychophysiology 44: 39–49,2007.
Yeung N, Botvinick MM, Cohen JD. The neural basis of error detection:conflict monitoring and the error-related negativity. Psychol Rev 111:931–959, 2004.
2763CONFLICT-RELATED THETA IS NON-PHASE-LOCKED
J Neurophysiol • doi:10.1152/jn.00479.2013 • www.jn.org


![p.dmm.com · 2016-08-05 · Instagram RICOH THETA theta3600fficial RICOH RICOH THETA official RICOH THETA 13 I Tube RICOH THETA . RICOH imagine. change. rRlCOH THETA ETA] RIC THETA](https://static.fdocuments.net/doc/165x107/5fa315d5ae82834598690dcf/pdmmcom-2016-08-05-instagram-ricoh-theta-theta3600fficial-ricoh-ricoh-theta.jpg)