MIDDLE-SCHOOL MATHEMATICS CURRICULA AND STUDENTS …
18
MIDDLE-SCHOOL MATHEMATICS CURRICULA AND STUDENTS WITH LEARNING DISABILITIES: IS ONE CURRICULUM BETTER? Emily C. Bouck and Gauri Kulkarni Abstract. Little is known about how best to teach mathematics to students with learning disabilities. This study explored the performance and self-reported calculator use of 13 sixth-grade and 15 seventh-grade students with learning disabilities educated in either standards-based or traditional mathematics curricula on multiple-choice and open-ended assessments. Across both groups of students: (a) curriculum did not impact the number of prob- lems students answered correctly, (b) students answered more problems correctly on the multiple-choice than on the open- ended assessments, (c) students self-reported low percentages of calculator use, and (d) curriculum did not impact students' self- reported calculator use. Overall, the results suggest that students with learning disabilities are not advantaged or disadvantaged by receiving either a traditional or a standards-based mathematics curriculum. EMILY C. BOUCK, Ph.D., College of Education, Purdue University. GAUm KULKARNI, Collese of Education, Purdue University. Students with learning disabilities often struggle with mathematics, ranging from basic facts to problem solv- ing (Calhoon, Emerson, Flores, & Houchins, 2007; Jitendra, DiPipi, & Perron-Jones, 20002; Parmar, Cawley, & Frazita, 1996). These students are typically behind their peers without disabilities, often performing below grade level (Cawley & Miller, 1989; Wagner, 1995). While some research has documented these struggles, much less research has been conducted on mathematics and students with learning disabilities than on literacy (Fuchs & Fuchs, 2005; Fuchs et al., 2007). The limited research in this area is a critical deficiency considering that mathematics is a core content area and, under No Child Left Behind (NCLB, 2002), is to be assessed yearly in grades 3-8 and once again in high school for all students, including students with disabil- ities. Further, mathematics, and specifically algebra, is considered foundational to general success in life as well as future job options (Algozzine, O'Shea, Crews, & Stoddard, 1987; Maccini, McNaughton, ¿i Ruhl, 1999; Xin, jitendra, & Deatline-Buchman, 2005). For students with learning disabilities, the issue of curricular philosophy and approach to teaching and learning mathematics has received little attention. Thus, largely absent are pedagogical discussions com- paring standards-based instructional materials that are problem centered and focus on conceptual develop- ment to traditional materials that focus on learning rules, procedures, and definitions (Cawley, 2002; Hudson, Miller, & Butler, 2006). Yet, within the last decade, curricular emphasis has become more impor- tant as school mathematics programs implement itis Disability Quarterly 228
Transcript of MIDDLE-SCHOOL MATHEMATICS CURRICULA AND STUDENTS …
MIDDLE-SCHOOL MATHEMATICS CURRICULAAND STUDENTS WITH LEARNING DISABILITIES:
IS ONE CURRICULUM BETTER?
Emily C. Bouck and Gauri Kulkarni
Abstract. Little is known about how best to teach mathematicsto students with learning disabilities. This study explored theperformance and self-reported calculator use of 13 sixth-grade and15 seventh-grade students with learning disabilities educated ineither standards-based or traditional mathematics curricula onmultiple-choice and open-ended assessments. Across both groupsof students: (a) curriculum did not impact the number of prob-lems students answered correctly, (b) students answered moreproblems correctly on the multiple-choice than on the open-ended assessments, (c) students self-reported low percentages ofcalculator use, and (d) curriculum did not impact students' self-reported calculator use. Overall, the results suggest that studentswith learning disabilities are not advantaged or disadvantaged byreceiving either a traditional or a standards-based mathematicscurriculum.
EMILY C. BOUCK, Ph.D., College of Education, Purdue University.GAUm KULKARNI, Collese of Education, Purdue University.
Students with learning disabilities often struggle withmathematics, ranging from basic facts to problem solv-ing (Calhoon, Emerson, Flores, & Houchins, 2007;Jitendra, DiPipi, & Perron-Jones, 20002; Parmar, Cawley,& Frazita, 1996). These students are typically behindtheir peers without disabilities, often performing belowgrade level (Cawley & Miller, 1989; Wagner, 1995).While some research has documented these struggles,much less research has been conducted on mathematicsand students with learning disabilities than on literacy(Fuchs & Fuchs, 2005; Fuchs et al., 2007).
The limited research in this area is a critical deficiencyconsidering that mathematics is a core content areaand, under No Child Left Behind (NCLB, 2002), is to beassessed yearly in grades 3-8 and once again in highschool for all students, including students with disabil-
ities. Further, mathematics, and specifically algebra, isconsidered foundational to general success in life as wellas future job options (Algozzine, O'Shea, Crews, &Stoddard, 1987; Maccini, McNaughton, ¿i Ruhl, 1999;Xin, jitendra, & Deatline-Buchman, 2005).
For students with learning disabilities, the issue ofcurricular philosophy and approach to teaching andlearning mathematics has received little attention.Thus, largely absent are pedagogical discussions com-paring standards-based instructional materials that areproblem centered and focus on conceptual develop-ment to traditional materials that focus on learningrules, procedures, and definitions (Cawley, 2002;Hudson, Miller, & Butler, 2006). Yet, within the lastdecade, curricular emphasis has become more impor-tant as school mathematics programs implement
itis Disability Quarterly 228
instructional materials aligned with the NationalCouncil for Teachers of Mathematics (NClTvl) standards(NCTM, 2()0()), and hence take a more prohlem-cen-tered, conceptually based approach to teaching andlearning (Maccini & Gagnon, 2002; Woodward, 2(K)4).The concern over curricular emphasis has been particu-larly directed at the middle grades (i.e., sixth, seventh,and eighth) (RIordan & Noyce, 2(X)1), due to the fallingU.S. scores at these grades compared to internationalachievement. The poor performance of students in theUnited States has made middle-grades mathematics anational concern and points to the need for additionalresearch (Schmidt, Houng, St Cogan, 2002).
While limited research has isolated and examined stu-dents with disabilities with respect to curricular impact,the research from general education suggests that math-ematics curricular orientation matters (Carroll, 1998;Cobb et al., 1991; Reys, Reys, Lapan, Holliday, &Wasman, 2003; Riordan & Noyce, 2001; Wood &Sellers, 1997). Reys et al. and Riordan and Noyce foundthat middle-school students, without documented dis-abilities, who received a standards-based curriculumperformed hetter on assessments than those whoreceived a traditional curriculum. Although these stud-ies highlight the promise of standards-based curriaila,the exclusion of students with disabilities is a concern.As students with learning disabilities are increasinglybeing educated in genera! education classes, one has towonder what inclusion means for these students andtheir learning of mathematics (DeSimone & Parmar,2006; U.S. Department of Education, 2005).
The curricular dichotomy in niathematics education,often referred to as the Math Wars (Reys, 2001; Schoen,Fey, Hirsch, & Coxford, 1999), pits traditional curricularapproaches against those designed to follow the NCTMstandards (1989, 2000). This dichotomy raises severalissues. First, traditional and standards-based mathemat-ics curricula have different foci, such as learning algo-rithms for computational fluency vs. developingconceptual understanding with a more problem-solvingorientation (Gagnon & Maccini, 2007). While researchsuggests tbat students with learning disabilities strugglein both areas, how to develop the conceptual under-standing and problem-solving skills of these studentshas received less research than basic facts or computa-tional fluency (Fuchs & Fuchs, 2005).
Another issue embedded in this curricular dichotomyis the orientation towards calculator use in mathematicsclasses. The NCTM (20(X)) standards advocate using cal-culators in the teaching and learning of mathematics,and standards-based curricula incorporate this tool intotheir instructional materials, whereas most traditionalprograms do not. Critics suggest use of calculatorsresults in student laziness and a lack of ability to per-
form mental math (Loveless, 2004; Pomerantz, 1997).Proponents, however, note that calculators can developa deeper conceptual understanding of mathematics top-ics, encourage knowledge sharing among students, andhelp improve test scores (Burrill et al., 2002; Goos,Galbraith, Renshaw, & Geiger, 2003). These two issuesalone - the focus on computational fluency vs. problemsolving and the use of calculators - indicate the need tobetter understand the impact of curricular philosophyon students with learning disabilities educated in inclu-sive mathematics classes.
Although scholars have called for studies comparingthe impact of curricular orientation (standard.s-basodvs. traditional) on students with learning disabilities(Cawley, 2002; Gagnon is Maccini, 2007), few suchstudies have been conducted to date. The lack ofresearch may be a result of the historical way of teach-ing mathematics in special education - a more proce-dural-driven/traditional approach (i.e., learning rulesand basic facts) (Cawley; Cawley, Parmar, Yan, 8t Miller,1998; Woodward, 2004). It may also reflect the limitedresearch devoted to mathematics in special education,or the challenge this type of research presents (i.e.,obtaining a large enough sample) (Fuchs & Fuchs, 2005;i-uchs et al., 2007).
The existing research on the relationship betweencurricular orientation and performance ior studentswith learning disabilities has primarily examined ele-mentary grades (Baxter, Woodward, & Olson, 2001;Woodward & Baxter, 1997). To date, these studies havenot indicated benefits for students with disabilities whoreceive a standards-based curriculum compared to a tra-ditional one; however, they also have not shown anyharm (Baxter et al.; Woodward & Baxter).
At the secondary level, one study was found thatexamined standards-based curricula for students withdisabilities (Woodward 6t Brown, 2(X)6). It comparedtwo types of standards-based niathematics curricula -one developed for all students and one developed forstudents with disabilities. Woodward and Brown foundthat students with disabilities performed better and hada better attitude towards the standards-based mathe-matics curriculum designed specifically for them.
Given the increased focus on mathetnatics education(NCLB, 2002), the increase in the number of studentswith learning disabilities in inclusive classes (DeSimone& Parmar, 2006), and the use of both traditional andstandards-based curricula, as outlined In the NCTM(2000) standards, more research is needed.
This article addresses one aspect of a large project thatinvolved data collection on students with and withoutdisabilities educated using either a traditional or a stan-dards-based middle-school mathematics curriculumover the course of a school year (i.e., September through
Volume 32. Fall 2009 229
May). In particular, the article reports data on just thestudents with learning disabilities who participated, asit is important to isolate the impact of curriculum onparticular populations.
In addition to exploring the influence of curricularorientation (i.e., standards-based vs. traditional) on stu-dent performance, the researchers analyzed the effect ofcurricular orientation on calculator use. One reason forincluding an analysis of calculator use is the differentviews with which the curricular orientations approachcalculator use (i.e., standards-based advocating for cal-culator use and traditional being more reserved, lessaccepting) (Huntley, Rasmussen, Villarubi, Sangton, &Fey, 2000; Riordan & Noyce, 2001).
Another reason for analyzing calculator use is that cal-culators are a common accommodation provided to stu-dents with disabilities in their individualized educationprograms (IEPs), yet little research has examined theeffectiveness of this tool Qohnstone, Altman, Thurlow,& Thompson, 2006; Maccini & Gagnon, 2000, 2005;Ysseldyke et al., 1999). Limited research has suggestedthat calculators may be beneficial to students with dis-abilities in terms of measuring their true mathematicalabilities, yet it is difficult to tell, as studies show calcu-lators are used little by this population when given as anoption (Bouck & Bouck, 2008).
In summary, given the limited research on mathe-matics curricula and students with learning disabilitiesas well as the controversy over calculators, theresearchers sought to answer the following researchquestions:
1. What factors of curriculum, time of assessment,and exam type impact the performance of stu-dents with learning disabilities on assessments?
2. What factors of curriculum, time, and exam typeimpact the self-reported calculator use by studentswith learning disabilities on assessments?
3. Are students with learning disabilities more likelyto answer questions correctly when they use a cal-culator?
METHODSetting
The project took place in four separate school districtsin a midwestern state. The schools were located in thesame county and, thus, had similar demographics andcommunity features. All were considered rural districts,with middle schools ranging in enrollment from 282 to704 students, with a mean of 494. The student popula-tion in all four school districts was predominantlyCaucasian. The first author had an ongoing relationshipwith the schools in the county, and they had previouslyparticipated in research projects. The schools wereselected for their convenience (i.e., prior relationship) as
well as their similarity in terms of demographic features.When contacted, all four schools agreed to participate.
Two schools targeted for participation used the samestandards-based curriculum and two used the same tra-ditional curriculum. One of the two districts that used astandards-based curriculum at the middle-grades levelalso used one at the elementary level, while the otherschool used a traditional elementary mathematics cur-riculum. Both districts that implemented the traditionalmiddle-school mathematics curriculum also used a tra-ditional curriculum at the elementary level. Thus, themajority of students had been exposed to the same typeof curriculum throughout their school years, providedthey had not moved.
ParticipantsStudents. Thirteen sixth-grade students and 15 sev-
enth-grade students with learning disabilities educatedin inclusive mathematics classes participated in theresearch project (see Tables 1 and 2 for demographics).All 28 students were receiving special education for alanguage-based learning disability as indicated on theirIEPs. Learning disability was defined by the state as "asevere discrepancy between achievement and abilitythat is not correctable without special education andrelated services" (Michigan Department of Education[MDE], 2002). Specifically, the state's definition indi-cates that a learning disability is "a disorder in 1 or moreof the basic psychological processes involved in under-standing or in using language, spoken or written, thatmay manifest itself in an imperfect ability to listen,think, speak, read, write, spell, or to do mathematicalcalculations" (MDE, p. 7). According to state rules,
a child has a specific learning disability if the childdoes not achieve commensurate with his or her ageand ability in one or more areas listed in this sub-rule when provided with learning experiencesappropriate for the child's age and ability levels,and if the multidisciplinary evaluation team findsthat a child has a severe discrepancy betweenachievement and intellectual ability in 1 or more ofthe following areas: oral expression, listening com-prehension, written expression, basic reading skill,reading comprehension, mathematics calculation,mathematics reasoning. (MDE, p. 7)
The students in the study were diagnosed prior to thestate's change In rule.s, which allowed students withlearning disabilities to be diagnosed because they failedto respond to "scientific research-based procedures"(MDE, 2009, p. 17). Per the definition used by the state,all 28 students in this study had IQs within the normalrange but discrepancies in their achievement in readingand/or written expression (MDE, 2002). None of thestudents had a learning disability In mathematics.
Leiimiiig DiSiit^ility Qiiiirlerly 2M}
spécifie IQ data were not recorded for individual stu-dents, as the larger project involved more than studentswith learning disabilities, and often the IQ informationwas not provided in these students' files. Seventy-onepercent of the students in the study had a calculatorlisted as an accotnmodation on their IEPs.
The number of participants was low for multiplereasons: (a) the study took place in inclusive sixth- andseventh-grade classrooms, and students with disabili-ties were represented in low numbers; (b) students withmathetnatics disabilities were not included as partici-pants, because teachers in all schools indicated thesestudents were taught in pull-out mathematics classesby special educatioti teachers, whereas this studyoccurred in inclusive classes; and (c) only students withlearning disabilities were included in the analysis;hence from the larger study, 22 sttidents with other dis-abilities (i.e., attention deficit-hyperactivity disorder,autism spectrum disorder, hearing impairment) wereexcluded.
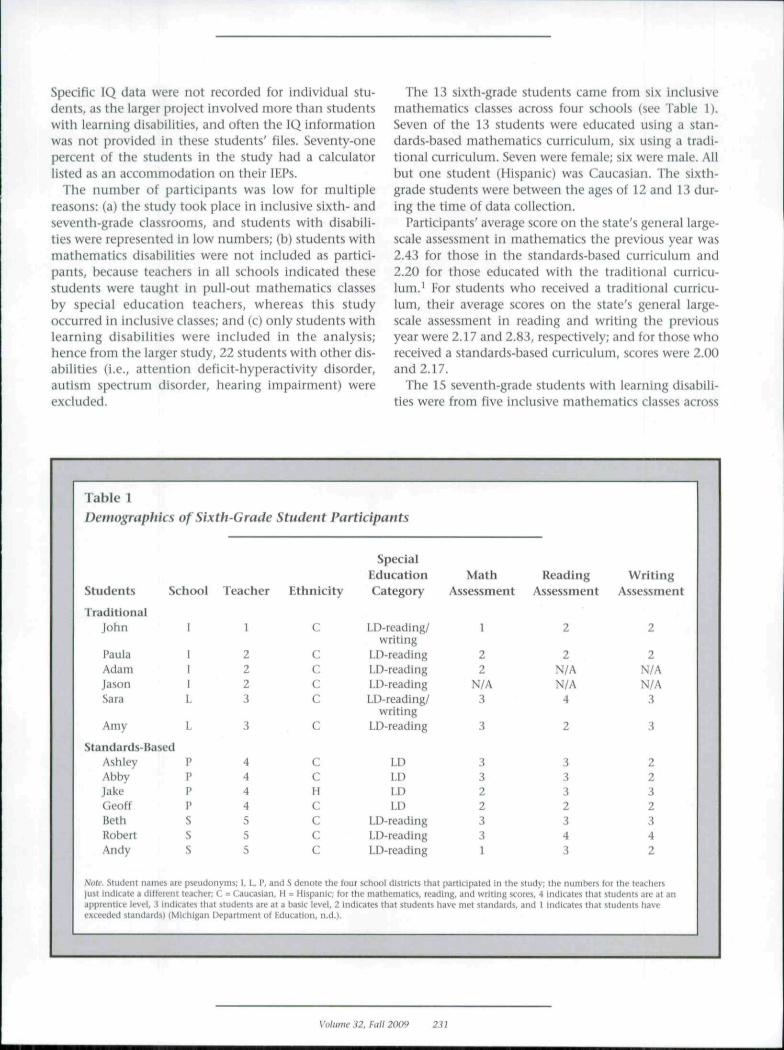
The 13 sixth-grade students came from six inclusivemathematics classes across four schools (see Table 1).Seven of the M students were educated using a stan-dards-based mathematics curriculum, six using a tradi-tional curriculutn. Seven were female; six were male. Allbut one student (Hispanic) was Caucasian. The sixth-grade students were between the ages of 12 and 13 dur-ing the time of data collection.
Participants' average score on the state's general large-scale assessment in mathematics the previous year was2.43 for those in the standards-based curriculum and2.20 for those educated with the traditional curricu-lum.' For students who received a traditional curricu-lum, their average scores on the state's general large-scale assessment in reading and writing the previousyear were 2.17 and 2.83, respectively; and for those whoreceived a standards-based curriculum, scores were 2.Ü0and 2.17.
The 15 seventh-grade students with learning disabili-ties were from five inclusive mathematics classes aaoss
lable 1Demographics of Sixth-Grade
Students SchoolIraditional
.lohn
I'aulaAdamJasonSara
Amy
Stan dards-BasedAshleyAbbyJakeGeoffBethRobertAndy
1
IIIL
L
PPPPSS
s
Teacher
1
2223
3
4444555
Student Participants
Ethnicity
C
CCCC
C
C
cHC
ccc
SpecialEducation Math ReadingCategory Assessment Assessment
LD-reading/writing
LD-read ingLD-readingLD-readingLD-reading/
writingLD-reading
LDLDLDLD
LD-readingLD-readingLD-reading
I
22
N/A3
3
332233I
2
2N/AN/A
4
2
3332343
J1nWriting -]
Assessment
2
2N/A j
N/A i 13 HH
3 H
2 jH3 HH2 IB342
Noll'. Sludt'iii nainci are pseudonyms; 1, L, P, and S denote Ihe four schmil districts that participated in the study; the numbers for the teaclicrs|ust indicate a different teacher C = Caucasian H = Hispanic; for the mathematics, reading, iind writing scores, 4 indicates thai students arc at anapprentice level, .J Indicates that students are at a basic level, 2 indicates that students have met standards, and I indicates ttiat students haveexceeded standards) (Mlciiigan Department of Education, n.d.).
nic .Í2. FaiiZOO»
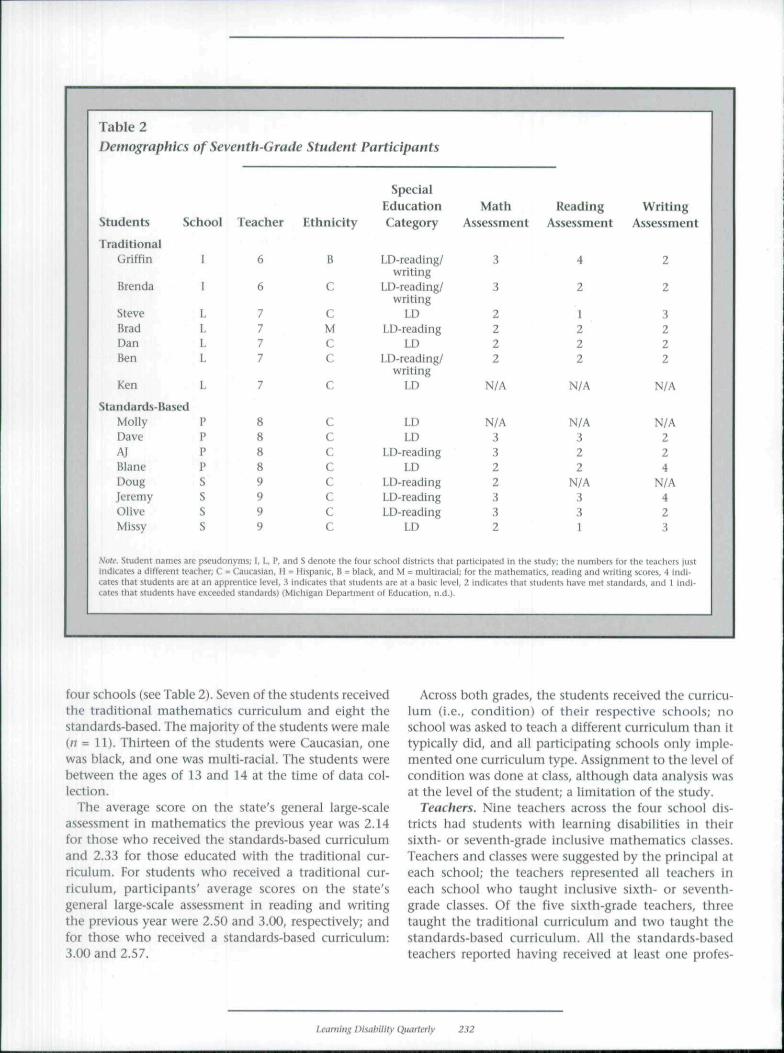
Table 2Demographicsof Seventh-Grade Student Participants
Students School
IraditionalGriffin
Brenda
SteveBradDanBen
Ken
S tan dards-BasedMollyDaveAJBlaneDougJeremyOliveMissy
1
1
LLLL
L
PPPPSSS
s
Teacher
6
6
7777
7
88889999
Ethnicity
B
C
CMCC
C
CC
cccccc
SpecialEducationCategory
LD-reading/writing
LD-reading/writing
LDLD-reading
LDLD-reading/
writingLD
LDLD
LD-readingLD
LD-readingLD-readingLD-reading
LD
Math ReadingAssessment Assessment
3
3
2222
N/A
N/A3322332
4
2
1222
N/A
N/A322
N/A331
WritingAssessment
2
2
3222
N/A
N/A224
N/A423
.Vi'íí'. Stinient names are pseudonyms; 1. L, P, and S denote the four school districts that participated in the study; the numbers for the teachers Jusiindicates a different teacher; C = Caucasian, H ^1 iites that students are at an apprenlice level. 3i.:iles that students li.ive exceetled st;ind.irds) (̂
Hispanic, B = black, and M = multiracialndicates that students are al a basic levelifhisan Deparimetit of txlucilion. n.t!.!.
for the mathematics. reading and writing scores, 4 jndl-2 indicates that students have met standards, and 1 Indl-
four schools (see Table 2). Seven of the students receivedthe traditional mathematics curriculum and eight thestandards-based. The majority of the students were male{n = 11). Thirteen of the students were Caucasian, onewas black, and one was multi-racial. The students werebetween the ages of 13 and H at the time of data col-lection.
The average score on the state's general large-scaleassessment in mathematics the previous year was 2.14for those who received the standards-based curriculumand 2.33 for those educated with the traditional cur-riculum. For students who received a traditional cur-riculum, participants' average scores on the state'sgeneral large-scale assessment in reading and writingthe previous year were 2.50 and 3.00, respectively; andfor those who received a standards-based curriculum:3.00 and 2.57.
Across both grades, the students received the curricu-lum (i.e., condition) of their respective schools; noschool was asked to teach a different curriculum than ittypically did, and all participating schools only imple-mented one curriculum type. Assignment to the level ofcondition was done at class, although data analysis wasat the level of the student; a limitation of the study.
Teachers. Nine teachers across the four school dis-tricts had students with learning disabilities in theirsixth- or seventh-grade inclusive mathematics classes.Teachers and classes were suggested by the principal ateach school; the teachers represented all teachers ineach school who taught inclusive sixth- or seventh-grade classes. Of the five sixth-grade teachers, threetaught the traditional curriculum and two taught thestandards-based curriculum. All the standards-basedteachers reported having received at leasl one profes-
Lciiniit\i; Disability Quarterly 232
sional development experience related to the curricu-lum, while none of the teachers who taught the tradi-tional curriculum reported having received anyprofessional development.
Two of the sixth-grade teachers were male, and threewere female. All taught in a middle-school setting,although two were elementary-school certified; threewere mathematics-education certified. While all sixth-grade teachers had been teaching for at least 5 years(range from 5 to 25 years; average 12.2 years of teach-ing), three had taught sixth-grade mathematics for over10 years. Two teachers were teaching sixth-grade math-ematics for the first time (one previously taught ele-mentary and one, seventh-grade mathematics).
Of the four seventh-grade teachers, two taught thestandards-based curriculum and two the traditionalcurriculum. Similar to the sixth-grade teachers, thetwo teachers who taught the standards-based curricu-lum reported having received professional develop-ment one or more times, but the same was not trueof the two who taught the traditional curriculum.Three of the seventh-grade teachers were female; onewas male. All four teachers were certified to teachmathematics at the middle-grades level and had beenteaching in seventh grade for at least six years (averageof 10 years of total teaching). All teachers had beenusing their respective curricula for a minimum of sixyears. ,
ProcedureStudents in participating classes completed 16 assess-
ments over the school year. The assessments were oneof two types: multiple-choice assessment and oneopen-ended problem-solving assessment; eight werecompleted of each. The first assessment was given inthe middle of September (i.e., the month schoolstarted), and the last was completed at the end of May(i.e., school ended the beginning of June). The assess-ment type alternated (first multiple-choice, then open-ended). The instructions for all assessments asked thatteachers give students 10 minutes to complete eachassessment and have students identify the questions forwhich they u.sed a calculator. Students were allowed touse a calculator on all assessments and were remindedbefore each assessment. Further, the same directionswere written at the top of each assessment (i.e., stu-dents could use a calculator, and they were to indicateon which problems they used one). Students also hadaccess to the accommodations listed on their lEP forthese assessments.
MaterialsThe schools that implemented a traditional curricu-
lum used the equivalent texts, although different ver-sions: /Yc/íí/íV iiíiíl Middle Grades Math: Tools for Success
or Prentice Hall Mathematics (Chapin, illingworth,Landua, Masingila, & McCracken, 2000; Charles et al.,2008). These curricula are considered research basedand include textbooks to address sixth-, seventh-, andeighth-grade mathematics courses. The standards-based curriculum used in the other three districts wasConnected Mathematics, formerly referred to as theConnected Mathemiitks Project (CMP) (Lappan, Fey,Fitzgerald, Friel, & Phillips, 2004). One district used thesecond edition of Connected Mathematics - ConnectedMathematics 2 (CMP2), while the other used the earlieredition (CMP). Connected Mathematics is a NationalScience Foundation (NSF)-funded middle-school math-ematics curriculum, based on research and the NCTMstandards (1989, 2000). It was field-tested prior to therelease of both editions: CMP and CMP2 (MichiganState University, 2006). CMP offers textbooks for sixth,seventh, and eighth grade.
Materials also included the calculators students hadavailable to answer questions on all assessments. Nostandard calculator was used across all participatingstudents, or even participating students via curriculum.Calculator model was more a function of grade, withsixth-grade classrooms reporting students used a scien-tific or basic four-function calculator and seventh-grade classrooms reporting students used a scientific orgraphing calculator. Teachers reported varying avail-ability of calculators: Some teachers provided class-room sets, some teachers shared calculators across andwithin grade levels, and some chose not to provide anycalculators but required students to bring their own. Nobaseline data were collected on students' calculatorskills. It was presumed that students knew how to oper-ate a basic calculator.
InstrumentsThe primary means of data collection were the
researcher-created multiple-choice and open-endedassessments. Although the assessments for each gradewere different (i.e., each reflected sixth- or seventh-grade standards), they were constructed in the samemanner. For both grades, the assessments focused ontwo of the NCTM (2000) content-area standards:(a) number and operations and (b) algebra. These twomathematics strands were selected because of theirheavy emphasis at both sixth and seventh grade in thestandards of the state where the study was conducted.The questions for all assessments were adapted fromreleased items from the state's previous general large-scale assessments that covered sixth- or seventh-gradecontent. Thus, all problems were aligned to state stan-dards, and the project assessments were in essencepractice for students for the general large-scale stateassessment.
Voluim- J2. 2SJ
For both grades, the multiple-choice assessmentsconsisted of 10 questions, and the open-ended eachinvolved three questions, although they ranged inrequired number of response from 3 to 9 for sixth gradeand from 3 to 7 for seventh grade. For the sixth grade,the multiple-choice assessments were evenly dividedacross the two content-area strands, meaning fivenumber and operations and five algebra problems perassessment; the open-ended problem-solving assess-ments consisted of one number and operations prob-lem, one algebra problem, and a third problemrandomly selected from a pool of all open-ended prob-lem-solving questions. For the seventh grade, theassessments slightly favored algebra. Six problems oneach multiple-choice assessment represented algebraand four, the number and operations stand. The open-ended assessments were constructed similarly - onenumber and operations problem, one algebra problem;a third problem randomly selected from a pool ofall open-ended problem-solving questions weightedtowards algebra.
Reliability of the assessments for each grade wasdetermined through the split-half reliability technique.Data from both grades were placed into databases withthe scores from each assessment in separate columns.The sixth- and seventh-grade datasets were each ran-domly split into two halves (i.e., students were ran-domly divided). A repeated-measures ANOVA was runfor each dataset with time and exam as within-subjectfactors and condition as a between-subjects factor. Thepredictions for each assessment were found for bothconditions in the two databases. A correlation was thencomputed between the predictions for each gradebetween the two models. The correlation for the sixth-grade dataset was 0.80, and the correlation for theseventh-grade dataset was 0.84, both indicating anacceptable reliability.
Fidelity of ImplementationFidelity of implementation of the standards-based
and traditional curricula was assessed through teacherinterviews, observations of mathematics classes, andreviews of teaching materials. All teachers participatingin the study were interviewed individually by the firstauthor. These semi-structured interviews consisted of15 questions focusing on the curriculum materialsteachers used, teachers' perception of the effectivenessof their curricular materials for students with disabili-ties, their perspective of calculators, the type of stu-dents with disabilities they educated in inclusiveclasses, and the mathematical challenges they saw stu-dents with disabilities face in mathematics classes.
The first author also observed the inclusive mathe-matics classes participating in the study. Observations
focused on issues of curriculum and pedagogy (i.e.,teaching aligned with the type of curriculum teachersreported using). Finally, the first author completedreviews of teaching materials, such as exploring thetextbooks. A checklist was not used to assess eachteacher's implementation of fidelity. All teachers wereassessed to be moderate to high implementers of theirrespective curriculum.
Data AnalysisThe data for students with learning disabilities were
entered into SPSS databases by grade. One database foreach grade focused on the correctness of each questionstudents answered (i.e., 0 for incorrect, 1 for correct, 99for missing data). For this database, the score for eachassessment was computed by summing the number ofproblems answered correctly. The total number of prob-lems correct per assessment was then divided by thenumber of problems per assessment. The percent wascalculated as each multiple-choice assessment for bothgrades consisted of 10 questions, but for the open-ended problem-solving assessments varying numbers ofpoints were possible. Hence, the dependent variable forthe analysis of performance was students' percent ofquestions answered correctly per assessment.
The other database involved students' self-reporteduse of calculators to assist them in solving the prob-lems. This database recorded if students self-reportedusing a calculator to solve each problem on each assess-ment. The numbers of questions on each assessmentfor which students self-reported using a calculator weresummed. Similar to student performance, tbe sum wasthen divided by the number of problems per assess-ment (e.g., 10, 3). The second dependent variable wasstudents' percent of self-reported calculator use perassessment.
The data analyses completed for each database anddependent variable were linear mixed models. The lin-ear mixed model was selected for the analysis toaddress the quasi-experimental design of the study andthe nesting effect (i.e., the assignment of curriculumwas done at the class level, but analysis was conductedat the student level). The linear mixed model for eachgrade for the two dependent variables (percent of ques-tions correct and percent of self-reported calculatoruse) included both fixed and random factors.
The fixed factors included time of the assessment(e.g., first, second, third), exam type (multiple-choicevs. open-ended), and curriculum (standards-based vs.traditional). The full factorial for these three fixed fac-tors was also included - one three-way interaction andthree two-way interactions. The random factors were id(representing individual students) and class (encom-passing the dimensions of school and teacher). These
Learning Disability Quarterly 234
factors were nested: id was nested within class to reflectthe variation among student within each class, class wasnested within curriculum to represent the variationamong classes, and exam by id (exam*id) was nestedwithin class to provide for the variation of studentsbetween the two types of exams.
To analyze self-reported calculator use further, a chi-square analysis was conducted to determine if there wasa relationship between using a calculator and answeringproblems correctly. A contingency table was created foreach grade showing the number correct and incorrectwhen students self-reported using a calculator andwhen not. Next, a chi-square test was conducted foreach grade to determine if the two variables (calculatoruse and correctness) were independent. Cramer's V - acorrelation coefficient - and an odds ratio were also cal-culated for each grade. Separate chi-square analyseswere completed for each grade for the two curricula.
RESULTS
Sixth GradePerformance. The linear mixed model for perform-
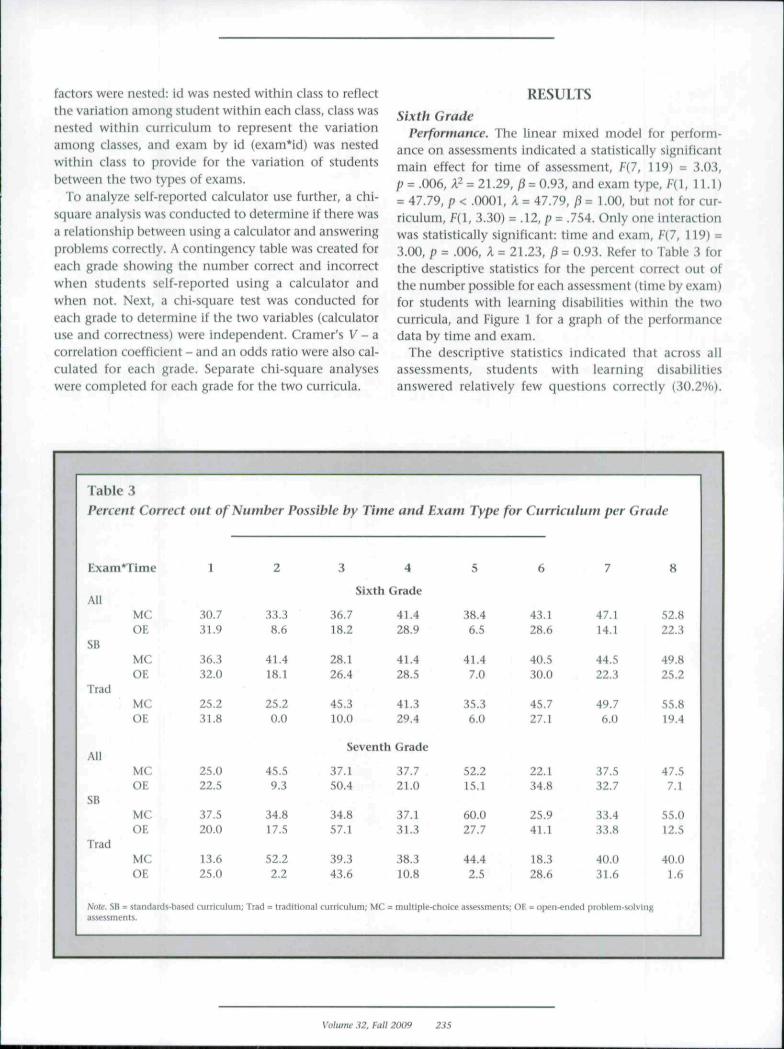
ance on assessments indicated a statistically significantmain effect for time of assessment, f{7, 119) = 3.03,/; = .006, A' = 21.29, ß = 0.93, and exam type, F(l, lM)= 47.79, p < .0001, X = 47.79, ß = 1.00, but not for cur-riculum, f(l, 3.30) = .12, p = .754. Only one interactionwas statistically significant; time and exam, F(7, 119) =3.00, p = .006, A = 21.23, ß = 0.93. Refer to Table 3 forthe descriptive statistics for the percent correct out ofthe number possible for each assessment (time by exam)for students with learning disabilities within the twocurricula, and Figure 1 for a graph of the performancedata by time and exam.
The descriptive statistics indicated that across allassessments, students with learning disabilitiesanswered relatively few questions correctly {30.2%).
Table 3
Percent Correct
Exam'Time
All
SB
Irad
Ail
SB
Trad
Ntiie. SB -
MC
OE
MCOE
MCOE
MCOE
MCOE
MCOE
out of Number
1
30.731.9
36.332.0
25.231.8
25.022.5
37.5
20.0
13.625.0
standards-based curriculum.assessments.
2
33.3
8.6
41.4
18.1
25.20.0
45.59.3
34.817.5
52.22.2
Possible by Time
3
and
4
Sixth Grade
36.7
18.2
28.126.4
45.310.0
Seventh
37.150.4
34.8
57.1
39.343.6
Trad = traditional curriculum; MC =
41.4
28.9
41.428.5
41.329.4
Grade
37.721.0
37.1
31.3
38.3
10.8
Exam Type for
tfl
.38.4
6.5
41.4
7.0
35.36.0
52.215.1
60.0
27.7
44.42.5
multiple-choke assessments; Ot
Curriculum per
6
43.1
28.6
40.5
30.0
45.727.1
22.134.B
25.9
41.1
18.328.6
7
47.1
14.1
44.5
22.3
49.76.0
37.532.7
33.433.S
40.0
31.6
Grade
8
52.8
22.3
49.8
25.2
55.819.4
47.57.1
55.012.5
40.01.6
= open-ended pro ble m-solving
Vahmic A2, Fall 2(H>9
While students correctly answered a similar percent ofquestions across the two curricula (28.3% for traditionaland 32. I'M) for standards-based), there was a sharp dif-ference for the type of assessment: multiple-choice(40.4%) and open-ended problem solving (19.9'K)). Theresult for the differences in correct answers by examtype was, as the researchers hypothesized, based on pre-vious research indicating that students with learningdisabilities struggle with word problems, such as thoseon the open-ended assessments (Maccini & Ruhl, 2000;Rivera, 1997).
The statistically significant difference of time was notas hypothesized, however. The researchers had hypoth-esized that students would improve over time, as theassessments were constructed to measure what studentsshould learn over the course of the school year. Hence,students shouid improve as they learned more of thegrade-level content. However, this was not the case. Thedescriptive statistics for the interaction of time andexam indicated, in general, that the performance of thesixth-grade students with learning disabilities increasedin a linear-like fashion on the multiple-choice assess-ments, but not on the open-ended assessments (seeTable 3 and Figure 1). Performance on the open-endedproblem-solving assessments was varied.
Calculators. The linear mixed model for calculatoruse indicated only one statistically significant maineffect - time of assessment, F{7, 120) = 2.76,/J = .011, A= 19.31, ß = 0.90. No interactions were statistically sig-nificant. The statistical significance of time has similarimplications as for the percent correct - inconsistenciesacross the assessments. The lack of statistical signifi-cance of curriculum indicates that calculators were notused at a differentiated rate between the two curricula.
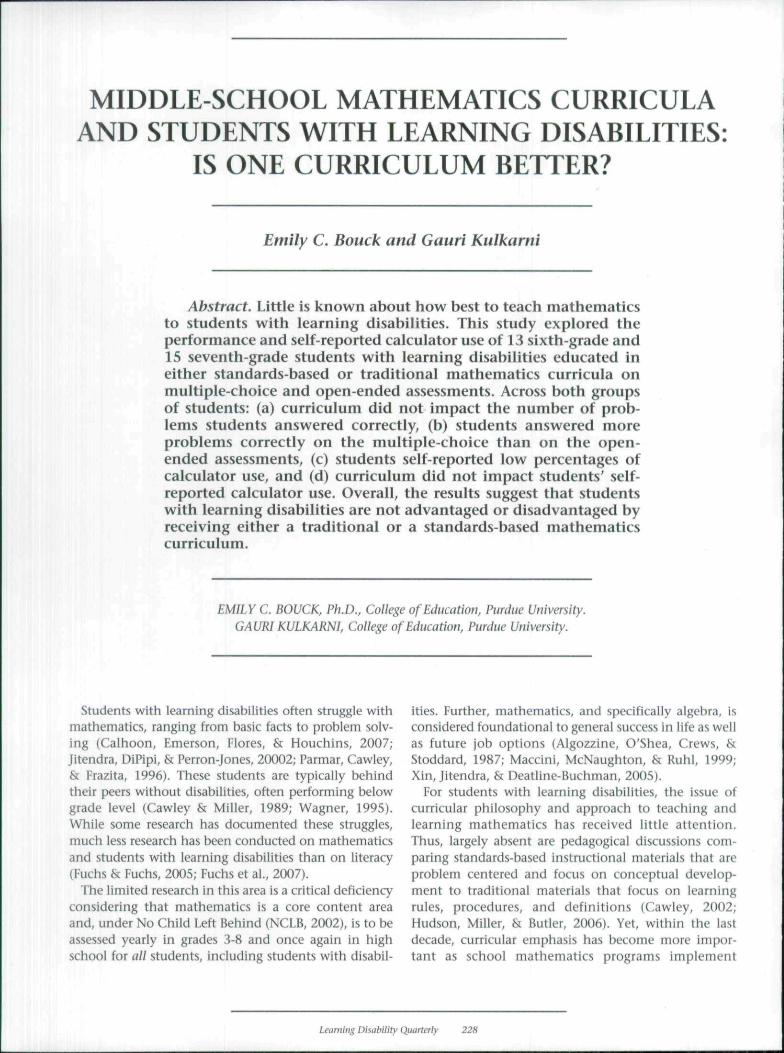
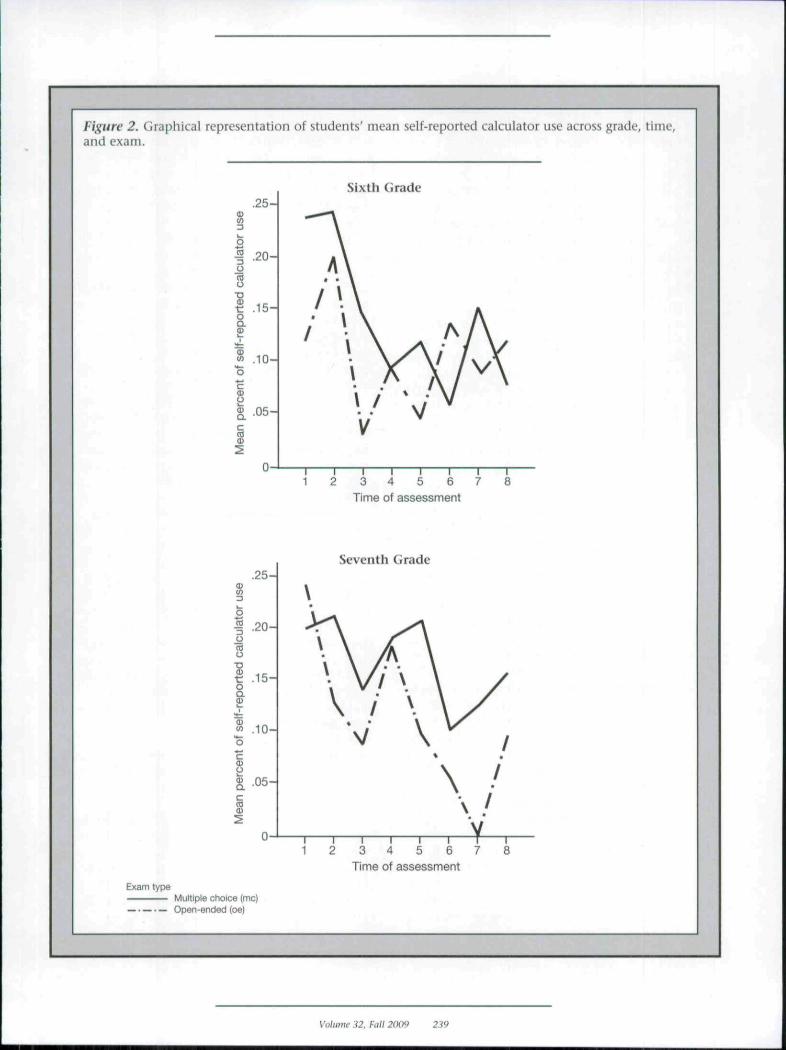
Overall, self-reported calculator use was low (11.6%)across all assessments and curricula. The descriptive sta-tistics suggested a difference between curricula in termsof percent of self-reported calculator use (15.1% forstandards-based vs. 8.1% for traditional), but this differ-ence was not statistically significant. (The lack of statis-tical significant may be due to the small sample size andis noted as a limitation of the study.) Students self-reported using a calculator more often on the multiple-choice than on the open-ended exams (13.5% vs. 9.8%,respectively), but this difference was not statistically sig-nificant. Students self-reported using a calculator moreat the beginning, tapered off in the middle, and roseslightly towards the end of the eight different assess-ment times. Table 4 presents the descriptive statistics forthe percent of students who self-reported using a calcu-lator for each assessment (time by exam type) for thetwo curricula; Figure 2 depicts the graphical representa-tion of the percent of self-reported calculator use for stu-dents across time and exam type.
Results of the overall chi-square test for sixth gradeindicated that, regardless of curriculum, students whoself-reported using a calculator were not more likely toanswer the questions correctly. Specifically, sixth-gradestudents with learning disabilities correctly answeredproblems 40.5% of the time when they used a calcula-tor compared to 34.2% when they did not self-reportusing a calculator (X^(l)= 2.48, p = 0.12). These resultswere not consistent across curricula. Students who self-reported calculator use and received a traditional cur-riculum were not more likely to answer a questioncorrectly (29.8"/! vs. 24.7%), but students who receiveda standards-based curriculum were (44.6'Ki vs. 33.8%,JV̂ (1)= 5.00, p = .03, Cramer's V = 0.09, odd's ratio =1.6).
Seventh GradePerformance. The results of the linear mixed model
for seventh grade were similar to those for the sixthgrade. Time of assessment, F{7, 167) = 3.87, /; = .001,A = 27.09, ß = 0.98, and exam type, f(l, 167) = 31.98,/;< .000, A = 31.98, ß= 1.00, were statistically significantmain effects, but curriculum was not, F(l, 3.26) = 0.83,p = .43. However, two interactions were statisticallysignificant: time*exam, F(7, 167) = 10.73, p < .000,A = 75.11, /3= 1.0, and time*exam*curriculum, f(7, 167)= 2.16, p = .04, A = 15.12, /? = 0.81. Refer to Table 3 forthe descriptive statistics for the percent correct out ofthe number possible for each assessment (time by exam)for the two curricula and Figure 1 for the graphicalrepresentation of student performance across timeand exam type. These results revealed that, overall, cur-riculum was not influential; yet, it impacted the per-formance of students when considering particularassessments.
Across all assessments and the two curricula, studentswith learning disabilities answered the questions cor-rectly only 31.1% of the time. While curriculum wasnot statistically significant, across all assessments, stu-dents with learning disabilities in the traditional cur-riculum answered questions correctly 27.0% of the timecompared to 35.2'K) of the time for students educatedwith a Stan dards-based curriculum. (Again, the lack ofstatistical significance may in part be due to tbe smallsample size.) A difference was found for correctly solv-ing problems between the multiple-choice and open-ended assessments (38.1% vs. 24.1%, respectively).Similar to the explanation for the sixth-grade data, theresults for exam type were as hypothesized, but theeffect of time was not. Performance on assessmentsacross time was not as linear for the seventh-gradestudents as the researchers had presumed, or as linear asthe sixth-grade data, regardless of assessment type (seeFigure 1),
Li'<iniiii<i Disiibility Quarterly 236

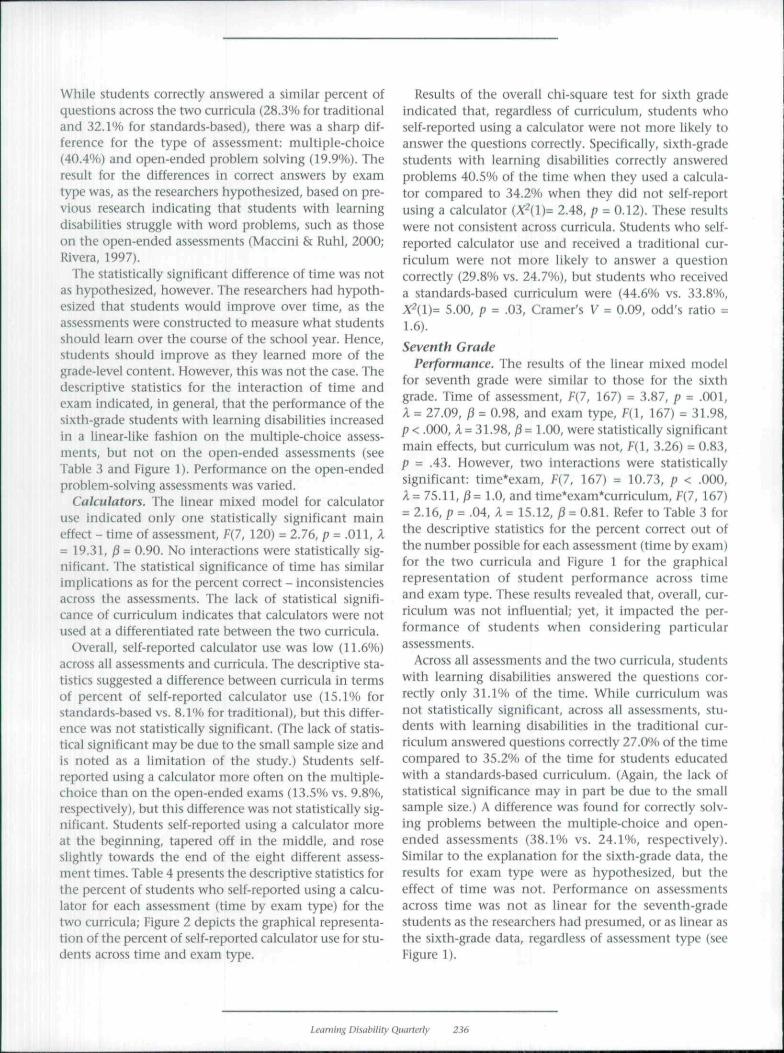
Figure 1. Graphical representation of students' mean percent correct across grade, time, and exam.
Sixth Grade
.60-
.50-
.40-
.30-
§ .20-
.10-
I I 1 } 1 I I I1 2 3 4 5 6 7 8
Time of assessment
.60-
.50-
.40-J
.20-
.10-
Seventh Grade
1 2I I3 4
Time of assessment
Exam typeMultiple choice {me)
_ . _ — Open-ended (oe)
Volume 32, Fall 2009 23?
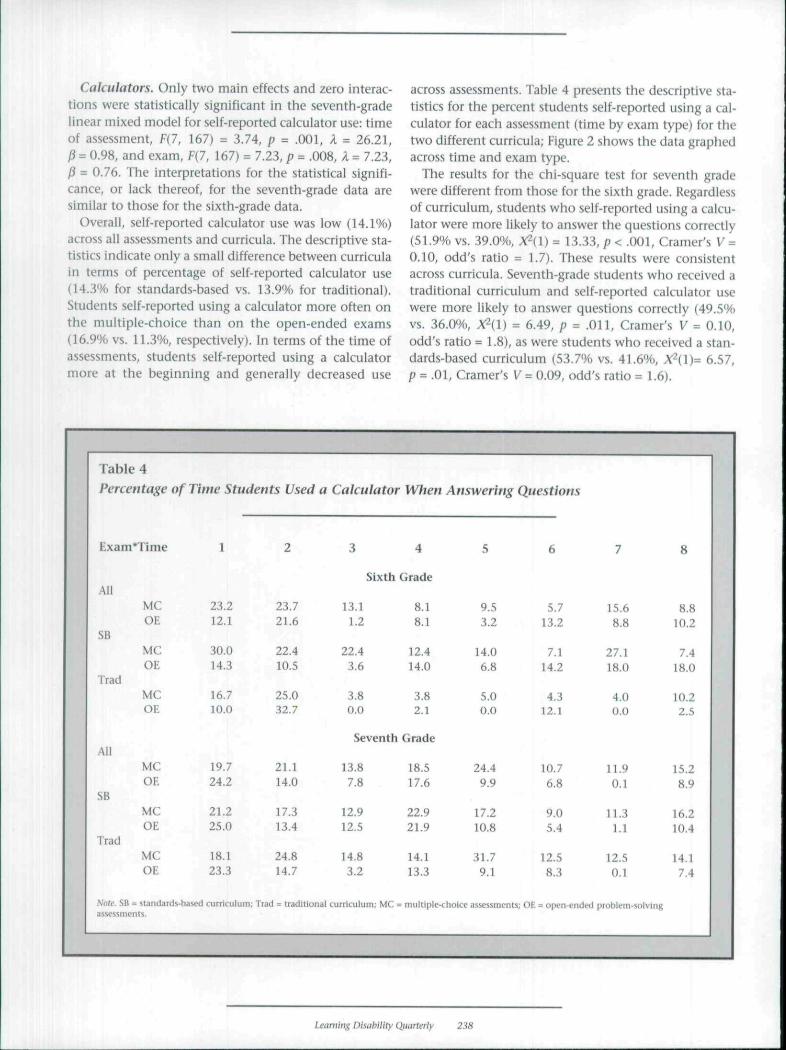
Calculators. Only two main effects and zero interac-tions were statistically significant in the seventh-gradelinear mixed model for self-reported calculator use: timeof assessment, f(7, 167) = 3.74, p = .001, A = 26.21,ß = 0.98, and exam, f (7, 167) = 7.23, p = .008, A = 7.23,ß = 0.76. The interpretations for the statistical signifi-cance, or lack thereof, for the seventh-grade data aresimilar to those for the sixth-grade data.
Overall, self-reported calculator use was low (14.1%)across all assessments and curricula. The descriptive sta-tistics indicate only a small difference between curriculain terms of percentage of self-reported calculator use(14.3% for standards-based vs. 13.9% for traditional).Students self-reported using a calculator more often onthe multiple-choice than on the open-ended exams(16.9% vs. 11.3%, respectively). In terms of the time ofassessments, students self-reported using a calculatormore at the beginning and generally decreased use
across assessments. Table 4 presents the descriptive sta-tistics for the percent students self-reported using a cal-culator for each assessment (time by exam type) for thetwo different curricula; Figure 2 shows the data graphedacross time and exam type.
The results for the chi-square test for seventh gradewere different from those for the sixth grade. Regardlessof curriculum, students who self-reported using a calcu-lator were more likely to answer the questions correctly(51.9%vs. 39.0%, ;C2(1)= 13.33,/i<.001, Cramer's V =0.10, odd's ratio = 1.7). These results were consistentacross curricula. Seventh-grade students who received atraditional curriculum and self-reported calculator usewere more likely to answer questions correctly (49.5%vs. 36.0%, ;^(1) = 6.49, p = .011, Cramer's V - 0.10,odd's ratio = 1.8), as were students who received a stan-dards-based curriculum (53.7% vs. 41.6%, X^{1)= 6.57,p = .01, Cramer's V = 0.09, odd's ratio = 1.6).
Table 4Percentage
lixam*Time
All
SB
Trad
Ml
SB
Trad
S'nte, SB
MCOE
MCO£
MCOE
MCOE
MCOE
MCOE
of Time Students Used
1
23.212.1
30.014.3
16.710.0
1
19.724.2
21.225.0
18.123.3
= standards-based curriculum;iissessments.
2
23.721.6
22.410.5
25.032.7
21.114.0
17.313.4
24.814.7
a Calculator
3
Sixth
13.11.2
22.43.6
3.80.0
Seventh
13.87.8
12.912.5
14.83.2
Trad = traditional curriculum; MC =
When
4
Grade
8.18.Í
12.414.0
3.82.1
Grade
18.517.6
22.921.9
14.113.3
Answering
5
9.53.2
14.06.8
5.00.0
24.49.9
17.210.8
31.79.1
Questions
6
5.713.2
7.114.2
4.312.1
10.76.8
9.05.4
12.58.3
7
15.68.8
27.118.0
4.00.0
11.90.1
11.31.1
12.50.1
multifrfe-choice assessments; OE = open-ended problem-solving
8
8.810.2
7.418.0
10.22.S
15.28.9
16.210.4
14.17.4
Disiibitily Quarterly 2.ÍS
Eigure 2. Ciraphical representation of students' mean self-reported calculator use across grade, time,and exam.
.25-
1 .20-
1 . 1 5â9>
.10-
g. 05c(0
*
/
Sixth
\
. \
\
\ /
V
Grade
AA/\
• » . ' \ /
V
n I r1 2 3 4 5 6 7 8
Time of assessment
use
o
orou
rted
f-re
po
en
"oc
perc
€
cCO03
.25-
.20-
.15-
.10-
.05-
0 -
\1
J
11
Seventh Grade
\ \
\
v
12
\ /V i•
/• •
V
13
Time
{ \
14
\
15
\V\\
16
of assessment
/
/
1.
/
Yr 17 8
Exam typeMuttiple choice (me)Open-ended (oe)
Volinm- A2. Vaii 200»
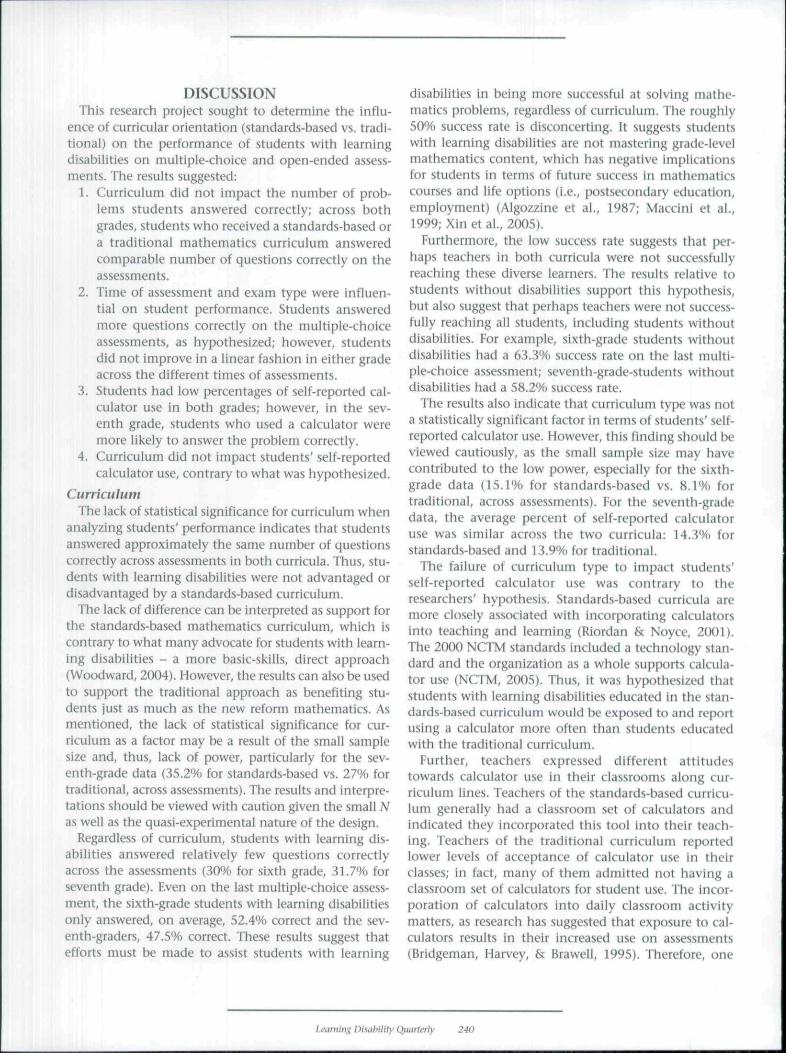
DISCUSSIONThis research project sought to determine the influ-
ence of curricular orientation (standards-based vs. tradi-tional) on the performance of students with learningdisabilities on multiple-choice and open-ended assess-ments. The results suggested:
1. Curriculum did not impact the number of prob-lems students answered correctly; across bothgrades, students who received a standards-based ora traditional mathematics curriculum answeredcomparable number of questions correctly on theassessments.
2. Time of assessment and exam type were influen-tial on student performance. Students answeredmore questions correctly on the multiple-choiceassessments, as hypothesized; however, studentsdid not improve in a linear fashion in either gradeacross the different times of assessments.
3. Students had low percentages of self-reported cal-culator use in both grades; however, in the sev-enth grade, students who used a calculator weremore likely to answer the problem correctly.
4. Curriculum did not impact students' self-reportedcalculator use, contrary to what was hypothesized.
CurriculumThe lack of statistical significance for curriculum when
analyzing students' performance indicates that studentsanswered approximately the same number of questionscorrectly across assessments in both curricula. Thus, stu-dents with learning disabilities were not advantaged ordisadvantaged by a standards-based curriculum.
The lack of difference can be interpreted as support forthe standards-based mathematics curriculum, which iscontrary to what many advocate for students with learn-ing disabilities - a more basic-skills, direct approach(Woodward, 2004). However, the results can also be usedto support the traditional approach as benefiting stu-dents ¡ust as much as the new reform mathematics. Asmentioned, the lack of statistical significance for cur-ricuium as a factor may be a result of the small samplesize and, thus, lack of power, particularly for the sev-enth-grade data (35.2% for standards-based vs. 27% fortraditional, across assessments). The results and interpre-tations should be viewed with caution given the small Nas well as the quasi-experimental nature of the design.
Regardless of curriculum, students with learning dis-abilities answered relatively few questions correctlyacross the assessments (30% for sixth grade, 31.7% forseventh grade). Even on the last multiple-choice assess-ment, the sixth-grade students with learning disabilitiesonly answered, on average, 52.4% correct and the sev-enth-graders, 47.5% correct. These results suggest thatefforts must be made to assist students with learning
disabilities in being more successful at solving mathe-matics problems, regardless of curriculum. The roughly50% success rate is disconcerting. It suggests studentswith learning disabilities are not mastering grade-levelmathematics content, which has negative implicationsfor students in terms of future success in mathematicscourses and life options (i.e., postsecondary education,employment) (Algozzine et al., 1987; Maccini et al.,1999; Xin et al., 2005).
Furthermore, the low success rate suggests that per-haps teachers in both curricula were not successfullyreaching these diverse learners. The results relative tostudents without disabilities support this hypothesis,but also suggest that perhaps teachers were not success-fully reaching all students, including students withoutdisabilities. For example, sixth-grade students withoutdisabilities had a 63.3% success rate on the last multi-ple-choice assessment; seventh-grade-students withoutdisabilities had a 58.2% success rate.
The results also indicate that curriculum type was nota statistically significant factor in terms of students' self-reported calculator use. However, this finding should beviewed cautiously, as the small sample size may havecontributed to the low power, especially for the sixth-grade data (15.1% for standards-based vs. 8.1% fortraditional, across assessments). For the seventh-gradedata, the average percent of self-reported calculatoruse was similar across the two curricula: 14.3% forstandards-based and 13.9% for traditional.
The failure of curricuium type to impact students'self-reported calculator use was contrary to theresearchers' hypothesis. Standards-based curricula aremore closely associated with incorporating calculatorsinto teaching and learning (Riordan & Noyce, 2001).The 2000 NCTM standards included a technology stan-dard and the organization as a whole supports calcula-tor use (NCTM, 2005). Thus, it was hypothesized thatstudents with learning disabilities educated in the stan-dards-based curriculum would be exposed to and reportusing a calculator more often than students educatedwith the traditional curriculum.
Further, teachers expressed different attitudestowards calculator use in their classrooms along cur-riculum lines. Teachers of the standards-based curricu-lum generally had a classroom set of calculators andindicated they incorporated this tool into their teach-ing. Teachers of the traditional curriculum reportedlower levels of acceptance of calculator use in theirclasses; in fact, many of them admitted not having aclassroom set of calculators for student use. The incor-poration of calculators into daily classroom activitymatters, as research has suggested that exposure to cal-culators results in their increased use on assessments(Bridgeman, Harvey, & Brawell, 1995). Therefore, one
Lt'drnin_'i Disability Quarterly 240
would presutne that students with learning disabilitieseducated in the standards-based curriculum would self-report using a calculator more as they interacted withthis tool on a regular basis. However, caution is war-ranted with regard to the self-reported calculator usedata as no baseline was established for students' skillswith a calculator, which may have affected their useand/or reported use.
Regardless of curricxilum, students with learning dis-abilities self-reported using a calculator a low percentageof the titne (11.1'Mi overall for sixth-grade students and13.5% for seventh-grade students). Although calculatoruse was reported higher on the multiple-choice assess-ments than on the open-ended (13.4% vs. 8.7% forsixth-grade students and 16.1% vs. 11.0% for seventh-grader students, respectively), the frequency was stilllow. Thus, even on the multiple-choice problems, stu-dents with learning disabilities were using a calculatorto help them solve the questions less than a quarter oíthe time.
The low frequency is contrary to the recommendeduse of this tool as an accommodation in daily classactivities and on assessments (Maccini & Gagnon, 2000;Ysseldyke et al., 1999). One hypothesis for the low usagemay be a lack of instruction on how to use calculators.Perhaps students with disabilities do not intuitivelyunderstand how to use calculators; thus, teachers needto explicitly teach them how and when to use this toolto support their learning (Salend & Hofstetter, 1996).Another hypothesis is related to a previous point regard-ing teachers providing these tools for their studentsrather than assuming students can supply their own.
The analysis suggests the low frequency of self-reported calculator use might have been detrimental tothe performance of students with learning disabilitieson the assessments, at least for those in seventh grade.The chi-square analysis on the seventh-grade data indi-cated students who self-reported using a calculator weremore likely to answer the question correctly (1.7 times).While the chi-square test was not statistically significantfor sixth grade, suggesting there was not a relationshipbetween answering questions correctly and using a cal-cuiator, a slight difference did exist (40.5% vs. 34.2%,favoring self-reported calculator use), implying that useof a calculator may have been beneficial.
Other FactorsStudents performed differently and self-reported using
a calculator with different frequencies depending on theexam type - multiple-choice or open-ended. Theserestilts were not surprising. As previously suggested, stu-dents with leaming disabilities stmggle with problemsolving and the additional cognitive demand that comeswith solving word problems. Thus, solving more prob-
lems correctly on the multiple-choice than on the open-ended problems was aligned with the literature(Algozzine et al., 1987; Parmar et al., 1996). In addition,the multiple-choice assessments presented four possibleanswers for each problem, providing students with a25% chance of being correct if they ¡ust guessed.Guessing a multiple-choice answer could partly explainwhy they were more successful on those assessments.
The greater use of a calculator on the multiple-choicethan on the open-ended questions may also beexplained by the struggles with problem-solving/worclproblems students with learning disabilities face. As sug-gested by Woodward (1999), calculators can only helpwhen students have an understanding of the problem.The multiple-choice problems better lend themselves tounderstanding what the problem is asking for, as extra-neous information is usually minimized, the problemsare more explicit, and one of the options is the correctsolution. By contrast, on the open-ended problems, stu-dents had to tease out the essential information neededto solve the problem, and at times had to perform mul-tiple steps to arrive at a correct answer (Cawley, Parmar,Foley, Salmon, & Roy, 2001).
In summary, to use a calculator on the open-endedproblems, students had to determine what the problemwas asking, decide how to solve it, and then input theinformation into the calculator to do the computationpart of the work. With most of the multiple-choicequestions, on the other hand, students could simplyinput the numbers into a calculator.
Time was a consistent statistically significant factorimpacting student performance in both grades as wellas self-reported calculator use. However, the influenceof time on student performance was not as theresearchers had hypothesized - students improving in alinear fashion. While the data on student performancefor the sixth-grade, multiple-choice assessmentsapproximated a linear relationship, a linear relation-ship was not found for seventh-grade, multiple-choiceassessments or for the open-ended assessments at eithergrade. The impact of time was more varied than stu-dents improving over time, and thus, could call intoquestion the equivalency of the assessments. In termsof the influence of time on students' self-reported cal-culator use, students generally reported greater use onthe first few assessments, suggesting that perhaps use ofthe calculator was exciting or new. Use then taperedoffer until the last few assessments (i.e., sixth-gradedata) or peaked in the middle and then again at the end(i.e., seventh-grade data). While the researchershypothesized novelty of using caicuiators on theseassessments may have resulted in their increased use atthe beginning, data related to the reasons for the varieduse were not gathered.
Voliiiiie .Î2, Full 200<} 241
ConclusionIn conclusion, students with learning disabilities
answered relatively few questions correctly on theassessments across either curriculum. However, theydid better on the multiple-choice than on the open-ended problem-solving assessments. In general, theperformance of students with learning disabilities onmathematics assessments aligned to state standardsneeds to improve, but the type of curriculum theyreceived in inclusive mathematics classes did not proveto be influential in this study.
The results suggest that while the math wars are hap-pening, perhaps students with learning disabilities arenot casualties in these particular battles. That is, stu-dents with learning disabilities were not harmed frombeing taught in a standards-based mathematics curricu-lum; however, they were also not receiving an advan-tage over a traditional curriculum approach. Theseresults are consistent with the results of Baxter and col-leagues (2001) and Woodward and Baxter (1997), whoexamined a standards-based curriculum for elementarystudents with disabilities. However, concern exists, asthe results suggest that perhaps these students are casu-alties of the need to better understand how to focuscurriculum and instruction for diverse learners.
A starting point may be helping teachers incorporateand/or improve instruction in the use of calculators tosupport diverse learners in mathematics. The data showstudents with learning disabilities were not using a cal-culator on a regular basis to help them solve problems,despite calculators being identified as a tool for stu-dents with disabilities (Ysseldyke et al., 1999).Calculators can assist students with disabilities in solv-ing problems that they might otherwise not.
Implications for PracticeThe results of this research hold implications for
the practice of educating students with learning disabil-ities. The findings suggest neither mathematicscurricula - standards-based (i.e., problem centered, con-cept-driven) or traditional (i.e., procedural/rule focused)- benefited or disadvantaged students with learning dis-abilities. The suggestion that neither was more success-ful at preparing students with learning disabilities tomeet state standards through assessments is somewhataligned with the National Mathematics Advisory PanelReport (2(X)8), which concluded that a conclusive one-or-the-other approach to instruction- student-centeredor teacher-directed mathematics - is not supported byresearch. One implication is that research and teachingpractices may need to focus on more hyhrid curriculumand instructional approaches to educating students withlearning disabilities in mathematics.
The resuits further indicated that students with learn-
ing disabilities may not be taking enough advantage ofavailable resources, such as calculators, to help them besuccessful in solving mathematics problems. While thisproject did not explore the reason behind it, perliapsstudents with learning disabilities need more explicitinstruction in how to use a calculator effectively,Teachers- in both general education and special educa-tion - need to provide students with learning disabilitiesdirect instruction on how to use calculators, especiallyas the mathematics content and the calculators becomemore complex.
LimitationsOne limitation of this research project is the low
number of students with learning disabilities included.The small sample size most likely had a negative influ-ence on the power calculations, which in turn may haveimpacted the lack of statistical significance of some fac-tors in the analyses. While the small size is problematic,the data were collected in inclusive classes, and mayreflect the limited inclusion that is actually takingplaces for students with learning disabilities in mathe-matics classrooms at the middle grades. A related limi-tation involves the researchers not computing a poweranalysis apriori to determine the sample size needed togain adequate power.
The exclusion of one school site represents anotherlimitation of the study. Five school districts were part ofthe larger study; however, one was not included in thisanalysis as the sixth grade in the school did not haveany students with learning disabilities in inclusive class-rooms; the seventh grade was excluded because ofteacher error in giving one assessment and hence miss-ing data for those students.
Another limitation involved the self-report of calcu-lator use by the students with learning disabilities. Asa result of the nature of self-reported data, it is unclearif students under- or over-reported how frequentlythey used a calculator. And, of course, with all self-reported data, the results and interpretation must beviewed with caution. Further, students' skill with a cal-culator was never established. A lack of skill in usinga calculator may have negatively impacted students'use of a calculator or their success on solving problemswhen using one. A final limitation involved the valid-ity of the assessments, as they were researcher created.However, the questions were all adapted from releaseditems on the state's general large-scale assessment,of which validity and reliability data had been col-lectedFuture Directions
Additional research is needed regarding studentswith learning disabilities and mathematics curricula.The existing, albeit limited, research has focused more
i'aminx Disiibility Quarterly 242
on elementary than on secondary students, and theone secondary mathematics curricula study examinedtwo standards-based curricula rather than comparinga standards-based to a traditional curriculum (Baxter etal., 2001; Woodward ís Baxter, 1997; Woodward &Brown, 2006). Further, research on mathematics curric-ula and students with disabilities needs to focus oninclusive classes, as students with disabilities areincreasingly spending time in general education classesand receiving general education content, due to NCLB(l)eSimone k Parmar, 2006; NCLB, 2002).
Future research studies should seek to involve a largernumber of students with learning disabilities andinclude students with both language-based and mathe-matics learning disabilities. Ideally, research couldcompare student performance in the different curricu-lar orientations among different learning disabilityclassifications. The fact that none of the school districtsin this study educated any of their middle-school stu-dents with mathematics learning disabilities in aninclusive setting is a limitation of the study, as well asa question for how and why students are placed ininclusive classrooms vs pull-out classrooms. Finally,research should involve a more systematic explorationof calculator use and not just rely on students' self-report. Given how often calculators are touted as anaccommodation for students with disabilities, researchshould explore when and how students are using themon assessments and in daily class activities (Maccini &Gagnon, 2000; Ysseldyke et al., 1999).
REFERENCESAlgozzine, B., O'Sht-a. D, J.. Crews, W. B., fci Sloddard, K. (1987).
Analysis of mathematics competence of learning disabled ado-lescents, ¡aunuil of Special Education, 21. 97-107.
Baxter. J. A., Woodward, |., fi Ohon, D. (2001). Effects of reformbased mathematics instruction on low achievers in five third-grade classrooms. The i^.lemciihiry School lotintal, ¡01. 529-547.
Bridgeman, B.. Harvey, A., & Braswell. J. (1995). Effects of calcu-lator use on scores on a test of mathematical reasoning, ¡ounialof Educational Mamirvnicnt, 32, 323-340.
Bouck, E. C, & Bouck, M. K. (2008). Does it add up? Calculatoruse by middle school students with and without disabilities.luunial of Special Education Tniuiolog}', 23(2), 17-32.
liuirill, tí., Allison, J., Breaux, tí., Kastberg, S., Leatham, K., &Sanchez, W. (2002). liaiuUiedl ^raphin^ teclmology at the second-ary level: Research }uuliti\fs ami iinpHciiliori.s for classroom practice.Hallas, TX: Texas Instruments.
Calhoon, M. B., Emerson, R. W., l-lores, M., is Houchins, t̂ . E.<2()07). Computational tluency performance profile of highschool students with mathematics disabilities. Remédiai andSfKcial Education, 28, 292-303.
Carroll, W. M. (1998). Geometric knowledge of middle schoolstudents in a reform-based mathematics curriculum, SchoolScience ami Mathematics. 97, 188-197.
Cawley, j , ï\ (20{)2). Mathematics interventions and studentswith high incidence disabiiities. Remedial and Special Education,23, 2-b.
Cawley, J. F., & Miller, I. H. (1989). Cross-sectional comparisonsof the mathematical performance of children with learning dis-abilities: Are we on the right track towards comprehensive pro-gramming? fountal of Letiming Disahilities, 22. 250-259.
Cawley, J., i'armar, R., Foley, T. E., Salmon, S., ti Roy, S. (2(H)1).Arithmetic performance of students: Implications for standardsand programming. Exceptional Children, 67. 311-328.
Cawley, J. F., Parmar, R. S., Yan, W. F.., 8i Miller, J. H. (199K).Arithmetic computation performance of students with learningdisabilities: Implications for curriculum. Learning DisabiUtiesResearch fi Practice. 13. 68-74.
Chapin, S. H., Illingworth, M., landau, M, S., Masingila, J. O., 6tMcCracken, L. (2000). Prentice Hall Miääle Graiks Math: Tools forSticces.s. Boston: Prentice Hall.
Charles, R. I., Illingworth, M., McNemar, B., Mills, O., Ramirez, A.,& Reeves, A. (2008). Prentice Hall Mathematics. Boston: PrenticeHall.
Cobb, P., Wood, T., Yackel, E., NichoUs, J., Wheatley, G., Trigatti,B., & Perlwitz, M. (1991). Assessment of a problem-centeredsecond-grade mathematics project. Journal for Research inMathematics Education, 22, 3-29.
DeSimone, J. R., fk Parmar, R. S. {2CK)6). Issues and challenges formiddle school mathematics teachers in inclusion classrooms.School Science ami Mathematics, ¡06. :Í;Í8-:Í48.
Fuchs, L. S.. & Fuchs, D. (2005). Enhancing mathematical prob-lem solving for students with disabilities. The ¡oumal of SpecialEducation, 39, 45-57.
Fuchs, L. S., Fuchs, D., Compton, D. L., Bryant, J. D., Hamlett, C.L, & Seethaler, P. M. (2007). Mathematics screening withprogress monitoring at first grade: Implications for responsive-ness to intervention. Exceptional Childrai 73, M 1-330.
Gagnon, J. C , ik Maccini, P. (2007). leacher-reported useof empirically-validated and standards-hased practices insecondary mathematics. Remedial and Special Education, 28.43-56.
Goos, M., Galhraith, P., Renshaw, P,, & Geiger, V, (2003). Per-spectives on technology mediated learning in secondary schoolmathematics classrooms. Mathematical Behavior, 22, 73-89.
Hudson, P., Miller, S. P,, ÍÍ Butler, F. {2006). Adapting and merg-ing explicit instruction within reform based mathematics class-rooms. American Secondar)- Etlmation, .Í5( I ), 19-32.
Huntley, M. A., Rasmussen, C. L, Villarubi, R. S.. Sangton, J., StFey, J. T, (2000). Effects of standards-based mathematics educa-tion: A study of the Core-plus Mathematics Project algebra andfunctions strand, faunial for Research in Mathematics Education,3¡, .328-361.
Jitendra, A., DiPipi, C. M., fei Perron-jones, N, (2002). Anexploratory study of schema-based word-problem-solvinginstruction for middle school students with learning disabili-ties. The Journal of Special Education, 36, 23-38.
Johnstone, C. J., Altman, J., Thurlow, M. L., & Thompson, S. J.(2006). A summary of research on the effects of test accommoda-tions: 2002 through 2004 (Technical Report 45). Minneapolis:University of Minnesota, National Center on KducationalOutcomes. Retrieved January 23, 2009, from http://education,umn.edu/NCEO/OniinePubsn'ech45/.
Lappan, G., Fey, J., Fitzgerald, W., Friei, S., is Phillips, E. (2004).Connected Mathematics ¡'roject. Boston: Prentice Halt.
Liu, X,, & Raudenbush, S. (2004). A note on the noncentrallyparameter and effect size estimates for the F test in ANOVA.Journal of Educationahuui Hehuvioral Statistics, 29. 251-255.
Loveless, T. (2004, April). Computation skills, Ciilculators, amiachievement gaps: An analysis ofNAEI' items. Paper presented atthe annual conference ot the American Educational Research
Voliiirit' :t2. Full 2009 24J
Association, San Diego. CA. Retrieved June 20, 2006, fromhttp://www.brookings.org/views/papers/200404I51oveless.htm.
Maccini, P., & Gagnon, J. C. (2000). Best practices for teachingmathematics to secondary students with special needs. Fuciis onExceptional Children, 32, 1-22.
Maccini, P., & Gagnon, J. C. (2002). Perceptions and applicationsof NC11VI standards by special and general education teachers.Exceptional Children, 68, 235-244.
Maccini, P., ik Gagnon, J. C. (2005). Mathematics and technology-based interventions. In D. Edybum, K. Higgins, is R. Boone(Eds.), Handbook of special eilucation research and practice (pp.599-622). Whitefish Bay, WI: Knowledge by Design.
Maccini, P., McNaughton, D., 6i Ruhi, K. L. (1999). Algebrainstruction for student with leaming disabilities: Implicationsfrom a research review. Leaming Disability Quarterly, 22(2), \ 13-126.
Maccini, P., is. Ruhl, K. L. (2000). Effects of a graduated instruc-tional sequences on the algebraic subtraction of integers by sec-ondary students with learning disabilities. Education andTreatment of Children. 23. 465-489.
Michigan Department uf Education. (2002). Revised administrativenile.s for special education. Retrieved August 4, 2009, from http;//homepages. wmich.edu/-'haus/427/.SPMD_ADMIN_RUI.ES.pdf
Michigan Department of Education. (2f)09). Michigafi administra-tive ruk'5 for special education supplemented with IDEA federalregulations. Retrieved August 4. 2009, from http://www.michigan.gov/documen ts/mde/MARSE-ApriI09_274156_7.pdf
Michigan Department of Education, (n.d.). Michigan educationassessment program (MEAP). Retrieved August 1, 2009, fromhttp://www.michigan,gov/mde/0,1607,7-140-22709_31168—,00.html
Michigan State University. (2006). Connected mathematics project.Retrieved January 21, 2009, from http://connectedmath.msu.edu/
National Council of Teachers of Mathematics (1989). Curriculumand evaluation standards for school mathematics. Reston, VA:Author.
National Council of Teachers of Mathematics. (2000). Principlesand NCTM standards fur school mathematics. Reston, VA: Author.
National Council of Teachers of Mathematics. (2005).Computation, calculators, and common sense: A position of theNational Council of Teachers of Mathematics. Retrieved October15, 2008, from https://www.nctm.org/uploadedFiles/About_NCTM/Position_Statements/computation.pdf
National Mathematics Advisory Panel. (2008). Foundations for suc-cess. Washington, DC: U.S. Department of Education.
No Child I^ft Behind Act of 2001, Pub. L No. 107-110, 115 Stat.1425 (2002).
Parmar, R. S., Cawley, J. F., & Frazita, R. R. (1996). Word problem-solving by students with and without mild disabilities.Exceptional Children, 62. 415-429.
Pomerantz, H. (1997). The rale of calculators in math educationresearch. Educalc.net. Retrieved September 25, 2006, fromhttp://www.educalc.net/13S569.page.
Reys, R. E. (2001). Curricular controversy in the math wars; A bat-tle without winners. Phi Delta Kappan, 83, 255-258.
Reys, R., Reys, B., Lapan, R.. Holliday, G., & Wasman, D. (2003).Assessing the impact of standards-based middle grades mathe-matics curriculum materials on student achievement. Joumal forResearch in Mathematics Education, 34, 74-83.
Riordan, J. E., St Noyce, P. E. (2001). The impact of two standards-based mathematics curricula on student achievement inMassachusetts, ¡ounial for Research in Mathematics Education, 32.368-398.
Rivera, D. P. (1997). Mathematics education and students withlearning disabilities: Introduction to the special series, ¡oiirnal ofLearning Disabilities, 68, 2-19.
Salend, S. J., & Hofstetter, E. (1996). Adapting a problem-solvingapproach to teaching mathematics to students with mild dis-abilities. Intervention in School and Clinic, 31, 209-217.
Schmidt. W., Houang, R., is Cogan, L. (2002, Summer). A coherentcurriculum: The case of mathematics. American Educator, 1-17.
Schoen, H. L., Fey, J. T., Hirsch, C. R., & Coxford, A. 1̂ (1999).issues and options in the math wars. Phi Delta Kappan, 80, 444-453.
U.S. Department of Education. (2005). 27th Annual report to con-gress on the implementation of the Individuals with DisahiliiicsEducation Act, 2005 Vol. 1. Retrieved September 12, 2008, fromhttp://www.ed.gov/about/reports/annual/osep/2005/parts-b-c/27th-vol-l.pdf.
Wagner, M. (1995). Outcomes for youth with serious emotionaldisturbance in secondary school and early adulthood, future ofChildren, 5(2), 90-113.
Wood, T., & Sellers, P. (1997). Deepening the analysis: A longitu-dinal assessment of problem-centered mathematics projects.¡aurtial for Research in Mathematics Education, 28, 163-186.
Woodward, J. (1999). Redoing the numbers; Secondary math for apostsecondary work world. Teaching Exceptional Children, 3/(4),74-79.
Woodward, J. (2004)- Mathematics reform in the US: Past to pres-ent, tournai of Learning Disabilities, 37, 16-31.
Woodward, J., h Baxter, J. (1997). The effects of an innovativeapproach to mathematics on academically low-achieving stu-dents in inclusive settings. Exceptional Children, 63, 373- 388.
Woodward, J., is Brown, C. (2006). Meeting the curricular needs ofacademically low-achieving students in middle grade mathe-matics. The ¡ournal of Special Education, 3, 151-159.
Xin, Y. P., Jitendra, A. K., Deatline-Buchman, A. (2005). Effects ofmathematical word problem-solving instruction on middleschool students with learning problems. The joumal of SpecialEducation, 39. 181-192.
Ysseldyke,J,,Thurlow. M, Seyfürth, A., Bielinski, J., Moody, M,, &Haigh, J. (19991. Instructional and assessment accommodationsin Maryland (Maryland/Kentucky Report 6). Minneapolis:University of Minnesota. National Center on EducationalOutcomes. Retrieved August 29, 2007, from http://education.umn.edu/NCEO/OnlinePubs/MdKy6.htm.
NOTESThe averages are based on those students for whom informationwas in their file(s). One student in the standards-based and twoin the traditional did not have the necessary information withintheir file(s). The number 4 indicates that students are at anapprentice level, 3 indicates that students are at a basic level, 2indicates that students have met standards, and 1 indicates thatstudents have exceeded standards) (Michigan Department ofEducation, n.d.).X is the noncentrality parameter, which is closely related toeffect size and is a strong indication of effect size (Liu &Raudenbush, 2004). X is used as effect size in hierarchical typemodels is not straight-forward. Larger X indicates stronger effect.
AUTHOR NOTEThis research was supported by a grant from the SpencerFoundation.
Please address correspondence about this article to: Emily C.Bouck, 5146 BRNG Hall, Purdue University, 100 N. University St.,West Lafayette, IN 47907; e-mail: bouck<g>purdue.edu
Leaming Disability Quarterly 244

Copyright of Learning Disability Quarterly is the property of Council for Learning Disabilities and its content
may not be copied or emailed to multiple sites or posted to a listserv without the copyright holder's express
written permission. However, users may print, download, or email articles for individual use.