
MIDDLE EAST CURRENT...
76
Editorial board Editor in Chief Farouk Lotaief Chairman of the Board Ahmed Okasha Honorary Editor Mahmoud S. Abdelgawad Moustafa Kamel Mounir Fawzi Assistant to Editor in Chief Tarek Asaad Tarek Okasha Yasser A. Elsayed Associate Editor Mohamed Ghanem International Advisory Board: Tarek Abdel-Gawad (Egypt) Ahmed Abdel-Latief (Egypt) Abdullah Abdelrahman (Sudan) Mohamed Abouzied (Egypt) Tsuyoshi Akiyama (Japan) Abdel Moniem Ashour (Egypt) Zienab Bishry (Egypt) Haroon R. Chaudhry (Pakistan) Safia Effat (Egypt) Abdou El-Dod (Egypt) Mohamed El-Fiky (Egypt) Tarek El-Habib (Saudi Arabia) Suzan El-Kholi (Egypt) Tarek El-Maadawy (Bahrain) Naglaa El-Mahalawy (Egypt) Gihan El-Nahas (Egypt) Ali El-Roey (Libya) Heba Essawy (Egypt) Wolfgang Gabel (Germany) Hamid Ghodse (UK) Oye Gureje (Nigeria) Amany Haroon (Egypt) Helen Herrman (Australia) Afzal Javed (UK) Eli Karam (Lebanon) Siegfried Kasper (Austria) Levent Kuey (Turkey) Juan Lopez-Ibor (Spain) Felice Lee Mac (China) Mario Maj (Italy) Mona Mansour (Egypt) Jari Mari (Brazil) Driss Moussaoui (Morocco) Nahla Nagy (Egypt) Abdel Naser Omar (Egypt) Ossama Osman (UAE) Hisham Ramy (Egypt) Richard Rawson (USA) Pedro Ruiz (USA) Ahmed Saad (Egypt) Victor Samy (Egypt) Waleed Sarhan (Jordan) Norman Sartorius (Switzerland) Maha Sayed (Egypt) Christopher Sazbo (China) Adel El Sheshaie (Egypt) Constantine Soldatos (Greece) Alaa Soliman (Egypt) Costas Stefanis (Greece) Peter Tyrer (UK) Editorial Manager: Aida Sief El Dawla Ghada El Kholy Hisham Sadek Scientific Editorial Manger: Dina Ibrahim Sherine Shalaby General Secretary: Neveen Farouk For subscriptions to the printed journal, please contact: Neveen Farouk, General Secretary, MECPsych official journal of Okasha Institute of Psychiatry, Faculty of Medicine, Ain Shams University. Tel. & Fax. 02 26824738; Mobile: 0106609575. Advertisements, statements or opinions expressed in Middle East Current Psychiatry reflect the views of the advertiser or author(s) and are not the opinion of Lippincott Williams & Wilkins or the Editorial Board unless so stated. Readers are advised that new methods and techniques described involving drug usage should be followed only in conjunction with drug manufacturer’s own published literature. MIDDLE EAST CURRENT PSYCHIATRY Vol 18 No 2 April 2011
Transcript of MIDDLE EAST CURRENT...

Editorial boardEditor in Chief
Farouk Lotaief
Chairman of the Board
Ahmed Okasha
Honorary Editor
Mahmoud S. AbdelgawadMoustafa KamelMounir Fawzi
Assistant to Editor in Chief
Tarek AsaadTarek OkashaYasser A. Elsayed
Associate Editor
Mohamed Ghanem
International Advisory Board:
Tarek Abdel-Gawad (Egypt)Ahmed Abdel-Latief (Egypt)Abdullah Abdelrahman (Sudan)Mohamed Abouzied (Egypt)Tsuyoshi Akiyama (Japan)Abdel Moniem Ashour (Egypt)Zienab Bishry (Egypt)Haroon R. Chaudhry (Pakistan)Safia Effat (Egypt)Abdou El-Dod (Egypt)Mohamed El-Fiky (Egypt)Tarek El-Habib (Saudi Arabia)Suzan El-Kholi (Egypt)Tarek El-Maadawy (Bahrain)Naglaa El-Mahalawy (Egypt)Gihan El-Nahas (Egypt)Ali El-Roey (Libya)Heba Essawy (Egypt)Wolfgang Gabel (Germany)Hamid Ghodse (UK)Oye Gureje (Nigeria)
Amany Haroon (Egypt)Helen Herrman (Australia)Afzal Javed (UK)Eli Karam (Lebanon)Siegfried Kasper (Austria)Levent Kuey (Turkey)Juan Lopez-Ibor (Spain)Felice Lee Mac (China)Mario Maj (Italy)Mona Mansour (Egypt)Jari Mari (Brazil)Driss Moussaoui (Morocco)Nahla Nagy (Egypt)Abdel Naser Omar (Egypt)Ossama Osman (UAE)Hisham Ramy (Egypt)Richard Rawson (USA)Pedro Ruiz (USA)Ahmed Saad (Egypt)Victor Samy (Egypt)Waleed Sarhan (Jordan)Norman Sartorius (Switzerland)Maha Sayed (Egypt)Christopher Sazbo (China)Adel El Sheshaie (Egypt)Constantine Soldatos (Greece)Alaa Soliman (Egypt)Costas Stefanis (Greece)Peter Tyrer (UK)
Editorial Manager:
Aida Sief El DawlaGhada El KholyHisham Sadek
Scientific Editorial Manger:
Dina IbrahimSherine Shalaby
General Secretary:
Neveen Farouk
For subscriptions to the printed journal, please contact: Neveen Farouk, General Secretary, MECPsych official journal of OkashaInstitute of Psychiatry, Faculty of Medicine, Ain Shams University. Tel. & Fax. 02 26824738; Mobile: 0106609575.
Advertisements, statements or opinions expressed in Middle East Current Psychiatry reflect the views of the advertiser or author(s)and are not the opinion of Lippincott Williams & Wilkins or the Editorial Board unless so stated. Readers are advised that newmethods and techniques described involving drug usage should be followed only in conjunction with drug manufacturer’s ownpublished literature.
MIDDLE EAST CURRENT PSYCHIATRY
Vol 18 No 2 April 2011

Table of contents
Original articles
57 The effect of commonly used antidepressant drug groups on sleep profile with major depression:
a case–control study
Ismail Youseff, Abdel Rahman Hasan, Magda Fahmy, Tarek Assad, Ghada El-Khouly, Khaled Abdel Moezand Sahar Abdel Khalik
65 Burden of care on female caregivers and its relation to psychiatric morbidity
Mohammed Elmahdi, Foad Kamel, Ali Esmael, Mohammed Lotfi, Ahmad Kamel and Ayman Elhosini
72 Coping with stress and quality of life among patients with schizophrenia in Egypt and Saudi Arabia:
effect of sociodemographic factors
Eman Elsheshtawy and Warda Abo Elez
78 Comorbid psychiatric symptoms in patients with psoriasis
Fatma Abd El Latif Mousa, Hesham Abd El Moati Zaher, Mohammed Ezzat Amin, Akmal Mostafa Kamaland Heba Fathy
86 Psychiatric morbidity across perinatal period in a sample of Egyptian women
Dina Ibrahim, Zainab Bishry, Ahmed Saad, Osama Saleh, Gihan El-Nahas and Mona El- Sheikh
97 Change in quality of life after cognitive behavior therapy for anxiety disorders: an Egyptian
prospective study
Mohamed Ghanem, Mona Mansour, Mohamed Fekry, Hisham Hatata, Ghada El-Khoulyand Reham Aly
109 Prevalence of metabolic syndrome in patients with schizophrenia
Reda Roshdy
118 Methyltetrahydrofolate reductase polymorphism, folic acid, and B12 in a sample of patients with
depressive and anxiety symptoms
Heba Fathy, Sherine Mohamed Abd El-Mawella, Hoda Abdou, Ashraf Adel and Amal Abdou
MIDDLE EAST CURRENT PSYCHIATRY
Vol 18 No 2 April 2011

Instructions for authors
The editorial staff will be most grateful for your assistance in relation to the matters listed below. Please read these instructionscarefully before preparing a submission
Manuscripts must be submitted by one of the authors of the manuscript, and should not be submitted by anyone on their behalf. Thesubmitting author takes responsibility for the article during submission and peer review.
To facilitate rapid publication MECPsych accepts submissions online and through the e mail to the Chief Editor.
A cover letter should be attached to the submission. Please use this to explain why your manuscript should be published in thejournal and to elaborate on any issues relating to our editorial policies detailed in the instructions for authors.
MECPsych uses online peer review to speed up the publication process. The time taken to reach a final decision depends onwhether reviewers request revisions, and how quickly authors are able to respond.
The ultimate responsibility for any decision lies with the Editor-in-Chief, to whom any appeals against rejection should be addressed.Any manuscripts or substantial parts of it, submitted to the journal must not be under consideration by any other journal.Authors are required to ensure that no material submitted as part of a manuscript infringes existing copyrights, or the rights of athird party.
Submission of a manuscript to MECPsych implies that all authors have read and agreed to its content, and that any experimentalresearch that is reported in the manuscript has been performed with the approval of an appropriate ethics committee. Researchcarried out on humans must be in compliance with the Madrid and Helsinki Declaration. A statement to this effect must appear in theMethods section of the manuscript, including the name of the body which gave approval. Informed consent must also bedocumented. Manuscripts may be rejected if the editorial office considers that the research has not been carried out within anethical framework.
We ask authors of MECPsych papers to complete a declaration of competing interests, which should be provided as a separatesection of the manuscript.
Manuscript
Title Page:
Page 1 should include: (a) the title of the article (be short, specific, clear, and limit to two lines with no abbreviations) (b) the authors’names (c) affiliations (the name of the department, if any, institution, city and state or country where the work was done) indicatingwhich authors are associated with which affiliations, (d) the corresponding author’s name and full postal address includingtelephone, fax number and Email.
Abstract
Page 2 should include the title of the article followed by structured abstract in one paragraph; The abstract should state theintroduction, methods, results and principal conclusions, with an emphasis on the new aspects of the study. All non-standardabbreviations should be spelled out in the abstract.
Text
Papers should be organized in the following format: Introduction, aim of the work, Materials and Methods, statistics, Results andDiscussion. Other descriptive headings and sub-headings may be used if appropriate. Contents of the study should be presentedas clearly and as concisely as possible.
Conflict of interests
Authors should put their conflict of interests just after the text and before the references.
Acknowledgment
Acknowledgment should follow conflict of interests and precede the section for references.
References
References should include only articles that are published or in press. Submitted articles should be cited as unpublished data, orpersonal communication. Citations in the text should be numerical. The reference list must be submitted in the Vancouver system.
MIDDLE EAST CURRENT PSYCHIATRY
Vol 18 No 2 April 2011

Tables
These should be typed on separate sheets and their approximate position in the texts should be indicated.
Statistics
Statistical methods should be specified explicitly and referenced if they are non-standard. Estimates presented should beac-companied by indices of precision (e.g. means accompanied by confidence intervals).
Arabic summary:
An short Arabic summary is required at the end of the manuscript in a separate section.
MIDDLE EAST CURRENT PSYCHIATRY
Official Journal of Okasha Institute of Psychiatry, Faculty of Medicine, Ain Shams University
WHO Collaborative Center For Training And Research
Aims and Scope
MECPsych is one of the Middle East’s leading psychiatric journals. It covers all branches of the subject, with particular emphasis onthe clinical aspects of each topic. MECPsych is committed to keeping the field of psychiatry in the Middle East updated and relevantby publishing the latest advances in the diagnosis and treatment of mental illness. MECPsych publishes high-quality, scientificarticles in English, representing clinical and experimental work in psychiatry. The journal acts as an international forum for thedissemination of information advancing the science and practice of psychiatry MECPsych encourages articles in compliance with theMadrid and Helsinki Declarations.
Original articles are welcomed, especially those that bring new knowledge or extend the present understanding of mental disorders.Equal priority is given to review articles. All manuscripts published have been assessed at least by two experienced internationalreferees.
MIDDLE EAST CURRENT PSYCHIATRY
Vol 18 No 2 April 2011


The effect of commonly used antidepressant drug groups
on sleep profile with major depression: a case–control studyIsmail Youseffa, Abdel Rahman Hasanb, Magda Fahmya, Tarek Assadc,Ghada El-Khoulyc, Khaled Abdel Moeza and Sahar Abdel Khalika
aDepartment of Psychiatry, Faculty of Medicine, SuezCanal University, bDepartment of Psychiatry, Faculty ofMedicine, Mansoura University, cDepartment ofPsychiatry, Faculty of Medicine, Ain Shams University,Cairo, Egypt
Correspondence to Ghada El-Khouly, Department ofPsychiatry, Faculty of Medicine, Ain ShamsUniversity, Cairo, EgyptTel/fax: + 20 26845439;e-mail: [email protected]
Received 16 November 2010Accepted 19 January 2011
Middle East Current Psychiatry 2011, 18:57–64
Objectives
One of the adjuvant of an ideal antidepressant is its desirable effect on sleep.
Nevertheless, head-to-head comparisons between different antidepressants, designed
specifically to test their sleep effects in a clinical setting are still scarce. This study
aimed at comparing the effect of commonly used antidepressant groups on sleep
profile as measured by Polysomnogram of depressed patients in a clinical setting.
Materials and methods
Thirty newly diagnosed nonmedicated depressed patients were recruited from the
outpatient and inpatient departments of the Institute of Psychiatry, Ain Shams University
Hospitals, in the period May to November 2008. All patients were diagnosed according
to International Classification of Diseases-10 research diagnostic criteria of major
depression with a score of greater than 14 on the Hamilton Depression Rating Scale, and
screened for eligibility in the study using full physical examination, routine laboratory tests,
electroencephalogram, and the psychiatric history and mental state examination sheet of
the Institute of Psychiatry, Ain Shams University. They were classified according to the
prescribed antidepressants according to their treating doctor into tricyclics
antidepressants (TCAs) group (15 patients) and selective serotonin reuptake inhibitors
(SSRIs) group (15 patients). The control group consisted of 10 healthy individuals
matched with patients for age and sex. Recruited depressed patients as well as controls
were subjected to (i) structured sheet for sleep disorders, (ii) Hamilton Depression Rating
Scale-17 for measuring the efficacy of antidepressants, and (iii) Polysomnographic study.
Patients were subjected to these assessments two times, before antidepressant start and
1 month after antidepressant start. Controls were subjected to these assessments once
immediately after recruitment.
Results
TCAs improved all sleep parameters, except for sleep stage I and III and slow-wave
sleep percentage (SWS %). SSRIs improved all sleep parameters, except for sleep
stages I, II, III, and IV and SWS%. TCAs led to a more significant decrease in
sleep latency, arousal index, sleep stage I as well as a more significant increase in
sleep efficiency, sleep stages III and IV, and SWS% than with SSRIs. SSRIs led to a
more significant decrease in rapid eye movement percentage (REM%) and to a more
statistically significant increase in sleep stage II than with TCAs. There was no
statistically significant difference between the two drug groups regarding their effect
on REM density, REM latency, and periodic limb movement index.
Conclusion
Commonly used antidepressants in clinical practice have a positive effect on objective
sleep parameters, except for sleep microstructure. TCAs significantly improved
objective sleep quality away from its antidepressant therapeutic effect compared with
SSRI. Selecting the proper antidepressant for depression with profound sleep
problems is an art, which needs future research.
Keywords:
antidepressants, depression, sleep
Middle East Curr Psychiatry 18:57–64�c 2011 Okasha Institute of Psychiatry, Faculty of Medicine, Ain Shams University2090-5408
IntroductionSleep disturbance is a prevalent key feature of depression
that affects the course of illness, treatment compliance,
and treatment response [1]. More than 80% of people
with depression experience sleep disturbances, such as early
morning waking or frequent awakenings throughout the
whole night [2,3]. Even in chronic low-grade depression,
which affects roughly 3% of people, insomnia and/or
sleepiness may be the most prominent symptom [4].
Original article 57
2090-5408 �c 2011 Okasha Institute of Psychiatry, Faculty of Medicine, Ain Shams University DOI: 10.1097/01.XME.0000395556.81462.d6

Disturbed sleep in depression is either objective as
shortened rapid eye movement (REM) latency, disrup-
tion of sleep continuity, early morning waking, and
reduction of slow-wave sleep (SWS) [5] or subjective as
total sleep time (TST), difficulty in initiating sleep, and
interrupted sleep. This subjective sleep disturbance
affects the patient satisfaction by the antidepressant
[6,7], that is, does my antidepressant improve my sleep?
One of the adjuvants of an ideal antidepressant is its
desirable effect on sleep. Antidepressants that reduce
restless sleep and awakening with no REM suppression
and that improve alertness are considered ideal [8]. The
efficacy of antidepressants generally appears to be equal
[9]. However, some compounds claim advantages over
others related to specific side effects such as sexual
dysfunction and/or sleep disturbance. Nevertheless,
head-to-head comparisons between the commonly used
antidepressant designed specifically to test these claims
in a clinical setting are still scarce [10].
Polysomnogram (PSG) translates subjective sleep com-
plaints to objective findings that help us to quantify the
effect of different antidepressants on sleep, which will
help in predicting the patient’s satisfaction and in
enhancing his/her compliance [7,11].
This study aimed at comparing the effect of commonly
used antidepressant groups on sleep profile as measured
by PSG of depressed patients in a clinical setting.
Patients and methodsConsecutive newly diagnosed nonmedicated depressed
patients attending both the outpatient and inpatient
departments of the Institute of Psychiatry, Ain Shams
University Hospitals, in the period May to November
2008 were invited to participate in the study. Depression
was diagnosed according to International Classification of
Diseases-10 research diagnostic criteria of major depres-
sion with a score of greater than 14 on the Hamilton
Depression Rating Scale (HAMD).
The depressed patients who agreed to participate in this
study were asked for written consent and were screened
for eligibility in the study using full physical examination,
routine laboratory tests including blood chemistry, thyroid
functions, liver functions, urine analysis, electroencepha-
logram (EEG), and the psychiatric history and mental
state examination sheet of the Institute of Psychiatry, Ain
Shams University.
Depressed patients were excluded if they were younger
than 20 years and older than 40 years, had comorbid
psychiatric disorder other than depression (including
bipolar depression), were already maintained on anti-
depressant(s), had a history of use of antidepressants
within the last 6 months, had a history of treatment-
resistant depression (nonresponsive to a single anti-
depressant at therapeutic doses for at least 6 weeks), had
a past/current history of epilepsy as confirmed by EEG,
had a past/current history of head trauma, had comorbid
physical condition and/or drugs that could affect the sleep
EEG, had a medical contraindication to antidepressant
drugs (including pregnancy, lactation, or not using
contraception while of childbearing potential in women),
had serious suicide risk, were unable to maintain a
consistent sleep pattern (such as shift workers), had
current sleep/wake disorder, and/or were on psychoactive
substances (including benzodiazepines) in the last 6
weeks before the study as a washout period.
Patients were classified according to the prescribed
antidepressant according to their treating doctor into two
groups: group 1 had been receiving tricyclics antidepres-
sants (TCAs) and group 2 had been receiving selective
serotonin reuptake inhibitors (SSRIs). We had 15 patients
in each group after dropouts, which were five in each group
mainly because of intolerable side effects of drugs and/or
severe sleep complaint that needed rapid intervention.
Control group consisted of 10 healthy individuals who
were selected from among the hospital employees after
being screened for eligibility of the study in the same way
similar to patients. They were matched with patients for
age and sex.
Recruited depressed patients as well controls were
subjected to (i) structured sheet for sleep disorders,
derived from the sleep disorder questionnaire of Douglass
et al. [12] that contained 72 questions regarding past
or current history of sleep disturbance, sleep disorder,
psychiatric disorder, and drug history; (ii) HAMD-17 for
measuring the efficacy of antidepressants; and (iii) PSG
study conducted for three successive nights; we con-
sidered the values of the last night in order to take the
most valid reading after the patient felt comfortable with
the study place.
Patients were subjected to these assessments two times:
before antidepressant start and 1 month after antide-
pressant start. Controls were subjected to these assess-
ments once immediately after recruitment.
Tools
HAMD [13] is a valid reliable multidimensional measure
covering wide dimensions of depressive symptomatology,
including depressed mood, vegetative symptoms, anxiety,
agitation, and insight [14] and being sensitive to
treatment change [15]. Reduction of 50% of pretreat-
ment depressive symptoms assessment considered re-
sponse to treatment and score less than or equal to 7
considered clinical remissions [16]. In antidepressant
clinical trials, HAMD-17 has been the gold standard
instrument for establishing and comparing the efficacy
of new treatments [17,18]. Cutoff point and scoring
of depression severity as determined by HAMD-17 are
as follows: no depression (r 7), mild (8–13), moderate
(14–18), severe (19–22), and very severe (> 23).
Overnight polygraph sleep recording (PSG) was carried
out by a remote cable that used a 16-channel polygraph
including EEG, submental chin electromyelogram, and
electro-occulogrpahy. Sleep was recorded automatically
with visual correction by an experienced sleep scorer
according to standard Rechtschaffen and Kales [19]
58 Middle East Current Psychiatry

criteria. Many parameters were derived from the PSG
study including sleep staging time, TST, number of
awaking, sleep latency, wakefulness after sleep onset,
sleep efficiency, REM latency, REM density, periodic
limb movement index (PLMI), and arousal index.
Statistical analysis
Data coded and revised were introduced to an EXCEL
database to be manipulated and analyzed later using the
16th version of SPSS (SPSS, Inc., Chicago, IL, USA). For
the sake of description, categorical data were presented
as number and percentage; means, standard deviation,
and 95% confidence limit were used to describe conti-
nuous variables. One-way analysis of variance was used to
test any significant differences between more than two
groups. Kruskall–Wallis test was used to analyze differ-
ences of continuous variables between more than two
groups. The paired t-test was used to analyze the difference
within individual group before and after treatment of
normally distributed variables. Statistically significance
level was set at a value of less than or equal to 0.05; highly
significant level was at a value less than 0.01; and very
highly significant level was at a value less than 0.001.
ResultsTwo groups of depressed patients were identified in our
study. Each group included 15 patients. The first group
(1) received TCAs (11 received amitriptyline and four
received imipramine) within the therapeutic dose (75–
100 mg/day); their mean age was 34.73 ± 4.89 years with
eight of them being women (53.3%) and seven of them
being men (46.6%). The second group (2) received SSRIs
(12 received paroxetine and three received citalopram)
within the therapeutic dose (20 mg/day); their mean age
was 34.60 ± 5.36 years with nine of them being women
(60%) and six of them being men (40%).
The third group in our study was of healthy controls (3)
matched with patients for sex and age. Their mean age
was 33 ± 4.42 years with five of them being women (50%)
and five of them being men (50%). There was no
statistically significant difference between patients and
controls regarding age and sex (P > 0.05).
In comparing sleep parameters of both TCAs group (1)
and SSRIs group (2) versus controls (3) at the baseline
(pretreatment), there was statistically significant longer
sleep latency, poorer sleep efficiency, higher arousal
index, longer stage one, shorter stage three and four
and SWS, higher REM percentage and density, and
shorter REM latency in patients than in controls. With
regard to PLMI, it was higher only in group 1 than in
controls with no statistically significant difference (P =
0.357) found between group 2 and controls (Table 1).
In comparing sleep parameters of TCAs group 1 versus
SSRIs group 2 at the baseline (pretreatment), there was
no statistically significant difference in all parameters
between the two groups, except for significantly longer
stage four and higher SWS percentage (SWS%) and PLMI
in group 1 than in group 2 (Table 2).
In assessing the response to treatment in the two groups
by comparing the scores on HAMD before and after
treatment, there was statistically significant lowering
of the HAMD score in both groups; however, it reached
the response level (lower than 50% from the initial
score) only in group 1. There was no statistically
significant difference between the two groups after
treatment as regards the HAMD score (Table 3).
With regard to the effect of TCAs on sleep parameters, all
parameters were improved after receiving TCAs, except
for sleep microstructure where stage one showed no
statistically significant shortening after treatment and
stage 3 and SWS% showed significant prolongation but
still below the normal values (Table 4).
With regard to the effect of SSRIs on sleep parameters, all
parameters were improved after receiving SSRIs, except
for sleep microstructure, where stage one showed no
statistically significant shortening after treatment, stages
2, 3, and 4 showed significant prolongation, and SWS%
showed a significant increase, but all were still below the
normal values (Table 5).
Table 1 Comparing sleep parameters of depressed patients maintained on TCAs (group 1) versus controls and depressed patients
maintained on SSRIs (group 2) versus controls at the baseline pretreatment level
Sleepparameter
TCAs group(mean ± SD)
SSRIs group(mean ± SD)
Controls(mean ± SD) P value
Sleep latency 42.53 ± 7.74 41.6 ± 10.7 19 ± 2.4 0.000Sleep
efficiency37.35 ± 5.08 40.58 ± 7.3 91.18 ± 2.47 0.000
Arousal index 17.93 ± 1.31 17.4 ± 1.79 5.78 ± 1.83 0.000Sleep stage 1 8.19 ± 1.2 10.18 ± 3.49 7.78 ± 12.04 0.00Sleep stage 2 51.41 ± 0.92 52.55 ± 3.17 19.43 ± 2.6 0.00Sleep stage 3 6.67 ± 10.07 3.87 ± 0.96 9.99 ± 0.71 0.00Sleep stage 4 3.77 ± 0.71 2.76 ± 1.03 10.12 ± 0.52 0.000SWS% 7.87 ± 0.87 6.63 ± 1.41 20.17 ± 0.61 0.000PLMI 2.73 ± 0.65 2.29 ± 0.47 2.08 ± 0.46 0.006
0.357REM% 31.87 ± 3.25 30.65 ± 5.25 25.21 ± 1.20 0.001REM density 26.75 ± 0.74 26.03 ± 1.63 20.74 ± 0.83 0.000REM latency 44.40 ± 12.40 46.24 ± 13.03 68.4 ± 5.93 0.00
Statistical significance level was set at a value r0.05, highly significant level at a value < 0.01, and very highly significant level at a value < 0.001.PLMI, periodic limb movement index; REM, rapid eye movement; SSRIs, selective serotonin reuptake inhibitors; SWS, slow-wave sleep; TCAs,tricyclic antidepressants.
The effect of commonly used antidepressant Youseff et al. 59

On comparing the effect of TCAs and SSRIs on sleep
parameters, TCAs led to a more statistically significant
decrease in sleep latency, arousal index, sleep stage 1 as
well as a more statistically significant increase in sleep
efficiency, sleep stages 3 and 4, and SWS% than with
SSRIs. In contrast, SSRIs led to a more significant
decrease in REM% and a more statistically significant
increase in sleep stage 2 than with TCAs. There was no
statistically significant difference between the two drug
groups regarding their effect on REM density, REM
latency, and PLMI (Table 6).
DiscussionAt pretreatment baseline, our depressed patients in the
two treatment groups had sleep disturbance in the form
of longer sleep latency, poorer sleep efficiency, higher
arousal index, longer stage one, shorter stages three and
four (SWS), higher REM percentage and density, and
shorter REM latency than in controls. These findings
are in accordance with most of the scientific studies
regarding sleep disturbance in depression as those of
Thase et al. [20], Rush et al. [21], Rechtschaffen et al.[22], and Doghramji [6] who found the same findings.
There were no statistically significant pretreatment
differences between the two groups on nearly all the
sleep measures, except for TCAs group that had
significantly longer stage four and higher SWS%, which
reflects better sleep and higher PLMI, which further
reflects poorer sleep than the SSRIs group. These
differences entirely occurred by chance as we selected
patients already after prescription of the drug for the two
groups randomly. Moreover, it may reflect the prescrip-
tion habits in our practice, which differentiate between
TCAs and SSRIs according to drug cost and/or severity
of depression, with more TCAs being prescribed for
severe depression [23,24]. To our knowledge, no research
reflecting actual prescription habits of antidepressants in
our culture is available.
Home sleep recording performed by Hicks et al. [25]
could be comparable with our study, which provided valid
data for sleep assessment on three successive nights as
a period of adjustment to the unfamiliar surroundings
reflecting the most comfort for the patient. They found
higher SWS compared with most sleep laboratory studies
in depression. This supports the use of home sleep than
sleep center recordings as it reflects better sleep quality.
Table 3 Comparing HAMD score of depressed patients
maintained on TCAs (group 1) versus depressed patients
aintained on SSRIs (group 2) before and after treatment
Group 1 (before treatment) Group 1 (after treatment) P value34.53 ± 3.72 15.93 ± 3.83 0.00
Group 2 (before treatment) Group 2 (after treatment) P value32 ± 4.49 19.67 ± 6.16 0.00
Group 1 (after treatment) Group 2 (after treatment) P value15.93 ± 3.83 19.67 ± 6.16 0.056
Statistical significance level was set at a value r0.05, highlysignificant level at a value < 0.01, and very highly significant at avalue < 0.001.HAMD, Hamilton Depression Rating Scale; SSRIs, selective serotoninreuptake inhibitors; TCAs, tricyclic antidepressants.
Table 4 Comparing sleep parameters in depressed patients
maintained on TCAs (group 1) before and after receiving TCAs
Sleepparameter
Before(mean ± SD)
After(mean ± SD) P value
Sleep latency 42.53 ± 7.74 20.27 ± 4.40 0.00Sleep efficiency 37.35 ± 5.08 69.20 ± 7.43 0.00Arousal index 17.93 ± 1.31 9.92 ± 1.50 0.00Stage 1 8.19 ± 1.2 7.53 ± 1.21 0.07Stage 2 51.41 ± 0.92 52.93 ± 1.03 0.00Stage 3 6.67 ± 10.07 7.09 ± 0.97 0.01Stage 4 3.77 ± 0.71 7.43 ± 1.40 0.00SWS% 7.87 ± 0.87 14.51 ± 2.07 0.00PLMI 2.73 ± 0.65 2.79 ± 0.64 0.52REM% 31.87 ± 3.25 25.00 ± 2.78 0.00REM density 26.75 ± 0.74 22.39 ± 1.49 0.00REM latency 44.40 ± 12.40 62.80 ± 5.39 0.00
Statistical significance level was set at a value r0.05, highlysignificant level at a value < 0.01, and very highly significant at avalue < 0.001.PLMI, periodic limb movement index; REM, rapid eye movement; SWS,slow-wave sleep; TCAs, tricyclic antidepressants.
Table 5 Comparing sleep parameters in depressed patients
maintained on SSRIs (group 2) before and after receiving
SSRIs
Sleepparameter
Before(mean ± SD)
After(mean ± SD) P value
Sleep latency 41.67 ± 10.71 27.80 ± 7.38 0.00Sleep efficiency 40.58 ± 7.31 58.49 ± 8.59 0.00Arousal index 17.47 ± 1.79 13.07 ± 2.18 0.00Stage 1 10.18 ± 3.49 8.87 ± 1.94 0.08Stage 2 52.55 ± 3.17 54.11 ± 13.32 0.01Stage 3 3.87 ± 0.96 5.89 ± 1.05 0.00Stage 4 2.76 ± 1.03 5.89 ± 1.05 0.00SWS% 6.63 ± 1.41 11.76 ± 1.26 0.00PLMI 2.29 ± 0.47 2.52 ± 0.50 0.03REM% 30.65 ± 5.25 21.57 ± 2.77 0.00REM density 26.03 ± 1.63 22.11 ± 1.63 0.00REM latency 46.24 ± 13.03 62.40 ± 6.46 0.00
Statistical significance level was set at a value r0.05, highlysignificant level at a value < 0.01, and very highly significant at avalue < 0.001.PLMI, periodic limb movement index; REM, rapid eye movement;SSRIs, selective serotonin reuptake inhibitors; SWS, slow-wave sleep.
Table 2 Comparing sleep parameters of depressed patients
maintained on TCAs (group 1) versus depressed patients
maintained on SSRIs (group 2) at the baseline pretreatment
level
Sleepparameter
TCA group(mean ± SD)
SSRI group(mean ± SD) P value
Sleep latency 42.53 ± 7.74 41.67 ± 10.71 0.774Sleep efficiency 37.35 ± 5.08 40.58 ± 7.31 0.124Arousal index 17.93 ± 1.31 17.47 ± 1.79 0.452Stage 1 8.19 ± 1.2 10.18 ± 3.49 0.12Stage 2 51.41 ± 0.92 19 ± 2.4 0.61Stage 3 6.67 ± 10.07 3.87 ± 0.96 0.14Stage 4 3.77 ± 0.71 2.76 ± 1.03 0.002SWS% 7.87 ± 0.87 6.63 ± 1.41 0.003PLMI 2.73 ± 0.65 2.29 ± 0.47 0.030REM% 31.87 ± 3.25 30.65 ± 5.25 0.388REM density 26.75 ± 0.74 26.03 ± 1.63 0.102REM latency 44.40 ± 12.40 46.24 ± 13.03 0.57
Statistical significance level was set at a value r0.05, highlysignificant level at a value < 0.01, and very highly significant at avalue < 0.001.PLMI, periodic limb movement index; REM, rapid eye movement;SSRIs, selective serotonin reuptake inhibitors; SWS, slow-wave sleep;TCAs, tricyclic antidepressants.
60 Middle East Current Psychiatry

The linkage between sleep disturbance and depression
in a clinical setting has long been recognized; however,
many points are not much discussed. One of these points
is compliance and its relation to sleep improvement by
antidepressant. In our study, 25% of patients (five out of
20) in each group stopped their antidepressant secondary
to intolerable side effects of drugs and/or severe sleep
complaint that needs rapid intervention. This confirmed
the unmet need of considering sleep effect and/or side
effect as a key factor in tailoring antidepressant treatment
in order to decrease the ratio of noncompliance on
antidepressant with a high rate of early dropout in the
course of treatment.
No difference in the dropout ratio in both TCAs and
SSRIs groups was found in this study, which supports the
findings of the meta-analyses carried out on SSRIs versus
TCAs antidepressants that there were no significant
differences in crude indices of compliance between
fluoxetine and dothiepin, despite marked differences
in side effect profile and dose regimen. This could be
explained by the fact that studies that have examined
compliance with antidepressants as a primary objective
have usually been carried out in hospital outpatients,
whereas the majority of prescriptions for antidepressants
are made in primary care. However, most studies
conducted in this setting have been small and almost
all have relied on self-reports of tablet consumption by
patients or on tablet counts by doctors. TCAs prescrip-
tions in primary care are often at subtherapeutic doses,
which will favor their compliance [7,26].
Assessment in this study was conducted 1 month after
antidepressant start, which represented the midpoint in
the duration needed (2–6 weeks) for antidepressant
therapeutic action and was considered as a suitable time
for assessing the drug effects on sleep, apart from either
the effect of pretreatment depressive disorder or post-
treatment recovery. If it was less than 4 weeks, it might
have reflected the sleep disturbance of depression itself
as the antidepressant did not yet exert its effect, and the
symptoms are at their peak. If it was more than 4 weeks,
it may have reflected the sleep improvement as a part of
depression’ remission [24].
SSRIs and TCAs are the antidepressants widely used
in clinical practice [9,27] including ours. SSRIs have
become a first-line treatment of depression over the past
decade [28]. They offer significant advantages compared
with the old compounds including TCAs and monoamine
oxidase inhibitors (MAOI), such as fewer side effects and
nonlethality in overdose [29]. However, some useful
properties of the TCA, such as the promotion of sleep, do
not apply to SSRIs. Indeed, the SSRIs can increase
wakefulness, reduce TST, and sleep efficiency, having
an alerting effect in acute treatment, although sleep
disruption can ease with long-term treatment [30].
Further sleep disruption by antidepressant can lead
either to disaffection with the treatment and early
dropout or poor compliance, negatively affecting the
overall outcome, or it could require additional treatment
with a hypnotic [24].
The main TCA in our sample was amitriptyline (11 out of
15 patients) and the main SSRI was paroxetine (12 out
of 15 patients). This practice appears similar to that of
Netherlands where paroxetine is the most prescribed
antidepressant, followed by amitriptyline, citalopram, and
venlafaxine [24].
In our study, both TCAs and SSRIs were well tolerated
and equally effective in treating depression. Both were
effective in lowering the HAMD score; however, there
was a statistically insignificant bias toward TCAs over
SSRIs, which reached the sufficient response level
defined as at least a 50% reduction in self-reported or
observed symptoms. This difference in potential ther-
apeutic effects of both groups could be explained
by the severity of depression in our patients (all were
moderate or severe scored > 14 on HAMD), and pre-
treatment difference between both groups on sleep
parameters, which reflect to some extent better sleep
quality in the TCA group.
All sleep parameters in our study were improved by both
TCAs and SSRIs, except for sleep microstructure, which
was not affected by both, where shortening of light sleep
(stages 1 and 2) and prolongation of deep sleep (stages 2
and 4 and SWS%) showed either nonsignificant differ-
ence or significant difference but were still below the
normal values. This highlighted an observation that sleep
staging restoration may be a part of the remission or the
recovery of the depression itself and not merely the sleep
effects of antidepressant. This goes with Hicks et al. [25]
who stated that significant drug effects on sleep, such as
TST, sleep efficiency, and wakefulness after sleep onset,
occurred early in treatment but stage 1 sleep and number
of awakenings showed significant treatment effects more
obviously at 8 weeks when the difference between dif-
ferent antidepressants on sleep quality disappeared. In
addition, sleep microstructure may need the neuroadaptive
changes that occur in the brain with prolonged admin-
istration and depression improves [31].
Table 6 Comparing sleep parameters of depressed patients
maintained on TCAs (group 1) versus depressed patients
maintained on SSRIs (group 2) at the post-treatment level
Sleepparameter
After TCAs(mean ± SD)
After SSRIs(mean ± SD) P value
Sleep latency 20.27 ± 4.40 27.80 ± 7.38 0.00Sleep efficiency 69.20 ± 7.43 58.49 ± 8.59 0.00Arousal index 9.92 ± 1.50 13.07 ± 2.18 0.00Stage 1 7.53 ± 1.21 8.87 ± 1.94 0.02Stage 2 52.93 ± 1.03 54.11 ± 13.32 0.00Stage 3 7.09 ± 0.97 5.89 ± 1.05 0.00Stage 4 7.43 ± 1.40 5.89 ± 1.05 0.00SWS% 14.51 ± 2.07 11.76 ± 1.26 0.00PLMI 2.79 ± 0.64 2.52 ± 0.50 0.21REM% 25.00 ± 2.78 21.57 ± 2.77 0.00REM density 22.39 ± 1.49 22.11 ± 1.63 0.62REM latency 62.80 ± 5.39 62.40 ± 6.46 0.86
Statistical significance level was set at a value r0.05, highlysignificant level at a value < 0.01, and very highly significant at avalue < 0.001.PLMI, periodic limb movement index; REM, rapid eye movement;SSRIs, selective serotonin reuptake inhibitors; SWS, slow-wave sleep;TCAs, tricyclic antidepressants.
The effect of commonly used antidepressant Youseff et al. 61

This observation confirmed the explanation postulated by
Wilson et al. [30] who stated a postantidepressant
treatment discrepancy between subjective and objective
sleep findings, where subjective complaints about poor
sleep were decreased when patients improved, in spite of
lack of significant changes in objective measures of sleep
as measured by PSG.
In contrast, nonimprovement of sleep microstructure
found in this study could be considered as residual
symptoms as reported by Nierenberg et al. [32] and
Menza et al. [33], who found 44% of individuals who had
achieved remission of depression, and yet had persistent
sleep abnormalities.
In this study, TCAs were accompanied by more desirable
sleep effects in comparison with SSRIs. All desirable
sleep effects as represented in good sleep efficiency
(decrease sleep latency and arousal index), shortening of
light sleep (decrease in sleep stages 1 and 2), prolonga-
tion of deep sleep (increase in sleep stages 3 and 4, and
SWS%) were more statistically significant in TCAs than
in SSRIs group. This was not expected as our SSRIs group
mainly used paroxetine, which is known as the most
common SSRIs having sedative properties [34].
This weak sedative property of SSRIs in comparison
with TCAs could be explained by the consequence of
increased serotonin function, which leads to sleep
disturbance early in treatment [35] as well as by the
weak anticholinergic effects as reported by Rush et al.[21]. Furthermore, this finding accords Wilson and Nutt
[36] findings of increased sleep disturbance after
paroxetine, and Wilson et al. [30] who stated that TCAs
tend to improve sleep fragmentation acutely, whereas
SSRIs decrease sleep continuity, until there is resolution
because of improvement of the depressive illness.
However, REM suppression as evident only in a decrease
in REM% was more statistically significantly increased
in SSRIs than in TCAs group. This finding egress the
findings of Sharpley et al. [37] who found that REM sleep
suppression remained marked throughout treatment with
paroxetine in comparison with nefazodone, which had a
small nonsignificant promoting effect on REM. There
was no statistically significant difference between the two
drug groups regarding their effect on both REM density
and latency, a finding that contradicts other studies,
which showed early changes of REM sleep latency and
percentage and considered it as predictors of treatment
outcome [38]. This contradiction may be related to the
difference in time of assessment found in-between
studies.
Antidepressants that increase serotonin function by
blocking reuptake or by inhibiting metabolism have
the greatest effect on REM sleep. The decrease in the
amount of REM sleep appears to be greatest early in
treatment, and gradually diminishes during long-term
treatment, except after MAOIs when REM sleep is often
absent for many months [39].
REM suppression occurred with all major antidepressant
drugs, except trimipramine, mirtazapine, and nefazodone
[40]. The MAOIs almost completely suppress REM
sleep, whereas the TCAs and SSRIs have been shown to
produce immediate (40–85%) and sustained (30–50%)
reductions in REM sleep [41]. The clinical efficacy of
antidepressant largely derives from their suppressant
effects on REM sleep [42], Even though REM sleep time
may be decreased, the density of REM periods may
increase during antidepressant therapy [43].
However, REM suppression makes a conflict for the
concept of ideal antidepressant [44] as, despite being
responsible for the clinical efficacy of antidepressant, it
often causes increased fatigue in patients who take large
doses of antidepressants for extended periods of time.
Such fatigue can occasionally interfere with a patient’s
everyday activities [38].
In conclusion, commonly used antidepressants in clinical
practice have a positive effect on objective sleep para-
meters, except for sleep microstructure. TCAs signifi-
cantly improved objective sleep quality away from its
antidepressant therapeutic effect compared with SSRIs.
We hoped this study to be a cornerstone in future serials
concerned with the effect of the new antidepressants on
sleep quality early in the treatment, in order to enhance
compliance with antidepressant, and to provide descrip-
tive guidelines for effective treatment for sleep problems
in depression. Selecting proper antidepressant for depres-
sion with profound sleep problems is an art that needs
future research considering properties of an ideal anti-
depressant regarding its effect on sleep disturbances,
including improving both subjective and objective sleep
complaints, not causing either further sleep disruption
or marked REM suppression, and rapidly improving the
distribution of sleep symptoms of depression.
Limitations of this study include the small number of our
sample, no comparison between subjective and objective
sleep complaints for both groups, the absence of placebo
group (used for comparison), and the nonseparation of the
pretreatment baseline difference from the sleep effects.
There is no conflict of interest to declare.
References1 Benca RM. Mood disorders. In: Kryger MH, Roth T, Dement WC, editors.
Principles and practice of sleep medicine. 4th ed. Philadelphia: Elsevier;2005. pp. 1311–1326.
2 Kaneita Y, Ohida T, Uchiyama M, Takemura S, Kawahara K, Yokoyama E, et al.The relationship between depression and sleep disturbances: a Japanesenationwide general population survey. J Clin Psychiatry 2006; 67:196–203.
3 Ohayon MM, Morselli PL, Guilleminault C. Prevalence of nightmares andtheir relationship to psychopathology and daytime functioning in insomniasubjects. Sleep 1997; 20:340–348.
4 Morselli PL, Elgie R. GAMIAN-Europe/BEAM survey I–global analysis of apatient questionnaire circulated to 3450 members of 12 European advocacygroups operating in the field of mood disorders. Bipolar Disord 2003;5:265–278.
5 Benca RM, Obermeyer WH, Thisted RA, Gillin JC. Sleep and psychiatricdisorders: a meta-analysis. Arch Gen Psychiatry 1992; 49:651–668.[discussion 669–670].
6 Doghramji K. Treatment strategies for sleep disturbance in patients withdepression. J Clin Psychiatry 2003; 64 (Suppl 14):24–29.
7 Thompson C, Peveler RC, Stephenson D, McKendrick J. Compliance withantidepressant medication in the treatment of major depressive disorder in
62 Middle East Current Psychiatry

primary care: a randomized comparison of fluoxetine and a tricyclicantidepressant. Am J Psychiatry 2000; 157:338–343.
8 Kupfer DJ. Depression and associated sleep disturbances: patient benefits withagomelatine. Eur Neuropsychopharmacol 2006; 16 (Suppl 5):S639–S643.
9 Anderson IM. Selective serotonin reuptake inhibitors versus tricyclicantidepressants: a meta-analysis of efficacy and tolerability. J Affect Disord2000; 58:19–36.
10 Machado M, Iskedjian M, Ruiz I, Einarson TR. Remission, dropouts andadverse drug reaction rates in major depressive disorder: a meta-analysis ofhead-to-head trials. Curr Med Res Opin 2006; 22:1825–1837.
11 Littner M, Hirshkowitz M, Kramer M, Kapen S, Anderson WM, Bailey D, et al.Practice parameters for using polysomnography to evaluate insomnia: anupdate. Sleep 2003; 26:754–760.
12 Douglass AB, Bornstein R, Nino Murcia G, Keenan S, Miles L, Zarcone VPJ,et al. The sleep disorders questionnaire. I: creation and multivariate structureof SDQ. Sleep 1994; 17:160–167.
13 Hamilton M. A rating scale for depression. J Neurol Neurosurg Psychiatry1960; 23:56–62.
14 Gibbons RD, Clark DC, Kupfer DJ. Exactly what does the Hamiltondepression rating scale measure? J Psychiatr Res 1993; 27:259–273.
15 Maier W, Heuser I, Philipp M, Frommberger U, Demuth W. Improvingdepression severity assessment—II. Content, concurrent and external validityof three observer depression scales. J Psychiatr Res 1988; 22:13–19.
16 Frank E, Prien RF, Jarrett RB, Keller MB, Kupfer DJ, Lavori PW, et al.Conceptualization and rationale for consensus definitions of terms in majordepressive disorder: remission, recovery, relapse and recurrence. Arch GenPsychiatry 1991; 48:851–855.
17 Bagby RM, Ryder AG, Schuller DR, Marshall MB. The Hamilton depressionrating scale: has the gold standard become a lead weight? Am J Psychiatry2004; 161:2163–2177.
18 Faries D, Herrera J, Rayamajhi J, DeBrota D, Demitrack M, Potter WZ. Theresponsiveness of the Hamilton depression rating scale. J Psychiatr Res2000; 34:3–10.
19 Rechtschaffen A, Kales A. A manual of standard terminology, techniques andscoring system for sleep stages of human subjects. Washington: PublicHealth Service, US Government Printing Office; 1968.
20 Thase ME, Kupfer DJ, Fasiczka AJ, Buysse DJ, Simons AD, Frank E.Identifying an abnormal electroencephalographic sleep profile to characterizemajor depressive disorder. Biol Psychiatry 1997; 41:964–973.
21 Rush AJ, Armitage R, Gillin JC, Yonkers KA, Winokur A, Moldofsky H, et al.Comparative effects of nefazodone and fluoxetine on sleep in outpatientswith major depressive disorder. Biol Psychiatry 1998; 44:3–14.
22 Rechtschaffen A, Bergmann BM, Everson CA, Kushida CA, Gilliland MA.Sleep deprivation in the rat: X. Integration and discussion of the findings.Sleep 2002; 25:68–87.
23 Barbui C, Guaiana G, Hotopf M. Amitriptyline for inpatients and SSRIs foroutpatients with depression? Systematic review and meta-regressionanalysis. Pharmacopsychiatry 2004; 37:93–97.
24 Haygarth L, Cruickshank D. Antidepressants in clinical practice: guidelinesfor safe and effective use of antidepressants in adults and older people inline with National Institute for Health and Clinical Excellance (NICE).Depression: Management of depression in primary and secondarycare.2004. Clinical Guideline 23.
25 Hicks JA, Argyropoulos SV, Rich AS, Nash JR, Bell CJ, Edwards C, et al.Randomised controlled study of sleep after nefazodone or paroxetine treatmentin out-patients with depression. Br J Psychiatry 2002; 180:528–535.
26 Maddox JC, Levi M, Thompson C. The compliance with antidepressants ingeneral practice. J Psychopharmacol 1994; 8:48–53.
27 Petersen T, Dording C, Neault NB, Kornbluh R, Alpert JE, Nierenberg AA,et al. A survey of prescribing practices in the treatment of depression. ProgNeuropsychopharmacol Biol Psychiatry 2002; 26:177–187.
28 MacGillivray S, Arroll B, Hatcher S, Ogston S, Reid I, Sullivan F, et al. Efficacyand tolerability of selective serotonin reuptake inhibitors compared withtricyclic antidepressants in depression treated in primary care: systematicreview and meta-analysis. BMJ 2003; 326:1014.
29 Parker G, Roy K, Wilhelm K, Mitchell P. Assessing the comparativeeffectiveness of antidepressant therapies: a prospective clinical practicestudy. J Clin Psychiatry 2001; 62:117–125.
30 Wilson SJ, Bell C, Coupland NJ, Nutt DJ. Sleep changes during long-termtreatment of depression with fluvoxamine–a home-based study.Psychopharmacology (Berl) 2000; 149:360–365.
31 Hollon SD, Thase ME, Markowitz JC. Treatment and prevention ofdepression. Psychol Sci Publ Interest 2002; 3:39–77.
32 Nierenberg AA, Keefe BR, Leslie VC, Alpert JE, Pava JA, Worthington JJ III,et al. Residual symptoms in depressed patients who respond acutely tofluoxetine. J Clin Psychiatry 1999; 60:221–225.
33 Menza M, Marin H, Opper RS. Residual symptoms in depression: cantreatment be symptom-specific? J Clin Psychiatry 2003; 64:516–523.
34 Kerr JS, Fairweather DB, Hindmarch I. The effect of paroxetine and dothiepinon subjective sleep in depressed patients. Hum Psychopharmacol 1997;12:71–73.
35 Mouret J, Lemoine P, Minuit MP, Benkelfat C, Renardet M. Effects oftrazodone on the sleep of depressed subjects–a polygraphic study.Psychopharmacology (Berl) 1988; 95 (Suppl):S37–S43.
36 Wilson S, Nutt D. Management of insomnia: treatments and mechanisms. BrJ Psychiatry 2007; 191:195–197.
37 Sharpley AL, Williamson DJ, Attenburrow ME, Pearson G, Sargent P,Cowen PJ. The effects of paroxetine and nefazodone on sleep: a placebocontrolled trial. Psychopharmacology (Berl) 1996; 126:50–54.
38 Murck H, Nickel T, Kunzel H, Antonijevic IA, Schill J, Zobel A, et al. Statemarkers of depression in sleep EEG: dependency on drug and gender inpatients treated with tianeptine or paroxetine. Neuropsychopharmacology2003; 28:348–358.
39 Wilson S, Argyropoulos S. Antidepressants and sleep: a qualitative review ofthe literature. Drugs 2005; 65:927–947.
40 Kirsch I, Moore TJ, Scoboria A, Nicholls SS. The emperor’s new drugs: ananalysis of antidepressant medication data submitted to the US food anddrug administration. Prev Treat 2002; 5:243–253. Art. No. 23.
41 Vertes RP, Eastman KE. The case against memory consolidation in REMsleep. Behav Brain Sci 2000; 23:867–876. [discussion 904–1121].
42 Thompson C. Amitriptyline: still efficacious, but at what cost? Br J Psychiatry2001; 178:99–100.
43 Vogel GW, Buffenstein A, Minter K, Hennessey A. Drug effects on REMsleep and on endogenous depression. Neurosci Biobehav Rev 1990;14:49–63.
44 Ferrier IN. Characterizing the ideal antidepressant therapy to achieveremission. J Clin Psychiatry 2001; 62 (Suppl 26):10–15.
The effect of commonly used antidepressant Youseff et al. 63

64 Middle East Current Psychiatry

Burden of care on female caregivers and its relation to
psychiatric morbidityMohammed Elmahdi, Foad Kamel, Ali Esmael, Mohammed Lotfi,Ahmad Kamel and Ayman Elhosini
Department of Psychiatry, Faculty of Medicine,Al Azhar University, Cairo, Egypt
Correspondence to Mohammed Elmahdi, Departmentof Psychiatry, Faculty of Medicine, Al-Azhar University,Cairo, EgyptTel: + 20122886537/20502250666;fax: + 20502529697;e-mail: [email protected]
Received 12 November 2010Accepted 18 December 2010
Middle East Current Psychiatry 2011, 18:65–71
Background
Recently, there have been increasing numbers of caregivers who provide care to their
chronically ill family members. Care can represent a heavy burden and may put
caregivers, who are mostly women (mother or wife), under a high level of stress.
Culturally, such caregivers are expected to cope and not to complain.
Aim
To evaluate and compare the burden (objective and subjective) on female caregivers
(mother or wife) who provide full-time care to family members who are suffering from
either psychiatric or physical disorder.
Materials and methods
This study included 300 female caregivers (wife or mother) with 150 caring for
patients suffering from a psychiatric illness and 150 looking after individuals suffering
from a chronic physical illness. No male caregivers were included as culturally men are
expected to be the breadwinners and if they have to provide care, this is likely to be as
part time as most of their time would be dedicated for working outside home. This
could provide men with an alternative time for ventilation or an outlet, which may bias
the study results. Samples for the study were taken from the attendees of the
outpatient clinics, University Hospital, Al-Azhar Faculty of Medicine, New Damietta, in
the period 1 June 2007 to 31 May 2008. An approval was obtained from the ethics
and scientific committee and informed consent was obtained from the individuals. All
caregivers were assessed as follows: the Semistructured Clinical Interview using the
diagnostic criteria of the Diagnostic and Statistical manual IV Text Revised (American
Psychiatric Association), the Caregiver Strain Index, and Zarit Burden Interview (all
these were translated, validated, culturally compatible, and doctor rated).
Results
The total sample included 300 female caregivers divided into two groups: the first
group included 150 care providers of patients with psychiatric disorders, including
121 (80.7%) mothers and 29 (19.3%) wives, whereas the second group consisted of
150 female caregivers of individuals with chronic physical illness individuals, including
19 (12.7%) mothers and 131 (87.3%) wives. There was a significant difference
between both groups with regard to distribution of nature of the relationship of female
caregivers with the care recipients (mother or wife), their age, residence, and
educational level. No significant difference regarding their job (the majority in both
groups were unemployed) was observed. The objective burden was the highest in
cases of poststroke disabilities, schizophrenia, chronic renal failure, chronic liver cell
failure, and in those with bipolar disorder ( < 0.001). Similar distribution was observed
in the subjective burden ( < 0.001). Caregivers suffered major depression in 102
cases (34.0%) and generalized anxiety disorders in 67 cases (22.3%). There was a
statistically significant difference between mothers and wives regarding subjective
burden and distribution of psychiatric disorders.
Conclusion
The study results may indicate that the burden (objective and subjective) of caregivers
and the prevalence of psychiatric disorders in caregivers depend on the impact of the
disease on the functional level of the patient. The level of subjective burden and
prevalence of psychiatric disorders are higher in wives compared with mothers, which
may be attributed to the difference in their appreciation of the caregiving situation and
in their appreciation of their responsibility toward the individual needing care.
Keywords:
burden, caregivers, psychiatric morbidity
Middle East Curr Psychiatry 18:65–71�c 2011 Okasha Institute of Psychiatry, Faculty of Medicine, Ain Shams University2090-5408
Original article 65
2090-5408 �c 2011 Okasha Institute of Psychiatry, Faculty of Medicine, Ain Shams University DOI: 10.1097/01.XME.0000395557.32827.b4

IntroductionProviding care for a family member with mental illness
is an overwhelming experience for the caregiver. On
average, 250 000 patients with chronic mental illness dis-
charge to the care of their families annually in USA [1].
Providing care for a patient with mental illness can be
debilitating, stressful, and burdensome for the caregiver.
In contrast, providing care to chronically ill or incapacitated
family members may have an impact on family caregivers,
such as increased self-respect or self-satisfaction from
fulfilling a responsibility [2].
Previous studies have showed that caregivers have poor
physical health and frequently experience social, emo-
tional, and financial losses [3,4]. Interestingly, caregivers’
stress and support are an integral element of an individual
patient’s assessment in most of the developed countries,
for example, the UK [5].
Caregiver burden is defined as persistent hardship, stress,
or negative experiences resulting from the provision of
care by caregivers [6]. Caregiver burden is strongly re-
lated to sleep disturbances [7] and depressive symptoms
[8]. It was reported that caregiver burden is negatively
related to health-related quality of life, particularly
mental health [9].
Researchers advanced the definition of burden when they
distinguished between objective and subjective factors.
Objective burden consisted of the concrete factors seen
to disrupt family life and is subdivided according to
specific effects on the family household, the health of
other family members, family routine, and in particular,
abnormal behavior likely to cause distress. Subjective
burden refers to the subjective experience or psycholo-
gical or emotional impact (i.e. feeling worried or strained)
of caring for someone with a mental illness [10].
Living with the patient, patient behavior, demographic
characteristics, and socioeconomic status have all been
associated with different levels of burden [11]. One study
found that caregivers of patients with dementia appeared
more vulnerable to depression as a consequence of their
experience [12]. White et al. [13] found that caregivers of
people who had suffered a stroke had lower mental
health-related quality of life compared with their
counterparts who were not caregivers. Another study
used the same questionnaire (SF-36) to measure care-
givers’ health-related quality of life and found that care-
givers of people with cerebrovascular disease or diabetes
had significantly negative mental health-related quality of
life [14].
The physical consequences of caregiving have received
less attention than psychiatric outcomes. One study
indicated that caregivers often experience several physi-
cal problems, including back injuries, arthritis, high blood
pressure, gastric ulcers, and headaches [15].
The aim of this study was to evaluate and compare the
burden (objective and subjective) on female caregivers
(mother or wife) who provide full-time care to family
members who are suffering from either psychiatric or
physical disorders.
Patients and methodsThis descriptive study included 300 women (either wife
or mother, caring for patients with psychiatric disorders or
patients with chronic physical illness), selected from the
outpatient clinics of psychiatry and other specialties
(University Hospital, Al-Azhar Faculty of Medicine; New
Damietta) in the period 1 June 2007 to the end of March
2008.
Patients were classified into two groups. The first group
included 150 women who are caring for patients with
psychiatric disorders of at least 2 years or more and not
suffering a chronic mental illness. Psychiatric disorders
included schizophrenia, substance dependence, bipolar
disorder, and attention-deficit hyperactivity disorder
(ADHD). Patients with comorbid chronic physical
disorders were excluded. The second group included
150 women who are caring for patients with chronic
physical disorders of at least 2 years duration or more.
Physical disorders included hepatic failure, renal failure,
disabilities because of cerebrovascular strokes, and other
neurological disorders. Any physically ill patient who has
comorbid chronic psychiatric disorder was excluded.
The duration of illness for selected patients was two years
or more for both groups depends on the results of Pim
and Heleen [16] study, which indicated that the burden
is more manifest after 2 years duration of illness.
In this study, psychiatric disorders include schizophrenia,
bipolar disorder, substance dependence, and ADHD. In
contrast, the chronic physical diseases include renal or
hepatic failure and cerebrovascular stroke. Each subgroup
of disorder was composed of at least 30 patients.
All included women were subjected to the following:
Semistructured Clinical Interview using the diagnostic
criteria of the DSM IV TR, Caregiver Strain Index [17],
and Zarit Burden Interview [18]. These instruments
were translated into Arabic language by translators who
are not psychologists or psychiatrists and then retrans-
lated into English. Face validity was judged by two
Professors of Psychiatry (Al-Azhar University) who correc-
ted some words and phrases. Reliability of the translated
instruments was tested through application on 30 cases
and then reapplication 2 weeks later and was found to be
0.97 for the Zarit Burden Interview and 0.87 for the
Caregiver Strain Index. The scores of Zarit Burden Inter-
view vary from 0 to 88, and the higher scores indicate
higher burden. The Caregiver Strain Index is composed
of 13 questions and positive responses for seven
questions or more indicate a high level of burden.
Statistical analysis of data
The collected data were organized, tabulated, and
statistically analyzed using the statistical package for
social science (SPSS), version 13 (SPSS Inc., Chicago,
Illinois, USA). For qualitative data, the number and
66 Middle East Current Psychiatry

percentage distribution were calculated, and w2 was used
for comparison between groups; and for quantitative data,
the mean and standard deviation were calculated and for
comparison between two means the Student’s t-test was
used. Tests were considered statistically significant when
P value was less than or equal to 0.05.
ResultsIn this study, the caregivers of patients with psychiatric
disorders were 150 women, 121 of them (80.7%) were
mothers and 29 (19.3%) were wives. In contrast, the
caregivers of nonpsychiatric patients were 150 women, 19
of them (12.7%) were mothers and 131 (87.3%) were
wives. The mean age of women in group 1 (psychiatric)
was 37.20 ± 10.17 years, whereas the mean age in group 2
was 47.36 ± 6.91 years. Fifty-two percent of women in
group 1 lived in rural area compared with 65.3% who lived
in rural area in group 2. In addition, the majority of
women caring for patients with nonpsychiatric disorders
were illiterate (66.7%) compared with 15.3% women
caring for patients with psychiatric disorders, and there
was a significant difference between both groups with
regard to distribution of women (mother or wife), their
age, residence, and educational level, whereas no
significant difference with regard to their job (the
majority in both groups were housewives) was observed
(Table 1).
In this study, there was a statistically significant increase
in objective burden in group 2 (caring for nonpsychiatric
patient; 146 cases had high objective burden) in compari-
son with group 1 (89 cases had high burden). Similarly,
the subjective burden was statically high in women caring
for nonpsychiatric disorders in comparison with those
caring for psychiatric disorders (Table 2).
In this study, the objective burden was high in cases with
poststroke disabilities, schizophrenia, chronic renal fail-
ure, chronic liver cell failure, and in those with bipolar
disorder (Table 3). Similar distribution was observed in
the subjective burden (Table 4).
With regard to psychiatric disorders in caregivers, major
depression was observed in 102 cases (34.0%), adjust-
ment disorder with depressed mood in 32 cases (10.7%),
adjustment disorder with anxious mood in 34 women
(11.3%), adjustment disorder with mixed depressive and
anxious mood in 15 women (5.0%), mixed anxiety and
depression in 31 cases (10.3%), generalized anxiety
disorders in 67 cases (22.3%), and no psychiatric disorders
in 19 cases (6.3%). There was statistically significant
difference between mothers and wives with regard to
distribution of psychiatric disorders (Table 5).
DiscussionIn this study, there is a significant statistical difference
between the number of mothers and wives in the two
groups (P < 0.001). The number of mothers in the first
group was 121 (80.7%), whereas the number of wives in
the same group was 29 (19.3%). These results are in
accordance with other studies, for example, Pim and
Heleen [16] who found that more than 50% of cases were
mothers and only 25% were wives who are caring for
patients with psychiatric disorders. In addition, Lakishika
et al. [19] reported that 70% were mothers and only 5%
were wives, whereas in the study of Eija et al. [20],
mothers as caregivers were 49% and wives as caregivers
were 15%. These differences could be explained by the
fact that psychotic disorders (schizophrenia and bipolar)
included in this study start at a younger age, drug abuse
usually starts in adolescence, and ADHD in childhood,
and thus, the original family (mothers) cares for their
children.
In the second group, the number of wives caring for
patients with nonpsychiatric disease (e.g. chronic kidney
or liver failure) was 131 (87.3%) compared with 19
(12.7%) mothers, and these results are in agreement
with the study of Lois [21] where most of the caregivers
Table 1 Characteristics of caregivers
ParameterGroup 1
(psychiatric)Group 2(physical) P value
Who (N, %)Mother 121 (80.7%) 19 (12.7%) < 0.001(S)Wife 29 (19.3%) 131 (87.3%)
Age(mean ± SD)
37.20 ± 10.17 47.36 ± 6.91 < 0.001(S)
ResidenceRural 79 (52.7%) 98 (65.3%) 0.026 (S)Urban 71 (47.3%) 52 (34.7%)
Educational levelIlliterate 23 (15.3%) 100 (66.7%) < 0.001(S)Middle 75 (50.0%) 36 (24.0%)Higher 52 (34.7%) 14 (9.3%)
JobEmployee 25 (16.7%) 17 (11.3%) 0.18 (NS)Housewife 125 (83.3%) 133 (88.7%)
NS, not significant.
Table 2 The objective and subjective burden exerted on
caregivers
Group 1 (psychiatric) Group 2 (physical) P value
Objective burden (N, %)Low 61 (41) 4 (0.03) < 0.001(S)High 89 (59) 146 (0.97)
Subjective burden (N, %)No or mild 16 (10.7) 0 (0.0) < 0.001(S)Moderate 47 (31.3) 18 (12.0)Severe 56 (37.3) 71 (47.3)Extreme 31 (20.7) 61 (40.7)
S, significant.
Table 3 Objective burden according to the type of disorder
Low (%) High (%) P value
Schizophrenia 0 (0.0) 38 (100.0) < 0.001(S)Bipolar disorder 11 (28.9) 27 (71.1)ADHD 22 (59.5) 15 (40.5)Drug abuse 28 (75.7) 9 (24.3)Chronic liver cell failure 2 (4.0) 48 (96)Chronic renal failure 2 (4.0) 48 (96.0)Poststroke disabilities 0 (0.0) 50 (100.0)
ADHD, attention-deficit hyperactivity disorder.
Burden of care on female caregivers Elmahdi et al. 67

were wives. These findings may be explained by the fact
that these chronic diseases are most prominent in old age;
thus, wives care for their husbands.
In this study, results show that the mean age of the
caregivers in the first group (37.20 years) is significantly
lesser than the mean age of the caregivers in the second
group (47.36 years; P < 0.001), and this is attributed
mainly to the younger age where psychotic disorders start
to represent itself. These ages are slightly younger than
those reported in the studies of Pim and Heleen [16] and
Lakshika et al. [19] where it was 49.6 and 49.04 years,
respectively, and this may be explained by the fact that
these studies were carried out on caregivers for schizo-
phrenia, bipolar disorders, and depression only, but this
study included caregivers for ADHD who are cared for by
younger mothers.
In addition, the mean age of mothers caring for patients
with nonpsychiatric disorders was in agreement with that
reported by Lois [21] where it was 48 years.
With regard to residency, there is no statistical difference
between mothers and wives, whereas there is significant
statistical difference between the caregivers in the two
groups, as most of the caregivers in the psychiatric
patients’ group (52.7%) were living in urban areas,
whereas most of the caregivers in the nonpsychiatric
patients’ group (65.3%) were living in rural areas.
These findings could be explained by the fact that
nonpsychiatric disorders were prevalent in rural areas. In
addition, the inhabitants of urban areas were more
oriented by psychiatric disorders and asked for treatment,
whereas the culture of rural inhabitants prevents them
from asking treatment for their psychological suffering, or
denies the disease at all [22].
With regard to the level of education, there is no
significant statistical difference between mothers and
wives as most of them are illiterate or have middle level
education. However, there is a significant statistical
difference between the caregivers in the psychiatric and
nonpsychiatric patients’ groups, as the percentage of
illiterates in the caregivers of the nonpsychiatric patients’
group is 66.7%, whereas the percentage of illiterates in
the caregivers of the psychiatric patients’ groups is 15.3%.
This may be explained by the increased prevalence of
illiteracy in rural areas in comparison with urban areas.
In this study, there is no significant statistical difference
between the caregivers in the study groups regarding
occupation as most of the caregivers are housewives.
These results are in contradiction to other studies that
found that caregivers were working full time [23–25]. In
contrast, these results are in agreement with Egyptian
studies, for example, Abou El Magd et al. [26] who
reported that 60% of caregivers for substance abusers
were housewives. These results could be explained by
the fact that the society in Damietta Governorate tends
to keep women at home.
With regard to objective burden, there is no significant
statistical difference in the level of the objective burden
between mothers and wives, whereas the level of objective
burden in the caregivers of patients with nonpsychiatric
disorders is significantly higher when compared with the
level of objective burden in the caregivers of patients with
psychiatric disorders. However, when we study the level of
objective burden in the caregivers for patients with each
disease individually, we find that the level of objective
burden does not depend on whether the disease is
psychiatric or nonpsychiatric, but it depends on the level
of disability caused by the care recepient’s disease, where
there is a high level of objective burden in all caregivers of
patients with schizophrenia and patients with poststroke
disabilities and most caregivers of patients with chronic
liver disease, chronic renal disease, and patients with
bipolar mood disorder, and the level of objective burden
was low in most caregivers of children with ADHD and
substance abuse patients.
Table 4 Subjective burden according to the type of disorder
No or mild (%) Moderate (%) Severe (%) Extreme (%) P value
Schizophrenia 0 (0.0) 2 (5.3) 9 (23.6) 27 (71.1) < 0.001(S)Bipolar disorder 1 (2.6) 12 (31.6) 22 (57.8) 3 (7.8)ADHD 14 (37.8) 12 (32.4) 11 (29.7) 0 (0.0)Drug abuse 1 (2.7) 21 (56.7) 14 (37.8) 1(2.7)Chronic liver cell failure 0 (0.0) 9 (18.0) 25 (50.0) 16 (32.0)Chronic renal failure 0 (0.0) 6 (12.0) 22 (44.0) 22 (44.0)Poststroke disabilities 0 (0.0) 3 (6.0) 24 (48.0) 23 (46.0)
ADHD, attention-deficit hyperactivity disorder.
Table 5 Psychiatric disorders in caregivers (mother and wife)
Mother (%) Wife (%) Total (%) P value
Major depression 33 (23.6) 69 (43.1) 102 (34.0) < 0.001(S)Adjustment disorder with depressed mood 20 (14.3) 12 (7.5) 32 (10.7)Adjustment disorder with anxious mood 20 (14.3) 14 (8.8) 34 (11.3)Adjustment disorder with mixed anxious and depressed mood 12 (8.6) 3 (1.9) 15 (5.0)
Mixed anxiety and depression 13 (9.3) 18 (11.3) 31 (10.3)Generalized anxiety disorder 26 (18.6) 41 (25.6) 67 (22.3)No psychic disorder 16 (11.4) 3 (1.9) 19 (6.3)
68 Middle East Current Psychiatry
The poststroke disabilities interfere with the patients’
ability to walk and care for themselves, and these facts are
true for patients with chronic liver cell failure and chronic
renal failure as they lead to several disabilities that
represent a major burden on the caregiver; besides, these
diseases have poor prognosis and continuously deterio-
rate, and the patients’ need for caregiving increases day
by day [27].
In contrast, the bipolar disorder is accompanied by free
periods where the patient can care for his or her self, thus
leading to a decrease of the burden of caregiving [16]. These
facts are also true for ADHD as it needs slight adaptation
and the nature of the Damietta governorate provides the
child with a wide place to play and thus the burden on the
family is less in comparison with other diseases.
In this study, the level of subjective burden was
significantly higher in the wives when compared with
the mothers. In addition, the level of subjective burden
was significantly higher in the caregivers of patients with
nonpsychiatric disorders when compared with the care-
givers of patients with psychiatric disorders. But as in
objective burden, the level of subjective burden does not
depend on whether the disease of the care recipient is
psychiatric or nonpsychiatric because when we study the
subjective burden caused by each disease separately we
find that the subjective burden was significantly high in
the caregivers for patients with schizophrenia than the
caregivers of patients with poststroke disabilities, and it
was significantly low in the caregivers of children with
ADHD and substance abuse patients.
In fact, no sufficient studies were found comparing wives
with mothers as caregivers, but Lois [21] reported that the
relation between the subjective burden and the degree of
relativity is unclear. Some studies reported that the level of
subjective burden is higher in wives in comparison with
any other relative [28,16]. Other studies have not found
any difference in the level of subjective burden between
wives and other female caregivers [29], whereas other
studies found that the levels of subjective burden were
higher in other women compared with wives [30].
The increased level of subjective burden in wives in
comparison with mothers may be explained by the
difference between both wives and mothers in their
understanding of caregiving; for example, Kurz and
Cavanaugh [31] reported that the fundamental characters
of a marriage relationship are that it is optional and it can
be ended at any time, whereas the relation between the
mother and her child is more powerful. In addition, it is
noted that the majority of wives in this study care for
patients with chronic nonpsychological disorders that
need higher level of caring and that affects the husband’s
sexual power, thus, increasing the burden on wives [27].
The results of this study showed that there is a signi-
ficant statistical difference between mothers and wives
with regard to the prevalence of psychiatric disorders,
which are more prevalent in the wives compared with
mothers, especially major depressive disorder, generalized
anxiety disorder, and mixed anxiety and depression,
whereas adjustment disorders are more prevalent in the
mothers compared with wives. The results also showed
that there is a significant statistical difference between
caregivers of patients with psychiatric and nonpsychiatric
disorders with regard to the prevalence of psychiatric
disorders, which are more prevalent in the caregivers of
patients with nonpsychiatric disorders compared with
caregivers of patients with psychiatric disorders. However,
when we study the prevalence of psychiatric disorders in
the caregivers for patients with each disease, we find that
the prevalence of psychiatric disorders does not depend on
whether the disease is psychiatric or nonpsychiatric but it
depends on the nature of the disease of the care recipient
and its impact on the functional level of the patient, as the
depressive disorders were more prevalent in the caregivers
of patients with schizophrenia and patients with poststroke
disabilities. However, anxiety disorders are more prevalent
in the caregivers of substance abuse patients, and
psychiatric disorders are less prevalent in the caregivers
of children with ADHD.
These results are compared with that of Beason et al. [32]
and Berg et al. [33] who reported that depression is more
prevalent in wives caring for their husband in comparison
with other relatives (sons).
The increased prevalence of psychiatric disorders in
wives can be explained by the increased subjective
burden in wives in comparison with mothers. Previous
studies showed that the relation between subjective
burden and the prevalence of psychiatric disorders is
proportional [34,35]. In addition, wives are younger than
mothers, and some studies found that depression is less
in older caregivers in comparison with younger caregivers
[33,36]. Increased prevalence of psychiatric disorders in
caregivers of nonpsychiatric disorders in this study is in
agreement with Dennis et al. [37] and with Kotila et al.[38] who reported that the degree of depression in
caregivers of patients with poststroke disabilities in-
creased significantly with the degree of disability.
ConclusionThe study results may indicate that caregiver burden
(objective and subjective) and prevalence of psychiatric
disorders in caregivers do not seem to depend on whether
the disease of the care recipient is psychiatric or physical,
but seem to depend on the impact of the disease on the
functional level of the patient. No difference exists
between mothers and wives in the level of objective
burden, which does not depend on the relation between
the caregiver and the care recipient; however, the level
of subjective burden and prevalence of psychiatric dis-
orders are higher in wives compared with mothers, which
could be attributed to the difference in their view and
appreciation of the caregiving situation.
Limitations of the study
(1) There was a significant difference between both groups
1 and 2 with regard to age and relation to the patient,
which may cause bias for the study, but this factor
Burden of care on female caregivers Elmahdi et al. 69

could not be avoided because of the uneven distribu-
tion of mothers and wives as caregivers in both groups.
(2) Age of the patients, level of education, residence
(rural or urban), and occupation were not considered
as factors, which could affect the burden level.
There is no conflict of interest to declare.
References1 Goldman HH. Mental illness and family burden: a public health perspective.
Hosp Community Psychiatry 1982; 33:557–560.
2 Kuuppelomaki M, Sasaki A, Yamada K, Asakawa N, Shimanouchi S. Familycarers for older relatives: sources of satisfaction and related factors inFinland. Int J Nurs Stud 2004; 41:497–505.
3 Wallsten SS. Effects of caregiving, gender and race on the health, mutualityand social supports of older couples. J Aging Health 2000; 12:90–111.
4 Bullock R. The needs of the caregiver in the long-term treatment of Alzheimerdisease. Alzheimer Dis Assoc Disord 2004; 18 (Suppl 1):S17–S23.
5 Oyebode J. Assessment of carers’ psychological needs. Adv Psychiatr Treat2003; 9:45–53.
6 DiBartolo MC. Caregiver burden. Instruments, challenges and nursingimplications for individuals with Alzheimer’s disease and their caregivers.J Gerontol Nurs 2000; 26:46–53.
7 Happe S, Berger K. The association between caregiver burden and sleepdisturbances in partners of patients with Parkinson’s disease. Age Ageing2002; 31:349–354.
8 Song LY, Biegel DE, Milligan SE. Predictors of depressive symptomatologyamong lower social class caregivers of persons with chronic mental illness.Community Ment Health J 1997; 33:269–286.
9 Morimoto T, Schreiner AS, Asano H. Caregiver burden and health-relatedquality of life among Japanese stroke caregivers. Age Ageing 2003; 32:218–223.
10 Hoenig J, Hamilton MW. The schizophrenic patient in the community and hiseffect on the household. Int J Soc Psychiatry 1966; 12:165–176.
11 Jones SL, Roth D, Jones PK. Effect of demographic and behavioral variableson burden of caregivers of chronic mentally ill persons. Psychiatr Serv 1995;46:141–145.
12 Waite A, Bebbington P, Skelton Robinson M, Orrell M. Social factors anddepression in carers of people with dementia. Int J Geriatr Psychiatry 2004;19:582–587.
13 White CL, Mayo N, Hanley JA, Wood Dauphinee S. Evolution of thecaregiving experience in the initial 2 years following stroke. Res Nurs Health2003; 26:177–189.
14 Li T, Lee Y, Lin C, Amidon RL. Quality of life of primary caregivers of elderlywith cerebrovascular disease or diabetes hospitalized for acute care:assessment of well-being and functioning using the SF-36 HealthQuestionnaire. Quality Life Res 2004; 13:1081–1088.
15 Sawatzky JE, Fowler Kerry S. Impact of caregiving: listening to the voice ofinformal caregivers. J Psychiatr Ment Health Nurs 2003; 10:277–286.
16 Cuijpers P, Stam H. Burnout among relatives of psychiatric patients attendingpsychoeducational support groups. Psychiatr Serv 2000; 51:375–379.
17 Gerritsen JC, Van der Ende PC. The development of a care-giving burdenscale. Age Ageing 1994; 23:483–491.
18 Zarit SH, Zarit KE. The memory and behavior problems checklist–1987R.University Park, PA: Pennsylvania State University; 1987.
19 Tennakoon L, Fannon D, Doku V, O’Ceallaigh S, Soni W, Santamaria M, et al.Experience of caregiving: relatives of people experiencing a first episode ofpsychosis. Br J Psychiatry 2000; 177:529–533.
20 Stengard E, Honkonen T, Koivisto AM, Salokangas RK. Satisfaction of caregiversof patients with schizophrenia in Finland. Psychiatr Serv 2000; 51:1034–1039.
21 Lois VB. Depression, anxiety, hazardous drinking, subjective burden andrewards in family caregivers of patients with chronic liver disease. Memphis:University of Tennessee; 2006.
22 Okasha A, Kamel M, Hassan AH. Preliminary psychiatric observations inEgypt. Br J Psychiatry 1968; 114:949–955.
23 Belasco AG, Sesso R. Burden and quality of life of caregivers forhemodialysis patients. Am J Kidney Dis 2002; 39:805–812.
24 Croog SH, Burleson JA, Sudilovsky A, Baume RM. Spouse caregivers ofAlzheimer patients: problem responses to caregiver burden. Aging MentHealth 2006; 10:87–100.
25 Harris TT, Thomas CM, Wicks MN, Faulkner MS, Hathaway DK. Subjectiveburden in young and older African-American caregivers of patients with endstage renal disease awaiting transplant. Nephrol Nurs J 2000; 27:383–391.355; [discussion 392, 405].
26 Abou El Magd S, Erfan SM, Abdel Wahhab M, Abdel Gawwad TM. Role ofthe spouse in addiction. Egypt J Psychiatry 2004; 23:95–101.
27 Heidelbaugh JJ, Bruderly M. Cirrhosis and chronic liver failure: Part I.Diagnosis and evaluation. Am Fam Physician 2006; 74:756–762.
28 McCullagh E, Brigstocke G, Donaldson N, Kalra L. Determinants ofcaregiving burden and quality of life in caregivers of stroke patients. Stroke2005; 36:2181–2186.
29 Seltzer MM, Li LW. The transitions of caregiving: subjective and objectivedefinitions. Gerontologist 1996; 36:614–626.
30 Given CW, Given B, Stommel M, Collins C, King S, Franklin S. The CaregiverReaction Assessment (CRA) for caregivers to persons with chronic physicaland mental impairments. Res Nurs Health 1992; 15:271–283.
31 McCausland Kurz J, Cavanaugh JC. A qualitative study of stress and copingstrategies used by well spouses of lung transplant candidates. Fam SystHealth 2001; 19:181–197.
32 Beeson R, Horton Deutsch S, Farran C, Neundorfer M. Loneliness anddepression in caregivers of persons with Alzheimer’s disease or relateddisorders. Issues Ment Health Nurs 2000; 21:779–806.
33 Berg A, Palomaki H, Lonnqvist J, Lehtihalmes M, Kaste M. Depression amongcaregivers of stroke survivors. Stroke 2005; 36:639–643.
34 Given B, Wyatt G, Given C, Sherwood P, Gift A, DeVoss D, et al. Burden anddepression among caregivers of patients with cancer at the end of life. OncolNurs Forum 2004; 31:1105–1117.
35 Haley WE, LaMonde LA, Han B, Burton AM, Schonwetter R. Predictors ofdepression and life satisfaction among spousal caregivers in hospice:application of a stress process model. J Palliat Med 2003; 6:215–224.
36 Polen MR, Green CA. Caregiving, alcohol use and mental health symptomsamong HMO members. J Community Health 2001; 26:285–301.
37 Dennis M, O’Rourke S, Lewis S, Sharpe M, Warlow C. A quantitative study ofthe emotional outcome of people caring for stroke survivors. Stroke 1998;29:1867–1872.
38 Kotila M, Numminen H, Waltimo O, Kaste M. Depression after stroke: resultsof the FINNSTROKE Study. Stroke 1998; 29:368–372.
70 Middle East Current Psychiatry

Burden of care on female caregivers Elmahdi et al. 71
Coping with stress and quality of life among patients with
schizophrenia in Egypt and Saudi Arabia: effect of
sociodemographic factorsEman Elsheshtawya and Warda Abo Elezb
aBaljurashi Psychiatric Hospital, Al Baha Region,Saudi Arabia and bDepartment of Psychiatry, Faculty ofMedicine, Mansoura University Hospitals, Egypt
Correspondence to Eman Elsheshtawy,Department of Psychiatry, Faculty of Medicine,Mansoura University Hospital, Mansoura, EgyptTel: + 0187455403; fax: + 26824738;e-mail: [email protected]
Received 7 December 2010Accepted 5 January 2011
Middle East Current Psychiatry 2011, 18:72–77
Introduction
In Arab countries, epidemiological data about the ways of coping with general day
stresses in schizophrenic patients and their quality of life are scarce. This study sought
to determine whether there was a difference in ways of coping with stress and quality
of life of schizophrenic patients attending the Baljurashi Psychiatric Hospital, AlBaha
region, Saudi Arabia compared with schizophrenic patients at the Mansoura University
Hospital, Egypt.
Materials and methods
A sample of 140 schizophrenic patients in Saudi Arabia and 140 schizophrenic
patients in Egypt was enrolled. Data on sociodemographical and clinical variables
were recorded. The following scales were utilized: Scale for Assessment of Positive
Symptoms, Scale for Assessment of Negative Symptoms, Brief COPE Scale, and Self
Report Quality of Life for Schizophrenia (SQLS).
Results
Saudi patients used less number of coping skills than Egyptian patients and were
higher on self-distraction and acceptance; they were better on most items of SQLS.
The duration of illness correlated positively with affection of motivation and energy
subscale of SQLS in Egyptian patients (r = 0.259, P = 0.002), whereas in Saudi
patients it showed no correlation.
Conclusion
Social factors are the most important determinants of quality of life rather than the
symptoms. Long duration of illness has a negative influence on motivation and energy
among Egyptian schizophrenic patients.
Keywords:
Arab, coping with stress, quality of life, schizophrenia
Middle East Curr Psychiatry 18:72–77�c 2011 Okasha Institute of Psychiatry, Faculty of Medicine, Ain Shams University2090-5408
Introduction
Globally, the incidence of schizophrenia is 1% of the
population [1,2]. Schizophrenia is a chronic disorder with a
heterogeneous presentation, which is marked by an array of
symptomatology, variations in outcome, and responses to
treatment [1–4]. Schizophrenia causes many disturbances,
which have the propensity to have a pervasive impact on
many areas of life functioning and subsequently on the
quality of life (QOL) [1]. Sullivan et al. [5] noted that long-
term psychotics are more vulnerable to stress, more
dependent, and have greater deficits in living skills and
in relationship with their social environment. Patients often
report chronic difficulty coping effectively with both major
and minor stresses [6,7]. They may possess a relatively
limited repertoire of coping strategies and tend to avoid
rather than actively attempt to solve problems [8–11].
Different coping strategies may reduce the negative
influence of specific symptoms and distress on the
subjective QOL of schizophrenic patients [12,13]. Mala-
daptive coping patterns are of larger importance because
they have been linked to symptom exacerbation and failure
to sustain community tenure [14,15]. Studies identify
QOL as an important (if not the most important) measure
of the impact of schizophrenia and its respective treatment
[16]. QOL of chronic patients is impoverished especially in
the domains of housing conditions, family environment,
social network, financial circumstances, and safety and
practical skills [5]. In Arab countries, epidemiologic data
about the ways of coping and QOL among schizophrenic
patients are scarce. Egypt and Saudi Arabia share common
life profiles, including language and religion, but are
different with regard to cultural, historical, and financial
aspects of life. Thus, there is a good reason to hypothesize
that there would be a significant difference between the
two samples in the QOL, and in the way they cope with
stress and to propose that the Saudi sample might attain a
better QOL and level of functioning than their Egyptian
counterparts. The aim of this study was to explore the
difference between Egyptian and Saudi schizophrenic
patients regarding the patterns of cope employed in the
face of general day-to-day stressors and its correlates and
the difference in the QOL.
72 Original article
2090-5408 �c 2011 Okasha Institute of Psychiatry, Faculty of Medicine, Ain Shams University DOI: 10.1097/01.XME.0000395558.40451.f8

Materials and methodsThis was a comparative study of schizophrenic patients at
the Psychiatric Department of Mansoura University Hospi-
tal, Egypt and the Baljurashi Psychiatric Hospital, Al Baha
region in the Kingdom of Saudi Arabia, conducted
simultaneously in both groups from 1 January 2009 to 1
July 2009. After approval from the ethics board, patients
were recruited after they gave a written informed consent
to accept joining the study to carry out some scales and
more investigations for the patient to measure the effect
of illness over their living environment; no financial or
extramedication benefit would be received by the patients
from joining the study. Diagnosis was made according to the
criteria described by Diagnostic and Statistical Manual of MentalDisorders, fourth edition (DSM-IV). The age range was from
18–45 years, for a duration of more than 2 years. The
stability of illness was for at least 3 months before
assessment (stability of illness was defined as a clinical
and functional stability as judged by the treating physician,
reflected by the criterion of absence of exacerbation of
illness requiring increase in drug dosages by 50%, as
mentioned by Gupta et al. [17]) excluding patients who
were changing their antipsychotic medication, which would
suggest the absence of stability. Excluding patients with all
axis 1 comorbidity or personality disorder or evidence of
organic pathology that could explain the presenting symp-
tomatology. This information was clarified from patient
notes. All the patients who were included were subjected to
physical examination and special questionnaire; the ques-
tionnaire was designed by the authors to tap into different
sociodemographic variables. Socioeconomic status in Egypt
was measured by the Fahmy and El-Sherbiny’s Scale whereas
in Saudi they are measured by some question, which
determines the income, water, and electricity supply nearly
similar to that of the Fahmy and El-Shirbiny’s Scale,
duration of illness, and medications received. Psychometric
assessment was made by using the following tools:
(1) SAPS and SANS [18,19] was developed by Andreason
to measure positive and negative symptoms in schizo-
phrenia; it was rated by the treating psychiatrist.
(2) The Brief COPE [20] is a validated short form of the
COPE inventory [21], which is a widely used
measurement of coping in health-related research.
The Brief COPE consists of 14 scales of two items
each. Both cognitive and behavioral strategies of
coping are included.
(3) Self report on Quality of Life for Schizophrenia (SQLS)
[22] have 30 items incorporated in three scales: (i)
psychosocial (15 items), (ii) motivation and energy
(seven items), and (iii) symptoms and side effects
(eight items). Both Brief COPE and self-report on
Quality of Life scales were translated by the research
team and are subjects of translation in another study.
At the Baljurashi Psychiatric Hospital in Al-Baha, the total
number of patients received from January 2009 till July
2009 (6 months) was 450; only 140 of them accepted to
join the study and completed the questionnaires. An equal
number of schizophrenic patients in Egypt were targeted.
Statistical analysis was conducted using the statistical
package for the social sciences (SPSS version 12, IBM,
Chicago, USA). For quantitative data, the unpaired t-test
was used for group comparisons. For categorical data, the
w2-test was used for comparison between the groups. Pvalue of less than 0.05 was considered to be statistically
significant. Correlation studies were also conducted.
ResultsTable 1 shows that the patients of the Saudi group were
relatively old, 43.6% of them were female patients, 42.3%
were single, 32.9% were married, and 24.3% were
divorced, nearly more than half of them having lower
level of education, 75.7% of them came from rural areas
and were nomads with relatively longer duration of
illness, and 55.5% of them had a positive family history
of psychiatric illness. A major proportion of them (70%)
were on atypical antipsychotics with their scores on global
assessment of functioning (GAF; 32.6 ± 7.1), SAPS
(9.2 ± 2.3), and SANS (11.4 ± 2.5). Although Egyptians
were observed to be relatively young, more male patients
were included, more likely to be single or divorced, 85.5%
were on typical antipsychotics, scored 28.5 ± 7 on GAF,
scored 9.3 ± 2.4 on SAPS, and scored 12.8 ± 2.4 on SANS.
As evident from the graph on the Brief COPE Scale, it
was observed that Saudi patients were higher on self
distraction, acceptance, and self blame subscales, whereas
Table 1 Sociodemographic variables in Saudi and Egyptian
schizophrenic patients
VariablesSaudi patients
N % (140)Egyptian patients
N % (140)
Age (mean ± SD) (years) 32.7 ± 8 30.7 ± 7.2Sex
Male 79 (56.4) 88 (62.9)Female 61 (43.6) 52 (37.1)
EducationPrimary 44 (31.4) 12 (8.6)Preparatory 51 (36.4) 20 (14.3)Secondary 31 (22.2) 84 (60)College 14 (10) 24 (17.6)
OccupationEmployed 20 (14.3) 34 (24.3)Unemployed 31 (22.1) 34 (24.3)Student 11 (7.9) 12 (8.6)Retired 21 (15) 20 (14.3)Housewives 57 (40.7) 40 (17.1)
Marital statusSingle 60 (42.3) 88 (62.9)Married 46 (32.9) 36 (25.6)Divorced 34 (24.3) 16 (11.5)
Socioeconomic statusLow 28 (20) 72 (51.4)Middle 79 (56.4) 57 (40.7)High 33 (23.6) 11 (7.9)
ResidenceUrban 34 (24.3) 57 (40.7)Rural 106 (75.7) 83 (59.3)
Type of familyNuclear 21 (15) 105 (75)Extended 119 (85) 35 (25)
Duration of illness 10.8 ± 6.8 9.7 ± 8.1Positive family history
Present 78 (55.5) 35 (25)Absent 62 (44.5) 105 (75)
Coping with stress and quality of life Elsheshtawy and Elez 73

the Egyptians were higher on using most subscales of
Brief Coping (Fig. 1).
Results on the QOL showed that Saudi patients were
better on most items of the scale except for the
Motivation and Energy Scale (Table 2).
Correlation studies revealed that, on coping with general
stress, the SAPS score among Saudi patients was
negatively correlated with self blame (r = – 0.202,
P = 0.017), whereas in Egyptians it was positively
correlated with denial (r = 0.240, P = 0.004), behavioral
disengagement (r = 0.294, P < 0.001), venting (r = 0.24,
P = 0.004), and humor (r = 0.284, P = 0.001). SANS
score had no correlation in Saudi patients, whereas in
Egyptians it was negatively correlated with planning
(r = – 0.232, P = 0.006) and active coping (r = – 0.207,
P = 0.014).
Table 3 shows that in Egyptian schizophrenic patients,
long duration of illness was correlated with poor
motivation and energy, whereas it showed no correlation
in the Saudi group of patients.
DiscussionSchizophrenia is a severe and debilitating disorder, which
affects general health, functioning, autonomy, subjec-
tive well being, and life satisfaction of those who suffer
from it [23]. As evident from the results, compared with
Egyptian patients, it was clinically observed that there
were more Saudi female patients in the study although
both authors were females which explains the fact that
Saudi patients prefer a female psychiatrist to deal with
their female patients and are encouraged to get their
female patients when they encounter with a female
doctor whom they believe is more understanding and
appreciative of female problems, and can uncover their
face and speak openly (clinical observation, not a fact).
Higher percentage of the patients were married; as the
Saudi patients are more dependent on their families
regarding the expenses of marriage, they tend to marry
early and live in extended families. This was supported by
Abdullah Al-Sabaie [24] who explained that culturally,
the large family enhances the sense of collective strength
and influence in the community. High rates of divorce
may be related to the effects of illness [24]. Saudi
patients were of higher socioeconomic status relative to
Egyptians, and they mostly belonged to middle class from
rural and nomadic areas, whereas those of higher class
were few. This could be explained by the fact that in the
southern area of Saudi there are limited resources, less
job opportunity, less level of education, and less contact
with civilization than other Saudi areas. However, a high
percentage of them were maintained on atypical anti-
psychotics, which are offered to patients by governmental
hospitals because of high country resources. As Egyptian
patients tend to live in nuclear families and only the
typical antipsychotics were provided by governmental
hospitals, it was evident that Saudi patients had relatively
less negative symptoms and got higher scores on GAF
probably due to the use of atypical antipsychotics.
There was a large percentage of Saudi patients having
a positive family history of psychiatric illness, more
commonly schizophrenia that was supported by Chaleby
and Tuma [25] who observed that schizophrenia tends to
cluster in families in Saudi Arabia due to high consanguinity
supporting the genetic hypothesis of the disorder.
With regard to the results on Brief COPE Scale, as
evident from the graph, Egyptians were more ready to use
several strategies including problem centered and neutral
strategies, whereas Saudi patients relatively used less
number of coping skills and were higher on self
distraction and acceptance. Carter et al. [12] have shown
that effectiveness improves if participants use several
strategies at the same time, whereas other researchers
have argued the converse [26]. Contradictory findings may
Figure 1
Brief coping among Saudi, Egyptian
0
1
2
3
4
5
6
7
1234567891011121314
saudiegypt
Brief COPE Scale among Saudi and Egyptian schizophrenic patients.
Table 2 Self report quality of life in Egyptian and Saudi schizophrenic patients
SQLSEgyptian patients
(140)Saudi patients
(140)Statistical test results
d.f. = 139
Psychosocial Scale 40.98 ± 10.5 38.7 ± 9.2 t = 2.540, P = 0.012Motivation and Energy Scale 41.99 ± 10.2 40.26 ± 8.5 t = 1.788, P = 0.076Symptoms and Side Effects Scale 30.17 ± 11.2 22.63 ± 9.4 t = 8.107, P < 0.001
Significant at P < 0.05.d.f., degrees of freedom; SQLS, self report quality of life for schizophrenia.
Table 3 Correlation between duration of illness and quality
of life in Egyptians versus Saudi schizophrenic patients
Egyptians (r) Saudis (r)
Psychosocial Scale 0.033 – 0.116Motivation and Energy Scale 0.259a – 0.115Symptoms and Side Effects Scale 0.122 – 0.154
aHighly significant at P < 0.01.
74 Middle East Current Psychiatry

be related to different ways of measuring effectiveness
just as Farhall and Gehrke [9] considered effectiveness as
a multidimensional construct including a degree of con-
trol, anxiety level, and overall coping effectiveness. This
was supported by a previous study done by Boschi et al.[27] on patients with nonfirst episode psychosis which
explained that patients with severe symptomatology
tended to endorse a greater number of coping strategies,
suggesting that use of more strategies is a response to
symptoms [26]. High self distraction observed among
Saudi patients could be of value when it seemed
inappropriate to include maladaptive strategies such as
acting violently or using alcohol [28]. Certain distraction
efforts that are actively pursued to eliminate a symptom
are categorized as problem-centered strategy. Although
acceptance is considered from the neutral defense that is
commonly described by psychotics, this is in accordance
with McGorry’s suggestion that the trauma associated
with psychosis may result in people believing that most
situations exceed their coping skills [29].
From correlation studies, Egyptian patients with more
negative symptoms were related to less use of problem
focusing coping as planning and active coping, which is
consistent with previous studies [26]. Those with high
positive symptoms were correlated more with dysfunc-
tional coping as denial and behavioral disengagement,
whereas venting and emotion focused coping as humor.
This could be explained, as patients with positive
symptoms had denial as a part of lost insight and they
were more likely to have behavioral disengagement. In
addition, venting coping strategy is considered as part of
acceptance that is commonly seen in psychotics. In Saudi
schizophrenic patients, those who had high positive
symptoms were correlated with less self blame probably
due to impaired insight.
As evident from results, Saudi patients had better QOL as
they scored less on most items of the scale except for
Motivation and Energy Scale, which could be due to the
previous factors explained such as early marriage and living
in extended families; these factors carry most of the burden
of psychosis that mental health system rely on them for post
discharge care by the family [24]. Among the factors of good
prognosis which were observed in Saudi schizophrenic
patients are being married and having adequate psychosocial
functioning before illness [30]. Together with availability of
most recent medications with very few side effects, which
are supplied freely to patients, and families of psychotics do
not carry any expenses for medications together with rising
awareness about psychiatric illness. It was evident that
pharmacological therapies that result in symptom reduction
can produce important improvements in health-related QoL
[16]. In addition, lower level of education seen among Saudi
patients could be predictor of better prognosis as it was
found that in underdeveloped countries, patients with
higher educational levels appear to have a worse evolution in
the disease due to the higher social demands and
expectations compared with patients with low schooling
[30]. Although motivation and energy not significantly differ
as impaired motivation and energy are considered to be a
corner-stone effect of schizophrenic illness.
Long duration of illness in Egyptian schizophrenic
patients was associated with poorer motivation and
energy, this may be due to the influential effect of
schizophrenia on motivation together with the role played
by typical antipsychotics with high side effects and
negative influence on motivation and energy. This could
explain the contrary, as in Saudi patients no correlation
was observed, this may be due to the use of atypical
antipsychotics by a large proportion of them.
ConclusionIt was concluded that Egyptian schizophrenic patients used
more number of coping strategies, whereas Saudi schizo-
phrenic patients were better on coping with stress and on
most domains of QOL. Social factors are the most
important determinant on the QOL, rather than the
symptoms. This was in accordance with recent studies
addressing QOL for individuals with schizophrenia and
other severe mental illnesses that identified a number of
important influential factors, such as social support, unmet
need, and medication side effects [16]. However, most of
the research examining factors affecting QOL has primarily
focused on the impact of psychiatric symptoms, especially
negative symptoms [16]. It is also known that the progress
of schizophrenic patients is better in developing countries
because of more handling of patients in families and in
society and less institutionalization [23].
Clinical implications and recommendation
(1) Progress of patients is better in developing countries
such as Egypt and Saudi Arabia because of better
handling in families and in society, and less institu-
tionalization.
(2) Careful management of negative symptoms of
schizophrenia because of its negative effects on QOL.
Limitations
(1) Some of the findings are based on self-reported
information, and thus some reporting bias might have
occurred.
(2) The study took place at only two sites with small
number of patients, which will affect the general-
izability of results.
(3) The results of this study shouldn’t be generalized to
all schizophrenic patients as severe, unstable, and dis-
turbed patients with active symptoms were excluded
from the study.
There is no conflict of interest to declare.
References1 Awad AG, Voruganti LN, Heslegrave RJ. Measuring quality of life in patients
with schizophrenia. Pharmacoeconomics 1997; 11:32–47.
2 Patterson TL, Kaplan RM, Jeste DV. Measuring the effect of treatment onquality of life in patients with schizophrenia: focus on utility-based measures.CNS Drugs 1999; 12:49–64.
Coping with stress and quality of life Elsheshtawy and Elez 75

3 Awad AG, Lapierre YD, Angus C, Rylander A; The Canadian RemoxiprideGroup. Quality of life and response of negative symptoms in schizophrenia tohaloperidol and the atypical antipsychotic remoxipride. J Psychiatry Neurosci1997; 22:244–248.
4 Revicki DA, Genduso LA, Hamilton SH, Ganoczy D, Beasley CM Jr.Olanzapine versus haloperidol in the treatment of schizophrenia and otherpsychotic disorders: quality of life and clinical outcomes of a randomizedclinical trial. Qual Life Res 1999; 8:417–426.
5 Sullivan G, Wells KB, Leake B. Clinical factors associated with better qualityof life in a seriously mentally ill population. Hosp Community Psychiatry1992; 43:794–798.
6 Corrigan PW, Toomey R. Interpersonal problem solving and informationprocessing in schizophrenia. Schizophr Bull 1995; 21:395–403.
7 Mueser KT, Valentiner DP, Agresta J. Coping with negative symptoms of schizo-phrenia: patient and family perspectives. Schizophr Bull 1997; 23:329–339.
8 Rollins AL, Bond GR, Lysaker PH. Characteristics of coping with thesymptoms of schizophrenia. Schizophren Res 1999; 36:30.
9 Farhall J, Gehrke M. Coping with hallucinations: exploring stress and copingframework. Br J Clin Psychol 1997; 36 (Pt 2):259–261.
10 Lysaker PH, Bryson GJ, Lancaster RS, Evans JD, Bell MD. Insight inschizophrenia: associations with executive function and coping style.Schizophr Res 2003; 59:41–47.
11 Wilder Willis KE, Shear PK, Steffen JJ, Borkin J. The relationship betweencognitive dysfunction and coping abilities in schizophrenia. Schizophr Res2002; 55:259–267.
12 Carter DM, Mackinnon A, Copolov DL. Patients’ strategies for coping withauditory hallucinations. J Nerv Ment Dis 1996; 184:159–164.
13 Singh G, Sharan P, Kulhara P. Coping with hallucinations in schizophrenia:a correlational study. Hong Kong J Psychiatry 2002; 12:5–11.
14 Macdonald EM, Pica S, Mcdonald S, Hayes RL, Baglioni AJ Jr. Stress andcoping in early psychosis. Role of symptoms, self-efficacy and social support incoping with stress. Br J Psychiatry Suppl 1998; 172:122–127.
15 Meyer B. Coping with severe mental illness: relations of the brief COPE withsymptoms, functioning and well-being. J Psychopathol Behav Assess 2001;23:265–277.
16 Eack SM, Newhill CE. Psychiatric symptoms and quality of life inschizophrenia: a meta-analysis. Schizophr Bull 2007; 33:1225–1237.
17 Gupta S, Kulhara P, Verma SK. Quality of life in schizophrenia and dysthymia.Acta Psychiatr Scand 1998; 97:290–296.
18 Andreason N. The scale for the assessment of negative symptoms (SANS).Iowa: University of Iowa; 1983.
19 Andreason N. The scale for the assessment of positive symptoms (SAPS).Iowa: University of Iowa; 1984.
20 Carver CS. You want to measure coping but your protocol’s too long:consider the brief COPE. Int J Behav Med 1997; 4:92–100.
21 Carver CS, Scheier MF, Weintraub JK. Assessing coping strategies:a theoretically based approach. J Pers Soc Psychol 1989; 56:267–283.
22 Wilkinson G, Hesdon B, Wild D, Cookson R, Farina C, Sharma V, et al. Self-report quality of life measure for people with schizophrenia: The SQLS. Br JPsychiatry 2000; 177:42–46.
23 Solanki RK, Singh P, Midha A, Chugh K. Schizophrenia: impact on quality oflife. Indian J Psychiatry 2008; 50:181–186.
24 Al Sabaie A. A psychiatry in Saudi Arabia: cultural perspectives. TranscultPsychiatry Res Rev 1989; 26:245–262.
25 Chaleby K, Tuma TA. Cousin marriages and schizophrenia in Saudi Arabia.Br J Psychiatry 1987; 150:547–549.
26 So SHW, Wong CW. Experience and coping with auditory hallucinations infirst-episode psychosis: relationship with stress coping. Hong Kong JPsychiatry 2008; 18:115–121.
27 Boschi S, Adams RE, Bromet EJ, Lavelle JE, Everett E, Galambos N. Copingwith psychotic symptoms in the early phases of schizophrenia. Am JOrthopsychiatry 2000; 70:242–252.
28 Yanos PT, Knight EL, Bremer L. A new measure of coping with symptoms foruse with persons diagnosed with severe mental illness. Psychiatr Rehabil J2003; 27:168–176.
29 McGorry PD. The concept of recovery and secondary prevention inpsychotic disorders. Aust N Z J Psychiatry 1992; 26:3–17.
30 Cardoso CS, Caiaffa WT, Bandeira M, Siqueira AL, Abreu MN, Fonseca JO.Factors associated with low quality of life in schizophrenia. Cad SaudePublica 2005; 21:1338–1340.
76 Middle East Current Psychiatry

Coping with stress and quality of life Elsheshtawy and Elez 77

Comorbid psychiatric symptoms in patients with psoriasisFatma Abd El Latif Mousaa, Hesham Abd El Moati Zaherb,Mohammed Ezzat Amina, Akmal Mostafa Kamala and Heba Fathya
aDepartment of Psychiatry, Faculty of Medicine,bDepartement of Dermatology, Cairo University,Cairo, Egypt
Correspondence to Heba Fathy, Department ofPsychiatry, Faculty of Medicine, Cairo University,Cairo, EgyptTel: + 0101404826;e-mail: [email protected]
Received 3 August 2010Accepted 25 October 2010
Middle East Current Psychiatry 2011, 18:78–85
Introduction
Psoriasis is a chronic inflammatory skin disease. Generally, approximately one in four
patients experiences significant psychological distress. Depression and anxiety are the
most common disorders that are associated with psoriasis. This study was carried out
to assess the psychiatric comorbidities in patients suffering from psoriasis, such as
depression, and their effects on the quality of life and the personality characteristics of
patients suffering from psoriasis.
Materials and methods
This study is a comparative case–control cross-sectional study. The sample of this
study included two groups: cases and controls. The cases consisted of 30 patients
with the diagnosis of psoriasis recruited from the outpatient clinic of the Dermatology
Department of the Kasr El Aini Hospitals. They represent consecutive referrals of
patients fulfiling the criteria for inclusion in the study. The controls consisted of
30 individuals free of any psychiatric and physical disorders; the relatives of the
patients were excluded to avoid genetic factors. Controls were age-matched and
sex-matched with the psoriasis group. Both groups were subjected to the following:
Beck Depression Inventory, Arabic version; Eysenck’s Personality Questionnaire,
Arabic version; Body Image Scale, Rating Scales for Psychopathological Health
Status, and Quality of life Scale, Arabic version.
Results
Twenty-six percent of the patients had major depressive disorder, 23.3% had
adjustment disorder with depressed mood, and 13.3% had dythymic disorder.
Forty-three percent of the psoriatic patients had severe depression on Beck
Depression Inventory, 16.7% had moderate depression, and 16.7% also had mild
depression, whereas in 23.3% patients depression was absent. There were
statistically significant differences between the two groups (v2 = 21.2, P = 0.000)
regarding the Beck Depression Inventory. There was statistically significant difference
between the psoriasis group and controls regarding Neuroticism, Introversion, and Lie,
whereas there was no statistical significance difference between the two groups
regarding Psychoticism and Criminality. There were statistically significant differences
between the two groups (P = 0.000) regarding the mean of Body Image Scale.
Conclusion
There is high frequency of psychiatric comorbidities in psoriatic patients especially
depression, which represents the most frequent psychiatric symptom in psoriasis.
The presence of psychiatric comorbidities increases the impairment in quality of life in
psoriatic patients. There were no specific personality characteristics for psoriatic
patients.
Keywords:
body image, depression, psoriasis
Middle East Curr Psychiatry 18:78–85�c 2011 Okasha Institute of Psychiatry, Faculty of Medicine, Ain Shams University2090-5408
IntroductionPsoriasis is a chronic inflammatory skin disease that is
characterized by thick, red, scaly lesions that may appear
on any part of the body. Generally, approximately one in
four patients experiences significant psychological dis-
tress. In fact, one of the most persuasive indications of a
link between stress and psoriasis comes from patients
themselves, with studies illustrating that the majority of
patients believe that stress or psychological distress is a
factor in the manifestations of their condition [1,2].
Depression and anxiety are the most common disorders
that are associated with psoriasis, but the proportion of
patients meeting criteria for an anxiety disorder is notably
higher than that for depression in patients with psoriasis
[3]. Psychiatric disturbance and psychosocial impairment
are reported in at least 30% of patients who have
dermatologic disorders. Major depressive disorder is the
most frequently encountered psychiatric disorder in
78 Original article
2090-5408 �c 2011 Okasha Institute of Psychiatry, Faculty of Medicine, Ain Shams University DOI: 10.1097/01.XME.0000395559.78568.e4
dermatology and is often associated with suicidal risk.
Other psychiatric syndromes comorbid with dermatologi-
cal disorders include obsessive–compulsive disorder,
social phobia, posttraumatic stress disorder, dissociation,
conversion disorder, body image pathologies, delusional
disorder, and a wide range of personality disorders [4].
Moreover, symptoms of psoriasis, especially pruritus, are
related to depression. Similarly, there is evidence that
patients who report high levels of stress experience
pruritus more frequently than patients with lower stress
levels [5,6]. In contrast, patients with psoriasis have
significant impairment in their quality of life (QOL).
Psoriasis usually does not take lives, but it does ruin
them. The impact of psoriasis on QOL is similar to that of
other major medical diseases, and it is not only limited to
the patients but psoriasis also has a major secondary
impact on the lives of family members and partners [7].
The aim of the study was to assess the psychiatric
comorbidities in patients suffering from psoriasis such as
depression, anxiety, and disturbed body image and their
effects on QOL and to assess the personality character-
istics of patients suffering from psoriasis.
Patients and methodsThis study is a comparative case–control study.
Patients
The sample of this study included two groups: cases and
controls.
Cases
Thirty patients with psoriasis were diagnosed by the
lecturer and assistant lecturer of dermatology, and were
recruited from the outpatient clinic of the Dermatology
Department of Kasr El Aini Hospitals. Both sexes were
included. Patients’ ages ranged from 15 to 45 years, and
they were diagnosed with psoriasis vulgaris. The general
exclusion criteria were patients suffering from other
dermatological diseases, medical condition that would
interfere with the assessment, mental subnormality
suspected on clinical interview and intelligent quitent
assessment by psychometric testing, past history of
psychiatric disorders and substance use disorders (before
psoriases), comorbidity with other active major medical
problems (e.g. renal and hepatic failure), and patients
under oral or systemic corticosteroid medication.
Controls
Thirty individuals were selected who were completely
free of any psychiatric and physical disorders, and we
excluded the relatives of the patients to avoid genetic
factors. They have been age-matched and sex-matched
with the psoriasis group. Informed oral and written
consent were taken from all patients who participated in
this study.
Methodology
Both the groups were subjected to the following
assessment:
Psychiatric examination
This examination was applied by using the modified
clinical sheet of the Psychiatry Department of Cairo
University (Kasr El Aini) to diagnose psychiatric disorders
according to Diagnostic and Statistical Manual of MentalDisorders, fourth edition (DSM-IV) criteria [8] using the
Structured Clinical Interview for DSM Axis of Disorders
(SCID-I): SCID-I provides a broad coverage of Axis I
psychiatric diagnosis according to DSM-IV [9]. Relevant
data include sociodemographic data, family history, past
history, dermatological history, and screening of psychia-
tric symptoms.
Psychometric tools
Beck Depression Inventory (BDI), [10] Arabic version: this
inventory used for measuring depression, which is trans-
lated to Arabic by Gharib Abdel Fattah, is a self-reported
scale designed to assess DSM-IV-defined symptoms of
depression. The inventory consists of 21 groups of
statements on a four-point scale with the subject selecting
the one that best matches the patient’s current state. Each
statement group corresponding to a specific behavioral
manifestation response is scored as 0–3, corresponding to
no, mild, moderate, or severe depressive symptomatology in
the response. The score range varies from 0 to 63, where
higher scores indicate greater depression severity. Scores in
the range of 0–13 indicate no or minimal depression; 14–19,
mild depression; 20–28, moderate depression; and 29–63,
severe depression.
Eysenck’s Personality Questionnaire (EPQ), [11] Arabic version:
it was translated to Arabic by Ahmed Mohamed Abdel
Khalek in 1991. It is used to assess Neuroticism,
Psychoticism, Introversion/Extroversion, Criminality, and
Lie scale. Extraversion is characterized by being outgoing,
talkative, high on positive affect (feeling good), and in
need of external stimulation. Introverts, in contrast, are
chronically overaroused and jittery, and are therefore in
need of peace and quiet to bring them up to an optimal
level of performance. Neuroticism or Emotionality is
characterized by high levels of negative effects such as
depression and anxiety. Psychoticism is associated not
only with the liability to have a psychotic episode (or
break with reality), but also with aggression. Psychotic
behavior is rooted in the characteristics of tough mind-
edness, nonconformity, inconsideration, recklessness,
hostility, anger, and impulsiveness. The questionnaire is
formed of 99 questions to be answered by yes or no. Each
one of the five dimensions has certain questions and each
question takes a score; then the total score for each
dimension is calculated.
Body Image Scale [12]: this scale is based on the
phenomena that body image is the mental picture or
presentation of the body at times of rest and movement
or either. It is derived from the internal perception of
external appearance and internal body, and also from
accompanied emotional experiences and its reflection on
interactions with self and others. This scale is self rated,
formed of 26 items and every patient answers in three
grades from totally accepting to totally not accepting with
a score from 0 to 2 for each item. The normal range for
Comorbid psychiatric symptoms in psoriasis Mousa et al. 79

male patients is 14 ± 6 and for female patients is 16 ± 6,
above which the body image is considered as disturbed.
Rating Scales for Psychopathological Health Status and Qualityof Life Scale (PCASEE) [13] Arabic version: it is a self-rated
scale. Clarify the subjective expression of the QOL of the
patients. It consists of six domains to estimate the degree
of impairment in the QOL of the patients. These
domains are physical, cognitive, affective, social, economic,
and ego.
Scoring of the scale was done for each item from 0 to 2,
where 0 stands for bad response, 1 for moderate response,
and 2 for good response. The results were calculated by
multiplying the sum of each domain with 4 to obtain the
percentage for QOL. Therefore, 100% means the best QOL.
Statistical analysis
All statistical calculations were done using computer
programs Microsoft Excel 2007 (Microsoft Corporation,
New York, USA) and SPSS (Statistical Package for the
Social Science; SPSS Inc., Chicago, Illinois, USA) version
15 for Microsoft Windows. Descriptive statistics was used
for illustrating the mean and standard deviation of
quantitative data. Statistical tests were used to find out
the significant differences between the two groups. The
student t-test was used for quantitative variables, for
example, age, BDI, Beck Anxiety Inventory, Quality of Life
Scale, and Body Image Scale. The w2-test was used for
qualitative variables, for example, sex, education, occupa-
tion, marital status, socioeconomic level, and EPQ.
Correlation coefficient test was used for correlation
between depression (BDI) and Quality –of Life Scale.
Probability level (P value < 0.05) was considered to be
statistically significant [14].
ResultsSociodemographic data
There were no statistically significant differences regard-
ing age, sex, marital status, education, and occupation.
Clinical profile of the psoriasis group
The age of onset of psoriasis ranges from 14 to 44 years,
with a mean of 28.93 years and a standard deviation of
+ 9.4 years. The duration of illness in psoriatic patients
ranges from 1 to 28 years, with a mean of 9.3 years and a
standard deviation of + 7.97 years. Twenty psoriatic
patients had lesions on their face and hands (66.7%),
which were absent in 10 patients (33.3%). In contrast,
eight patients had nail involvement (26.7%), which was
absent in 22 patients (73.3%). Four psoriatic patients had
joint involvement (13.3%), which was absent in 26
patients (86.7%).
Table 1 shows that depression is the most presenting
psychiatric symptoms in patients with psoriasis and as
shown in table 3 the score of depression in Beck
depression inventory was higher in patients than control
and the difference was statistically significant. Table 4
also shows that 43% of patients with psoriasis has severe
depression.
Table 2 shows that 21 psoriatic patients (70%) had
psychiatric diagnoses according to the DSM-IV and
SCID-I [8,9].
Table 5 shows that there is a statistically significant
difference between the psoriasis group and controls
regarding Neuroticism, Introversion, and Lie Scales.
Table 6 shows that there is a statistical significant
deference between the two groups as regards the
disturbed body image
Table 7 shows that there is a statistically significant
difference between the two groups regarding the
physical, cognitive, affective, social, economic, and ego
problems.
As regards depression and site of the lesion, patients with
psoriatic lesions on their hand and face had a higher score
on BDI, with a mean of 32.2 and standard deviation of
± 15.5 compared with those without lesions on their hand
and face, with a mean of 19.9 and standard deviation of
± 15.4. There were statistically significant differences
between the two groups (P = 0.04).
There is a statistically significant difference between the
psoriasis group with disturbed body image and the
Table 1 Distribution of psychiatric symptoms in patients with
psoriasis
Psoriasis patientsn = 30
Psychiatric symptoms N Percentage
Depressed mood 20 66.7Suicidal ideation 2 6.7Suicidal attempt 1 3.3Obsessions 4 13.3Panic attacks 4 13.3Worry from chronicity 17 56.7Worry from recurrence 18 60.0Sexual dysfunctions 18 60.0
N, numbers.
Table 2 Psychiatric diagnosis in patients with psoriases
Psychiatric diagnosis in psoriasisgroup (n = 30) N Percentage
Major depressive disorder 8 26.7Adjustment disorder with depressed mood 7 23.3Dythymic disorder 4 13.3Mixed anxiety and depression 1 3.3Bipolar I disorder 1 3.3No psychiatric diagnosis 9 30.0Total 30 100
N, numbers.
Table 3 Beck depression inventory in the psoriasis group
and the control group
Beck depression inventoryPsoriasis group
n = 30Control group
n = 30 P
Mean 28.1 10.03Standard deviation ± 16.3 ± 7.1 0.000*
N, numbers.P < 0.05 is statistically significant.
80 Middle East Current Psychiatry

psoriasis group without disturbed body image as regards
Neuroticism and Introversion, whereas there is no
statistically significanct difference between the two
groups regarding Psychoticism, Criminality, and Lie.
There are statistically significant negative correlations
between BDI and Quality of Life Scale in all its
subscales: physical (P = 0.000), cognitive (P = 0.000),
affective (P = 0.000), social (P = 0.001), economic
(P = 0.037), and ego problems (P = 0.000). This means
that the increase in severity of depression is associated
with decrease in QOL.
DiscussionIn viewing the demographic data of the sample it can be
noticed that there were no statistically significant
differences between the psoriasis and the control group
as regards all the sociodemographic data including age,
sex, marital status, education, and occupation. This
indicated that the samples were well matched and fit
for the study and comparison. Our study indicates that
the average age of onset in the psoriasis vulgaris group
was 28.9 ± 9.4 years, with a range of 14–44 years and the
average duration of illness in patients with psoriasis
vulgaris was 9.3 ± 7.9 years. These results correspond
with another recent study carried out on 50 consecutive
patients with psoriasis in which the average age of onset
was 31.1 ± 12.7 years and the duration of illness was
6.7 ± 5.7 years [15].
As regards the psychiatric morbidity, a study of 149 patients
referred to liaison psychiatrist from a dermatology clinic
reported that 95% warranted psychiatric diagnosis. Of
these, depressive illness accounted for 44% and anxiety
disorders for 35%, less common psychiatric disorders
included social phobia, somatization disorder, alcohol
dependence syndrome, obsessive–convulsive disorder,
post-traumatic stress disorder, anorexia nervosa, and
schizophrenia [16]. Our study revealed that 70% of patients
with psoriasis have a psychiatric diagnosis according to
DSM-IV, SCID-I [8,9]. Our findings could be compared
with another study that found psychiatric comorbidity in
47.6% of the patients with psoriasis vulgaris [17]. Our
findings also could be compared with another Egyptian
study done on 50 patients with psoriasis identified
psychiatric co-morbidity in 38% of them [18]. These
differences in the prevalence of psychiatric disorders in
psoriasis in the different studies could be explained by the
diversity of psychiatric morbidity in psoriasis, which may be
related to the sample size, the difference in patient
Table 4 The severity of beck depression inventory (BDI) in the
patients group and controls
Psoriasisgroup
n = 30
Controlgroup
n = 30
Beck depression inventory N % N % w2 P
Absent 7 23.3 20 66.7
21.2 0.000*Mild 5 16.7 10 33.3Moderate 5 16.7 0 0.0Severe 13 43.3 0 0.0Total 30 100.0 30 100.0
N, numbers.*P < 0.05 is statistically significant.
Table 5 Eysenck personality questionnaire (EPQ) in the psoriasis patients and the control group
Psoriasis groupn = 30
Control groupn = 30
Eysenck personality questionnaire (EPQ) N % N % P
PsychoticismNormal 15 50.0 20 66.7
0.295Significant 15 50.0 10 33.3Total 30 100.0 30 100.0
NeuroticismNormal 9 30.0 21 70.0
0.004*Significant 21 70.0 9 30.0Total 30 100.0 30 100.0
IntroversionNormal 12 40.0 26 86.7
0.000*Significant 18 60.0 4 13.3Total 30 100.0 30 100.0
LieNormal 12 40.0 21 70.0
0.018*Significant 18 60.0 9 30.0Total 30 100.0 30 100.0
CriminalityNormal 20 66.7 23 76.7
0.567Significant 10 33.3 7 23.3Total 30 100.0 30 100.0
N, numbers.*P < 0.05 is statistically significant.
Table 6 Body image scale in the psoriasis group and the control
group
Body image scalePsoriasis group
n = 30Control group
n = 30 P
Mean 23.03 8.30.000*Standard deviation ± 10.7 ± 7.03
*P < 0.05 is statistically significant.
Comorbid psychiatric symptoms in psoriasis Mousa et al. 81

selection, the duration of illness, and the different
psychometric measures used with different cutoff scores
used. Even studies that used standardized diagnostic
criteria do not allow us to come to a conclusion about the
relative prevalence of the psychiatric disorders in psoriasis.
In our study, the most common diagnosis was major
depressive disorder (26.7%) followed by adjustment
disorder with depressed mood (23.3%) then Dythymic
disorder (13.3%), and only 3.3% have diagnosis of mixed
anxiety and depression and 3.3% have diagnosis of bipolar
I disorder. These findings were compared with the results
of the study carried out using Mini International
Neuro-Psychiatric Interview, and it was found that the
most common psychiatric comorbidity in patients with
psoriasis vulgaris was depression (28%) followed by
suicidality (6%), alcohol abuse and dependence (6%),
psychotic disorder and mood disorder with psychotic
features (4%), generalized anxiety disorder (4%), social
phobia (2%), and dysthymia (2%) [16]. The difference in
the prevalence of different psychiatric comorbidities
especially anxiety and depression in our study and this
study could be due to the difference in the diagnostic
systems used. In addition, different methodologies such as
difference in population characters could also be the reason
(for example the percentage of male patients in this study
were 86% which is much higher than that of our study
53.3%, also our study showed higher illiteracy and
unemployment than this study). All these factors make
the comparison between both studies difficult. Suicidal
ideation is a serious problem among sufferers of psoriasis. In
our study, the rate of suicidal ideation was 6.7 and 3.3% had
attempted suicide. This finding is consistent with that
reported in another study carried out by Gupta et al. [19]
who found that 9.7% of patients with psoriasis expressed
a wish to die and 5.5% were experiencing active suicidal
ideation at the time of the study. These rates are up to
greater than two-folds that are found in the general
community [20]. The rate of suicidal ideation among 79
outpatients being treated for psoriasis was 2.5%, consistent
with figures seen in other populations with chronic illness
[21]. However, among the 138 inpatients in the study, the
rate was 7.2%. The difference in percentage of suicidal
ideation between the outpatient and the inpatient groups
could be explained by the degree of severity of psoriasis,
which was extensive in the inpatient group with higher
body surface area involved compared with the outpatient
group [21]. In a more recent study who found suicidal
ideation in 6% of patient with psoriasis and this could be
related to the chronic nature of the disease and the limited
life style associated with the disease [15]. In contrast,
sexual problems and sexual dysfunction are common
symptoms that are associated with psoriatic patients. Sixty
percent of the psoriatic patients reported had sexual
dysfunctions. This finding is consistent with another
survey that found that more than 40% of sufferers felt
that psoriasis had an adverse effect on their sexual func-
tioning. In this study, joint involvement, more scaling, more
pruritus, and higher depression scores were all significantly
associated with impaired sexual functioning [22].
Beck Depression Inventory
This study showed that there were statistically significant
differences between the group of psoriatic patients and
normal control as regards BDI, with a mean of 28.1 ± 16.3
for the psoriasis group compared with 10.03 ± 7.1 for the
control group. Many studies support this result; one of
the studies found average BDI scores to be 17.96 ± 9.49
for the psoriatic patients and 8.15 ± 6.69 for the controls
[23]. This could be explained by the possibility that
people with skin diseases, especially psoriasis, suffer
limitations in their social and interpersonal relations; they
show signs of shame related to their appearance and sense
of insecurity with a decreased possibility of finding any
job. All these factors have a great impact on the self-
esteem of psoriatic patients, which make them more
vulnerable to develop depression.
When the BDI scores were assessed on the basis of mild,
moderate, and severe depression, we found that overall
16.7% of the patients with psoriasis had scores corre-
sponding to mild depression, 16.7% to moderate depres-
sion, and 43.3% to severe depression. Although there are
few studies that quantify the level of depression scores,
our findings are to be compared with that of another
study [23] carried out on 50 patients with psoriases,
which did not agree with our results and found that the
majority of the patients had scores corresponding to
moderate depression (32%) whereas 26% corresponded
to severe depression [23]. The difference between the
two studies may be interpreted by the different social,
educational, and economic factors in addition to the
different medical care and the early diagnosis of depression
due to the good screening and effective referral system.
Eysenck Personality Questionnaire
Generally, there is no specific personality for psoriasis and
the suggestion that patients with psoriasis have an
underlying personality style needs further researches.
This is why we tried to assess the personality character-
istics of the psoriatic patients in our study, and we found
that most of the patients in the psoriasis group showed
significant higher score in the Neuroticism Scale,
Introversion Scale, and Lie Scale. These results are
consistent with the findings of another study [24] carried
out on 50 Egyptian patients suffering from psoriasis and
proved psoriatic patients to score significantly higher than
normal regarding Introversion Scale, Neuroticism Scale,
and Lie Scale [24].
Table 7 Quality of life scale in the psoriasis patients and the
control group
Psoriasis groupn = 30
Control groupn = 30
Quality of life scale Mean SD Mean SD P
Physical problems 36.7 ± 23.5 85.0 ± 12.5 0.000*Cognitive problems 65.7 ± 26.5 86.7 ± 13.7 0.000*Affective problems 52.0 ± 26.6 79.3 ± 15.7 0.000*Social problems 58.0 ± 23.1 79.7 ± 14.7 0.000*Economic problems 42.0 ± 27.1 69.7 ± 16.9 0.000*Ego problems 51.0 ± 19.0 71.3 ± 12.2 0.000*
*P < 0.05 is statistically significant.
82 Middle East Current Psychiatry

Body Image Scale
Our study showed that there were statistically significant
differences between the group of psoriatic patients and
controls as regards the Body Image Scale, with a mean of
23.03 ± 10.7 in the psoriasis group and 8.3 ± 7.03 in the
control group, which conclude that psoriatic patients
showed more disturbed body image than normal. This
could be explained by the idea that psoriasis has a great
impact on the patients’ appearance and perception of
their own body, which make a great discrepancy between
their perceived body and their ideal body. This finding
agrees with the results of another study, which conclude
that one of the most common psychiatric symptoms attribu-
ted to psoriasis include disturbance in body image, which in
turn affect social and occupational functioning [25].
Quality of Life Scale (PCASEE)
In our study, we tried not only to examine the QOL of the
patient with psoriasis in general but also to specify the
degree of impairment in the QOL in each domain
(physical, cognitive, affective, social, economic, and ego
problems). We found that the group of patients with
psoriasis showed lower score in every domain (physical,
cognitive, affective, social, economic, and ego problems)
when compared with the control group with a statistically
significant difference. This result is consistent with the
results of a study carried out on Egyptian patients
suffering from psoriasis using the same Quality of Life
Scale (PCASEE) and found that Psoriasis had the worst
QOL compared with Vitiligo and Alopecia areata [18].
Moreover, the degree of psychosocial disability tended to
be disproportionate with the degree of physical disability
resulting from psoriasis [26]. In addition, the low score on
the economic subscale of the Quality of Life Scale in our
results is consistent with the finding that psoriasis also
adversely affects patients’ occupational capability, which
can lead to significant financial difficulty [27].
Relationship between depression and site of lesions
In this study, we found a strong relationship between the
presence of psoriatic lesions on the exposed sites, such as
hand and face, in addition to nail involvement and
depression. The mean BDI in the patients with psoriatic
lesions on the hand and face was 32.2 ± 15.5 and on the
nails was 39.4 ± 12.6, whereas those without lesions on
the hand and face was 19.9 ± 15.4 and on nails was
24 ± 15.7 with a statistically significant difference. The
above findings are confirmed by the study by Krueger
et al. [28], who found that the visible area of involvement
resulted in more impact on patients’ life than involve-
ment of the same size in other invisible areas. It was
reported that nail involvement contributed to restrictions
in daily activities in almost two-thirds of individuals, who
have their impact on the QOL [29].
Relationship between personality characteristics of psoriatic
patients and body image
In our study, we also tried to examine the relationship
between the body image and the personality characteristics
of patients with psoriasis, which to our knowledge is the
first study that has investigated such a relationship. We
found that there is statistically significant difference
between the psoriasis group who had a disturbed body
image and the psoriasis group without a disturbed body
image regarding Neuroticism and Introversion. This finding
supports the idea that the perception of psoriatic patients
to their body influences their emotional experience and
interaction with others. This idea is consistent with the
findings of Jowett and Ryan’s [30] study who reported that
89% of patients with psoriasis felt shame and embarrass-
ment over their appearance, 58% suffered from anxiety, and
42% suffered from lack of confidence.
Correlation between depression, anxiety, and QOL
Currently, there is convincing evidence that depression
plays an important role in the QOL in patients with
psoriasis. Our study found that there is a statistically
significant negative correlation between BDI and Quality of
Life Scale in all its subscales: physical, cognitive, affective,
social, economic, and ego problems. This means that the
increase in severity of depression is associated with
decrease in QOL and the same for Beck Anxiety Inventory
and QOL. These findings are consistent with the study
[18] carried out on 50 Egyptian psoriatic patients using the
same Quality of Life Scale (PCASEE) and found that there
is strong association between psychiatric morbidity and
poorer QOL in psoriasis [18]. This is in agreement with the
findings of another study that concurrent depression affects
health related QOL of patients suffering from psoriasis at
least as much as the clinical severity of their psoriasis [31].
The above results appear to be a strong support for the
argument that the subjective experience of psoriasis is a
more powerful determinant of QOL than is the degree of
objective severity [32].
Limitations
(1) The patients were recruited from dermatology clinic
and may therefore not be representative of all
patients with psoriasis.
(2) Small sample size lead to smaller subgroups.
(3) We did not compare our results with another skin disease.
ConclusionFindings of the study and other studies reported in the
literature indicate that there is a high frequency of
psychiatric comorbidities in patients with psoriasis
especially depression, which represents the most fre-
quent psychiatric disorder in psoriasis. The presence of
psychiatric comorbidities increases the impairment in
QOL in psoriatic patients. Although there are no specific
personality characteristics for patients with psoriasis, our
study found that the patients with psoriasis showed more
neuroticism, introversion, and lie than controls. In
addition, the disturbed body image perceived by patients
about themselves plays an important role in shaping their
personality.
There is no conflict of interest to declare.
Comorbid psychiatric symptoms in psoriasis Mousa et al. 83

References1 Picardi A, Abeni D, Melchi CF, Puddu P, Pasquini P. Psychiatric morbidity in
dermatological outpatients: an issue to be recognized. Br J Dermatol 2000;143:983–991.
2 Zachariae R, Zachariae H, Blomqvist K, Davidsson S, Molin L, Mork C, et al.Quality of life in 6497 Nordic patients with psoriasis. Br J Dermatol 2002;146:1006–1016.
3 Richards HL, Fortune DG, Griffiths CE, Main CJ. The contribution ofperceptions of stigmatisation to disability in patients with psoriasis.J Psychosom Res 2001; 50:11–15.
4 Gupta MA. Psychiatric co-morbidity in dermatological disorders. In:Papadopoulos L, Walker C, editors. Psychodermatology. 1st ed. New York:Cambridge University Press; 2005. pp. 29–30.
5 Gupta G, Long J, Tillman DM. The efficacy of narrowband ultraviolet Bphototherapy in psoriasis using objective and subjective outcome measures.Br J Dermatol 1999; 140:887–890.
6 Reich A, Szepietowski JC, Wisnicka B, Pacan P. Does stress influenceitching in psoriatic patients? Dermatol Psychosom 2003; 4:151–155.
7 Eghlileb AM, Davies EEG, Finlay AY. Psoriasis has a major secondary impact onthe lives of family members and partners. Br J Dermatol 2007; 156:1245–1250.
8 American Psychiatric Association. Diagnostic and statistical manual ofmental disorders. 4th ed. Washington, DC: APA: American PsychiatricPublishing, Inc; 2000.
9 First MB, Spitzer RL, Gibbon M, Williams JBW. User’s guide for thestructured clinical interview for DSM-IV Axis I Disorders: SCID-1. 1st ed.Washington, DC: American Psychiatric Publishing, Inc; 1997.
10 Beck AT, Steer RA, Garbin MG. Psychometric properties of the BeckDepression Inventory: twenty-five years of evaluation. Clin Psychol Rev1988; 8:77–100.
11 Eysenck HJ, Eysenck SBG. Manual of the Eysenck PersonalityQuestionnaire (adult and junior). London: Hodderand Stoughton; 1975.
12 Shoukaire ZM. Body image scale. Cairo: Al-Anglo library, Faculty ofEducation, Tanta University; 2002.
13 Bech P. Rating scales for psychopathology, health status and quality of life.First edition. Berlin: Springer-Verlag; 1993.
14 Levesque R. SPSS programming and data management: a guide for SPSSand SAS Users. Fourth edition. Chicago: SPSS Inc; 2007.
15 Mehta V, Malhotra SK. Psychiatric evaluation of patients with psoriasisvulgaris and chronic urticaria. Ger J Psychiatr 2007; 10:104–110.
16 Woodruff PW, Higgins EM, Du Vivier AW, Wessely S. Psychiatric illness inpatients referred to a dermatology-psychiatry clinic. Gen Hosp Psychiatry1997; 19:29–35.
17 Bharath S, Shamasundar C, Raghuram R, Subbakrishna DK. Psychiatricmorbidity in leprosy and psoriasis–a comparative study. Indian J Lepr 1997;69:341–346.
18 Saleh HM, Salem SAM, El-Sheshetawy RS, Abd El-Samei AM. Comparativestudy of psychiatric morbidity and quality of life in psoriasis, vitiligo andalopecia areata. Egy Dermatol Online J 2008; 4:2.
19 Gupta MA, Schork NJ, Gupta AK, Kirkby S, Ellis CN. Suicidal ideation inpsoriasis. Int J Dermatol 1993; 32:188–190.
20 Olfson M, Lewis Fernandez R, Weissman MM, Feder A, Gameroff MJ,Pilowsky D, et al. Psychotic symptoms in an urban general medicine practice.Am J Psychiatry 2002; 159:1412–1419.
21 Cooper Patrick L, Crum RM, Ford DE. Identifying suicidal ideation in generalmedical patients. JAMA 1994; 272:1757–1762.
22 Gupta MA, Gupta AK. Psoriasis and sex: a study of moderately to severelyaffected patients. Int J Dermatol 1997; 36:259–262.
23 Akay A, Pekcanlar A, Bozdag KE, Altintas L, Karaman A. Assessment ofdepression in subjects with psoriasis vulgaris and lichen planus. J Eur AcadDermatol Venereol 2002; 16:347–352.
24 Fahmy E, Sami V, El_Sheikh H, Zohdy H, El_Said H. Some psychiatricaspects of psoriasis. The 14th International Conference of PsychosomaticMedicine; 1998.
25 Gupta MA, Gupta AK, Watteel GN. Perceived deprivation of socialtouch in psoriasis is associated with greater psychologic morbidity: an indexof the stigma experience in dermatologic disorders. Cutis 1999; 61:339–342.
26 Kirby B, Couzin R, Clark CM, Chalmers RJ, Griffiths CE. Lifestyle andpsoriasis. Br J Dermatol 1999; 141:969.
27 Krueger G, Koo J, Lebwohl M, Menter A, Stern RS, Rolstad T. The impact ofpsoriasis on quality of life: results of a 1998 National Psoriasis Foundationpatient-membership survey. Arch Dermatol 2001; 137:280–284.
28 Krueger GG, Feldman SR, Camisa C, Duvic M, Elder JT, Gottlieb AB, et al.Two considerations for patients with psoriasis and their clinicians: whatdefines mild, moderate and severe psoriasis? What constitutes a clinicallysignificant improvement when treating psoriasis? J Am Acad Dermatol 2000;43:281–285.
29 De Jong EM, Seegers BA, Gulinck MK, Boezeman JB, Van de Kerkhof PC.Psoriasis of the nails associated with disability in a large number of patients:results of a recent interview with 1728 patients. Dermatol 1996; 193:300–303.
30 Jowett S, Ryan T. Skin disease and handicap: an analysis of the impact ofskin conditions. Soc Sci Med 1985; 20:425–429.
31 Schmitt JM, Ford DE. Role of depression in quality of life for patients withpsoriasis. Dermatol 2007; 215:17–27.
32 Russo PA, Ilchef R, Cooper AJ. Psychiatric morbidity in psoriasis: a review.Australas J Dermatol 2004; 45:155–159. quiz 160-1.
84 Middle East Current Psychiatry

Comorbid psychiatric symptoms in psoriasis Mousa et al. 85

Psychiatric morbidity across perinatal period in a sample
of Egyptian womenDina Ibrahima, Zainab Bishrya, Ahmed Saada, Osama Salehb, Gihan El-Nahasa
and Mona El- Sheikha
Departments of aPsychiatry andbObestitrics and Gynecology, Faculty of Medicine,Ain Shams University, Cairo, Egypt
Correspondence to Dina Ibrahim, Department ofPsychiatry, Faculty of Medicine, Ain Shams University,Cairo, EgyptTel: + 0101002180; fax: + 26323866;e-mail: [email protected]
Received 4 September 2010Accepted 20 Novermber 2010
Middle East Current Psychiatry 2011, 18:86–96
Introduction
Pregnancy and puerperium are universal events that face the majority of women in the
reproductive age all around the world, during which major biological, hormonal, and
psychological events occur. This study was conducted to verify the hypothesis and
investigate (i) psychiatric morbidity in the perinatal period and its comparison with
controls. (ii) Is there difference in the psychiatric state across the four perinatal
periods?
Patients and methods
Accordingly, a study was conducted on 105 women who were pregnant or in the
postpartum period. They were selected from the outpatient clinic of Obstetrics and
Gynecology Hospital in the Ain Shams University. Control nonpregnant women were
also selected. They were subjected to Mini International Neuropsychiatric Interview-
Plus, Beck Depression Inventory, State-Trait Anxiety Inventory, and Edinburgh
Postnatal Depression Scale.
Results
Our study revealed that the prevalence of psychiatric disorders during the first and
second trimesters of pregnancy was not significantly different in comparison with
controls. However, it is much higher than controls during the third trimester with slight
decrease in the postpartum period. The most common diagnosis that was found is
adjustment disorder all through pregnancy. There were no significant differences
between psychiatric morbidity across the perinatal period.
Conclusion
We can conclude that women are vulnerable to psychiatric morbidity in the perinatal
period especially in the third trimester and they have high depressive and anxiety
states.
Keywords:
anxiety, depression, perinatal, postpartum, pregnancy, psychiatric morbidity
Middle East Curr Psychiatry 18:86–96�c 2011 Okasha Institute of Psychiatry, Faculty of Medicine, Ain Shams University2090-5408
IntroductionThe miracle of pregnancy and the transformation of
women into mothers have fascinated people from
antiquity to the present. However, it is only during the
past century that mental health professionals have begun
to contribute to our understanding of the psychological
aspects of pregnancy and the psychological phases that
the women pass through their journey to motherhood [1].
The past decade has witnessed the emergence of an
increased interest in women’s reproductive health and
development-related programs to improve reproductive
health across the globe. This phenomenon was primarily
catalyzed by the 1994 International Conference on
Population and Development in Cairo. This conference
solidified a new, comprehensive understanding of repro-
ductive health, largely owing to the efforts of participat-
ing policymakers, researchers, health service providers,
scholars, feminists, and health advocates from developed
and developing countries [2].
Pregnancy is a time of profound biological, psychological,
and interpersonal changes in the lives of many women,
and as the stages of psychological adaptation to the event
are not well understood, yet a stage of ambivalence
develops as a normal response to a major life transition for
which some women may fail to adapt, hence psychological
state develops [3].
Several psychiatric disorders may occur during the perinatal
period, such as anxiety, mood symptoms especially depres-
sion, obsessive–compulsive disorder, post-traumatic stress
disorder, sleep disorders forgetfulness, and postpartum
blues, depression, or psychosis postnatally as well [3].
The aims of the study was
(1) To verify that women are more prone to psychiatric
morbidity during the perinatal period;
(2) Is psychiatric morbidity more common during preg-
nancy and postpartum period, in comparison with
control group?
86 Original article
2090-5408 �c 2011 Okasha Institute of Psychiatry, Faculty of Medicine, Ain Shams University DOI: 10.1097/01.XME.0000395560.86192.c0

(3) Attempt to predict any specific risk factor that could
predispose psychiatric morbidity during the perinatal
period;
(4) Is there difference in the psychiatric state across the
four perinatal periods?
Patients and methodsStudy design
This study is a quantitative, cross-sectional case–control,
observational study at the Department of Obstetrics and
Gynecology, Ain Shams University Hospitals.
One hundred and sixty women participated in this study.
They were organized into five groups.
The case group represented pregnant women and was
divided into four groups; three groups represented three
trimesters of pregnancy (each group for a trimester) and
the fourth group represented the postpartum period.
A stratified random sample of 115 women who were
attending the outpatient clinic for obstetric antenatal
follow-up of pregnancy and the gynecology clinic and
family planning clinic for postpartum period follow-up or
for postpartum contraception were chosen.
Women who had a medical history and those with a posi-
tive psychiatric history were excluded; they were nine in
number.
(1) Pregnant women were selected from the obstetric
clinic on Sundays on a weekly basis.
(2) We chose the seventh and the 14th names of each
clinic, and according to the patient’s gestational age
she was placed in her group.
(3) The first group included women who were pregnant
and their gestational age ranged from first week to
13th week, which represented the first trimester
interval. It consisted of 25 women.
(4) The second group included women who were
pregnant and their gestational age ranged from 14th
week to 27th week, which represented the second
trimester interval. It consisted of 25 women.
(5) The third group included women who were pregnant
and their gestational age ranged from 28th week to
40th week or term, which represented the third
trimester interval. It consisted of 28 women.
(6) The fourth group represented women in the post-
partum period ranging from fourth week to 24th week
postpartum.
The control group (group 5) consisted of 50 Egyptian
married women in the child-bearing period who were not
pregnant and a minimum of 2 years had passed since the
previous postpartum period. They were matched for age
and other demographic variables. An informed verbal
consent was obtained from all participants.
All patients were subjected to:
(1) Complete personal, family, past history for both
medical and psychiatric histories were obtained.
(2) Full obstetric history of the current pregnancy and
previous pregnancies.
(3) General and neurological examinations.
(4) The Mini International Neuropsychiatric Interview
(M.I.N.I.-Plus).
(5) Then, all were requested to answer all questions of all
used questionnaires:
(a) Beck Depression Inventory (BDI).
(b) State-Trait Anxiety Inventory (STAI).
(c) Edinburgh Postnatal Depression Scale (EPDS).
Mini International Neuropsychiatric Interview-Plus [4]
M.I.N.I.-Plus was designed to provide a structured,
standardized, and summarized tool for axis 1 diagnoses
by Diagnostic and Statistical Manual of Mental Disorders,fourth edition (DSM-IV) and WHO international classifica-
tion of diseases, tenth revision (ICD-10) either in the
past or currently. It is divided into sections from A–Z, and
each has an English letter that represents different
diagnostic groups, major depression, dysthymia, bipolar
affective disorder, panic disorder, agoraphobia, social
phobia, obsessive–compulsive disorder, posttraumatic stress
disorder, substance and alcohol abuse, psychotic disorders,
premenstrual syndrome, and so on. Both required and
optional probes are provided, and skip outs are subjected
when no further questioning is warranted. Validity and
reliability studies were carried out to M.I.N.I.-Plus, and
revealed high validity and reliability values. In addition, it
has a benefit that it needs less time for application.
M.I.N.I.-Plus has been translated by Ghanem et al. [5], and
this Arabic version was used in this study.
Beck Depression Inventory [6]
It is often used in a self-rating form. It screens and
measures the depth and behavioral manifestations of
depression and consists of 21 items, each of which has
four responses of increasing severity.
Numerical values from 0–3 are assigned to each state-
ment to indicate the degree of severity. The total score is
then interpreted; a score from 0 to 20 is considered
normal, a score from 31 to 40 is considered mild, a score
from 31 to 41 is considered moderate, and a score from 42
to 63 or above is considered severe depression.
It is a widely used standardized, consistent instrument
with proven validity and reliability and has been used in
several studies. It has been translated to Arabic.
State-Trait Anxiety Inventory
The State-Trait Anxiety Inventory is a self-rating scale
that is composed of two parts, and is used to assess both
anxiety state and anxiety trait separately in adults
whether healthy, physically ill, or mentally ill [7]. Anxiety
state assessment reveals the degree of anxiety experi-
enced by the patient currently. In contrast, anxiety trait
assessment reveals the degree of anxiety generally and is
used to differentiate individual responses to stressors.
Each part of the scale is composed of 20 statements, and
the answers are graded into four degrees (never, little
Psychiatric morbidity across perinatal period Ibrahim et al. 87

amount, sometimes, always). Numerical scores from 1 to
4 are graded according to severity for each statement;
these values are summed up to give the total scale
ranging from 20 to 80 for each part. The scale has been
translated and validated, and this Arabic version
El beheery [8] was used in this study.
Edinburgh Postnatal Depression Scale [9]
It is a self-rating screening scale for depressive symptoms
during pregnancy and postpartum period. It is composed
of 10 items; each item is scored on a four-point scale 0–3,
the score ranges from 0 to 30. The scale rates the intensity
of depressive symptoms. Five items are concerned with
dysphoric mood, two with anxiety, and three with guilt,
and one each for not coping and suicidal ideas. A validated
Arabic version is used in this study.
Statistical analysis
All data were recorded and entered in a statistical
package on a compatible computer and varied. Analysis
was carried out using an SPSS version 15 (SPSS, IBM,
Chicago, Illinois, USA), 2007.
ResultsAs regards sociodemographic data:
(1) We found that the mean age for group 1 was
28.1 ± 5.473 standard deviation (SD) years, for
group 2 was 28.48 ± 5.471 SD years, for group 3 was
27.27 ± 5.023 SD years, and for group 4 was
28.44 ± 6.216 SD years, with a quite comparable
mean age for the control group (29.54 ± 0.186 SD
years; P = 0.381). In addition, there were no significant
differences between the four groups as regards other
data, that is, educational level, social class, and
occupations when they were compared with the control
group.
(2) Marriage duration showed a mean of 4.73 ± 4.221
SD years in the first four groups and a mean of
5.86 ± 3.608 SD years in the control group (P = 0.232).
In addition, on comparing the four groups with the
controls as regards obstetric history (number of parity,
history of abortion) there was no difference between
them.
Part 1
Group 1 (n = 25) represents pregnant women in the first
trimester recruited from the obstetric clinic for antenatal
follow-up.
Table 1 shows no significant difference between the two
groups as regards past history or family history of
psychiatric morbidity, but there were significant differ-
ences between them in having a history of premenstrual
dysphoric disorder (PMDD).
At the same time, current psychiatric morbidity assessed
using M.I.N.I.-Plus revealed that 32% of women in the
first trimester had an axis-I diagnosis; adjustment
disorder was the main diagnosis and this was of no
statistical difference when compared with the control
group as shown in Table 2.
On assessment of the depressive state in both groups
using BDI, there were very high significant differences
between both the groups (Table 3); moreover, using
EPDS 20% (n = 5) of women in the first trimester were
found to be depressed.
Table 3, on assessment of anxiety state and trait shows
that the women who were in their first trimester showed
Table 1 Psychiatric morbidity among women in the first trimester in comparison with the control group
Group 1 (n = 25) Group 5 (n = 50)
N Percentage N Percentage Chi-square value P value Significance
Family historyYes 1 4 3 6 1.563 0.211 NSNo 24 96 47 94
Past historyYes 3 12 2 4 0.315 0.575 NSNo 22 88 48 96
PMDDYes 10 40 33 66 4.606 0.032 SIGNo 15 60 17 34
N, number of patients; NS, not significant; PMDD, premenstrual dysphoric disorder; SIG, significant.
Table 2 Current psychiatric morbidity among women in the first trimester in comparison with the control group
Group 1 first trimester(n = 25)
Group 5 controls(n = 50)
Psychiatric morbidity N Percentage N Percentage Chi-square value P value Significance
None 17 68 43 86
4.061 0.255 NSAxis-I diagnosis 8 32 7 14Adjustment disorder-mixed type 4 16 3 6Adjustment disorder-depressive type 3 12 2 4Major depressive disorders 1 4 2 4
N, number of patients; NS, not significant.
88 Middle East Current Psychiatry

Table 3 Assessment of depressive state, anxiety state, and trait in women in the first trimester in comparison with the control group
Assessment toolGroup 1(n = 25)
Group 5(n = 50) t value P value Significance
BDIMean 14.04 7.14 4.501 0.000 VHSSD 8.193 5.047
Anxiety stateMean 48.56 35.78 4.986 0.000 VHSSD 11.023 10.179
Anxiety traitMean 47.00 38.00 4.389 0.000 VHSSD 9.587 7.706
BDI, Beck Depression Inventory; VHS, very high significance.
Table 4 Psychiatric morbidity among women in the second trimester in comparison with the control group
Group 2(n = 25)
Group 5(n = 50)
N Percentage N Percentage Chi-square value P value Significance
Family historyYes 1 4 3 6 0.132 0.716 NSNo 24 96 47 94
Past historyYes 2 8 2 4 2.027 0.155 NSNo 23 92 48 96
PMDDYes 14 56 33 66 0.712 0.399 NSNo 11 44 17 34
N, number of patients; NS, not significant; PMDD, premenstrual dysphoric disorder.
Table 5 Current psychiatric morbidity among women in the second trimester in comparison with the control group
Group 2 second trimester(n = 25)
Group 5 controls(n = 50)
Psychiatric morbidity N Percentage N Percentage Chi-square value P value
None 21 84 43 86
4.758 0.313Axis-I diagnosis 4 16 7 14Adjustment disorder-mixed type 2 8 3 6Adjustment disorder-depressive type 0 0 2 4Major depressive disorders 1 4 2 4Somatization 1 4 0 0Specific phobia 1 4 0 0
N, number of patients.
Table 6 Assessment of depressive state, anxiety state, and trait in women in the second trimester in comparison with the control
group
Assessment toolGroup 2(n = 25)
Group 5(n = 50) t value P value Significance
BDIMean 11.16 7.14 2.855 0.006 HSSD 6.962 5.047
EPDSMean 7.52 0SD 5.277
Anxiety stateMean 46.52 35.78 4.482 0.000 VHSSD 8.922 10.179
Anxiety traitMean 47.08 38.00 4.650 0.000 VHSSD 8.490 7.706
BDI, Beck Depression Inventory; EPDS, Edinburgh Postnatal Depression Scale.
Psychiatric morbidity across perinatal period Ibrahim et al. 89

a mean score of 48.56 ± 11.023 SD compared with a mean
score of 35.78 ± 10.179 SD in the control group, and this
difference was statistically of high significance (P = 0.000).
Part 2
Group 2 represents pregnant women in their second
trimester; there were 25 women. They were compared
with the control group (group 5, n = 50).
Table 4 shows no significant difference between the two
groups as regards past history or family history of psychiatric
morbidity, but there were significant differences between
them in having a history of PMDD.
At the same time, the current psychiatric morbidity that
was assessed using M.I.N.I.-Plus revealed that 16% of
women in the second trimester had an axis-I diagnosis;
adjustment disorder was the main diagnosis and this was
of no statistical difference when compared with the
control group as shown in Table 5.
On BDI, the scores showed a mean value of 11.16 ± 6.962
SD compared with the controls’ mean score (7.14 ± 5.047
SD); this was statistically highly significant (P = 0.006) as
shown in Table 6. There were 16% (n = 4) of women
having scores greater than 20 according to the cutoff score
of BDI, and they were considered to be depressed.
Table 7 Psychiatric morbidity among women in the third trimester in comparison with the control group
Group 3(n = 28)
Group 5(n = 50)
N Percentage N PercentageChi-square
value P value Significance
Family historyYes 1 3.6 3 6 0.218 0.641 NSNo 27 96.4 47 94
Past historyYes 2 7.15 2 4 0.770 0.380 NSNo 26 92.85 48 96
PMDDYes 16 57.1 33 66 0.603 0.437 NSNo 12 42.9 17 34
N, number of patients; NS, not significant; PMDD, premenstrual dysphoric disorder.
Table 8 Current psychiatric morbidity among women in the third trimester in comparison with the control group
Group 3 third trimester(n = 28)
Group 5 controls(n = 50)
Psychiatric morbidity N Percentage N Percentage Chi-square value P value Significance
None 16 57.1 43 86 26.305 0.000 VHSAxis-I diagnosis 12 42.9 7 14Adjustment disorder-mixed type 4 14.2 3 6Anxiety disorder 3 10.7 0 0Major depressive disorders 2 7.2 2 4Post-traumatic stress disorder 2 7.2 0 0Specific phobia 2 7.2 0 0Social phobia 1 3.6 0 0Adjustment disorder anxiety type 0 0.0 2 4
N, number of patients.
Table 9 Assessment of depressive state, anxiety state, and trait in women in the third trimester in comparison with the control group
Assessment toolGroup 3(n = 28)
Group 5(n = 50) t value P value Significance
BDIMean 15.36 7.14
4.528 0.000 VHSSD 10.962 5.047EPDS
Mean 10.79SD 6.713
Anxiety stateMean 50.61 35.78
5.583 0.000 VHSSD 12.974 10.179Anxiety trait
Mean 48.86 38.004.775 0.000 VHSSD 12.385 7.706
BDI, Beck Depression Inventory; EPDS, Edinburgh Postnatal Depression Scale.
90 Middle East Current Psychiatry

Table 6, on assessment of anxiety state shows that the
women who were in their second trimester showed a
mean score of 46.52 ± 8.922 SD compared with a mean
score of 35.78 ± 10.179 SD in the control group, and this
difference was statistically of high significance (P = 0.000).
As regards anxiety trait, the women in their second trimester
showed a mean score of 47.08 ± 8.490 SD compared with
a mean score of 38.00 ± 7.706 SD in the control group,
and this difference was statistically highly significant
(P = 0.000).
Part 3
Group 3 represents pregnant women in their third trimester;
there were 28 women. They were compared with the control
group (group 5), and they were 50 in number.
Table 10 Psychiatric morbidity among women in the postpartum period in comparison with the control group
Group 4(n = 27)
Group 5(n = 50)
N Percentage N Percentage Chi-square value P value Significance
Family historyYes 2 7.4 3 6
0.057 0.811 NSNo 25 92.6 47 94Past history
Yes 1 3.7 2 40.770 0.380 NSNo 26 92.85 48 96
PMDDYes 14 51.9 33 66
1.476 0.224 NSNo 13 48.1 17 34Postpartum blues
Yes 10 37.0No 17 63.0
N, number of patients; NS, not significant; PMDD, premenstrual dysphoric disorder.
Table 11 Current psychiatric morbidity among women in the postpartum period in comparison with the control group
Group 4 postpartum(n = 27)
Group 5 controls(n = 50)
Psychiatric morbidity N Percentage N Percentage Chi-square value P value
None 17 63.0 43 86 11.049 0.087Axis-I diagnosis 10 37.0 7 14Adjustment disorder-mixed type 3 11.1 3 6Anxiety disorder 1 3.7 0 0Major depressive disorders 1 3.7 2 4Post-traumatic stress disorder 2 7.4 0 0Specific phobia 2 7.4 0 0Social phobia 1 3.7 0 0Adjustment disorder anxiety type 0 0.0 2 4Postpartum depression 1 3.7 0 0Postpartum depression with psychotic features 1 3.7 0 0Postpartum psychosis 1 3.7 0 0
N, number of patients.
Table 12 Assessment of depressive state, anxiety state, and trait in females in the postpartum period in comparison with the control
group
Assessmenttool
Group4
(n = 27)
Group5
(n = 50) t valueP
value Significance
BDIMean 17.52 7.14 6.101 0.000 VHSSD 9.916 5.047
EPDSMean 9.37SD 6.840
Anxiety stateMean 47.78 35.78 4.711 0.000 VHSSD 11.524 10.179
Anxiety traitMean 48.19 38.00 4.443 0.000 VHSSD 12.404 7.706
BDI, Beck Depression Inventory; EPDS, Edinburgh Postnatal Depression Scale.
Psychiatric morbidity across perinatal period Ibrahim et al. 91

Table 7 shows no significant difference between the two
groups as regards past history or family history of
psychiatric morbidity, but there were significant differ-
ences between them in having a history of PMDD.
At the same time, the current psychiatric morbidity
assessed using M.I.N.I.-Plus revealed that 42.9% of
women in the third trimester had an axis-I diagnosis;
adjustment disorder was the common diagnosis, and
when compared with the control group there were
significant statistical differences as shown in Table 8.
On BDI, the scores showed a mean value of
15.36 ± 10.962 SD compared with the controls’ mean
score (7.14 ± 5.047 SD), this was statistically highly
significant (P = 0.006) as shown in Table 9. There were
32.1% (n = 9) of women having scores greater than 20
according to the cutoff score of BDI, and they were
considered to be depressed.
Table 9, on assessment of anxiety state, the women who
were in their third trimester showed a mean score of
50.61 ± 12.974 SD compared with the mean score in the
control group (35.78 ± 10.179 SD), and this difference was
statistically of high significance (P = 0.000). As regards
anxiety trait, the women in their third trimester showed a
mean score of 48.86 ± 12.385 SD compared with a mean
score of 38.00 ± 7.706 SD in the control group, and this
difference was statistically highly significant (P = 0.000).
Part 4
Group 4 represents women in the postpartum period
from 2 weeks to 24 weeks postpartum; there were 27
women. They were compared with the control group
(group 5); they were 50 in number.
Table 10 shows no significant difference between the two
groups as regards past history or family history of
psychiatric morbidity, but there were significant differ-
ences between them in having a history of PMDD.
At the same time, current psychiatric morbidity assessed
using M.I.N.I.-Plus revealed that 37% of women in the
postpartum period had an axis-I diagnosis; adjustment
disorder was the common diagnosis, and when compared
with the control group there were no significant statistical
difference as shown in Table 11.
On BDI, the scores showed a mean value of 17.52 ± 9.916
SD compared with the controls’ mean score (7.14 ± 5.047
SD); this was statistically highly significant (P = 0.006) as
shown in Table 12. Of all the women, 40.7% (n = 11) had
scores greater than 20 according to the cutoff score of
BDI, and they were considered to be depressed.
Table 12, on assessment of anxiety state shows that the
women who were in their postpartum period showed a
mean score of 47.78 ± 11.524 SD compared with a mean
score of 35.78 ± 10.179 SD in the control group, and
this difference was statistically of high significance
(P = 0.000). As regards anxiety trait, they showed a mean
score of 48.19 ± 12.404 SD compared with a mean score
of 38.00 ± 7.706 SD in the control group; this difference
was statistically highly significant (P = 0.000).
Part 5
In this part, we try to answer the question whether there
is any difference between different groups (three
trimesters and the postpartum period) in the depressive
state, anxiety state, and trait.
It is shown that the highest prevalence of depression and
psychiatric morbidity is in the third trimester, followed by
the postpartum period, and the least in prevalence is the
second trimester as shown in Table 13.
DiscussionAlthough pregnancy is a common event for reproductive-
age women, surprisingly little has been published about
the physical and emotional changes that typically occur
during pregnancy and the postpartum period in the
literature [10,11].
Perinatal mental health refers to the emotional well being
of a mother, her partner, and her infant, from conception
until 24 months postpartum. Transitional life stages also
represent times of increased vulnerability, and a degree of
anxiety and a labile mood can be expected at these times.
However, they are also associated with increased vulner-
ability to more severe mental health disturbances.
Table 13 Shows comparison between the four groups as regards depressive state, anxiety state, and trait scores, it showed no
statistical difference between different groups
ScoresGroup 1(n = 25)
Group 2(n = 25)
Group 3(n = 28)
Group 4(n = 27)
F valueANOVA P value Significance
EPDSMean 8.08 7.52 10.79 9.37 1.403 0.246 NSSD 6.298 5.2777 6.713 6.840
BDIMean 14.04 11.16 15.36 17.52 2.158 0.098 NSSD 8.193 6.962 10.962 9.916
Anxiety stateMean 48.56 46.52 50.61 47.78 0.619 0.604 NSSD 11.023 8.922 12.974 11.524
Anxiety traitMean 47.00 47.08 48.86 48.19 0.179 0.910 NSSD 9.587 8.490 12.385 12.404
ANOVA, analysis of variance; BDI, Beck Depression Inventory; EPDS, Edinburgh Postnatal Depression Scale; NS, not significant.
92 Middle East Current Psychiatry

During this time, women (and their partners) may
experience difficulties ranging from mild, transient anxiety,
or depression to more severe psychiatric illness [12].
Our results were divided into four parts; each part
addresses one trimester of the three trimesters of
pregnancy and the postpartum period. These partitions
were considered in a trial to associate the results of each
part to the nature of changes of each stage of pregnancy
and postpartum period.
Psychiatric morbidity in the first trimester
Our results revealed that 32% of female patients in the
first trimester had an axis-I diagnosis, but that was not
significantly higher than controls. The most frequent
diagnosis was adjustment disorder mixed anxiety and
depression type (16%), depressive type (12%), major
depressive disorder (4%), and one case of double
depression (4%). These findings suggest that there is
no difference between prevalence of psychiatric disorders
among women in the first trimester and the women in the
general population, and this agrees with the opinion of
literature [13].
During the first trimester, it can be particularly difficult
to diagnose depression because of the overlap between
symptoms of pregnancy and somatic symptoms of depres-
sion. Bennett et al. [13] reported a rate of depression
during the first trimester was found by Birndorf et al. [14]
to be 24.6% using BDI, and this agrees with our findings.
When assessing the anxiety state and trait, it was found
that there were very high significant differences between
women in the first trimester in comparison with controls.
There were no researches found assessing anxiety
symptomatology. The available researches only assessed
specific anxiety disorders such as obsessive–compulsive
disorder or panic disorder course during pregnancy in
well-known patients with these disorders.
In a trial to find sociodemographic correlates with
depression and anxiety states, we found that the
depressive state was positively correlated with occupa-
tional differences; women who had professional occupa-
tions had higher levels of depressive state. Similar finding
was found by Felice et al. [15], and postulated it as it is
due to the trial of the women to adjust with her new
condition.
Psychiatric morbidity in the second trimester
In addition, in our study we found that 16% of women in
the second trimester had axis-I diagnosis, approximately
half of the patients (8%) had adjustment disorder, major
depressive disorder (4%), somatization (4%), specific
phobia (4%), and this rate was not statistically significant
different from controls. The most common diagnosis was
adjustment disorder. Nearly the same findings were
reported by Andersson et al. [16].
Evaluation of the depression state revealed statistically
higher scores in women in the second trimester than
controls. In addition, depressive symptomatology rates
were 16% when assessed by both EPDS and BDI, and
those 16% were only having a mild degree of depression
according to the severity degrees of BDI. The same rate
was found by Salamero et al. [17].
Gavin et al. [18] in a systematic review of perinatal
depression prevalence and incidence reported that
prevalence of both minor and major depressions in the
first trimester is 11%, which drops to 8.5% in the second
trimester. We also found the same drop of the depressive
symptomatology from the first trimester 20–25%, which
dropped to 16% in the second trimester, but the difference
in our rates is postulated to the different study populations
and the different assessment tools that were used.
When assessing anxiety state and trait, it was found that
there were very high significant differences between
women in the second trimester in comparison with
controls.
On studying socidemographic correlates, there was
significantly positive correlation between low socioeco-
nomic class and severity of depression. This was in
agreement with all studies assessing depression in the
perinatal period, as they considered that low socio-
economic status is a risk factor for depression in the
perinatal period, and those of low socioeconomic status
were considered to be a high-risk group and rates of
depression may reach 50% [13,19].
Psychiatric morbidity in the third trimester
In the third trimester, we found that the psychiatric
morbidity rate increased and reached 42.9% of the sample
having axis-I diagnosis, and this rate was significantly
higher than controls. With adjustment disorder being the
most common diagnosis 14.2%, anxiety disorder 10.7%,
the rate of major depressive disorder increased to 7.2%
including patients who were having comorbidity (having
both depression and anxiety).
Meanwhile, the rate of depressive symptoms increased as
well; it reached 32.1–42.9% when assessed by BDI and
EPDS, respectively. The mean score of BDI was
significantly higher than controls. These findings suggest
that the progression of pregnancy may have an impact on
the status of depression, and this agrees with Bennett
et al’s findings. [13]. In addition, we suggest that the
mechanism of depression progression in the third
trimester is related to the high levels of corticotropin-
releasing hormone, which reaches its highest levels in the
third trimester [13].
When assessing the anxiety state and trait, it was found
that there were very high significant differences be-
tween women in the third trimester in comparison with
controls. Unfortunately, there were no researches found
assessing anxiety symptomatology for comparative results.
This high anxiety state can be explained by the well-
known high comorbidity between depression and anxiety,
and also by the high level of cortisol hormonal level
during pregnancy specifically during the third trimester,
and this hormone increases the sense of stress and stress
reaction.
Psychiatric morbidity across perinatal period Ibrahim et al. 93
Meanwhile, we found that the BDI score was directly
correlated with a history of PMDD. This agrees with the
literature and other researchers’ findings, as they reported
that history of PMDD is considered to be a risk factor for
depression during pregnancy [20].
Psychiatric morbidity in the postpartum period
We found that the rate of postpartum blues in our sample
is 37%; the universal ranges of postpartum blues is
approximately 29–80% [21]. This wide range of variation
can be attributed to cultural factors and the presence of
high social and familial support after childbirth that may
ameliorate the symptoms rapidly. The same percentage of
postpartum blues in Egypt was reported by El Akabawi
et al. [22]; another study in Egypt found lower rates (8%)
of postpartum blues, which was explained by methodo-
logical differences [23].
Okasha et al. [23], in a descriptive, epidemiological study of
the postpartum psychiatric disorders in Egypt, found that
the incidence of postpartum psychiatric disorders was 4.3%.
Most of these findings are in accordance to our findings.
Using the self-report tools, we found that the rate of
depressive symptomatology in the postpartum period was
40.7% according to the cutoff scores of both BDI and
EPDS. In addition, the mean scores in both the question-
naires were statistically very highly significant than those
of the controls.
In a recent study in Brazil, researchers found that the rate
of postpartum depression is 20.7%, which as they
reported is considered higher than rates recorded in
developed countries, and they deduced that low income
is a risk for the development of postpartum depression in
developing countries [24].
In addition, researchers suggested that postpartum
depression is a continuum with prenatal depression,
which needs further investigation with longitudinal
cohort study to follow these variations.
However, the finding of an increased risk commencing
shortly after delivery suggests that childbirth and its im-
mediate psychosocial sequelae are likely to be important
causal factors for nonpsychotic depression [25].
On the assessment of anxiety state and trait postpartum, we
found very high significant levels in comparison with
controls; this finding agrees with Ahmed et al’s. [26] findings.
Furthermore, obstetric variables as regards parity or way
of labor were not significantly correlated to the severity of
the depressive state and anxiety state and trait; this
agrees with the findings of Ahmed et al. [26], and Felice
et al. [15].
On comparing the four periods of the perinatal period, we
did not find any significant difference between them as
regards severity of depressive or anxiety state and trait
despite being significantly higher than controls. However,
we observed that the highest mean scores were in the
third trimester, followed by the postpartum period and
the lower scores were in the second trimester. Further-
more, the rate of depressed patients and patients with
axis-I diagnosis was highest in the third trimester,
followed by the postpartum period, and the least
percentages were in the second trimester. So we deduced
that third trimester is the most critical period in pregnancy
where vulnerability to develop depression, anxiety or
other psychiatric disorder reaches its peak during the
third trimester, with slight decrease of this vulnerability
in the postpartum period. The least vulnerability is
during the second trimester, which is considered as an
interval for emotional, physical, and psychological stabi-
lity during pregnancy. Therefore, we suggest that long-
itudinal prospective study on a larger number of patients
will show the onset and course of symptomatology more
clearly. Similar findings were reported by Evans et al. [27]
and Josefsson et al. [28] in their longitudinal studies, and
they recommended that early screening during pregnancy
and intervention when needed may decrease the incidence
of postpartum psychiatric disorders.
ConclusionFrom our research, we concluded that the prevalence of
psychiatric disorders during the first and second trime-
sters of pregnancy is as common as in the general
population. However, it is much higher during the third
trimester with a slight decrease in the postpartum period.
The most common diagnosis that was found is adjust-
ment disorder. Therefore, we suggest that social support
may improve their condition.
All through the perinatal period there was high pre-
valence of depressive and anxiety symptomatology.
In addition, we found that depressed patients had higher
harm avoidance, lower persistence, self directedness, and
cooperativeness.
Thus, we agree with regard to increased rate of
psychiatric morbidity in the perinatal period and how
personality affects their presentation.
There is no conflict of interest to declare.
References1 Philipp Diane A, Carr Melanie L. Normal and medically complicated
pregnancies. In: Stotland NL, Stewart DE, editors. Psychological aspectsof women’s health care: the interface between psychiatry and obstetrics andgynecology. 2nd ed. Washington, DC: American Psychiatric Publishing;2001. pp. 13–32.
2 Kaddour A, Hafez R, Zurayk H. Women’s perceptions of reproductive healthin three communities around Beirut, Lebanon. Reprod Health Matters 2005;13:34–42.
3 Miller Laura J. Psychiatric disorders during pregnancy. In: Stotland NL,Stewart DE, editors. Psychological aspects of women’s health care: theinterface between psychiatry and obstetrics and gynecology. 2nd ed.Washington, DC: American Psychiatric Publishing; 2001. pp. 51–66.
4 Sheehan DV, Lecrubier Y, Sheehan KH, Amorim P, Janavs J, Weiller E,et al. The Mini-International Neuropsychiatric Interview (M.I.N.I.): the develop-ment and validation of a structured diagnostic psychiatric interview for DSM-IV and ICD-10. J Clin Psychiatry 1998; 59 (Suppl 20):22–33. quiz 34–57.
5 Ghanem MH, Al Behary AA, Al Mergany H, Ibrahim M, Abdel Hakim Z,Ali AF. The Arabic version of the Mini International Neuropsychiatric Interview(M.I.N.I.). Egypt: Psychiatry Department, Ain Shams University; 2000.
6 Beck AT, Ward CH, Mendelson M, Mock J, Erbaugh J. An inventory formeasuring depression. Arch Gen Psychiatry 1961; 4:561–571.
94 Middle East Current Psychiatry

7 Spielberger CD, Gorsuch RL, Lushene RE. Manual for the state-trait anxeityinventory. Palo Alto, CA: Consulting psychologists press.1970.
8 El beheery Abdel Raquib: Stait trait anxeity inventory for adults translationinstructions manual validity and reliability study elnahda library Cairo. Egypt.
9 Cox JL, Holden JM, Sagovsky R. Detection of postnatal depression.Development of the 10-item Edinburgh postnatal depression scale. Br JPsychiatry 1987; 150:782–786.
10 Otchet F, Carey MS, Adam L. General health and psychological symptomstatus in pregnancy and the puerperium: what is normal? Obstet Gynecol1999; 94:935–941.
11 Haas JS, Jackson RA, Fuentes Afflick E, Stewart AL, Dean ML, Brawarsky P,et al. Changes in the health status of women during and after pregnancy.J Gen Intern Med 2005; 20:45–51.
12 Kowalenko N, Barnett B, Fowler C, Matthey S. The perinatal period: earlyinterventions for mental health. In: Kosky R, O’Hanlon A, Martin G, Davis C,editors. Clinical approaches to early intervention in child and adolescentmental health. Adelaide: Australian Early Intervention Network for MentalHealth in Young People; 2000. pp. 8–20.
13 Bennett HA, Einarson A, Taddio A, Koren G, Einarson TR. Prevalence ofdepression during pregnancy: systematic review. Obstet Gynecol 2004;103:698–709.
14 Birndorf CA, Madden A, Portera L, Leon AC. Psychiatric symptoms,functional impairment and receptivity toward mental health treatmentamong obstetrical patients. Int J Psychiatry Med 2001; 31:355–365.
15 Felice E, Saliba J, Grech V, Cox J. Factors involved in onset and recoveryfrom postnatal depression. Malta Med J 2006; 18:12–16.
16 Andersson L, Sundstrom Poromaa I, Wulff M, Astrom M, Bixo M. Implicationsof antenatal depression and anxiety for obstetric outcome. Obstet Gynecol2004; 104:467–476.
17 Salamero M, Marcos T, Gutierrez F, Rebull E. Factorial study of the BDI inpregnant women. Psychol Med 1994; 24:1031–1035.
18 Gavin NI, Gaynes BN, Lohr KN, Meltzer Brody S, Gartlehner G, Swinson T.Perinatal depression: a systematic review of prevalence and incidence.Obstet Gynecol 2005; 106:1071–1083.
19 Verkerk GJ, Denollet J, Van Heck GL, Van Son MJ, Pop VJ. Personality factorsas determinants of depression in postpartum women: a prospective 1-yearfollow-up study. Psychosom Med 2005; 67:632–637.
20 Ryan D, Milis L, Misri N. Depression during pregnancy. Can Fam Physician2005; 51:1087–1093.
21 Buist A, Ross L, Steiner M. Anxiety and mood disorders in pregnancy and thepostpartum period. In: Castle D, Kulkarni J, Abel KM, Goldstein J, editors.Mood and anxiety disorders in women. 1st ed. Cambridge: CambridgeUniversity Press; 2006. pp. 136–162.
22 El Akabawi AS, Khattab TY, Amin Y, Sayed S, Khater UM. The nature andassociates of maternity blues in an Egyptian culture. Egypt J Psychiatry1988; 11:57–80.
23 Okasha A, Younis N, Youssef I, Khalil AH, Demerdash A. Postpartumpsychiatric disorders: a descriptive and epidemiological study. Egypt JPsychiatry 1987; 10:161–174.
24 Tannous L, Gigante LP, Fuchs SC, Busnello EDA. Postnatal depression inSouthern Brazil: prevalence and its demographic and socioeconomicdeterminants. BMC Psychiatry 2008; 8:2–8.
25 Hayes MJ, Roberts S, Davare A. Transactional conflict betweenpsychobiology and culture in the etiology of postpartum depression. MedHypotheses 2000; 54:7–17.
26 Ahmed MM, Salem SS, Ragheb K, Shaheen O, Askar M. Maternity blues:psychometric approach. Egypt J Psychiatry 1995; 18:13–18.
27 Evans J, Heron J, Francomb H, Oke S, Golding J. Cohort study of depres-sed mood during pregnancy and after childbirth. BMJ 2001; 323:257–260.
28 Josefsson A, Berg G, Nordin C, Sydsjo G. Prevalence of depressivesymptoms in late pregnancy and postpartum. Acta Obstet Gynecol Scand2001; 80:251–255.
Psychiatric morbidity across perinatal period Ibrahim et al. 95

•
•
•
•
96 Middle East Current Psychiatry

Change in quality of life after cognitive behavior therapy
for anxiety disorders: an Egyptian prospective studyMohamed Ghanem, Mona Mansour, Mohamed Fekry, Hisham Hatata,Ghada El-Khouly and Reham Aly
Department of Psychiatry, Faculty of Medicine,Ain Shams University, Cairo, Egypt
Correspondence to Ghada El-Khouly, Department ofPsychiatry, Faculty of Medicine, Ain ShamsUniversity, Cairo, EgyptTel/fax: + 20 26845439;e-mail: [email protected]
Received 25 October 2010Accepted 4 January 2011
Middle East Current Psychiatry 2011, 18:97–108
Introduction
Despite increased prevalence, chronic course, and high morbidity rate of anxiety
disorders, little is known about the effectiveness of various therapeutic approaches
especially cognitive behavior therapy (CBT) in improving the quality of life of anxiety
patients. This study aimed at quantifying the impact of CBT in anxiety disorder patients
on quality of life (QOL), and to address the question of its long-term effect.
Methods
Forty patients diagnosed with anxiety disorders according to the standard Structured
Clinical Interview (SCID-I) of DSM-IV were asked to complete the DSM-IV semi-
Structured Clinical Interview for diagnosis section for anxiety and depression,
sociodemographic sheet, medical history sheet, and Beck Depression Inventory. A
structured and manual CBT protocol was applied to all participants. An assessment
battery tapping QOL issues and the major clinical dimensions of the anxiety disorders
was administered at baseline pretreatment (week 0), posttreatment (week 9), and at
6-month follow-up (week 35) to evaluate treatment outcomes on QOL and test its
durability. Two male patients dropped from continuing their CBT protocol.
Results
CBT had a positive clinical outcome on anxiety disorders, which was significantly
evident in changes in clinical diagnosis, changes in used doses of medications,
and changes in outcome tools’ scores. With regard to QOL, CBT made statistical
significant improvement in the QOL questionnaire score for both anxiety disorders as
a whole and subtypes of anxiety disorders posttreatment and at 6-month follow-up.
There was a statistically significant difference in improvement between pretreatment
and posttreatment, pretreatment and follow-up, but not between posttreatment and
follow-up. QOL in anxiety patients was negatively correlated with pretreatment
duration of anxiety symptoms and Beck Depression Inventory scores.
Conclusion
We concluded that CBT is effective for the management of anxiety disorders with short
term (8 weeks) and long term (35 weeks), with positive impact on QOL. Considering
the limited number of studies in this area, it is recommendable to set studies designed
to evaluate a diverse range of QOL indicators across different interventions in anxiety
disorder patients.
Keywords:
anxiety, cognitive behavior therapy, depression, obsessive–compulsive disorder,
quality of life
Middle East Curr Psychiatry 18:97–108�c 2011 Okasha Institute of Psychiatry, Faculty of Medicine, Ain Shams University2090-5408
IntroductionLifetime prevalence of anxiety disorders is 16.6% all over
the world [1]. In Arab, we lack such global data; however,
in Lebanon, the Evaluation of the Burden of Ailments
and Needs of the Nation study was carried out on a
nationally representative sample of the Lebanese popula-
tion and anxiety disorders were found in 16.7% of their
sample [2]. In Morocco [3], we found that 25.5% met
criteria of at least one current anxiety disorder distributed
as 2% panic disorder (PD)_, 7.6% agoraphobia, 3.4% social
phobia, 6.1% obsessive–compulsive disorder (OCD), 3.4%
posttraumatic stress disorder, and 4.3% generalized
anxiety disorder in the studied sample.
In Egypt, anxiety states are common [4], and were
diagnosed in 36% of university students [5], and
represented approximately 22.6% of diagnoses made in
a psychiatric outpatient clinic in a selective Egyptian
sample [6]. The most common symptoms were worrying
(82%), irritability (73%), free-floating anxiety (70%),
depressed mood (65%), tiredness (64%), restlessness
(63%), and anergia and retardation (61%). Panic attacks
were present in 30%, situational anxiety in 35%, specific
Original article 97
2090-5408 �c 2011 Okasha Institute of Psychiatry, Faculty of Medicine, Ain Shams University DOI: 10.1097/01.XME.0000395561.63321.ee
phobias in 37%, and avoidance in 53% of the sample [7].
In a recent initial study for the National Survey of
Prevalence of Mental Disorders in Egypt conducted by
Ghanem et al. [8], anxiety disorders were the second most
prevalent psychiatric disorders after mood disorders
diagnosed in 4.75% of the surveyed sample. PDs were
present in 0.68%, agoraphobia in 0.50%, social anxiety
disorders (SAD) in 0.23%, specific phobia in 1.35%, OCD
in 0.68%, posttraumatic disorder in 0.11%, generalized
anxiety disorder (GAD) in 0.91%, and mixed anxiety
depression in 0.29% of sample.
Anxiety disorders are usually chronic disorders that are
associated with enduring symptoms with significant
disability, distress, and impairment in social functioning
often many years after disease onset [9]. Onset is
frequently early in life, between the age of 20 and 30
years with large health-care costs for the individual and
the community [10]. Comorbidity with depression is high
and an important predictor of the outcome of anxiety
disorders [11].
Despite increased prevalence, chronic course of anxiety
disorders, and the associated high rate of morbidity, little
is known about quality of life (QOL) in anxiety disorders.
The effectiveness of various therapeutic approaches to
improve the QOL in anxiety patients is not well
understood.
QOL, including a patient’s sense of well being and
function, can be affected by thoughts, behavior, and poor
coping skills and associated depressive symptoms in
different anxiety disorders. A major limitation of treating
anxiety disorders with medication alone is that patients
do not come to evaluate their conditioned dysfunctional
patterns of behavior or their unhealthy coping strategies,
which may be the root of maintenance of their suffering
with poorer QOL [12].
CBT is predicated on the philosophy of the ancient
Greeks, which stipulates that ‘Nothing in life is actually
bad, lest we perceive it to be so’. Fundamentally, it is
based on the assumption that behavior develops and is
maintained according to the principles of learning. On
the basis of this, a model of the causes of each anxiety
disorder could be formulated in terms of dysfunctionally
learned cognitions and behaviors [13,14].
CBT is a directive form of counseling that uses a collaborative
process, which is termed ‘guided discovery’ [15]; this
makes the individual aware of his/her own thinking style,
its strengths and limitations, thus acquiring him/her new
ways of thinking and alternative ways of behaving. By
using this newly acquired knowledge, the individual
develops more effective and satisfying ways of dealing
with challenges with a positive impact on QOL [16].
Few studies have compared the impact of different
anxiety disorders on different domains of QOL; however,
instruments generally used to assess QOL in this
population have varying specificity, considerable redun-
dancy, and, occasionally, inappropriate content [17].
Although the assessment of therapeutic outcome in the
published literature has been of high quality, including
multiple symptom indices and composite measures of
end-state functioning, the impact of CBT on anxiety
patients’ QOL is yet to be evaluated in practice [18].
The purpose of this study was to quantify the impact of CBT
in anxiety disorder patients on QOL and to address the
question of its duration. We hypothesized that treatment
would have a significant beneficial impact on QOL, and that
these gains would be maintained at follow-up.
Patients and methodsParticipants
All anxiety disorder patients presenting to the general
outpatient clinics of the Institute of psychiatry, Ain Shams
University hospital during April 2008 were invited to
participate in our study after obtaining a written informed
consent. Patients were excluded if age was less than 18
years, were uncooperative, had secondary anxiety disorder
either due to general medical condition and/or substance
abuse, had a current diagnosis of substance abuse within
the past 6 months, was a mentally subnormal patient as
clinically judged, had a current/history of acute fulminating
physical disorder, change in psychotropic medication type or
dose during the 12 weeks before treatment, unwillingness
to keep medication status stable all over the duration of
the study, evidence of other primary Axis I psychiatric
disorder, and/or previous CBT treatments and no any other
additional structured psychosocial therapies during the
treatment period.
The mean age of participants was 33.6 ± 10.2 years
ranging between 20 and 54 years. Twenty patients (50%)
were in the 20s group of age, 10 patients (25%) were in
the 30s group of age, seven (17.5%) were in the 40s group
of age, and three (7.5%) were in the 50s group of age. Of
the participants, 57.5% (23 of 40) were female patients
and 42.5% (17 of 40) were male patients; 80% (32 of 40)
passed a college degree of education and 20% (eight of
40) passed diploma degree; however all finished their
high school. Of the participants, 52.5% (21 of 40) were
married, 40% (16 of 40) were single, and 7.5% (three of
40) were divorced; 60% (24 of 40) were employed and
40% (16 of 40) were unemployed.
With regard to their clinical diagnoses, distribution
of subtypes of anxiety disorder as assessed by SCID-I
described as eight (20%) had OCD with a male-to-female
ratio (4 : 4), eight (20%) had PD with a male-
to-female ratio (3 : 5), six (15%) had GAD with a male-
to-female ratio (2 : 4), six (15%) had SAD with a
male-to-female ratio (4 : 2), six (15%) had posttraumatic
stress disorder (PTSD) with a male-to-female ratio
(2 : 4), and six (15%) had phobias with a male-to-female
ratio (2 : 4) (Fig. 1).
The duration of anxiety symptoms ranged from 1 month
to 17 years, with a mean of 7.8 ± 5.1 years; 27.5% (11 of
40) had a duration of less than 5 years, 50% (20 of 40) had
a duration ranged between 5 and 10 years, and 22.5%
(nine of 40) had a duration of more than 10 years.
Of the participants, 87.5% (35 of 40) were maintained
on psychotropic drugs before participating in the study,
98 Middle East Current Psychiatry
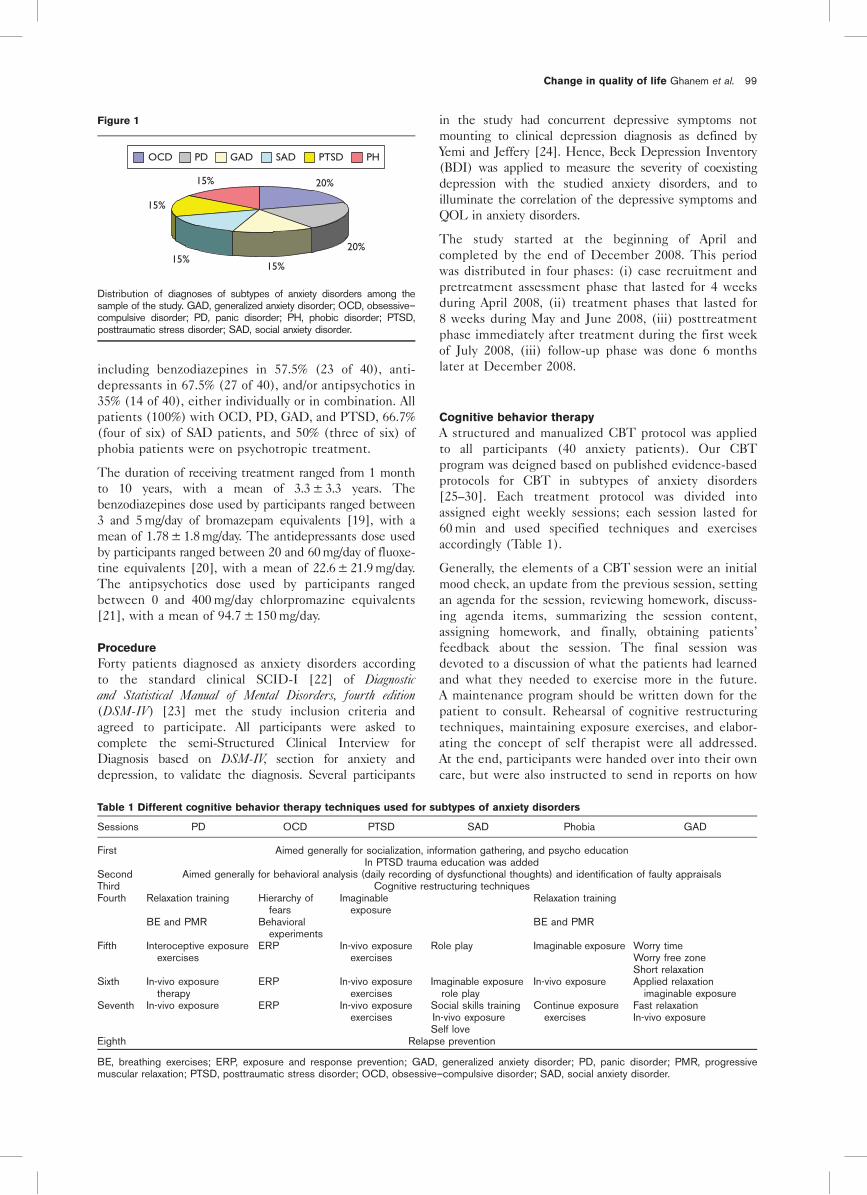
including benzodiazepines in 57.5% (23 of 40), anti-
depressants in 67.5% (27 of 40), and/or antipsychotics in
35% (14 of 40), either individually or in combination. All
patients (100%) with OCD, PD, GAD, and PTSD, 66.7%
(four of six) of SAD patients, and 50% (three of six) of
phobia patients were on psychotropic treatment.
The duration of receiving treatment ranged from 1 month
to 10 years, with a mean of 3.3 ± 3.3 years. The
benzodiazepines dose used by participants ranged between
3 and 5 mg/day of bromazepam equivalents [19], with a
mean of 1.78 ± 1.8 mg/day. The antidepressants dose used
by participants ranged between 20 and 60 mg/day of fluoxe-
tine equivalents [20], with a mean of 22.6 ± 21.9 mg/day.
The antipsychotics dose used by participants ranged
between 0 and 400 mg/day chlorpromazine equivalents
[21], with a mean of 94.7 ± 150 mg/day.
Procedure
Forty patients diagnosed as anxiety disorders according
to the standard clinical SCID-I [22] of Diagnosticand Statistical Manual of Mental Disorders, fourth edition(DSM-IV) [23] met the study inclusion criteria and
agreed to participate. All participants were asked to
complete the semi-Structured Clinical Interview for
Diagnosis based on DSM-IV, section for anxiety and
depression, to validate the diagnosis. Several participants
in the study had concurrent depressive symptoms not
mounting to clinical depression diagnosis as defined by
Yemi and Jeffery [24]. Hence, Beck Depression Inventory
(BDI) was applied to measure the severity of coexisting
depression with the studied anxiety disorders, and to
illuminate the correlation of the depressive symptoms and
QOL in anxiety disorders.
The study started at the beginning of April and
completed by the end of December 2008. This period
was distributed in four phases: (i) case recruitment and
pretreatment assessment phase that lasted for 4 weeks
during April 2008, (ii) treatment phases that lasted for
8 weeks during May and June 2008, (iii) posttreatment
phase immediately after treatment during the first week
of July 2008, (iii) follow-up phase was done 6 months
later at December 2008.
Cognitive behavior therapy
A structured and manualized CBT protocol was applied
to all participants (40 anxiety patients). Our CBT
program was deigned based on published evidence-based
protocols for CBT in subtypes of anxiety disorders
[25–30]. Each treatment protocol was divided into
assigned eight weekly sessions; each session lasted for
60 min and used specified techniques and exercises
accordingly (Table 1).
Generally, the elements of a CBT session were an initial
mood check, an update from the previous session, setting
an agenda for the session, reviewing homework, discuss-
ing agenda items, summarizing the session content,
assigning homework, and finally, obtaining patients’
feedback about the session. The final session was
devoted to a discussion of what the patients had learned
and what they needed to exercise more in the future.
A maintenance program should be written down for the
patient to consult. Rehearsal of cognitive restructuring
techniques, maintaining exposure exercises, and elabor-
ating the concept of self therapist were all addressed.
At the end, participants were handed over into their own
care, but were also instructed to send in reports on how
Table 1 Different cognitive behavior therapy techniques used for subtypes of anxiety disorders
Sessions PD OCD PTSD SAD Phobia GAD
First Aimed generally for socialization, information gathering, and psycho educationIn PTSD trauma education was added
Second Aimed generally for behavioral analysis (daily recording of dysfunctional thoughts) and identification of faulty appraisalsThird Cognitive restructuring techniquesFourth Relaxation training
BE and PMR
Hierarchy offears
Behavioralexperiments
Imaginableexposure
Relaxation training
BE and PMR
Fifth Interoceptive exposureexercises
ERP In-vivo exposureexercises
Role play Imaginable exposure Worry timeWorry free zoneShort relaxation
Sixth In-vivo exposuretherapy
ERP In-vivo exposureexercises
Imaginable exposurerole play
In-vivo exposure Applied relaxationimaginable exposure
Seventh In-vivo exposure ERP In-vivo exposureexercises
Social skills trainingIn-vivo exposureSelf love
Continue exposureexercises
Fast relaxationIn-vivo exposure
Eighth Relapse prevention
BE, breathing exercises; ERP, exposure and response prevention; GAD, generalized anxiety disorder; PD, panic disorder; PMR, progressivemuscular relaxation; PTSD, posttraumatic stress disorder; OCD, obsessive–compulsive disorder; SAD, social anxiety disorder.
Figure 1
20%
20%
15%15%
15%
15%
OCD PD GAD SAD PTSD PH
Distribution of diagnoses of subtypes of anxiety disorders among thesample of the study. GAD, generalized anxiety disorder; OCD, obsessive–compulsive disorder; PD, panic disorder; PH, phobic disorder; PTSD,posttraumatic stress disorder; SAD, social anxiety disorder.
Change in quality of life Ghanem et al. 99

well they were able to keep to their maintenance
program.
Treatment integrity
Treatment integrity was rated by the senior researchers
on a random sample of sessions using a checklist for
assessing compliance with the treatment manual. Com-
pliance was high (i.e. more than 95% of exercises rated as
completed and consistent with manual description)
across all sessions that were assessed (n = 32). In
addition, we considered the competencies that are
required to deliver effective CBT as proposed by Roth
and Pilling [31].
Assessment
The sociodemographic sheet includes information about
age, sex, level of education, marital status, and occupa-
tion, and the medical history sheet includes information
about clinical diagnosis of anxiety disorder, duration of
symptoms, and current history of psychotropic drugs,
both type and dose.
An assessment battery tapping QOL issues and the major
clinical dimensions of the anxiety disorders was adminis-
tered at baseline pretreatment (week 0), posttreatment
(week 9) and at 6-month follow-up (week 35) to evaluate
treatment outcomes on QOL and test its durability.
Participants who did not meet the specified deadline
were reminded through e-mail and/or telephone.
Assessment battery
The assessment battery consisted of seven tools (self-
rating/therapist rating); one for QOL questionnaire, five
for measuring the anxiety outcome namely Hamilton
Anxiety Rating Scale (HAM-A), Beck Anxiety Inventory
(BAI), Penn State Worry Questionnaire (PSWQ), Lie-
bowitz Social Anxiety Scale (LSAS), and Yale-Brown
Obsessive Compulsive Scale (YBOCS), and one for
assessing the severity of associated depression namely
BDI-II. Along with these tools, results of the semi-
structured clinical interview were obtained and used as
indicators of change on the dependent variables.
All the study tools were translated and proved to be a
good interrater reliability with relative ease of adminis-
tration as shown in a pilot study that lasted for 3 months
(January to March 2008).
HAM-A is a 14-item test measuring severity of anxiety
symptoms with a cutoff score of 15 [32,33]; BAI is a 21-
item self-reporting instrument used to measure severity
of anxiety symptoms especially the panic ones with a
cutoff score 18.4 for female patients and 15.3 for male
patients [34–36]; PSWQ is a 16-item self-reporting
questionnaire designed to measure trait worry with a
cutoff score of 50 [37,38]; LSAS is a 24-item inventory
assessing fear and avoidance in several social situations
with a cutoff score of 30 [39,40]; and YBOCS is a 10-item
semistructured interview that yields symptom severity
scores separately for obsessions and compulsions with a
cutoff score of 16 [41].
BDI-II is a 21-item commonly used self-reporting
questionnaire for assessing the severity of depression
with cutoff scores 10, 19, higher than or equal to 30
indicative of mild-to-moderate, moderate-to-severe, and
very severe depression, respectively [42,43].
QOL questionnaire/interview [44] is a 7-item clinical tool
assessing the degree of efficiency and patient’s satisfac-
tion in several domains of life, such as general health,
social life, and work. Patients were instructed to rate the
personal importance of these domains. Patients were
asked to rate their satisfaction with these domains on a
scale ranging from 1 (very dissatisfied/very affected) to 5
(very satisfied/not at all affected). The QOL has been
validated on clinical samples and had good internal
consistency ( > 0.82) and test–retest reliability (70–0.80).
In addition, it possesses good convergent, discriminate,
and criterion-related validity [45]. The instrument is
sensitive enough to discriminate between mental health
and nonmental health community residents, and has been
used in several treatment evaluation studies. The cutoff
score of this questionnaire was calculated according to
Jacobson and Truax [46] to be 30 points.
Statistical analysis
Data coded and revised were introduced to an EXCEL
database to be later manipulated and analyzed using the
SPSS version 16 (SPSS, Inc., Chicago, IL, USA). Results
were analyzed for the whole sample except for dropped
out participants. For the sake of description, categorical
data were presented as frequency and percentage, and
continuous data as means, standard deviation, and 95%
confidence limit. This was followed by a graphic
representation whenever needed to assess the distribu-
tion of the data and determine an appropriate statistical
test for inferential statistical analysis. Independent
sample t-test (Student’s t-test), w2 test, one-way repeated
measures analysis of variance (ANOVA), and two-factor
repeated measures (ANOVA) were used in inferential
statistical analysis of our results. An effect size (ES) is a
measure of the strength of the relationship between two
variables in a statistical population. It estimates the
strength of an apparent relationship, rather than assigning
a significance level reflecting whether the relationship
could be due to chance. The ES was computed using
Cohen’s d-tests [47]. Pearson’s correlation coefficient was
calculated to determine the strength of correlation.
Statistical significance level was set at a value of less than
0.05; highly significant level at a value of less than 0.01; and
very highly significant at value of less than 0.001.
Results will be presented through changes in outcome
tools and changes in clinical diagnosis according to the
clinical significant improvement ‘change’ proposed by
Jacobson and Truax [46] who described a broadly and
widely applicable method to investigate the clinically
significant change in psychotherapy research. Accordingly,
patients will be classified in three groups; (i) cured
patients with clinically significant (CS) improvement,
patients with improvement that is above measurement
error but still unresolved (statistically significant changes,
SS), and patients with no improvement (NS).
100 Middle East Current Psychiatry

ResultsTreatment compliance
This study started with 40 patients in the pretreatment
phase, and decreased to 38 in the posttreatment phase.
Two male patients dropped out; one had OCD and the
other had GAD. Drop out was defined as failing to receive
at least three sessions of CBT.
Pretreatment assessment
Means and standard deviations of the used assessing tools
at the pretreatment baseline assessment were as follows:
HAM-A scored in the range of 25–45, with a mean of
30.5 ± 6.3 and BAI scored in the range of 22–40, with a
mean of 28.2 ± 6.7. For patients with a primary diagnosis
of PD, the range was 35–40 with a mean of 38.2 ± 2.6.
PSWQ scored in the range of 40–69 with a mean of
55.2 ± 9.9. For patients with a primary diagnosis of GAD,
the range was 60–69 with a mean of 64.6 ± 2.6. LSAS
scored in the range of 40–65 with a mean of 47.4 ± 11.1.
For patients with a primary diagnosis of SAD, the range
was 55–65 with a mean of 61.3 ± 3.6. YBOCS scored in
the range of 0–21 with a mean of 6.1 ± 7.1. For patients
with a primary diagnosis of OCD, the range was 10–21
with a mean of 14.3 ± 5.6. QOL scored in the range of
23–29 with a mean of 24.8 ± 1.3.
BDI-II revealed that all participants (40 patients) were suf-
fering from comorbid depression with a mean 17.1 ± 3.3,
70% (28 of 40) had mild degree, and 30% (12 of 40) had
moderate degree.
Outcome of cognitive behavior therapy on anxiety
disorders
For the purpose of assessing the outcome of CBT on
anxiety disorders, ANOVA analysis was reapplied to
examine differences from pretreatment to posttreatment
for the assessment of the outcome of CBT, and from
posttreatment to follow-up and from pretreatment to
follow-up to assess whether outcome gained at posttreat-
ment will be maintained or not.
Positive clinical outcome of CBTon anxiety disorders was
SS in several domains: (i) changes in clinical diagnosis,
changes in used doses of medications, and changes in
outcome tools’ scores, for all participants and in-between
subtypes of anxiety disorders.
With regard to clinical diagnosis, there was posttreatment
clinical improvement of 55% (21 of 38) participants who
did not fulfill the diagnostic criteria of anxiety disorders
anymore as measured by SCID-I. However, follow-up
assessment 6 months later revealed no significant changes
from posttreatment results.
With regard to medications, 55.2% (21 of 35) of participants
were still continuing using psychotropic medications with
reduction in doses of all psychotropic drugs compared
with the pretreatment phase (P < 0.001); in benzodiaze-
pines, the daily intake was reduced to a mean of
0.17 ± 0.47; in antidepressants, the daily intake was
reduced to a mean of 6.2 ± 8.37; in antipsychotics, the
daily intake was reduced to a mean of 12.2 ± 37.2
(Table 2).
Follow-up assessment shows no changes in the total
number of patients using medications, but with nonsignifi-
cant reduction in the dose of benzodiazepines to a mean
of 0.09 ± 1.2, antidepressants to a mean of 5.9 ± 9.5, and
antipsychotics to mean of 11.9 ± 38.6 (P = 0.56) (Table 3).
With regard to anxiety clinical tools, ANOVA results
proved that participants had improved significantly on
posttreatment tools; HAM-A (0.001), BAI (< 0.001),
PSWQ (< 0.001), LSAS (< 0.001), and YBOCS
(< 0.001), that is, the mean scores reduced posttreat-
ment. The improvement remained SS after 6 months in
the follow-up phase (Tables 2 and 3).
ANOVA tests showed that participants had improved
significantly between pretreatment and follow-up; HAM-
A (0.001), BAI (< 0.001), PSWQ (< 0.001), LSAS
(< 0.001), and YBOCS (< 0.001), but no significant
improvement was shown between posttreatment and
Table 2 Comparing used tools and medications intake in
precognitive behavior therapy and postcognitive behavior
therapy
Item Pre-CBT Post-CBT P value
BZPS intake 1.7 ± 1.8 0.17 ± 0.47 < 0.001AD intake 22.6 ± 11.9 6.2 ± 8.37 < 0.001AP intake 94.7 ± 150 12.2 ± 37.2 < 0.001HAM-A 30.5 ± 6.3 17.6 ± 2.7 0.001BAI 28.2 ± 6.7 16.5 ± 7.7 < 0.001PSWQ 55.2 ± 9.9 44.4 ± 6.1 < 0.001LSAS 47.4 ± 11.1 41.3 ± 1.8 < 0.001YBOCS 6.1 ± 7.1 5.4 ± 3.1 < 0.001BDI-II 17.1 ± 3.3 9.6 ± 1.6 < 0.001QOL 24.8 ± 1.3 39.8 ± 1.7 0.006
Statistical significance level was set at < 0.05; highly significant levelat < 0.01; and very highly significant at < 0.001.AD, antidepressants; AP, antipsychotics; BAI, Beck Anxiety Inventory;BDI-II, Beck Depression Inventory-second edition; BZPS, benzodiaze-pines; CBT, cognitive behavior therapy; HAM-A, Hamilton AnxietyScale; LSAS, Liebowitz Social Anxiety Scale; PSWQ, Penn StateWorry Questionnaire; QOL, quality of life scale; YBOCS, Yale-BrownObsessive Compulsive Scale.
Table 3 Comparing used tools and medications intake
immediately postcognitive behavior therapy and at 6-month
follow-up
Item Post-CBTAt
follow-up Value
BZPS intake 0.17 ± 0.47 0.09 ± 1.2 0.56AD intake 6.2 ± 8.37 5.9 ± 9.5 0.56AP intake 12.2 ± 37.2 11.9 ± 38.6 0.56HAM-A 17.6 ± 2.7 16.4 ± 3.1 0.37BAI 16.5 ± 7.7 15.2 ± 8.3 0.23PSWQ 44.4 ± 6.1 43.7 ± 7.5 0.24LSAS 41.3 ± 1.8 39.9 ± 2.6 0.38YBOCS 5.4 ± 3.1 5.1 ± 2.9 0.27BDI-II 9.6 ± 1.6 8.5 ± 2.4 0.17QOL 39.8 ± 1.7 40.1 ± 2.5 0.19
Statistical significance level was set at < 0.05; highly significant level at< 0.01; and very highly significant at < 0.001.AD, antidepressants; AP, antipsychotics; BAI, Beck Anxiety Inventory;BDI-II, Beck Depression Inventory-second edition; BZPS, benzodiaze-pines; CBT, cognitive behavior therapy; HAM-A, Hamilton AnxietyScale; LSAS, Liebowitz Social Anxiety Scale; PSWQ, Penn StateWorry Questionnaire; QOL, quality of life; YBOCS, Yale-BrownObsessive Compulsive Scale.
Change in quality of life Ghanem et al. 101
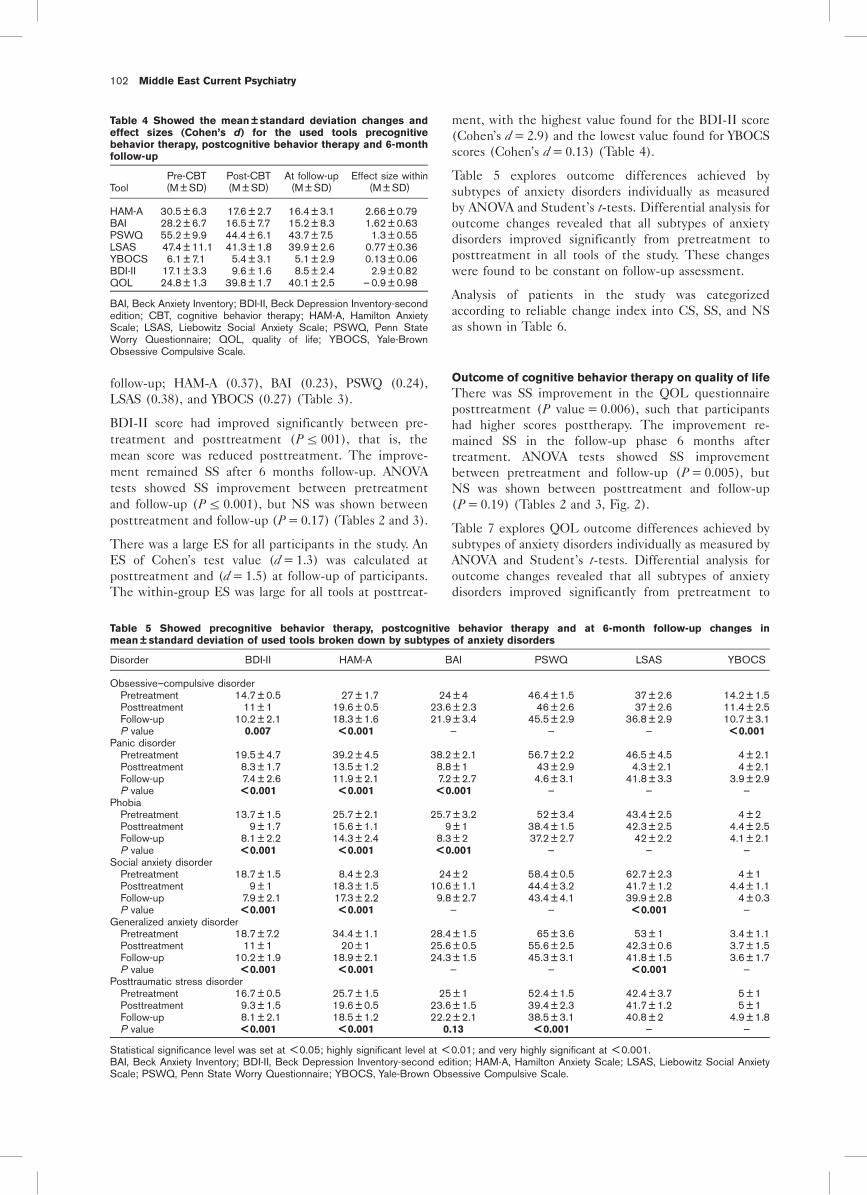
follow-up; HAM-A (0.37), BAI (0.23), PSWQ (0.24),
LSAS (0.38), and YBOCS (0.27) (Table 3).
BDI-II score had improved significantly between pre-
treatment and posttreatment (Pr 001), that is, the
mean score was reduced posttreatment. The improve-
ment remained SS after 6 months follow-up. ANOVA
tests showed SS improvement between pretreatment
and follow-up (Pr 0.001), but NS was shown between
posttreatment and follow-up (P = 0.17) (Tables 2 and 3).
There was a large ES for all participants in the study. An
ES of Cohen’s test value (d = 1.3) was calculated at
posttreatment and (d = 1.5) at follow-up of participants.
The within-group ES was large for all tools at posttreat-
ment, with the highest value found for the BDI-II score
(Cohen’s d = 2.9) and the lowest value found for YBOCS
scores (Cohen’s d = 0.13) (Table 4).
Table 5 explores outcome differences achieved by
subtypes of anxiety disorders individually as measured
by ANOVA and Student’s t-tests. Differential analysis for
outcome changes revealed that all subtypes of anxiety
disorders improved significantly from pretreatment to
posttreatment in all tools of the study. These changes
were found to be constant on follow-up assessment.
Analysis of patients in the study was categorized
according to reliable change index into CS, SS, and NS
as shown in Table 6.
Outcome of cognitive behavior therapy on quality of life
There was SS improvement in the QOL questionnaire
posttreatment (P value = 0.006), such that participants
had higher scores posttherapy. The improvement re-
mained SS in the follow-up phase 6 months after
treatment. ANOVA tests showed SS improvement
between pretreatment and follow-up (P = 0.005), but
NS was shown between posttreatment and follow-up
(P = 0.19) (Tables 2 and 3, Fig. 2).
Table 7 explores QOL outcome differences achieved by
subtypes of anxiety disorders individually as measured by
ANOVA and Student’s t-tests. Differential analysis for
outcome changes revealed that all subtypes of anxiety
disorders improved significantly from pretreatment to
Table 4 Showed the mean ± standard deviation changes and
effect sizes (Cohen’s d) for the used tools precognitive
behavior therapy, postcognitive behavior therapy and 6-month
follow-up
ToolPre-CBT(M ± SD)
Post-CBT(M ± SD)
At follow-up(M ± SD)
Effect size within(M ± SD)
HAM-A 30.5 ± 6.3 17.6 ± 2.7 16.4 ± 3.1 2.66 ± 0.79BAI 28.2 ± 6.7 16.5 ± 7.7 15.2 ± 8.3 1.62 ± 0.63PSWQ 55.2 ± 9.9 44.4 ± 6.1 43.7 ± 7.5 1.3 ± 0.55LSAS 47.4 ± 11.1 41.3 ± 1.8 39.9 ± 2.6 0.77 ± 0.36YBOCS 6.1 ± 7.1 5.4 ± 3.1 5.1 ± 2.9 0.13 ± 0.06BDI-II 17.1 ± 3.3 9.6 ± 1.6 8.5 ± 2.4 2.9 ± 0.82QOL 24.8 ± 1.3 39.8 ± 1.7 40.1 ± 2.5 – 0.9 ± 0.98
BAI, Beck Anxiety Inventory; BDI-II, Beck Depression Inventory-secondedition; CBT, cognitive behavior therapy; HAM-A, Hamilton AnxietyScale; LSAS, Liebowitz Social Anxiety Scale; PSWQ, Penn StateWorry Questionnaire; QOL, quality of life; YBOCS, Yale-BrownObsessive Compulsive Scale.
Table 5 Showed precognitive behavior therapy, postcognitive behavior therapy and at 6-month follow-up changes in
mean ± standard deviation of used tools broken down by subtypes of anxiety disorders
Disorder BDI-II HAM-A BAI PSWQ LSAS YBOCS
Obsessive–compulsive disorderPretreatment 14.7 ± 0.5 27 ± 1.7 24 ± 4 46.4 ± 1.5 37 ± 2.6 14.2 ± 1.5Posttreatment 11 ± 1 19.6 ± 0.5 23.6 ± 2.3 46 ± 2.6 37 ± 2.6 11.4 ± 2.5Follow-up 10.2 ± 2.1 18.3 ± 1.6 21.9 ± 3.4 45.5 ± 2.9 36.8 ± 2.9 10.7 ± 3.1P value 0.007 < 0.001 — — — < 0.001
Panic disorderPretreatment 19.5 ± 4.7 39.2 ± 4.5 38.2 ± 2.1 56.7 ± 2.2 46.5 ± 4.5 4 ± 2.1Posttreatment 8.3 ± 1.7 13.5 ± 1.2 8.8 ± 1 43 ± 2.9 4.3 ± 2.1 4 ± 2.1Follow-up 7.4 ± 2.6 11.9 ± 2.1 7.2 ± 2.7 4.6 ± 3.1 41.8 ± 3.3 3.9 ± 2.9P value < 0.001 < 0.001 < 0.001 — — —
PhobiaPretreatment 13.7 ± 1.5 25.7 ± 2.1 25.7 ± 3.2 52 ± 3.4 43.4 ± 2.5 4 ± 2Posttreatment 9 ± 1.7 15.6 ± 1.1 9 ± 1 38.4 ± 1.5 42.3 ± 2.5 4.4 ± 2.5Follow-up 8.1 ± 2.2 14.3 ± 2.4 8.3 ± 2 37.2 ± 2.7 42 ± 2.2 4.1 ± 2.1P value < 0.001 < 0.001 < 0.001 — — —
Social anxiety disorderPretreatment 18.7 ± 1.5 8.4 ± 2.3 24 ± 2 58.4 ± 0.5 62.7 ± 2.3 4 ± 1Posttreatment 9 ± 1 18.3 ± 1.5 10.6 ± 1.1 44.4 ± 3.2 41.7 ± 1.2 4.4 ± 1.1Follow-up 7.9 ± 2.1 17.3 ± 2.2 9.8 ± 2.7 43.4 ± 4.1 39.9 ± 2.8 4 ± 0.3P value < 0.001 < 0.001 — — < 0.001 —
Generalized anxiety disorderPretreatment 18.7 ± 7.2 34.4 ± 1.1 28.4 ± 1.5 65 ± 3.6 53 ± 1 3.4 ± 1.1Posttreatment 11 ± 1 20 ± 1 25.6 ± 0.5 55.6 ± 2.5 42.3 ± 0.6 3.7 ± 1.5Follow-up 10.2 ± 1.9 18.9 ± 2.1 24.3 ± 1.5 45.3 ± 3.1 41.8 ± 1.5 3.6 ± 1.7P value < 0.001 < 0.001 — — < 0.001 —
Posttraumatic stress disorderPretreatment 16.7 ± 0.5 25.7 ± 1.5 25 ± 1 52.4 ± 1.5 42.4 ± 3.7 5 ± 1Posttreatment 9.3 ± 1.5 19.6 ± 0.5 23.6 ± 1.5 39.4 ± 2.3 41.7 ± 1.2 5 ± 1Follow-up 8.1 ± 2.1 18.5 ± 1.2 22.2 ± 2.1 38.5 ± 3.1 40.8 ± 2 4.9 ± 1.8P value < 0.001 < 0.001 0.13 < 0.001 — —
Statistical significance level was set at < 0.05; highly significant level at < 0.01; and very highly significant at < 0.001.BAI, Beck Anxiety Inventory; BDI-II, Beck Depression Inventory-second edition; HAM-A, Hamilton Anxiety Scale; LSAS, Liebowitz Social AnxietyScale; PSWQ, Penn State Worry Questionnaire; YBOCS, Yale-Brown Obsessive Compulsive Scale.
102 Middle East Current Psychiatry

posttreatment in QOL. This gain was found to be
constant on follow-up assessment.
Does the duration of anxiety symptoms at baseline
predict changes in quality of life?
In the whole sample of participants, a SS correlation was
found between the duration of symptoms and posttreat-
ment improvement in HAM-A (r = 0.67, P = 0.02) and
QOL (r = – 0.68, P = 0.02).
Analysis of posttreatment outcome of the HAM-A among
participants in the study revealed a negative correlation
with the duration of symptoms, that is, the longer the
duration of the symptoms the higher the posttreatment
outcome of HAM-A; in other terms, poorer improvement
in anxiety symptoms.
Analysis of posttreatment outcome of the QOL among
participants in the study revealed a negative correlation
with the duration of symptoms, that is, the longer the
duration of the symptoms the poorer the posttreatment
outcome of the QOL; in other terms, poorer improve-
ment in the QOL (Fig. 3).
Does severity of comorbid depression in anxiety
disorders predict changes in quality of life?
In the whole sample of participants, a SS correlation was
found between pretreatment BDI-II scores and post-
treatment improvement in HAM-A (r = 0.57, P = 0.04)
and QOL (r = – 0.62, P = 0.03).
Analysis of pretreatment outcome of the BDI-II among
participants in the study revealed a negative correlation
with the posttreatment outcome of HAM-A, that is, the
higher the pretreatment score of the BDI-II the higher
the posttreatment outcome of HAM-A; in other terms,
poorer improvement in anxiety symptoms.
Analysis of pretreatment outcome of the BDI-II among
participants in the study revealed a negative correlation
with the posttreatment outcome of QOL, that is, the
higher the pretreatment score of the BDI-II the lower the
posttreatment outcome of QOL; in other terms, poorer
improvement in the QOL (Fig. 4).
DiscussionIn general, most CBT research studies of anxiety
disorders tend to focus on symptom measurement at
the expense of measurement of functional impairment as
QOL. This study examined the effect of CBT on QOL in
anxiety disorder patients, and indicates that CBT is
effective for the management of anxiety disorders with a
short-term (8 weeks) and long-term (35 weeks) positive
impact on QOL.
In this study, the positive impact of CBT on QOL was
confirmed by the quite uniform indication that an
outcome of CBT in our anxiety patients was good. This
was detected through several domains; (i) pretreatment
to posttreatment overall SS improvement in the scores of
all tools, (ii) approximately half of the participants
achieved CS changes, sustained by the large ES detected
among outcome of tools, and (iii) reduction in the
number of participants using psychotropic medications.
Some studies lacked this wide range of evidence
confirming the effectiveness of CBT in anxiety patients
just as Watanabe et al. [48] who did not collect
information about changes in medication dosing after
CBT course. In contrast, our patients’ decreased their
benzodiazepines daily intake to a mean of 0.17 ± 0.47;
antidepressants daily intake to a mean of 6.2 ± 8.37; and
antipsychotics daily intake was reduced to a mean of
12.2 ± 37.2 with a SS difference from the pretreatment
level.
Table 6 Showed clinical improvement in our sample according to reliable change index
CS SS NS
Tool n Percentage n Percentage n Percentage w2
HAM-A 22 83.4 11 16.7 5 13.2 0.47 (P = 0.79)BAI 7 87.5 1 12.5 0 0 1.14 (P = 0.28)PSWQ 1 20 2 40 2 40 1.33 (P = 0.51)LSAS 3 50 2 33.4 1 16.7 1.33 (P = 0.51)YBOCS 1 14.2 5 71.4 1 14.2 0.88 (P = 0.65)BDI-II 19 50 12 31.6 7 18.4 0.95 (P = 0.62)QOL 23 60.5 11 28.9 4 10.5 1.48 (P = 0.48)
Statistical significance level was set at < 0.05; highly significant level at < 0.01; and very highly significant at < 0.001. w2 observed time two(posttest) score.BAI, Beck Anxiety Inventory; BDI-II, Beck Depression Inventory-second edition; CS, clinically significant; HAM-A, Hamilton Anxiety Scale; LSAS,Liebowitz Social Anxiety Scale; NS, not improved; PSWQ, Penn State Worry Questionnaire; QOL, quality of life; SS, statistically significant;YBOCS, Yale-Brown Obsessive Compulsive Scale.
Figure 2
8
13
18
23
28
33
38
43
Pre-therapy Post-therapy Follow-up
QOL
Figure shows precognitive to postcognitive behavior therapy (CBT) andat 6 months follow-up changes in quality of life.
Change in quality of life Ghanem et al. 103
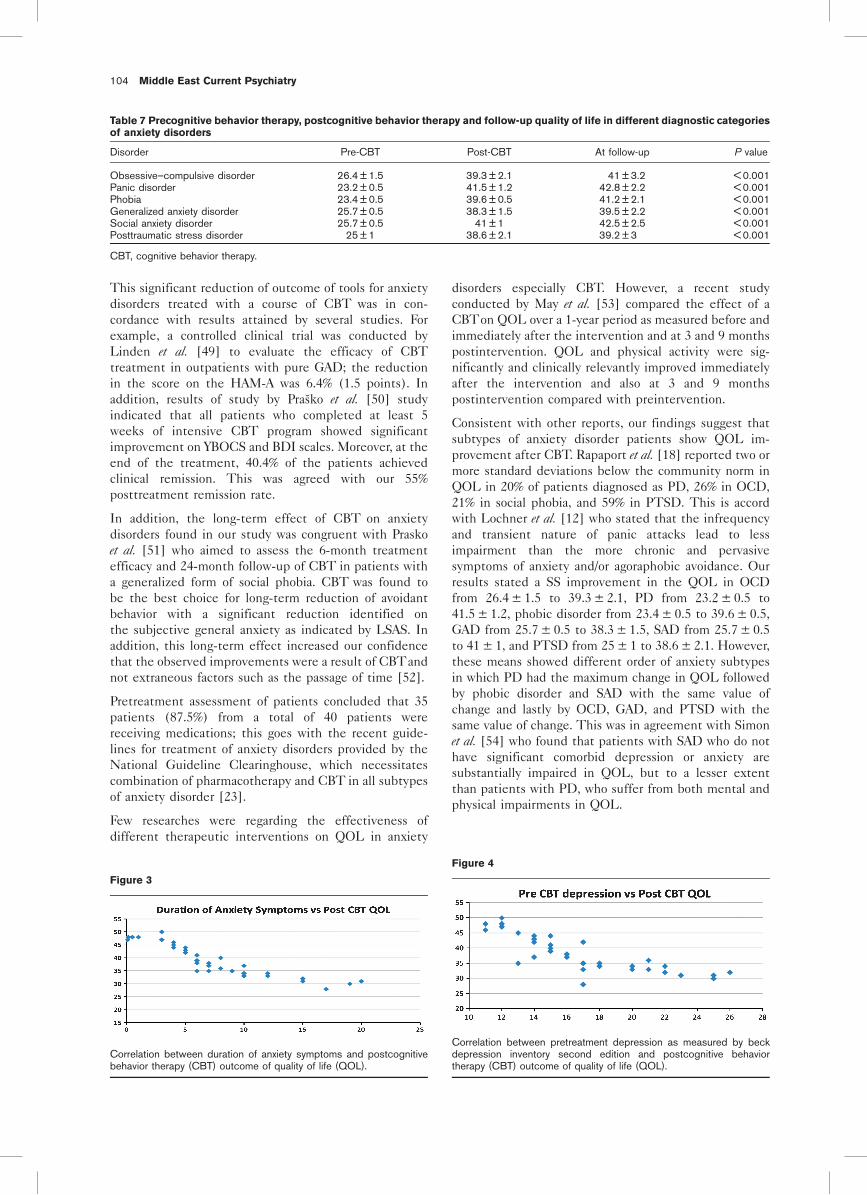
This significant reduction of outcome of tools for anxiety
disorders treated with a course of CBT was in con-
cordance with results attained by several studies. For
example, a controlled clinical trial was conducted by
Linden et al. [49] to evaluate the efficacy of CBT
treatment in outpatients with pure GAD; the reduction
in the score on the HAM-A was 6.4% (1.5 points). In
addition, results of study by Prasko et al. [50] study
indicated that all patients who completed at least 5
weeks of intensive CBT program showed significant
improvement on YBOCS and BDI scales. Moreover, at the
end of the treatment, 40.4% of the patients achieved
clinical remission. This was agreed with our 55%
posttreatment remission rate.
In addition, the long-term effect of CBT on anxiety
disorders found in our study was congruent with Prasko
et al. [51] who aimed to assess the 6-month treatment
efficacy and 24-month follow-up of CBT in patients with
a generalized form of social phobia. CBT was found to
be the best choice for long-term reduction of avoidant
behavior with a significant reduction identified on
the subjective general anxiety as indicated by LSAS. In
addition, this long-term effect increased our confidence
that the observed improvements were a result of CBTand
not extraneous factors such as the passage of time [52].
Pretreatment assessment of patients concluded that 35
patients (87.5%) from a total of 40 patients were
receiving medications; this goes with the recent guide-
lines for treatment of anxiety disorders provided by the
National Guideline Clearinghouse, which necessitates
combination of pharmacotherapy and CBT in all subtypes
of anxiety disorder [23].
Few researches were regarding the effectiveness of
different therapeutic interventions on QOL in anxiety
disorders especially CBT. However, a recent study
conducted by May et al. [53] compared the effect of a
CBTon QOL over a 1-year period as measured before and
immediately after the intervention and at 3 and 9 months
postintervention. QOL and physical activity were sig-
nificantly and clinically relevantly improved immediately
after the intervention and also at 3 and 9 months
postintervention compared with preintervention.
Consistent with other reports, our findings suggest that
subtypes of anxiety disorder patients show QOL im-
provement after CBT. Rapaport et al. [18] reported two or
more standard deviations below the community norm in
QOL in 20% of patients diagnosed as PD, 26% in OCD,
21% in social phobia, and 59% in PTSD. This is accord
with Lochner et al. [12] who stated that the infrequency
and transient nature of panic attacks lead to less
impairment than the more chronic and pervasive
symptoms of anxiety and/or agoraphobic avoidance. Our
results stated a SS improvement in the QOL in OCD
from 26.4 ± 1.5 to 39.3 ± 2.1, PD from 23.2 ± 0.5 to
41.5 ± 1.2, phobic disorder from 23.4 ± 0.5 to 39.6 ± 0.5,
GAD from 25.7 ± 0.5 to 38.3 ± 1.5, SAD from 25.7 ± 0.5
to 41 ± 1, and PTSD from 25 ± 1 to 38.6 ± 2.1. However,
these means showed different order of anxiety subtypes
in which PD had the maximum change in QOL followed
by phobic disorder and SAD with the same value of
change and lastly by OCD, GAD, and PTSD with the
same value of change. This was in agreement with Simon
et al. [54] who found that patients with SAD who do not
have significant comorbid depression or anxiety are
substantially impaired in QOL, but to a lesser extent
than patients with PD, who suffer from both mental and
physical impairments in QOL.
Table 7 Precognitive behavior therapy, postcognitive behavior therapy and follow-up quality of life in different diagnostic categories
of anxiety disorders
Disorder Pre-CBT Post-CBT At follow-up P value
Obsessive–compulsive disorder 26.4 ± 1.5 39.3 ± 2.1 41 ± 3.2 < 0.001Panic disorder 23.2 ± 0.5 41.5 ± 1.2 42.8 ± 2.2 < 0.001Phobia 23.4 ± 0.5 39.6 ± 0.5 41.2 ± 2.1 < 0.001Generalized anxiety disorder 25.7 ± 0.5 38.3 ± 1.5 39.5 ± 2.2 < 0.001Social anxiety disorder 25.7 ± 0.5 41 ± 1 42.5 ± 2.5 < 0.001Posttraumatic stress disorder 25 ± 1 38.6 ± 2.1 39.2 ± 3 < 0.001
CBT, cognitive behavior therapy.
Figure 3
Correlation between duration of anxiety symptoms and postcognitivebehavior therapy (CBT) outcome of quality of life (QOL).
Figure 4
Correlation between pretreatment depression as measured by beckdepression inventory second edition and postcognitive behaviortherapy (CBT) outcome of quality of life (QOL).
104 Middle East Current Psychiatry

Assessment instruments used for assessing QOL in both
clinical and research settings are numerous; however, no
agreement as to which ones are the ‘gold standards’
remains elusive [55]. In this study, we used Bigelow et al.[44] QOL scale, which considered the personal impor-
tance and satisfaction with several life domains and had
been validated on clinical samples and being sensitive
enough to discriminate between residents of mental
health hospitals and residents of community [45]. The
use of such a standardized scale allows for QOL
comparisons across different samples and different
populations. Subjective QOL scales are more sensitive
to the individual’s perception of QOL, which is an
additional factor that should be part of a complete
assessment of significant QOL impairment [18].
Change in QOL observed for our CBT-treated anxiety
patients were not only SS, but were also clinically
meaningful. The clinical significance of treatment gains
was examined by the reliable change index, which found
that 60.5% of our patients had clinical significant
improvement, 28.9% had statistical significant improve-
ment, and 18.4% were insignificantly changed after CBT.
This was true in relation to all scales used in this study, in
which BAI showed the highest ratio of CS change
(83.4%), followed in order by HAM-A, QOL, BDI-II,
LSAS, PSWQ, and YBOCS. This confirmed that CBT
improves clinically both symptom impairment (as mea-
sured by scales) and functional impairment of (QOL)
anxiety disorders [14].
To examine the extent to which treated anxiety patients’
QOL scores move into the range of normal populations’
scores, the posttreatment and 6-month follow-up overall
QOL index for our treated patients [M = 39.8, standard
deviation (SD) = 1.3 and 40.1, SD = 2.9, respectively]
could not be compared with that reported by Weissman
et al. [56] for a community sample of control participants
(M = 1.6, SD = 0.3), because the latter used a different
scale for assessing QOL ‘Social Adjustment Scale–Self-
Report’. However, normative comparisons based on meta-
analytic procedures can be expressed as ESs [57]. The
comparisons between our sample and the community
control participants at posttreatment and follow-up are
described by relatively small ESs (i.e. 0.9 at posttreat-
ment and 0.98 at follow-up in our sample and 0.30 at
posttreatment and 0.31 at follow-up, respectively).
The pretreatment duration of anxiety symptoms was a
potent predictor of QOL at posttreatment and follow-up.
In the whole sample of participants, a SS correlation was
found between the duration of symptoms and posttreat-
ment improvement in HAM-A (r = 0.67, P = 0.02) and
QOL (r = – 0.68, P = 0.02). The longer the duration of the
anxiety symptoms, the poorer the improvement in anxiety
symptoms and the poorer the improvement in the QOL
was found. To our knowledge, this correlation was not
reported before especially in anxiety disorders as a whole
diagnosis. However, Telch et al. [58] found baseline severity
of panic-related symptoms; anxiety and agoraphobic
avoidance was related to pretreatment QOL but not to
QOL at posttreatment or follow-up. This supported our
results that, duration of anxiety symptoms are more
powerful predictors of QOL than the severity of symptoms.
Moreover, pretreatment outcome of BDI-II was a potent
predictor of QOL at posttreatment and follow-up. In the
whole sample of participants, a SS correlation was found
between pretreatment BDI-II scores and posttreatment
improvement in HAM-A (r = 0.57, P = 0.04) and QOL
(r = – 0.62, P = 0.03). The higher the pretreatment score
of the BDI-II, the poorer the improvement in anxiety
symptoms and QOL. This is accord with Yemi and Jeffery
[24] who stated that comorbidity is the rule with anxiety
and depressive disorders and found that HAM-A was
correlated significantly with BDI (r = 0.39).
Our patients were on combined pharmacological and
psychological treatments; this is accord with Osborn et al.[14] and Telch et al. [58] who supported the encouraging
evidence that CBT alone could not lead to CS improve-
ment in patients’ QOL; it would be premature to
conclude that CBT is uniquely effective in this regard.
He also suggested that alternative treatments should lead
to enhanced QOL to the extent that they produce
meaningful improvements in patients’ anxiety. In addi-
tion, Eng et al. [59] questioned the limited effects of
CBT on social functioning domain of QOL.
This study has methodological strengths especially when
comparing with other studies; (i) the used outcome
measures were similar to those used in pharmacotherapy
in contrary to other research studies that tended to use
a broader range and/or less sophisticated measures than did
pharmacotherapy researchers [58], (ii) all used tools and
interview instrument SCID are highly validated and
reliable measures for screening and assessing anxiety
disorders [17], (iii) the number of tools used to assess
outcome changes pretreatment to posttreatment and at
follow-up, we used six tools in addition to the QOL one,
(iv) we tried to be clear about the integrity of CBT
and how it was delivered as reported. In addition, the
95% compliance of participants to CBT program might be
regarded as an indicator of patient’s approval and satisfac-
tion with the study, (v) we followed the empirical evidence
that suggests that assessment of the complete impact of
various treatment approaches should involve long-term
follow-up. The follow-up duration in our study was 6
months; other studies had follow-up durations ranging from
60 days, 12 weeks, 3 months, 1 month, 10 weeks, and 16
weeks, (vi) some of our assessing instruments are designed
for use by (clinical) assessors and others by patients.
Patient assessments may result in different results than
clinician assessments, as patients may assign more weight
to certain domains being measured than clinicians [60],
(vii) CBT protocol used in this study followed Lazarus [61]
broad-spectrum multimodal CBT who expanded the scope
of CBT to include physical sensations, visual images, inter-
personal relationships, and biological factors.
However, this study had some limitations: (i) the used
QOL battery did not assess other relevant QOL domains
such as health-care use, alcohol and substance abuse, or
suicide attempts, (ii) our results did not reveal the
Change in quality of life Ghanem et al. 105

association between the characteristic symptoms of each
anxiety disorder and differential impairment of various
domains of function that guided specifically tailored
interventions [12], (iii) no control group was used to
avoid the threat of maturation that involves spontaneous
recovery over time. However, it should be noticed that
anxiety disorders are considered to be chronic disorders
and spontaneous recovery is rare, (iv) the high level of
education in our sample (80% with a college degree and
20% had a diploma certificate) may lead to selection bias,
(v) our sample was a heterogeneous sample of anxiety
disorder patients, both in terms of diagnosis and stage of
disease. Despite those limitations, the study design is
appropriate for its purpose of measuring the change found
in QOL after CBT in a typical clinical setting.
Although the limited number of studies in this area
necessitated this approach, it is recommendable to set
studies designed to evaluate diverse range of QOL indicators
across different interventions in anxiety disorders patients.
There is no conflict of interest to declare.
References1 Somers JM, Goldner EM, Waraich P, Hsu L. Prevalence and incidence
studies of anxiety disorders: a systematic review of the literature. Can JPsychiatry 2006; 51:100–113.
2 Karam EG, Mneimneh ZN, Dimassi H, Fayyad JA, Karam AN, Nasser SC,et al. Lifetime prevalence of mental disorders in Lebanon: first onset,treatment and exposure to war. PLoS Med 2008; 5:e61.
3 Kadri N, Agoub M, El Gnaoui S, Berrada S, Moussaoui D. Prevalence of anxietydisorders: a population-based epidemiological study in metropolitan area ofCasablanca, Morocco. Ann Gen Psychiatry 2007; 6:1–6. Art. No. 6.
4 Okasha A. Focus on psychiatry in Egypt. Br J Psychiatry 2004; 185:266–272.
5 Okasha A, Kamel M, Sadek A, Lotaif ZB. Psychiatric morbidity amonguniversity students in Egypt. Br J Psychiatry 1977; 131:149–154.
6 Okasha A, Seif El Dawla A, Asaad T. Presentation of hysteria in a sample ofEgyptian patients-an update. Neurol Psychiatry Brain Res 1993; 1:155–159.
7 Okasha A, Ashour A. Psycho-demographic study of anxiety in Egypt: the PSEin its Arabic version. Br J Psychiatry 1981; 139:70–73.
8 Ghanem M, Gadallah M, Meky FA, Mourad S, El Kholy G. National survey ofprevalence of mental disorders in Egypt: preliminary survey. East MediterrHealth J 2009; 15:65–75.
9 Pigott TA. Anxiety disorders in women. Psychiatr Clin North Am 2003;26:621–672. vi–vii.
10 Schatzberg AF. Overview of anxiety disorders: prevalence, biology, courseand treatment. J Clin Psychiatry 1991; 52 (Suppl):5–9.
11 Angst J, Vollrath M. The natural history of anxiety disorders. Acta PsychiatrScand 1991; 84:446–452.
12 Lochner C, Mogotsi M, Du Toit PL, Kaminer D, Niehaus DJ, Stein DJ. Quality oflife in anxiety disorders: a comparison of obsessive-compulsive disorder, socialanxiety disorder and panic disorder. Psychopathology 2003; 36:255–262.
13 Borkovec TD, Newman MG, Castonguay LG. Cognitive-behavioral therapyfor generalized anxiety disorder with integrations from interpersonal andexperiential therapies. CNS Spectr 2003; 8:382–389.
14 Osborn RL, Demoncada AC, Feuerstein M. Psychosocial interventions fordepression, anxiety and quality of life in cancer survivors: meta-analyses. Int JPsychiatry Med 2006; 36:13–34.
15 Neenan M, Dryden W. Uncovering & examining underlying assumptions,rules & core beliefs. In: Neenan M, Dryden W, editors. Cognitive therapy in anutshell. London: Sage Publications; 2006. pp. 77–81.
16 Gaudiano BA. Cognitive-behavioural therapies: achievements andchallenges. Evid Based Ment Health 2008; 11:5–7.
17 Quilty LC, Van Ameringen M, Mancini C, Oakman J, Farvolden P. Quality oflife and the anxiety disorders. J Anxiety Disord 2003; 17:405–426.
18 Rapaport MH, Clary C, Fayyad R, Endicott J. Quality-of-life impairment indepressive and anxiety disorders. Am J Psychiatry 2005; 162:1171–1178.
19 Moroz G. High-potency benzodiazepines: recent clinical results. J ClinPsychiatry 2004; 65 (Suppl 5):13–18.
20 Kennedy SH, Andersen HF, Lam RW. Efficacy of escitalopram in thetreatment of major depressive disorder compared with conventional selectiveserotonin reuptake inhibitors and venlafaxine XR: a meta-analysis.J Psychiatry Neurosci 2006; 31:122–131.
21 Woods SW. Chlorpromazine equivalent doses for the newer atypicalantipsychotics. J Clin Psychiatry 2003; 64:663–667.
22 First MB, Spitzer RL, Gibbon M, Williams JBW. Structured clinical interview forDSM-IV-TR axis I disorders. Research version, non-patient edition (SCID-I/NP). New York: Biometrics Research, New York State Psychiatric Institute;2002.
23 American Psychiatric Association. Diagnostic and statistical manual ofmental disorders DSM-IV-TR. 4th ed. Washington: American PsychiatricPublishing, Inc.; 2000.
24 Yemi A, Jeffrey LS. Understanding comorbidity with depression and anxietydisorders. J Am Osteopath Assoc 2006; 106 (5 Suppl 2):9–14.
25 Craske MG, Antony MM, Barlow DH. Mastery of your specific phobia,therapist guide. 1st ed. Texas: Academic Press; 1997.
26 Barlow D, Craske M, Meadows E. Mastery of your anxiety and panic:therapist guide. 3rd ed. San Antonio: The Psychological Corporation; 2000.
27 Hope DA, Heimberg RG, Juster HR, Turk CL. Managing social anxiety: acognitive-behavioral therapy approach. 1st ed. Texas: PsychologicalCorporation; 2000.
28 Kozak MJ, Foa EB. Mastery of obsessive compulsive disorder: a cognitivebehavioral approach. San Antonio: Psychological Corporation; 1997.
29 Resick PA, Schnicke MK. Cognitive processing therapy for rape victims: atreatment manual. Newbury Park, CA: Sage Publications; 1993.
30 Zinbarg RE. Therapist’s guide for the Mastery of your Anxiety and Worry(MAW) program. Texas: Graywind Publications; 1993.
31 Roth A, Pilling S. The competences required to deliver effective cognitiveand behavioral therapy for people with depression and anxiety disorders.London: Department of Health; 2007.
32 Hamilton M. The assessment of anxiety states by rating. Br J Med Psychol1959; 32:50–55.
33 Piazzini A, Canger R. Depression and anxiety in patients with epilepsy.Epilepsia 2001; 42 (Suppl 1):29–31. discussion: 35–36.
34 Beck AT, Epstein N, Brown G, Steer RA. An inventory for measuring clinicalanxiety: psychometric properties. J Consult Clin Psychol 1988; 56:893–897.
35 Beck AT, Steer RA. Beck anxiety inventory manual. San Antonio, TX:Psychological Corporation; 1993.
36 Leyfer OT, Ruberg JL, Woodruff Borden J. Examination of the utility of theBeck anxiety inventory and its factors as a screener for anxiety disorders.J Anxiety Disord 2006; 20:444–458.
37 Meyer TJ, Miller ML, Metzger RL, Borkovec TD. Development andvalidation of the Penn state worry questionnaire. Behav Res Ther 1990;28:487–495.
38 Webb SA, Diefenbach G, Wagener P, Novy DM, Kunik M, Rhoades HM,et al. Comparison of self-report measures for identifying late-life generalizedanxiety in primary care. J Geriatr Psychiatry Neurol 2008; 21:223–231.
39 Heimberg RG, Holaway RM. Examination of the known-groups validity of theLiebowitz Social Anxiety Scale. Depress Anxiety 2007; 24:447–454.
40 Liebowitz MR. Social phobia. Mod Probl Pharmacopsychiatry 1987;22:141–173.
41 Goodman WK, Price LH, Rasmussen SA, Mazure C, Fleischmann RL,Hill CL, et al. The Yale-Brown Obsessive Compulsive Scale. I. Development,use and reliability. Arch Gen Psychiatry 1989; 46:1006–1011.
42 Beck AT, Ward CH, Mendelson M, Mock J, Erbaugh J. An inventory formeasuring depression. Arch Gen Psychiatry 1961; 4:561–571.
43 Segal DL, Coolidge FL, Cahill BS, O’Riley AA. Psychometric properties ofthe Beck Depression Inventory-II (BDI-II) among community-dwelling olderadults. Behav Modif 2008; 32:3–20.
44 Bigelow D, Garreau MJ, Young DJ. Quality of life questionnaire-interviewerrating version. Oregon Health Sciences University, Portland, OR: WesternMental Health Research Center; 1991.
45 Frisch MB, Cornell J, Villanueva M, Retzlaff PJ. Clinical validation of the qualityof life inventory: a measure of life satisfaction for use in treatment planningand outcome assessment. Psychol Assess 1992; 4:92–101.
46 Jacobson NS, Truax P. Clinical significance: a statistical approach to definingmeaningful change in psychotherapy research. J Consult Clin Psychol 1991;59:12–19.
47 Cohen J. Statistical power analysis for the behavioral sciences. 2nd ed.Hillsdale: Routledge Academic; 1988.
48 Watanabe N, Furukawa TA, Chen J, Kinoshita Y, Nakano Y, Ogawa S, et al.Change in quality of life and their predictors in the long-term follow-up aftergroup cognitive behavioral therapy for social anxiety disorder: a prospectivecohort study. BMC Psychiatry 2010; 10:75–81. Art. No. 81.
49 Linden M, Zubraegel D, Baer T, Franke U, Schlattmann P. Efficacy ofcognitive behaviour therapy in generalized anxiety disorders. Results of acontrolled clinical trial (Berlin CBT-GAD Study). Psychother Psychosom2005; 74:36–42.
50 Prasko J, Raszka M, Adamcova K, Grambal A, Koprivova J, Kudrnovska H,et al. Predicting the therapeutic response to cognitive behavioural therapy
106 Middle East Current Psychiatry

in patients with pharmacoresistant obsessive-compulsive disorder.Neuroendocrinol Lett 2009; 30:615–623.
51 Prasko J, Dockery C, Horacek J, Houbova P, Kosova J, Klaschka J, et al.Moclobemide and cognitive behavioral therapy in the treatment of socialphobia. A six-month controlled study and 24 months follow up. NeuroEndocrinol Lett 2006; 27:473–481.
52 Margraf J, Barlow DH, Clark DM, Telch MJ. Psychological treatment of panic:work in progress on outcome, active ingredients and follow-up. Behav ResTher 1993; 31:1–8.
53 May AM, Korstjens I, Van Weert E, Van Den Borne B, Hoekstra WeebersJEHM, Van Der Schans CP, et al. Long-term effects on cancer survivors’quality of life of physical training versus physical training combined withcognitive-behavioral therapy: results from a randomized trial. Support CareCancer 2009; 17:653–663.
54 Simon GE, Cunningham ML, Davis RL. Outcomes of prenatal antidepressantexposure. Am J Psychiatry 2002; 159:2055–2061.
55 Public Health, Agency of Canada. Evaluation of programs for the treatmentof schizophrenia: a health economic perspective. Canada: Minister of Supplyand Services; 1994.
56 Weissman MM, Bland RC, Canino GJ, Faravelli C, Greenwald S, Hwu HG,
et al. The cross-national epidemiology of panic disorder. Arch Gen Psychiatry1997; 54:305–309.
57 Kendall PC, Grove WM. Normative comparisons in therapy outcome. Behav
Assess 1988; 10:147–158.
58 Telch MJ, Schmidt NB, Jaimez TL, Jacquin KM, Harrington PJ. Impact of
cognitive-behavioral treatment on quality of life in panic disorder patients.J Consult Clin Psychol 1995; 63:823–830.
59 Eng W, Coles ME, Heimberg RG, Safren SA. Domains of life satisfaction in
social anxiety disorder: relation to symptoms and response to cognitive-behavioral therapy. J Anxiety Disord 2005; 19:143–156.
60 Van Balkom AJLM, Van Oppen P, Vermeulen AWA, Van Dyck R, Nauta MCE,
Vorst HCM. A meta-analysis on the treatment of obsessive compulsivedisorder: a comparison of antidepressants, behavior and cognitive therapy.Clin Psychol Rev 1994; 14:359–381.
61 Lazarus AA. Multimodal behavior therapy. In: Lazarus AA, editor. Behavior
therapy and beyond. New York: McGraw-Hill; 1971. pp. 45–49.
Change in quality of life Ghanem et al. 107

108 Middle East Current Psychiatry

Prevalence of metabolic syndrome in patients with schizophreniaReda Roshdy
Department of Psychiatry, Faculty of Medicine,Al Azhar University, Cairo, Egypt
Correspondence to Reda Roshdy, MD, Department, ofPsychiatry, Faculty of Medicine, Al Azhar University,Cairo, EgyptTel: + 2 0191451988; fax: + 20552101802;e-mail: [email protected]
Received 5 December 2010Accepted 14 January 2011
Middle East Current Psychiatry 2011, 18:109–117
Introduction
This study was conducted to assess the prevalence of metabolic syndrome (MetS)
and its association with sociodemographic and clinical variables among schizophrenic
inpatients in Kuwait. In recent years, especially after the introduction of new generation
antipsychotics, researchers have frequently discussed on the metabolic problems
seen in patients with schizophrenia.
Methods
This was a cross-sectional observational study; 181 adult patients aged 18 years and
above, admitted to Psychological Medicine Hospital, Kuwait in July, 2009, with a
diagnosis of schizophrenia according to the Diagnostic and Statistical manual of
Mental disorders – text revised (DSM -IV-TR) were invited to participate until 30
December 2009. The Third Adult Treatment Panel (ATP III) of The National Cholesterol
Education Program, the American Heart Association (ATP-III-A), and International
Diabetes Federation criteria were used to define MetS.
Results
The prevalence of MetS among schizophrenic patients is high. The prevalence rate by
different definition was 27.1% (n = 49) (three definitions of MetS were used), and the
prevalence was 18.8, 23.2, and 24.9% according to The Third Adult Treatment Panel
of The National Cholesterol Education Program, the ATP III-A, and International
Diabetes Federation criteria, respectively. The prevalence of MetS increased with age,
duration of illness and illness severity.
Conclusion
The prevalence of the MetS among schizophrenic patients is high (27.1%). Although
this study found that the prevalence of MetS in schizophrenic patients was lower
according to ATP III (18.8%), in comparison with similar studies, it is increased when
ATP III-A (23.2%) and IDF (24.9%) were taken into account. Robust correlation of
MetS with age, duration of illness, and illness severity were noted.
Keywords:
diabetes, metabolic syndrome, obesity, schizophrenia
Middle East Curr Psychiatry 18:109–117�c 2011 Okasha Institute of Psychiatry, Faculty of Medicine, Ain Shams University2090-5408
IntroductionDuring the last several years, there has been a growing
interest in metabolic abnormalities in the general
population and in schizophrenic patients [1]. The
metabolic syndrome (MetS), a cluster of metabolic risk
factors (central obesity, dyslipidemia, raised blood pres-
sure, and fasting blood glucose) for type 2 diabetes
mellitus and cardiovascular disease (CVD), is a commonly
observed phenomenon in psychiatric practice all over the
world [2]. In the absence of CVD or diabetes, the MetS is
a predictor of these conditions. Once CVD or diabetes
develops, the MetS is often present and the number of
components of the syndrome contributes to disease
progression and risk [3].
In recent years, especially after the introduction of new
generation antipsychotics, researchers have frequently
discussed on metabolic problems seen in patients with
schizophrenia [4]. These metabolic abnormalities are of
major clinical concern, not only because of their direct,
somatic effects on morbidity and mortality, but also
because of their association with psychiatric outcome,
such as a higher prevalence of psychotic and depressive
symptoms also a worse perceived physical health [5], has
a small but measurable impact on psychiatric outcomes
and associated with prolongation in length of hospital stay
[6]. Body mass index (BMI) status and subjective distress
from weight gain were predictors of noncompliance.
Obese individuals were more than twice as likely as those
with a normal BMI to report missing their medication [7].
MetS is associated with a four times higher risk of
developing diabetes [8], three times higher risk of dying
from coronary heart disease [9], three times higher risk
of stroke, and six times more likely to be at risk of
cardiovascular-related mortality [10].
There has been a number of MetS definitions presented
over the last decade. The widely accepted ones are
those proposed by (i) National Cholesterol Education
Program Adult Treatment Panel III (NCEP-ATP III)
Original article 109
2090-5408 �c 2011 Okasha Institute of Psychiatry, Faculty of Medicine, Ain Shams University DOI: 10.1097/01.XME.0000395562.63321.35

[11]; (ii) American Heart Association/National Heart,
Lung, and Blood Institute, AHA (updated ATP III) [12];
and (iii) International Diabetes Federation (IDF) [13].
Table 1 shows the similarities and differences among
these definitions.
A major difference between the ATP and IDF diagnostic
systems is the necessity of central obesity for making
a diagnosis. The updated ATP III definition requires
any three of five criteria for a diagnosis, whereas the
IDF definition needs central obesity plus any other two
abnormalities. Despite this difference, updated ATP III
and IDF criteria still identify essentially the same
individuals as having MetS. In addition, recommenda-
tions for clinical management are virtually identical in the
updated ATP III and IDF reports [12]. Depending on the
various definitions used, prevalent studies of MetS in
large sample sizes of schizophrenic patients showed rates
of MetS between 28.4 and 44.7%. In 240 Canadian
patients with schizophrenia or schizoaffective disorder,
45.5% (42.6% of men and 48.5% of women) of them met
the ATP III diagnosis of MetS [14].
Both the original and updated ATP III definitions were
applied in 689 Americans with schizophrenia, who
participated in the Clinical Antipsychotic Trials of
Intervention Effectiveness Schizophrenia Trial. The
prevalence rates of MetS in the Clinical Antipsychotic
Trials of Intervention Effectiveness study were 40.9%
(ATP III) and 42.7% (updated ATP III) [15]. A more
recent study in 430 Belgian patients with schizophrenia
showed a prevalence of 28.4% (ATP III), 32.3% (updated
ATP III), and 36% (IDF) [16]. In Egypt, the prevalence
of MetS in schizophrenic patients was 38.09% [17]. In
Turkey, MetS in schizophrenic patients was 21% accord-
ing to ATP III, 34% according to ATP III-A, and 41%
based on IDF [18].
The higher prevalence of MetS in patients with
schizophrenia may be explained by medication-related,
disease-related, and lifestyle-related factors. Second-
generation antipsychotic drugs cause, to a varying extent,
dyslipidemia, weight gain, and diabetes [19]. Lifestyle
factors such as smoking, unhealthy food intake, and little
physical exercise contribute to the development of
cardiovascular and metabolic diseases in patients with
schizophrenia [9].
Hypothesis and aim of the studywas to assess the
prevalence of MetS and its association with sociodemo-
graphic and clinical variables in a sample of patients with
schizophrenia admitted to Psychological Medicine Hos-
pital in Kuwait.
Patients and methodsThis is a cross-sectional observational study; 181 adult
patients aged 18 years and above, admitted at the acute
admission wards of the Psychological Medicine Hospital,
Kuwait over a period of 6 months (July 2009 till end of
December 2009, inclusive), who fulfilled the study’s
inclusion criteria were invited to participate.
The exclusion criteria were being currently pregnant or a
history of pregnancy in the past 6 months (to avoid
metabolic disturbance), substance use disorder, dementia,
mental retardation, and lack of capacity to give written
informed consent. The study was approved by the hospital’s
research and ethics committee. A written informed consent
(included study title, different measurement, and investi-
gations) was taken from the patients and their families after
discussing the aim of the study with them.
The psychiatric diagnosis considered for each patient
was the primary diagnosis, confirmed by their assisting
physician, according to the Diagnostic and Statistical manualof Mental disorders Text Revised. Sociodemographic vari-
ables, details of illness (psychiatric and medical), and a
list of all past and current medications were collected
systematically through patient interview and from available
medical records. MetS was diagnosed using three sets of
criteria (definitions of MetS are presented in Table 1).
The IDF lists the following ethnic group-specific thresh-
olds for waist circumference to define central adiposity:
Europid, sub-Saharan African men, and Eastern and
Middle-Eastern men, more than or equal to 94 cm; South
Asian, Chinese, and ethnic South American and Central
American men, more than or equal to 90 cm; Japanese
men, more than or equal to 85 cm; women except
Japanese women, more than or equal to 80 cm; and
Japanese women, more than or equal to 90 cm. In this
analysis, the following thresholds for waist circumference
were used: white men, more than or equal to 94 cm;
Table 1 Definitions of the metabolic syndrome
Criteria ATP IIIa (NCEP) ATP III Aa (AHA) IDFb
Waist (cm)BPc (mmHg)
M > 102, F > 88 M > 102, F > 88 MZ94, FZ80Obligatory criterion
HDL (mg/dl) Z130/85 Z130/85 Z130/85TG (Z150 mg/dl) or Z1.695(mmol/l) M < 40, F < 50 M < 40, F < 50 M < 40, F < 50Glucose (mg/dl) or (mmol/l)d Z150 or Z1.695
Z110 or Z6.1Z150Z or Z1.695
Z100 or Z5.6Z150 or Z1.695
Z100 or 5.6
AHA, the American Heart Association; BP, blood pressure; F, female; HDL, high-density lipoprotein; IDF, International Diabetes Federation; M, male;MetS, metabolic syndrome; NCEP ATP III, The Third Adult Treatment Panel of The National Cholesterol Education Program; TG, triglycerides.aMetS if three of five criteria are met.bMetS if additional two criteria are met (waist is obligatory).cOr if treated with antihypertensive medication.dOr if treated with insulin or hypoglycemic medication.
110 Middle East Current Psychiatry

African–American men, more than or equal to 94 cm;
Mexican–American men, more than or equal to 90 cm;
white women, more than or equal to 80 cm; African–
American women, more than or equal to 80 cm; and
Mexican–American women, more than or equal to 80 cm.
For participants whose designation was ‘other race–
including multiracial’, thresholds that were once based
on Europid cut-points (Z 94 cm for men andZ 80 cm for
women) and once based on South Asian cut-points
(Z 90 cm for men and Z 80 cm for women) were used.
The participants’ height was measured using a wall-
mounted standiometer, and the weight was measured
using calibrated electronic scales with the patient
wearing light clothes. Waist circumference was measured
at the midpoint between the upper border of the iliac
crest and the lower rib, with a tape measuring horizontally
circling the body. Blood pressure was measured with the
patient seated, after a minimum of 10 min rest.
Fasting blood samples (blood was sampled after a
minimum of 10 h of fasting) were collected to assess
glucose, triglycerides, and high-density lipoprotein
(HDL) levels. Glucose was measured by the oxidative
glucose colorimetric method, with dry chemistry readings
with reflectometry. The triglycerides were measured by
the enzymatic and colorimetric methods. HDL was
measured by the homogenic or direct method.
The statistical analysis consisted initially of descriptive
measures for the variables under study. For this purpose,
frequencies and percentages were used for category
variables, and means and standard deviations were used
for quantitative variables. Independent sample t-test (t)was used when there were two groups of patients
compared regarding different variables. Paired samples
t-test (t) was used when same patients (one group) were
compared regarding different variables. Pearson w2 tests
were used to detect whether there is a significant
association between two categorical variables. One way
analysis of variance (F) was applied when comparing
several means to see how several independent variables
interact with each other and what effects these interac-
tions have on a dependent variable. The statistical
significance level was accepted as P value of less than
0.05. The analyses were conducted with the software
SPSS (version) 15.0 Inc. (Statistical Package for Social
Sciences, Chicago, Illinois, USA).
ResultsOf all the inpatients in the psychological medicine hospital
during the study period, we enrolled 181 patients who
met the inclusion criteria to participate in the study.
Frequencies of distribution of age and the duration
of illness of patients and indices of MetS are summarized
in Table 2. The mean age of the patients was 38.5 ± 10.3
years, the mean duration of illness was 13.6 ± 8.5 years,
the mean height of patients was 163.0 ± 8.8 cm, the
mean weight of the patients was 77.0 ± 18.5 kg, the mean
waist circumference of the patients was 94.5 ± 16.7 cm,
the mean hip circumference of the patients was
100.7 ± 16.0 cm, the mean triglyceride level of the patients
was 1.3 ± 0.81 mmol/l, the mean HDL level of the patients
was 1.1 ± 0.28 mmol/l, the mean systolic blood pressure of
the patients was 124.6 ± 14.5 mmHg, the mean diastolic
BP of the patients was 79.9 ± 8.6 mmHg, and the mean
fasting blood glucose level of the patients was 5.8 ±
2.3 mmol/l.
Table 2 Frequencies of distribution of age and duration of
illness of patients and indices of metabolic syndrome (N = 181)
VariableNumber of
patient Percentage
Age (years)18–30 42 23.231–45 97 53.646–68 42 23.2Mean (SD) 38.5 (10.3)
Duration of illness (years)1–5 39 21.56–10 41 22.711–20 60 33.121–40 41 22.7Mean (SD) 13.6 ± 8.5
Height of patients (cm)140–160 83 45.8161–170 57 31.5171–193 41 22.7Mean (SD) 163.0 ± 8.8
Weight of patients (kg)43–70 61 33.771–90 87 48.191–110 27 14.9111–156 6 3.3Mean (SD) 77.0 ± 18.5
Waist circumference of patients (cm)43–80 38 21.081–90 36 19.991–100 40 22.1101–120 56 30.9121–150 11 6.1Mean (SD) 94.5 ± 16.7
Hip circumference of patients (cm)42–90 44 24.391–110 97 53.6111–138 40 22.1Mean (SD) 100.7 ± 16.0
Triglycerides level (mmol/l)0.24–1.68 148 81.81.69–5.10 33 18.2Mean (SD) 1.3 ± .8
HDL level (mmol/l)0.40–1.00 75 41.41.1–1.50 87 48.11.51–2.08 19 10.5Mean (SD) 1.1 ± .28
Systolic BP of patients (mmHg)100–120 110 60.8125–140 57 31.5145–190 14 7.7Mean (SD) 124.6 ± 14
Diastolic BP of patients (mmHg)65–70 53 29.375–90 116 64.195–110 12 6.6Mean (SD) 79.9 ± 8.6
Fasting blood glucose level (mmol/l)2.0–5.5 116 64.15.6–6.1 30 16.66.2–8.00 21 11.68.1–18.2 14 7.7Mean (SD) 5.8 ± 2.3
BP, blood pressure; HDL, high-density lipoprotein; SD, standarddeviation.
Prevalence of MetS in patients with schizophrenia Roshdy 111

Demographic and clinical characteristics of the patients
are given in Table 3. The mean age of the patients was
38.5 ± 10.3 years; the study cases were 128 (70.7%) male
patients and 53 (29.3%) female patients, 105 (58%)
single, 38 (21%) married, and 38 (21%) others (divorced,
widowed). In addition, there were 138 (76.2%) patients
Kuwaiti, 23 (12.7%) patients nonKuwaiti, and 20 (11%)
patients of other Arab nationalities.
As regards the occupational status, two patients (1.1%)
were students, seven (3.9%) patients were housewives
only, eight (4.4%) patients were junior-level workers,
three (1.7%) patients were senior-level workers, and 161
(88.9%) patients were unemployed. Considering the
educational level, 78 (43.1%) patients received no formal
education, 19 (10.5%) patients went to primary school, 58
(32%) patients went to secondary/intermediate school,
and 26 (14.4%) patients were university graduates.
Mean duration of illness was 13.6 ± 8.5 years. As regards
the antipsychotics used, 81 patients (44.8%) used atypical
antipsychotics, 42 (23.2%) patients used typical antipsy-
chotics, and 58 (32.8%) patients used combined typical and
atypical antipsychotics. As regards the diagnosis, 165
patients (91.2%) were diagnosed with schizophrenia and
16 (8.8%) patients were diagnosed as schizoaffective.
Overall, 91 patients (50.8%) were smokers, 88 (48.6%)
patients had family members with hypertension, and 67
(37%) patients had family members with diabetes.
The sex differences in age and indices of MetS are shown
in Table 4. Of the 181 participants, 128 patients (70.7%)
were men and 53 were women (29.3%). The mean age of
the patients was 38.5 ± 10.3 years; 39.5 ± 11.05 years for
men and 36.35 ± 7.7 for women. There was no significant
difference among both men and women. As regards the
duration of illness, there was no significant difference
between men and women, when the mean duration of
illness was 13.54 ± 8.8 years for men and 13.9 ± 7.6 years
for women.
The mean waist circumference of patients was
94.2 ± 17.8 cm for men and 95.2 ± 13.8 cm for women,
with no significant difference between them. The mean
triglyceride level was 1.4 ± 0.91 mmol/l for men and
1.03 ± 0.6 mmol/l for women, with no significant differ-
ence between them. The mean HDL level was
1.09 ± 0.3 mmol/l for men and 1.1 ± 0.3 mmol/l for
women, with no significant difference between them.
The mean systolic BP of the patients was 126.9 ±
15.3 mmHg for men and 119.2 ± 10.9 mmHg for women,
with statistically significant difference between them.
The mean diastolic BP of the patients was 81.25 ±
8.8 mmHg for men and 76.8 ± 7.2 mmHg for women,
with significant difference between them.
The mean fasting blood glucose level was 5.9 ± 2.5 mmol/l
for men and 5.8 ± 1.9 mmol/l for women, with no
significant difference between them.
Metabolic syndrome types are shown in Table 5. Of the
181 patients, the total prevalence in the population
Table 3 Demographic and clinical characteristics of the patients
(N = 181)
Variable n Percentage
Age (years, mean ± SD) 38.5 ± 10.3 —Sex
Male 128 70.7Female 53 29.3
Marital stateSingle 105 58Married 38 21Other (widowed, divorced) 38 21
Education levelNo formal education 78 43.1Primary school 19 10.5Secondary/intermediate 58 32School university 26 14.4
OccupationUnemployed 161 88.9Student 2 1.1House wife only 7 3.9Junior work 8 4.4Senior level 3 1.7
NationalityKuwaiti 138 76.2Non Kuwaiti 23 12.7Other Arabs 20 11
DiagnosisSchizophrenia 165 91.2Schizoaffective 16 8.8
Illness duration (years, mean ± SD) 13.6 ± 8.5 —Drug type
Typical antipsychotic 42 23.2Atypical antipsychotic 81 44.8Combined typical and atypicalantipsychotic
58 32.8
SmokingPresent 92 50.8Not present 89 49.2
Hypertension in familyPresent 88 48.6Not present 93 51.4
Diabetes in familyPresent 67 37Not present 114 63
SD, standard deviation.
Table 4 Sex differences in age and indices of metabolic syndrome
Variable Male (N = 128) Female (N = 53) t d.f. Significance: P (two-tailed)
Age (years) 39.5 ± 11.05 36.35 ± 7.7 1.86 179 0.069Illness duration 13.54 ± 8.8 13.9 ± 7.6 0.24 179 0.033Waist circumference of patients (cm) 94.2 ± 17.8 95.2 ± 13.8 0.34 179 0.73Triglycerides level (mmol/l) 1.4 ± 0.91 1.03 ± 0.6 2.51 179 0.13HDL level (mmol/l) 1.09 ± 0.3 1.1 ± 0.3 1.07 179 0.29Systolic BP of patients (mmHg) 126.9 ± 15.3 119.2 ± 10.9 3.3 179 0.001Diastolic BP of patients (mmHg) 81.25 ± 8.8 76.8 ± 7.2 3.25 179 0.001Fasting blood glucose level (mmol/l) 5.9 ± 2.50 5.8 ± 1.9 0.20 179 0.07
BP, blood pressure; d.f., degrees of freedom; HDL, high-density lipoprotein.Significant = P < 0.05.
112 Middle East Current Psychiatry

studied is 27.1% (N = 49), 23.8% of patients (N = 43)
met only two criteria of metabolic syndrome but not
diagnosed metabolic syndrome, and 49.2% of patients
(N = 89) had no metabolic syndrome as yet defined. Of
the 181 patients 34 (18.8%) fulfilled the NCEP criteria
for metabolic syndrome, 42 patients (23.2%) fulfilled
AHA criteria, and 45 (24.9%) patients fulfilled IDF crite-
ria. There was considerable overlap between the groups
who fulfilled the different sets of criteria. With 69.4%
(N = 34) fulfilled NCEP, 85.7% (N = 42) fulfilled AHA
and 91.8% (N = 45) fulfilled IDF of all those who fulfilled
metabolic syndrome (N = 49).
The relationship between MetS and sociodemographic
and also the clinical characteristics are shown in Table 6.
We present the comparison of demographic and clinical
characteristics of the patients with or without a diagnosis
of MetS. None of the sociodemographic variables were
significantly associated with the presence of the syn-
drome, except marital status in which significant
difference between the patients with and without a
diagnosis of MetS (P = 0.01) exists. Those married were
found to be more in the category of fulfilled MetS than
those without MetS, in which 36.8% (N = 14) fulfilled
MetS, 31.6% (N = 12) fulfilled only two criteria of MetS,
and 31.6% (N = 12) fulfilled no MetS.
As regards sex, 25% (N = 32) of men fulfilled MetS,
23.4% (N = 30) met only two criteria of MetS and 51.6%
(N = 66) met no criteria of MetS. In women, 32.1%
(N = 17) fulfilled MetS, 24.5% (N = 13) met only two
criteria of MetS, and 43.4% (N = 23) met no criteria of
MetS.
Table 5 Prevalence of metabolic syndrome types (N = 181)
Metabolic syndrome category n Percentage
Only two criteria of MetS 43 23.8Fulfilled MetS 49 27.1
Fulfilled MetS by NCEP ATP III 34 18.8Fulfilled MetS by AHA 42 23.2Fulfilled MetS by IDF 45 24.9
No MetS 89 49.2
AHA, the American Heart Association; IDF, International DiabetesFederation; MetS, metabolic Syndrome; NCEP ATP III, The Third AdultTreatment Panel of The National Cholesterol Education Program.
Table 6 Relationship between metabolic syndrome and sociodemographic and clinical characteristics
Subject
FulfilledMetS
n = 49 (%)
Only two criteria ofMetS
n = 43 (%)No MetS
n = 89 (%) Statistics
SexMen 32 (25) 30 (23.4) 66 (51.6) w2 = 1.8
d.f. = 2Significance = 0.41
Women 17 (32.1) 13 (24.5) 23(43.4)
Marital stateSingle 20 (19.0) 27 (25.7) 58 (55.3) w2 = 13.1
d.f. = 4Significance = 0.011
Married 14 (36.8) 12 (31.6) 12 (31.6)
Other (widowed, divorced) 15 (39.5) 4 (10.5) 19 (50)Education level
No formal education 15 (19.2) 25 (32.0) 38 (48.8) w2 = 1.1d.f. = 6
Significance = 0.160Primary school 5 (26.3) 2 (10.5) 12 (63.2)Secondary/intermediate 19 (32.8) 12 (20.7) 27 (46.5)University 10 (38.5) 4 (15.4) 12 (46.1)
NationalityKuwaiti 38 (27.5) 31 (22.5) 69 (50.0) w2 = 1.1
df = 4Significance = 0.89
Non Kuwaiti 7 (30.4) 6 (26.1) 10 (43.5)Other Arabs 4 (20.0% 6 (30.0) 10 (50.0)
OccupationUnemployed 45 (27.9) 39 (24.2) 77 (47.9) w2 = 7.52
d.f. = 8Significance = 0.481
Student 0 (0) 0 (0) 2 (100.0)House wife only 3 (42.8) 2 (28.6) 2 (28.6)Junior work 1 (12.5) 2 (25.0) 5 (62.5)Senior level 0 (0) 0 (0) 3 (100)
DiagnosisSchizophrenia 45 (27.3) 39 (23.6) 81 (49.1) w2 = 0.042
d.f. = 2Significance = 0.098
Schizoaffective 4 (25.0) 4 (25.0) 8 (50.0)
SmokingPresent 25 (27.2) 26 (28.3) 41 (44.5) w2 = 2.40
d.f. = 2Significance = 0.30
Not present 24 (27.0) 17 (19.1) 48 (53.9)
Hypertension in familyPresent 27 (30.7) 19 (21.6) 42 (47.7) w2 = 1.23
d.f. = 2Significance = 0.54
Not present 22 (23.6) 24 (25.8) 47 (50.6)
Diabetes in familyPresent 19 (28.3) 13 (19.4) 35 (52.3) w2 = 1.1
d.f. = 2Significance = 0.57
Not present 30 (26.3) 30 (26.3) 54 (47.4)
d.f., degrees of freedom; MetS, metabolic Syndroma.Significant = P < 0.05.
Prevalence of MetS in patients with schizophrenia Roshdy 113

As regards MetS and psychiatric diagnosis, there were
165 patients diagnosed with schizophrenia [45 (27.3%)
fulfilled MetS, 39 (23.6%) met only two criteria of MetS,
and 81 (49.1%) met no criteria of MetS] and 16 patients
with a diagnosis of schizoaffective disorder [four (25%)
fulfilled MetS, four (25%) met only two criteria of MetS,
and eight (50%) met no criteria of MetS].
As regards smoking state and family history of diabetes
and hypertension, no significant differences exist be-
tween those with or without MetS [(P = 0.3), (P = 54),
(P = 54), respectively].
The relationship between MetS and age of patient and
duration of illness is shown in Table 7. There was
significant difference in mean age between those with
and without MetS. The patients with MetS were found
to be older than patients without MetS. The mean age of
the patients diagnosed with MetS was 43.4 ± 9.5 years,
mean age of patients who met only two criteria of MetS
was 39.7 ± 11.3 years and mean age of patients who met
no MetS was 35.3 ± 9.0 years.
With regard to the duration of illness, the mean duration
of illness was 16.5 ± 8.6 years in the patients diagnosed
with MetS, 16.6 ± 8.9 years in inpatients who met only
two criteria of MetS, and 10.6 ± 7.1 years in patients who
met no criteria of MetS, with statistically significant
difference between both with and without MetS.
Table 8 shows the relationship between MetS and Brief
Psychiatric Rating Scale (BPRS). The BPRS score range
was 39–82, with a mean of 58.2 ± 6.9; there was
significant relationship between MetS and BPRS severity
(f = 4.4, d.f. = two of 181, P > 0.05).
The relationship between MetS and antipsychotic
treatment is given in Table 9. There were no significant
differences in the type of antipsychotic drugs used
between the patients with and without MetS.
DiscussionIn this sample of schizophrenic patients, 27.1% fulfilled
criteria for the MetS as defined by MetS guidelines. This
rate is elevated, compared with the rate of 18% found
among healthy Kuwaiti adults [20], and 21.4% were found
among the United States general population during the
Third National Health and Nutrition Examination Survey
(NHANES III, 1988–1994) [12]. In this study, the MetS
prevalence in schizophrenic patients was 18.8% (N = 34)
according to NCEP-ATP III, 23.2% (N = 42) according to
AHA (ATP III-A), and 24.9% (N = 45) according to IDF.
This result was lower than the result of Cerit et al. [18] who
found that MetS prevalence in schizophrenic patients was
21% according to ATP III, 34% according to ATP III-A, and
41% according to IDF. It was also lower than Rezaei et al.[21] who found that the prevalence of the MetS according
to the different definitions were 27.4% (ATP-III), 37.6%
(ATP-III A), and 38.7% (IDF). It was also lower than the
result of El Tayebani [22] who found that the prevalence of
the MetS in old chronic schizophrenic patients in Kuwait
was 52.5% and was lower than that of the values between
42.4 and 62.5% found in North America, [23,24] and than
the values of 34.6 and 37.1% found in Sweden [25] and in
Finland [26]. A study in Egypt found a prevalence of
38.09% (IDF), [17] and one study in Belgium found a
prevalence of 28.4%, which was slightly higher than the
value found in this study [27]. An other study in Finland
only assessed patients at the age of 30–32 years and found a
prevalence of 19.4% [28]. One study in Taiwan found a 22%
prevalence rate in the Taiwanese inpatient cohort [29].
One study in turkey found a prevalence of MetS was 18.9%
(IDF) [30].
There might be several reasons for the low prevalence
rate of MetS in our study: The first might be the low
mean age of our patients (38.5 ± 10.3 years). Another
reason might be that 23.8% of our patients met only two
positive criteria for a diagnosis of MetS and, thus, were
not diagnosed with MetS. Moreover, difference in
lifestyle factors and balanced hospital diets and optimal
medical care provided in the hospital setting could
contribute to our finding.
Demographic characteristics
When we compared patients with MetS with those
without MetS, according to sociodemographic data, we
found that the MetS was not associated with sex
difference, educational level, and occupational states.
But we found increase prevalence of the MetS according
Marital states, (P = 0.01) in which those married were
found to be more in fulfilled MetS group than those
without metabolic syndrome, in which 36.8% (N = 14)
fulfilled metabolic syndrome, 31.6% (N = 12) met two
criteria of metabolic syndrome and 31.6% (N = 12) met
no criteria of MetS.
Table 7 Relation between metabolic syndrome and age of
patient and duration of illness
Variable N Mean (SD) Statistics
Age of patientFulfilled MetS 49 43.4 ± 9.5 f = 11.2
d.f. = 2Significance = 0.000
Only two criteria ofMetS
43 39.7 ± 11.3
No MetS 89 35.3 ± 9.0Duration of illness of patients
Fulfilled MetS 49 16.5 ± 8.6 f = 12.3d.f. = 2
Significance = 0.000Only two criteria ofMetS
43 16.6 ± 8.9
No MetS 89 10.6 ± 7.1
d.f., degrees of freedom; MetS, metabolic syndrome; SD, standarddeviation.Significant = P < 0.05.
Table 8 Relation between metabolic syndrome and Brief
Psychiatric Rating Scale
Variable N Mean (SD) Statistics
BPRSMetS categorization
Fulfilled MetS 49 60.0 (6.2) f = 4.4d.f. = 2/181
Significance = 0.01Only two criteria of
MetS39 55.5 (8.6)
No MetS 71 53.0 (8.2)
BPRS, Brief Psychiatric Rating Scale; d.f., degrees of freedom; MetS,metabolic syndrome.Significant = P < 0.05.
114 Middle East Current Psychiatry

Age
When we compared patients with metabolic syndrome
with those without MetS, according to the age, we found
that the patients with MetS had higher mean age,
(43.4 ± 9.5 years) and that the frequency of MetS
increased consistently with age. This is in agreement
with results of Cerit et al. [18], who found that the
patients with MetS had higher mean age and that the
frequency of MetS increased consistently with age. This
is also in agreement with Moreno et al. [31] and Yazici
et al. [32], who found an association of the syndrome with
older age that was statistically significant. Hagg et al. [25]
did not find a coherent relationship between age and
MetS frequency.
Clinical characteristics
Duration of illness
In this study, durations of illness in patients with MetS
were longer than in patients without MetS (P = 0.000).
This is in agreement with the result of Cerit et al. [18],
who found that illness and treatment durations of
patients with MetS were longer than in patients without
MetS.
Psychotropic medication
There is an assumption that atypical antipsychotics can
trigger weight gain and related metabolic changes;
however, in this study there was no statistically significant
relationship between the type of drugs used (whether
typical or atypical) and MetS diagnoses, which is similar
to what was reported by Kato et al. [33], Heiskanen et al.[26], and Cerit et al. [18]. The differential metabolic side
effects of atypical antipsychotics should also be consid-
ered. For instance, Meyer et al. [34] reported that within
the 20-week period when there was a shift from
olanzapine treatment to risperidone, they observed a
significant decrease in the frequency of MetS among
patients.
Smoking
In this study, we examined smoking and metabolic
problems, but could not find any significant relationship
between them, which is in line with the findings of Hagg
et al. [25], Kato et al. [33], Cerit et al. [18], and Littrell
et al. [29]. A family history of diabetes and hypertension
has been questioned in limited studies investigating
MetS in schizophrenia. In this study, it was found that
there is no significant difference between family history
of diabetes and hypertension in schizophrenia patients
with and without MetS. This is similar to the findings of
Kato et al. [33], Cerit et al. [18], and Yazici et al. [32] who
did not find a relationship between MetS and a family
history of hypertension or diabetes.
Illness severity, we found association between patients
fulfilled MetS and illness severity which was those
(BPRS) main score was more in patients fulfilled MetS
than those met no criteria of MetS.
The main values for MetS criteria in both men and
women revealed that waist circumference was more
indicators in men and women. The main waist circum-
ference in female (95.2 ± 13.8 cm) met MetS by ATP11,
AHA, and IDF definitions, whereas main waist circum-
ference in male (94.2 ± 17.8 ) met MetS by IDF
definitions only. Waist circumference measurement in-
dicates central obesity. Kato et al. [33] posited that the
relationship between MetS and central obesity was
stronger than the relationship between MetS and obesity
(as determined by BMI), that is, fat level was less
important than the distribution of fat in the body.
Therefore, Kato et al. [33] pointed out that waist
circumference measurement alone was a good indicator
of MetS.
Furthermore, an important finding of this study was the
mean fasting blood glucose level of the male and female
patients was higher than normal levels, whereas the mean
fasting blood sugar level in female (5.8 ± 1.9), and male
(5.9 ± 2.50), both fulfilled MetS by AHA and IDF
definitions, which is in line with the results of McEvoy
et al. [15], who reported that prediabetes and type II
diabetes were frequent among people with schizophrenia.
All other main values for MetS parameters did not
fulfilled MetS by any definitions.
There are limitations to this study. First, is the type of
study which was a cross-sectional (data collection is
limited to a single time point. Therefore, changes in
relation between MetS and schizophrenia over time
cannot be assessed, give no indication of the sequence
and difficult to make causal inference). Second, lack of
data on the dietary habits, sedentary life, family history of
obesity, and other limitations include lack of a control
group. On the other hand, the fact that the population
studied is made up of hospitalized patients impedes the
Table 9 Relation between metabolic syndrome and antipsychotic treatment
Variable Fulfilled MetS Only two criteria of MetS No MetS n Statistics
Typical antipsychotic 12 6 24 42 f = 3.9d.f. = 2
Significance = 0.21Atypical antipsychotic 22 21 15 81 f = 0.89
d.f. = 2Significance = 0.41
Combined typical and atypical antipsychotic 15 16 27 58 f = 1.09d.f. = 2
Significance = 0.33
d.f., degrees of freedom; MetS, metabolic syndrome.Significant = P < 0.05.
Prevalence of MetS in patients with schizophrenia Roshdy 115

results obtained from being generalizable to the rest of
the outpatient of psychiatric illnesses. Despite these
limitations, our findings are consistent with high rates of
the MetS found in other psychiatric populations.
ConclusionThe prevalence of MetS among patients hospitalized in a
ward of a psychological medicine hospital in Kuwait was
27.1%. Although this study found that the prevalence of
MetS in patients was lower according to NCEP ATP III,
(18.8%) in comparison with similar studies, it is increased
when AHA (ATP III-A) (23.2%) and IDF (24.1%) were
taken into account. The factors related to MetS were age,
durations of illness, and illness severity.
We recommend further studies with larger samples
involving both inpatients and outpatients to be able to
generalize the results. In the light of the findings in this
study and other studies, psychiatrists should consider
measuring BP and waist circumference, two components
of the MetS, and also monitoring of the weight; these
are easily assessed in the clinic setting in addition to
measuring fasting glucose and lipids. This is important for
early intervention to reduce the high rates of the MetS
and cardiovascular morbidity in severely mentally ill
patients.
There is no conflict of interest to declare.
References1 Srisurapanont M, Likhitsathian S, Boonyanaruthee V, Charnsilp C,
Jarusuraisin N. Metabolic syndrome in Thai schizophrenic patients: anaturalistic one-year follow-up study. BMC Psychiatry 2007; 7:14.
2 Ohaeri JU, Akanji AO. Metabolic syndrome in severe mental disorders.Metab Syndr Relat Disord 2010; 9:91–98.
3 Alberti KG, Eckel RH, Grundy SM, Zimmet PZ, Cleeman JI, Donato KA, et al.Harmonizing the metabolic syndrome: a joint interim statement of theInternational Diabetes Federation Task Force on Epidemiology andPrevention; National Heart, Lung and Blood Institute; American HeartAssociation; World Heart Federation; International Atherosclerosis Societyand International Association for the Study of Obesity. Circulation 2009;120:1640–1645.
4 Allison DB, Casey DE. Antipsychotic-induced weight gain: a review of theliterature. J Clin Psychiatry 2001; 62 (Suppl 7):22–31.
5 Dixon L, Postrado L, Delahanty J, Fischer PJ, Lehman A. The association ofmedical comorbidity in schizophrenia with poor physical and mental health.J Nerv Ment Dis 1999; 187:496–502.
6 Lyketsos CG, Dunn G, Kaminsky MJ, Breakey WR. Medical comorbidity inpsychiatric inpatients relation to clinical outcomes and hospital length of stay.Psychosomatics 2002; 43:24–30.
7 Weiden PJ, Mackell JA, McDonnell DD. Obesity as a risk factor forantipsychotic noncompliance. Schizophr Res 2004; 66:51–57.
8 Hanley AJG, Karter AJ, Williams K, Festa A, D’Agostino RB Jr, Wagenknecht LE,et al. Prediction of type 2 diabetes mellitus with alternative definitions of themetabolic syndrome: the Insulin Resistance Atherosclerosis Study.Circulation 2005; 112:3713–3721.
9 Lakka HM, Laaksonen DE, Lakka TA, Niskanen LK, Kumpusalo E, Tuomilehto J,et al. The metabolic syndrome and total and cardiovascular disease mortalityin middle-aged men. JAMA 2002; 288:2709–2716.
10 Isomaa B, Almgren P, Tuomi T, Forsen B, Lahti K, Nissen M, et al.Cardiovascular morbidity and mortality associated with the metabolicsyndrome. Diabet Care 2001; 24:683–689.
11 Cleeman JI. Executive summary of the third report of the National CholesterolEducation Program (NCEP) expert panel on detection, evaluation and
treatment of high blood cholesterol in adults (adult treatment panel III). JAMA2001; 285:2486–2497.
12 Grundy SM, Cleeman JI, Daniels SR, Donato KA, Eckel RH, Franklin BA,et al. Diagnosis and management of the metabolic syndrome: an AmericanHeart Association/National Heart, Lung and Blood Institute ScientificStatement. Circulation 2005; 112:2735–2752.
13 International Diabetes Federation. The IDF consensus worldwide definition ofthe metabolic syndrome. Available: http://www.idf.org/webdata/docs/metabolic_syndrome_definition.pdf.
14 Cohn T, Prud’homme D, Streiner D, Kameh H, Remington G. Characterizingcoronary heart disease risk in chronic schizophrenia: high prevalence of themetabolic syndrome. Can J Psychiatry 2004; 49:753–760.
15 McEvoy JP, Meyer JM, Goff DC, Nasrallah HA, Davis SM, Sullivan L, et al.Prevalence of metabolic syndrome in patients with schizophrenia: baselineresults from the Clinical Antipsychotic Trials of Intervention Effectiveness(CATIE) schizophrenia trial and comparison with national estimates fromNHANES III. Schizophr Res 2005; 80:19–32.
16 De Hert MA, Van Winkel R, Van Eyck D, Hanssens L, Wampers M, Scheen A,et al. Prevalence of the metabolic syndrome in patients with schizophreniatreated with antipsychotic medication. Schizophr Res 2006; 83:87–93.
17 Hatata H, Abd Elsalam M, Algohary G, Okda S. Risk of metabolic syndromeamong Egyptian patients with schizophrenia. Endocr Abstr 2010; 21:P105.
18 Cerit C, Ozten E, Yildiz M. The prevalence of metabolic syndrome and relatedfactors in patients with schizophrenia. Turkish J Psychiatry 2008; 19:124–132.
19 Alberti KG, Zimmet P, Shaw J. Metabolic syndrome-a new world-widedefinition. A Consensus Statement from the International DiabetesFederation. Diabet Med 2006; 23:469–480.
20 Badr HE, Al Orifan FH, Amasha MMF, Khadadah KE, Younis HH. Prevalenceof metabolic syndrome among healthy kuwaiti adults: primary health carecenters based study. Middle East J Family Med 2007–2008; 5:8–11.
21 Rezaei O, Khodaie Ardakani MR, Mandegar MH, Dogmehchi E,Goodarzynejad H. Prevalence of metabolic syndrome among an Iraniancohort of inpatients with schizophrenia. Int J Psychiatry Med 2009; 39:451–462.
22 El Tayebani M. Metabolic syndrome in chronic inpatients with schizophreniacompared to their first episode illness. Bull Alex Fac Med 2007; 43:517–529.
23 Basu R, Brar JS, Chengappa KN, John V, Parepally H, Gershon S, et al. Theprevalence of the metabolic syndrome in patients with schizoaffectivedisorder-bipolar subtype. Bipolar Disord 2004; 6:314–318.
24 Meyer J, Loh C, Leckband SG, Boyd JA, Wirshing WC, Pierre JM, et al.Prevalence of the metabolic syndrome in veterans with schizophrenia.J Psychiatr Pract 2006; 12:5–10.
25 Hagg S, Lindblom Y, Mjorndal T, Adolfsson R. High prevalence of themetabolic syndrome among a Swedish cohort of patients with schizophrenia.Int Clin Psychopharmacol 2006; 21:93–98.
26 Heiskanen T, Niskanen L, Lyytikainen R, Saarinen PI, Hintikka J. Metabolicsyndrome in patients with schizophrenia. J Clin Psychiatry 2003; 64:575–579.
27 Tillmann HL, Chen DF, Trautwein C, Kliem V, Grundey A, Berning Haag A,et al. Low frequency of HLA-DRB1*11 in hepatitis C virus induced endstage liver disease. Gut 2001; 48:714–718.
28 Saari KM, Lindeman SM, Viilo KM, Isohanni MK, Jarvelin MR, Lauren LH, et al.A 4-fold risk of metabolic syndrome in patients with schizophrenia: theNorthern Finland 1966 Birth Cohort Study. J Clin Psychiatry 2005; 66:559–563.
29 Littrell K, Perry R, Hilligoss N. Insulin resistance and syndrome X amongschizophrenic patients. Insulin resistance and syndrome X amongschizophrenic patients. American psychiatric association 156th annualmeeting; May 17-22. San Francisco, California: American PsychiatricAssociation; 2003.
30 Kurt E, Altınbas K, Alatas G, Ozver I. Metabolic syndrome prevalence amongschizophrenic patients treated in chronic inpatient clinics. Turkiye’dePsikiyatri 2007; 9:141–145.
31 Moreno TSA, Gonzalez RT, Fleta JLH, Perez PL. Prevalence of the metabolicsyndrome among schizophrenic patients hospitalized in the Canary Islands.Actas Esp Psiquiatr 2007; 35:359–367.
32 Yazici MK, Yagcıoglu AE, Ertugrul A. The prevalence of metabolic syndromein schizophrenic patients: a preliminary report. Eur Neuropsychopharmacol2005; 15:520–521.
33 Kato MM, Beatriz Currier M, Gomez CM, Hall L, Gonzalez Blanco M.Prevalence of metabolic syndrome in hispanic and non-hispanic patients withschizophrenia. Prim Care Companion J Clin Psychiatry 2004; 6:74–77.
34 Meyer JM, Pandina G, Bossie CA, Turkoz I, Greenspan A. Effects ofswitching from olanzapine to risperidone on the prevalence of the metabolicsyndrome in overweight or obese patients with schizophrenia orschizoaffective disorder: analysis of a multicenter, rater-blinded, open-labelstudy. Clin Ther 2005; 27:1930–1941.
116 Middle East Current Psychiatry

Prevalence of MetS in patients with schizophrenia Roshdy 117
Methyltetrahydrofolate reductase polymorphism, folic acid,
and B12 in a sample of patients with depressive and anxiety
symptomsHeba Fathya, Sherine Mohamed Abd El-Mawellaa, Hoda Abdoua, Ashraf Adela
and Amal Abdoub
Departments of aPsychiatry and bClinical and ChemicalPathology, Faculty of Medicine, Cairo University, Egypt
Correspondence to Heba Fathy, Department ofPsychiatry, Faculty of Medicine, Cairo University,Cairo, EgyptTel: + 010 1404826;e-mail: [email protected]
Received 22 October 2010Accepted 23 November 2010
Middle East Current Psychiatry 2011, 18:118–125
Introduction
Both anxiety and depression are common symptoms or disorders with a major impact
on public health. There are several theories regarding potential associations between
depression and levels of vitamin B12 and folate. Vitamin B12 and folate are associated
with the synthesis of monoamines and are involved in single carbon transfer
methylation reactions associated with the production of monoamine neurotransmitters.
This study was conducted to investigate the relationship between depression and
other components of 1-carbon metabolism, such as vitamin B12, folate, and the
methylenetetrahydrofolate reductase 677C-T polymorphism, and to compare the
associations among folate, vitamin B12, and the methylenetetrahydrofolate reductase
C677T polymorphism, in anxiety and depression.
Methods
After obtaining approval from the ethics committee in Kasr El Aini hospital, 90
participants were randomly selected in a comparative cross-sectional study. The
sample consists of three groups: a group of depressive disorders without psychotic
symptoms (n = 30), a group of anxiety disorders (n = 30), and a control group (n = 30).
The patients were recruited from the psychiatric out-patient clinic. Patients were
diagnosed by a lecturer of psychiatry according to DSM-IV criteria. Psychometric
procedure: Beck depression Inventory for severity of depression, Hamilton rating scale
of depression, and Hamilton rating scale of anxiety. Laboratory: simultaneous assay
of vitamin B12 and folic acid by radioimmune assay technique and analysis of
methylenetetrahydrofolate reductase (C677T) by means of PCR and RFLP.
Results
Both anxiety and depression groups have the same percentage of gene mutation
(33.3%). Folic acid and vitamin B12 mean values were the highest in the control
group, followed by the anxiety group; the least was in the depression group. Within the
depression group, there is a negative correlation between the severity of depression
and folic acid. Within the depression group, patients with mutant gene have lower
levels of both folic acid and vitamin B12 than patients with nonmutant gene. Within the
anxiety group, patients with mutant gene have lower levels of both folic acid and
vitamin B12 than patients with nonmutant gene.
Conclusion
Folic acid and vitamin B12 were lower than normal in both patients with anxiety and
with depression and this was combined with gene mutation.
Keywords:
anxiety, depression, folic acid, vitamin B12
Middle East Curr Psychiatry 18:118–125�c 2011 Okasha Institute of Psychiatry, Faculty of Medicine, Ain Shams University2090-5408
IntroductionBoth anxiety and depression are common symptoms or
disorders with a major impact on public health [1]. A
possible role of nutritional factors in the pathogenesis of
neuropsychiatric disorders has long been debated [2].
There are several theories regarding potential associations
between depression and levels of vitamin B12 and folate.
Vitamin B12 and folate are associated with the synthesis
of monoamines and are involved in single carbon transfer
methylation reactions associated with the production
of monoamine neurotransmitters. Low levels of 5-
hydroxyindole acetic acid in cerebrospinal fluid have
been found in patients with depression with folate
deficiency [3]. Clinical studies have shown an inverse
relationship between folate status and depression [4].
Such a relationship has been inferred from studies
showing an increased frequency of folate deficiency
among patients with depression [5]. More severe and
118 Original article
2090-5408 �c 2011 Okasha Institute of Psychiatry, Faculty of Medicine, Ain Shams University DOI: 10.1097/01.XME.0000395563.70945.52

prolonged depressive episodes and weaker treatment
response to antidepressants in patients with low folate
status and enhanced antidepressant response with folic
acid supplementation have been observed [6]. In contrast,
the possible role of vitamin B12 status in neuropsychiatric
disorders has been motivated by the central nervous system
damage caused by overt or subtle vitamin B12 deficiency.
Data regarding the association between vitamin B12 status
and depression are scarce [7]. Vitamin B12 is also required
in the synthesis of S-adenosylmethionine, which is needed
as a methyl donor in many methylation reactions in the
brain. It has also been suggested to have antidepressant
properties. The action of methyltetrahydrofolate reductase
(MTHFR) is associated with the formation of tetrahydro-
biopterin. This compound is an important enzyme cofactor
for tryptophan hydroxylase, the rate-limiting enzyme for
the synthesis of 5-hydroxytryptamine (serotonin). Similarly,
tetrahydrobiopterin is a cofactor for the rate-limiting
enzyme tyrosine hydroxylase (tyrosine 3-monooxygenase)
for the synthesis of dopamine and norepinephrine. The
three monoamines, dopamine, norepinephrine, and seroto-
nin are neurotransmitters. It is generally accepted that
boosting the synthesis or the availability of these
compounds results in an antidepressant effect. Thus,
MTHFR plays a crucial role in neurotransmitter biosyn-
thesis and in the concentration of monoamines in the
synaptic cleft [8]. Single nucleotide polymorphisms in
MTHFR have been reported, including a C-T transition
at nucleotide 677 in exon 4. For the C677T polymorphism,
homozygote variants have 30% enzyme activity in compar-
ison with homozygotes for the wild-type C allele, whereas
heterozygotes retain 65% of wild-type MTHFR enzyme
activity. Both of these polymorphisms are functional and
result in diminished enzyme activity. The consequences of
the C677T polymorphism have been demonstrated in
population studies, in which lower levels of red blood cell
folate, plasma folate, and vitamin B12 have been reported
among nondiseased individuals with the 677 TT genotype
in comparison with individuals with other genotypes [9].
The aim of this study is to examine the associations
among folate, vitamin B12, and the MTHFR C677T
polymorphism in anxiety and depression.
Patients and methodsAfter obtaining approval from Research Ethics Commit-
tee Review in Kasr El Aini hospital, 90 patients were
randomly selected in a comparative cross-sectional study.
All patients gave consent to participate in the study after
full explanation of procedures was provided. The sample
consists of three groups: a group of major depressive
disorders (MDDs) without psychotic symptoms (n = 30),
a group of generalized anxiety disorders (n = 30), and a
control group (n = 30). The patients were recruited
from a psychiatric outpatient clinic. Control cases
(healthy volunteers among medical and paramedical
personnel staff of Kasr El Aini university hospital) were
chosen from an alphabetical computer list of employees
of the hospital. All the scales showed an absence of psy-
chopathology in the control group. They were matched in
age and sex. This was conducted over 6 months. Patients
were diagnosed by a lecturer of psychiatry according to
Diagnostic and Statistical Manual of Mental Disorders, fourthedition (DSM-IV) [10] criteria. Both sexes were included
and the age limit was 20–50 years. We excluded patients
with other psychiatric disorders such as mixed anxiety–
depressive disorder, mental retardation, organic brain
disorders, and substance-induced psychiatric disorders,
in addition to general medical condition (any condition
affecting folic acid or vitamin B12 levels).
Psychometric tools
Semi-structured interview
A specially designed semi-structural interview derived from
the Kasr El Aini psychiatric sheet was used to cover
demographic data, personal data, history, and family history.
Structured Clinical Interview for DSM Axis of Disorders: it
provides broad coverage of axis-I psychiatric diagnosis
according to DSM-IV [11].
Hamilton depression rating scale [12]
This scale was designed by Hamilton [12,13]. The
original version consisted of 17 items and was later
increased to 24 items by Klerman et al. [14]. The scale is
not meant to be a diagnostic instrument [15]. Hamilton
depression rating scale was found to distinguish between
different groups of patients drawn from general practice,
day-patient care, and in-patients [16]. The concurrent
validity is high [17]. The interrater reliability of Hamilton
depression rating scale is also consistently high [12]. This
is an objective test.
Hamilton anxiety rating scale [18]
Similar to the depression rating scale by the same
investigator, the anxiety rating scale was specially
developed to rate clinical anxiety in patients already
diagnosed as suffering from an anxiety state (it is for use
by a trained rater after an ordinary clinical interview).
Hamilton took 12 groups of symptoms that were regularly
observed in anxiety states as his starting point. The
addition of a rating of behavior at an interview made 13
items. Each was rated on a five-point scale from 0 to 4 in
an ascending order of severity [16].
Beck depression inventory [19] (Arabic version)
It is a self-report scale designed to assess DSM-IV-
defined symptoms of depression such as sadness, guilt,
loss of interest, social withdrawal, increase and decrease
in appetite or sleep, suicidal ideation, and other
behavioral manifestations of depression over the previous
2 weeks. It can also be used over time to monitor
symptoms and to assess response to therapeutic inter-
ventions. The inventory is composed of 21 groups of
statements on a 4-point scale with the patient selecting
the one that best matches his or her current state. Each
statement group corresponds to specific behavioral
manifestation responses and is scored 0–3, corresponding
to no, mild, moderate, or severe depressive symptoms.
The score range varies from 0 to 63 in which higher score
indicates greater depression severity. Score in the range of
MTHFR polymorphism, folic acid, B12 in anxiety and depression Fathy et al. 119

0–13 indicates no or minimal depression; 14–19, mild
depression; 20–28, moderate depression; and 29–63 indi-
cates severe depression. It is translated into Arabic
by Gharib Abdel Fattah and is used in many studies.
We used this test for severity ranking and it is a subjective
test.
Laboratory
(1) Fasting samples were collected on plain tubes for the
assay of serum vitamin B12 and folic acid. Serum was
separated and frozen at – 201C until time of analysis.
Simultaneous assay of vitamin B12 and folic acid by
the radioimmune assay technique was carried out
using SimulTRAC-SNB supplied by MP Biomedicals
(Diagnostics Division Orangeburg, New York, USA)
[20].
(2) Three milliliter of blood was collected using sterile
EDTA vaccutainer tubes for DNA extraction and
analysis. Samples were stored at – 701C until the
assay date. Genomic DNA for MTHFR C677T gene
polymorphism was analyzed using PCR, followed by
restriction fragment length polymorphism analysis
[21].
Genomic DNA was extracted from whole blood by the
standard salting-out technique [22].
In brief, the forward and reverse primers supplied by
(Fermentas, USA) were used in the following sequence:
50-TGAAGGAGAAGGTGTCTGCGGGA- 30 (forward)
50-AGGACGGTGCGGTGAGAGTG-30 (reverse).
Amplification was performed using Master Taq polymer-
ase enzyme and a hybaid thermal cycler (Promega
Corporation, USA). The mixture was denatured at 951C
for 10 min, and the PCR reaction was performed for 35
cycles under the following conditions: denaturation at
951C for 1 min, annealing at 651C for 30 s, and extension
at 721C for 1 min and a final extension cycle of 721C was
for 7 min. Amplified bands were detected by electropho-
resis on 1.5% agarose gel containing ethidium bromide.
Amplified PCR products were digested with HinfI
(Fermentas, USA) and analyzed on agarose gel (3.5%)
for the identification of the point mutation in the
MTHFR gene. A single fragment of 198 bp was identified
as homozygous (CC); a single fragment of 175 bp was
identified as homozygous (TT) genotype, and two
fragments of 198 and 175 bp were identified as hetero-
zygous (CT).
Statistical methods
Data were statistically described in terms of range,
mean ± standard deviation, median, frequencies (number
of cases), and percentages when appropriate. Comparison
of quantitative variables between the study groups was
carried out using the Student t-test for independent
samples for comparing two groups when normally
distributed and using the Mann–Whitney U-test for
independent samples when not normally distributed.
Comparison of quantitative variables between more than
two groups of normally distributed data was carried out
using the one-way analysis of variance test with posthoc
multiple two-group comparisons, whereas non-normal
data were compared using the Kruskal–Wallis analysis of
variance test with the Mann–Whitney U-test for inde-
pendent samples as posthoc multiple two-group compar-
isons. For comparing categorical data, the w2 test was
performed; the exact test was used instead when the
expected frequency is less than 5. Correlation between
various variables was carried out using the Spearman rank
correlation equation for non-normal. A probability value
(P value) less than 0.05 was considered statistically
significant. All statistical calculations were done using
computer programs Microsoft Excel 2007 (Microsoft
Corporation, New York, USA) and SPSS (Statistical
Package for the Social Science; SPSS Inc., Chicago,
Illinois, USA) version 15 for Microsoft Windows.
ResultsSociodemographic data (Tables 1 and 2)
Beck depression inventory (Table 3)
Table 1 Mean age in the three groups
Depression (N = 30) Anxiety (N = 30) Control (N = 30)
Age Mean SD Mean SD Mean SD
32.1 7.7 32.33 7.7 31.2 5.7
SD, standard deviation.
Table 2 Sex and family history of depression or anxiety
disorders
Depression Anxiety Control
N Percentage N Percentage N Percentage P
SexMale 13 43.3 15 50 17 56.7 0.587Female 17 56.7 15 50 13 43.3Total 30 100 30 100 30 100
Family history of depression or anxiety disorderPositive 9 30 8 26.7 4 13.3 0.271Negative 21 70 22 73.3 26 86.7Total 30 100 30 100 30 100
N, number.P < 0.05 is statistically significant.
Table 3 Severity of depression in the three groups
Depression Anxiety Control
N Percentage N Percentage N Percentage P
Beck depression inventoryNo 0 0 19 63.3 30 100 0.000Minimum-to-mild
17 56.7 11 36.7 0 0
Moderate-to-severe
13 43.3 0 0 0 0
Total 30 100 30 100 30 100
N, number; No, no depression.P < 0.05 is statistically significant.
120 Middle East Current Psychiatry

Methylenetetrahydrofolate reductase C677T
polymorphism (Table 4)
Clinical variables among depression, anxiety,
and control groups (Table 5–7)
Correlations within the depression group
Within the depression group (Table 8), there is a negative
correlation between the severity of depression and folic
acid, which was just statistically significant. There is also
a negative correlation between depression severity and
vitamin B12, which was statistically significant. Further-
more, there is a positive correlation between the level
of folic acid and vitamin B12, which was statistically
significant.
Within the depression group (Table 9), patients with
mutant gene have lower levels of both folic acid and
vitamin B12 than patients with nonmutant gene and this
difference was statistically significant.
Within the depression group (Table 10), patients with
more severe depression have lower levels of folic acid and
vitamin B12 than patients with minimal-to-mild depres-
sion. This was statistically significant with the vitamin
B12 level and did not reach a statistically significant
difference with the folic acid level (Table 11).
Table 4 Methylenetetrahydrofolate reductase C677Tpolymorphism
Depression Anxiety Control
N Percentage N Percentage N Percentage P
GeneMutant 10 33.3 10 33.3 6 20 0.42Nonmutant 20 66.6 20 66.7 24 80Total 30 100 30 100 30 100
N, number.P < 0.05 is statistically significant.
Table 5 Clinical variables between depression and control
groups
Depression (30) Control (30)
Mean SD Mean SD P
Folic acid 5.8 4.5 9.8 4.9 0.003Vit B12 439.5 189.2 512.4 216.2 0.189Hamilton depression 27.2 6.9 1.07 1.4 0.000Hamilton anxiety 4.9 4.1 0.5 0.8 0.000
SD, standard deviation; Vit, vitamin.
Table 6 Clinical variables between anxiety and control groups
Anxiety (30) Control (30)
Mean SD Mean SD P
Folic acid 8 5.5 9.8 4.9 0.166Vit B12 504.9 231.9 512.4 216.2 0.89Hamilton
depression15 5.1 1.07 1.4 0.000
Hamilton anxiety 34 4 0.5 0.8 0.000
SD, standard deviation; Vit, vitamin.
Table 7 Clinical variables between depression and anxiety
groups
Depression (30) Anxiety (30)
Mean SD Mean SD P
Folic acid 5.8 4.5 8 5.5 0.09Vit B12 439.5 189.2 504.9 231.9 0.23Hamilton depression 27.2 6.9 15 5.1 0.000Hamilton anxiety 4.9 4.1 34 4 0.000
SD, standard deviation; Vit, vitamin.P < 0.05 is statistically significant.
Table 8 Correlation between folic acid and vitamin B12 with
depression and anxiety
Beckdepression Vit B12
Hamiltondepression Hamilton anxiety
P R P R P R P R
Folicacid
0.05 – 0.35 0.02 0.3 0.11 – 0.29 0.92 0.019
Vit B12 0.03 – 0.38 0.104 – 0.302 0.87 – 0.03
R, correlation coefficient; Vit, vitamin.P < 0.05 is statistically significant.
Table 9 Correlation between the folic acid and vitamin B12
and gene mutation within the depression group
Mutant gene Nonmutant
Mean SD Mean SD P
Folic acid 2 1.8 7.7 4.2 0.000Vit B12 310 150 504 175 0.002
SD, standard deviation; Vit, vitamin.P < 0.05 is statistically significant.
Table 10 Correlation between the folic acid and vitamin B12
and severity of depression within the depression group
Minimum-to-mild Moderate-to-severe
Mean SD Mean SD P
Folic acid 6.8 3.9 4.5 5 0.06Vit B12 484.9 174.4 504 175 0.04
SD, standard deviation; Vit, vitamin.P < 0.05 is statistically significant.
Table 11 Correlation between gene mutation and family history
in depression group
Positive FH Negative FH Total
N Percentage N Percentage N Percentage P
Gene mutationMutant 7 77.8 3 14.3 10 33.3 0.001Nonmutant 2 22.2 18 85.7 20 66.7Total 9 100 21 100 30 100
FH, family history; N, number.P < 0.05 is statistically significant.
MTHFR polymorphism, folic acid, B12 in anxiety and depression Fathy et al. 121

Correlations within the anxiety group (Tables 12–14)
DiscussionAn association between depression and folate status has
been demonstrated in clinical studies, whereas data are
sparse on the relationship between depression and other
components of 1-carbon metabolism, such as vitamin B12,
homocysteine, and the MTHFR 677C-T polymorphism.
The relationship between anxiety and these components is
less well known [6]. Hence, this study was conducted to
examine the associations among folate, vitamin B12, and
the MTHFR 677C-T polymorphism, and anxiety and
depression in a case–control comparative study.
As regards vitamin B12, mean value was highest in the
control group followed by the anxiety group; the least was
in the depression group and the difference did not reach
statistical significance between all groups. As regards
folic acid, mean value was highest in the control group
followed by the anxiety group; the least was in the
depression group and the difference did not reach
statistical significance, except between the depression
and the control group.
Our finding was proved by the finding of Coppen and
Bolander Gouaille [23] who reported that both low folate
and low vitamin B12 have been found in studies of
patients with depressive disorders. An association be-
tween depression and low levels of the two vitamins is
found in studies of the general population. Low plasma
or serum folate has also been found in patients with
recurrent mood disorders treated by lithium. A link
between depression and low folate has similarly been
found in patients with alcoholism.
Our results were consistent with the results of Alpert and
Fava [24], who reported that a low folate level was relatively
common (18%) among patients with MDD. Recently, it
was reported that low dietary folate and depressive
symptoms are associated in middle-aged Finnish men [25].
Nevertheless, a low folate level was not detected in
German or Chinese patients with major depression. Hong
Kong and Taiwan populations with traditional Chinese
diets (rich in folate), including patients with major
depression, have high serum folate concentrations.
However, these countries have very low life-time rates
of major depression and the low folate levels are linked
[23]. This contradiction in the previous results could
be explained by the fact that culturally defined dietary
habits influence the relationship between the folate
status and depression in different societies [26]. In
addition, sex, smoking, and creatinine could cause this
contradiction [27].
We also detected that both anxiety and depression groups
have the same percentage of gene mutation (33.3%),
whereas the control group reported 20% mutation, and
the differences were not significant.
Absence of significant differences between both groups of
depression and anxiety may be explained by the high
degree of comorbidity between both disorders. Physicians
often attempt to separate depression from anxiety.
Unfortunately, such distinctions are often challenging
and artificial as anxiety symptoms are common in patients
with major depression. Moreover, the National Comor-
bidity Survey indicates that comorbid depression and
anxiety is the rule rather than the exception in up to 60%
of patients with MDD [28].
In addition, in our study the control group reported 20%
with gene mutation; this can be explained by the fact that
approximately 10% of the population is homozygous for
the 677 C-T polymorphism of the MTHFR gene. In a
meta-analysis of studies investigating the association
between depression and MTHFR genotype, overall TT
carriers had a 22% increase in the odds of depression
compared with CC carriers [29]. Another study con-
ducted by Bjelland et al. [6] from 1996 to 1997 on a large
population group found a strong relationship between the
T/T MTHFR genotype and depression, and the associa-
tion was present for both cutoff levels of depression.
Associations were observed between the lowest level of
vitamin B12 [< 230.0 pmol/l (< 312 pg/ml)] and depres-
sion with high cutoff (HADS-D score Z11).
Our results show that within the depression group there is a
negative correlation between the severity of depression and
Table 12 Correlation between folic acid and vitamin B12
with depression and anxiety
Beckdepression Vit B12
Hamiltondepression
Hamiltonanxiety
P R P R P R P R
Folic acid 0.02 – 0.399 0.001 0.57 0.15 – 0.026 0.76 – 0.05Vit B12 0.33 – 0.181 0.56 – 0.11 0.59 0.100
R, correlation coefficient; Vit, vitamin.
Table 13 Correlation between the folic acid and vitamin B12
and gene mutation within the anxiety group
Mutant gene Non mutant
Mean SD Mean SD P
Folic acid 3.4 3.7 10.3 4.9 0.000Vit B12 421.3 205 546.7 238 0.183
SD, standard deviation; Vit, vitamin.P < 0.05 is statistically significant.
Table 14 Correlation between gene mutation and family history
in anxiety group
Positive FH Negative FH Total
N Percentage N Percentage N Percentage P
Gene mutationMutant 7 87.5 3 13.6 10 33.3 0.000Nonmutant 1 12.5 19 86.4 20 66.7Total 8 100 22 100 30 100
FH, family history; N, number.
122 Middle East Current Psychiatry

folic acid and this was just statistically significant. Moreover,
there is a negative correlation between depression severity
and vitamin B12, which was statistically significant. There is
also a negative correlation between Hamilton depression and
both folic acid and vitamin B12, which was statistically
significant. Our findings agree with Penninx et al. [30] who
found that older, physically disabled women with metabo-
lically significant vitamin B12 deficiency have been found to
have a two-fold higher risk of depression than women with
normal plasma levels of vitamin B12.
However, our study disagrees with the finding of
Hintikka et al. [3] who detected no correlation between
the severity of depression and the level of vitamin B12 at
baseline. Furthermore, Bjelland et al. [6] failed to detect a
relationship between depression and folate.
Only a weak relationship or no relationship was seen
between anxiety disorder and folate or vitamin B12 level
or MTHFR genotype. In contrast, an inverse relationship
between the level of folate and severity of depression has
been reported in some other studies [31].
Finally, one of the important factors to be considered is
that, whether the deficiencies in B12 and folate are
primary and have a role in depression and anxiety or are
secondary because both depression and anxiety affect the
diet intake through loss of appetite, it is possible that
safe augmentation strategies for antidepressive treat-
ments could be advised. It is proved by Hintikka et al. [3]
who applied his study by the determination of hemato-
logical indices, erythrocyte folate, and serum vitamin
B12 levels at baseline and again at the 6-month follow-up
in 115 outpatients with DSM third edition, revised MDD.
They found that higher vitamin B12 levels were
significantly associated with a better outcome. Finally,
increasing dietary intake of B12 and folic acid is a simple,
safe, and inexpensive method to improve mood, to fight
stress, and to increase mental energy [7]. It is
hypothesized that folate augmentation can be used to
boost antidepressant efficacy, although further studies are
necessary [8].
ConclusionThere is a negative correlation between serum level of
vitamin B12, folic acid, and severity of depression in
depression and anxiety groups. The levels of folate and
vitamin B12 were lower in the depression group than the
anxiety group, but the differences were not statistically
significant. We detected gene mutation in 33.3% of both
anxiety and depression groups. It was found that patients
with mutant gene have lower levels of both folic acid and
vitamin B12 in both depression and anxiety groups. From the
above, we concluded that correction in the level of vitamin
B12 and folic acid may lead to improvement of the severity
of depression.
Study limitation
(1) The research was financed by the researcher, which
limited the size of the sample.
(2) We did not investigate different types of depressive
disorders and anxiety disorders.
(3) The sample size was small.
There is no conflict of interest to declare.
References1 Greenberg PE, Sisitsky T, Kessler RC, Finkelstein SN, Berndt ER, Davidson JR,
et al. The economic burden of anxiety disorders in the 1990s. J ClinPsychiatry 1999; 60:427–435.
2 Fernstrom JD. Can nutrient supplements modify brain function? Am J ClinNutr 2000; 71 (6 Suppl):1669S–1675S.
3 Hintikka J, Tolmunen T, Tanskanen A, Viinamaki H. High vitamin B12 level andgood treatment outcome may be associated in major depressive disorder.BMC Psychiatry 2003; 3:17.
4 Bottiglieri T, Crellin R, Reynolds EH. Folate and neuropsychiatry. In: BaileyLB, editor. Folate in health and disease. New York: Marcel Dekker; 1995.pp. 435–462.
5 Fava M, Borus JS, Alpert JE, Nierenberg AA, Rosenbaum JF, Bottiglieri T.Folate, vitamin B12 and homocysteine in major depressive disorder. Am JPsychiatry 1997; 154:426–428.
6 Bjelland I, Tell GS, Vollset SE, Refsum H, Ueland PM. Folate, vitamin B12,homocysteine and the MTHFR 677C- > T polymorphism in anxiety anddepression: the Hordaland Homocysteine Study. Arch Gen Psychiatry 2003;60:618–626.
7 Tiemeier H, Van Tuijl HR, Hofman A, Meijer J, Kiliaan AJ, Breteler MM. VitaminB12, folate and homocysteine in depression: the Rotterdam Study. Am JPsychiatry 2002; 159:2099–2101.
8 Pauwels EKJ. The folate puzzle. Part IV: folate and depression. Drugs Future2008; 33:591–595.
9 Gilbody S, Lewis S, Lightfoot T. Methylenetetrahydrofolate reductase(MTHFR) genetic polymorphisms and psychiatric disorders: a HuGEreview. Am J Epidemiol 2007; 165:1–13.
10 American Psychiatric Association. Diagnostic and statistical manual ofmental disorders DSM-IV-TR. 4th ed. Washington: American PsychiatricPublishing, Inc.; 2000.
11 First MB, Spitzer RL, Gibbon M, Williams JBW. Structured clinical interviewfor DSM-IV, axis I disorders (SCID-I). Washington, DC: AmericanPsychiatric Association, Inc.; 1997.
12 Hamilton M. A rating scale for depression. J Neurol Neurosurg Psychiatry1960; 23:56–62.
13 Hamilton M. Development of a rating scale for primary depressive illness. Br JSoc Clin Psychol 1967; 6:278–296.
14 Klerman GL, Lavori PW, Rice J, Reich T, Endicott J, Andreasen NC,et al. Birth-cohort trends in rates of major depressive disorder amongrelatives of patients with affective disorder. Arch Gen Psychiatry 1985;42:689–693.
15 Preskorn SH, Fast GA. Beyond signs and symptoms: the case against amixed anxiety and depression category. J Clin Psychiatry 1993; 54 (Suppl):24–32.
16 Carroll BJ, Fielding JM, Blashki TG. Depression rating scales. A criticalreview. Arch Gen Psychiatry 1973; 28:361–366.
17 Kearns NP, Cruickshank CA, McGuigan KJ, Riley SA, Shaw SP, Snaith RP. Acomparison of depression rating scales. Br J Psychiatry 1982; 141:45–49.
18 Hamilton M. The assessment of anxiety states by rating. Br J Med Psychol1959; 32:50–55.
19 Beck AT, Steer RA, Brown GK. Manual for the beck depression inventory.2nd ed. San Antonio, TX: Psychological Corporation; 1996.
20 Garcia Casal MN, Osorio C, Landaeta M, Leets I, Matus P, Fazzino F, et al.High prevalence of folic acid and vitamin B12 deficiencies in infants,children, adolescents and pregnant women in Venezuela. Eur J Clin Nutr2005; 59:1064–1070.
21 Jaaskelainen E, Keski Nisula L, Toivonen S, Romppanen EL, Helisalmi S,Punnonen K, et al. MTHFR C677T polymorphism is not associated withplacental abruption or preeclampsia in Finnish women. Hypertens Pregnancy2006; 25:73–80.
22 Trowsdale J. Genomic structure and function in the MHC. Trends Genet1993; 9:117–122.
23 Coppen A, Bolander Gouaille C. Treatment of depression: time to considerfolic acid and vitamin B12. J Psychopharmacol 2005; 19:59–65.
24 Alpert JE, Fava M. Nutrition and depression: the role of folate. Nutr Rev1997; 55:145–149.
25 Tolmunen T, Voutilainen S, Hintikka J, Rissanen T, Tanskanen A, Viinamaki H,et al. Dietary folate and depressive symptoms are associated in middle-agedFinnish men. J Nutr 2003; 133:3233–3236.
MTHFR polymorphism, folic acid, B12 in anxiety and depression Fathy et al. 123

26 Lee S, Wing YK, Fong S. A controlled study of folate levels in Chineseinpatients with major depression in Hong Kong. J Affect Disord 1998;49:73–77.
27 Sachdev PS, Parslow RA, Lux O, Salonikas C, Wen W, Naidoo D,et al. Relationship of homocysteine, folic acid and vitamin B12 withdepression in a middle-aged community sample. Psychol Med 2005;35:529–538.
28 Aina Y, Susman JL. Understanding comorbidity with depressionand anxiety disorders. J Am Osteopath Assoc 2006; 106 (5 Suppl 2):S9–S14.
29 Ford AH, Flicker L, McCaul K, Van Bockxmeer F, Hegarty S, Hirani V, et al.The B-VITAGE trial: a randomized trial of homocysteine lowering treatmentof depression in later life. Trials 2010; 11:8. doi:10.1186/1745-6215-11-8.
30 Penninx BW, Guralnik JM, Ferrucci L, Fried LP, Allen RH, Stabler SP. VitaminB(12) deficiency and depression in physically disabled older women:epidemiologic evidence from the Women’s Health and Aging Study. Am JPsychiatry 2000; 157:715–721.
31 Carney MW, Chary TK, Laundy M, Bottiglieri T, Chanarin I, Reynolds EH,et al. Red cell folate concentrations in psychiatric patients. J Affect Disord1990; 19:207–213.
124 Middle East Current Psychiatry

MTHFR polymorphism, folic acid, B12 in anxiety and depression Fathy et al. 125


