MIDAS: An example of an environmental data strategy
73
Midas An example of an environmental data strategy This report is part of a package of projects launched by the Danish Ministry of Environment and Energy for the support of the European Environment Agency (EEA). The scope of the report has been defined in a co-operation between the EEA and the Danish Environmental Protection Agency (Danish EPA). The project was initiated in February 1996 and completed in December 1996.
Transcript of MIDAS: An example of an environmental data strategy

Midas
An example of an environmental data strategy
This report is part of a package of projects launched by the Danish Ministryof Environment and Energy for the support of the European EnvironmentAgency (EEA). The scope of the report has been defined in a co-operationbetween the EEA and the Danish Environmental Protection Agency (DanishEPA).The project was initiated in February 1996 and completed in December1996.

1. Preface. ....................................................................................................................... 1Why have an environmental data strategy ? ....................................................... 1Objectives. ............................................................................................................. 1Scope of report....................................................................................................... 2Structure of report. ............................................................................................... 2Acknowledgements and sources of information................................................... 2
2. Background................................................................................................................. 5What is a data strategy in the 'MIDAS' sense of the term ? ............................... 5The point of departure. ......................................................................................... 5The organisational prerequisites.......................................................................... 6MIDAS: the task and the task force..................................................................... 7
3. The approach of the MIDAS strategy. ....................................................................... 9The overall frame of reference of the analysis. .................................................... 9The phases of the first part of the MIDAS project............................................... 10The status and problem analysing phase............................................................. 10Experience analysing phase. ................................................................................ 11The objectives and the strategy establishing phase. ........................................... 12Main elements of the strategy.............................................................................. 13Past part one of the MIDAS project - after the strategy report. ......................... 15
4. The conceptual framework......................................................................................... 17The basis for analysis. .......................................................................................... 17Data on the state of the environment .................................................................. 17Data on environmental problems. ........................................................................ 18Data on the sources of pollution ........................................................................... 19Data on regulation. ............................................................................................... 20Data on economy................................................................................................... 21The whole picture: a core set of data and a relevant set of views of the
world. ......................................................................................................... 22
5. Thematic analyses. ..................................................................................................... 25An example: production and treatment of solid waste. ....................................... 26Data needs and objectives of data work............................................................... 26State of affairs....................................................................................................... 27Data needs not met. .............................................................................................. 27Use of the conceptual framework. ........................................................................ 28Conclusions and recommendations of the thematic analysis on waste. ............. 30
6. Organising data in levels. .......................................................................................... 31A catalogue of databases....................................................................................... 31A common set of codifications/code lists............................................................... 32Presentation of data in levels. .............................................................................. 33

7. A presentation system for environmental key data. ................................................. 37Key data and user groups..................................................................................... 37User requirements for a key data system............................................................ 37Structuring of data ............................................................................................... 38Choice of software tool .......................................................................................... 38Design considerations........................................................................................... 39
8. The implementation process. ..................................................................................... 43The process............................................................................................................ 43Pilot projects and other projects........................................................................... 43The evaluation report and its results................................................................... 44Much later ... ......................................................................................................... 45
9. Using experience from other organisations............................................................... 47Differences and parallels. ..................................................................................... 47Environmental data in the United States............................................................ 48Preconditions and rules of thumb for working strategically with
environmental data. .................................................................................. 50Counter-productive conditions. ............................................................................ 52
10. Ideas for further development - and some different approaches. ........................... 55MIDAS II ?. ........................................................................................................... 55Visibility. ............................................................................................................... 55Motivation and resources. .................................................................................... 55Software tools........................................................................................................ 56The outside world.................................................................................................. 56The rôle of the EEA............................................................................................... 57Some approaches for the data work of the EEA .................................................. 58
11. Conclusions and recommendations.......................................................................... 61General conclusions. ............................................................................................. 61Conclusions related to computer and database aspects. ..................................... 62Conclusions related to human resources. ............................................................ 62Conclusions related to organisation. .................................................................... 63Conclusions related to data content. .................................................................... 63Lines of action. ...................................................................................................... 64
12. Executive summary.................................................................................................. 67What is MIDAS ? .................................................................................................. 67Objectives of the report......................................................................................... 67The starting point. ................................................................................................ 67The tool-box........................................................................................................... 67
The implementation of the MIDAS strategy........................................................ 69Using experience from other countries and agencies. ......................................... 69Conclusions and recommendations. ..................................................................... 69

Preface 1
1. Preface.
This report is part of a package of projects launched by the Danish Ministry ofEnvironment and Energy for the support of the European Environment Agency (EEA).The scope of the report has been defined in a co-operation between the EEA and theDanish Environmental Protection Agency (Danish EPA). The project was initiated inFebruary 1996 and completed in December 1996.
Why have an environmental data strategy ?
The main task of the EEA is to produce and present environmental information for theuse of decision makers so that they can take the requisite measures, so that they canassess the results achieved, and so that the public is properly informed about the stateof the environment.
Environmental data are also important to the Danish EPA that uses them as a basis forits work. To improve this data basis the EPA has set up a data strategy that defines theobjectives and ways of achieving them. It focuses on areas such as:
• organisation• human resources• data technical prerequisites (set-up of databases)• data contents
The Danish EPA has since 1991 been developing and implementing its environmentaldata strategy, called MIDAS (in Danish an acronym for environmental data strategy).The MIDAS-project was initiated because there was an awareness of the necessity ofhaving a comprehensive, well-organised and easily accessible set of environmental dataat hand for the Danish EPA in decision making processes at all levels of competence.
Part of the experience from the process of developing and implementing such a strategycan be relevant to organisations such as the EEA. Still it is important to emphasise thatthe aim of the project is not an adoption of the elements of the MIDAS project by theEEA, but an attempt to pass on the experience gained in the Danish EPA and therebyprovide inspiration for such work in other organisations.
Objectives.
The main objectives of this project are:
* To transfer knowledge and experience of the MIDAS project to the EEA
* In brief to examine a few relevant data strategic elements from other countries /agencies
* To contribute to the development of the data strategic work of the EEA and theEIONET

2 Preface
* To supply ideas for combining and presenting key data
Scope of report.
As already mentioned the main idea of this report is to present the experience gainedfrom developing and implementing a specific environmental data strategy; and to makesome suggestions as to how this experience can be used in an EEA context.
Data strategic initiatives of other agencies are therefore only discussed as a supplementto the MIDAS strategy and to broaden the perspective.
It should also be mentioned that the questions of hardware-strategies, computernetworks etc. are not relevant to this report. It is the questions of organisation,identification of data needs and the use and presentation of data that are in focus in thiscontext.
Structure of report.
This report has three sections: Section I supplies context and background for the report.Section II describes the component elements of the MIDAS project itself, and section IIIdiscusses the perspectives of applying data strategies in organisations.
Chapter 1 and 2 make up section I. Chapter 1 is the present chapter, and chapter 2provides the background for the development of the MIDAS strategy.
Section II starts with an answer to the question: how was the task carried out (chapter3). This chapter also provides a short presentation of all the component elements of thestrategy. The most important of these elements are then presented in detail in thefollowing chapters: in chapter 4 the conceptual framework. In chapter 5 the thematicanalyses. In chapter 6 the structuring / levels of data. In chapter 7 the idea of anenvironmental key data system. Finally, in chapter 8 the implementation of the MIDASstrategy is discussed.
Section III begins with a discussion of organisational parallels and differences betweenthe EEA and the Danish EPA. Experience from the United States is reviewed and someimportant preconditions for implementing data strategies are summed up (chapter 9). Inchapter 10 approaches to further development in both the Danish EPA and the EEA arediscussed Chapter 11 sums up the conclusions and recommendations.
Chapter 12 presents an executive summary of the whole report.
Acknowledgements and sources of information.
This project was carried out by a project group consisting of Annelise Ravn and KitClausen of the Danish EPA.

Preface 3
We have received invaluable help from colleagues working with or having worked withenvironmental data strategies. From the EEA, especially Jef Maes and Sigfus Bjarnasonhave been involved in the project. Furthermore we have had discussions with a.o. LynnSingleton of the Washington State Department of Ecology, Steven Newburg-Rinn of theUS EPA / Washington DC, YanChing Zhang of the US EPA Scientific VisualizationCentre and Reena Shah and Peter Bartelmus from the UN office of Statistics.
We would like to express our thanks to all the people we met in connection with themaking of this report for the kind support and valuable information received.

4 Preface

Background 5
2. Background.
This chapter describes the starting point of the MIDAS project: the situation withregards to environmental data in the Danish EPA back in 1991; the prerequisites for thestart of the project; and the setting up of the task force to carry out the project.
What is a data strategy in the 'MIDAS' sense of the term ?
First of all it is relevant to define what is meant by the term 'environmental datastrategy' when it is used in a MIDAS context.
Environmental data strategy in this sense of the word is the setting up of a set of clearlydefined objectives and an action plan to reach these objectives. It should be based on ananalysis of the state of affairs, of problem areas and useful experience. The experienceaspect is useful for supplying ideas and concepts for the action plan. The action planshould set up realistic suggestions for activities that cover all the important aspects ofenvironmental data work: organisation, data contents, human resources and databaseaspects (cf. chapter 3).
It was with such a concept in mind that the MIDAS project was launched.
The idea of having such a strategy is of course to improve the performance related toenvironmental data in the organisation: defining needs for data; collection of data;storage, manipulation and presentation of data. The overall objective is to improve theperformance of the organisation by improving the basis of environmental data on which(part of) its work is built.
The point of departure.
At the starting point the data work of the Danish EPA was characterised by these facts:
• the computer technological starting point was satisfactory as the computer systemswere fairly standardised, all terminals were linked to a common network and astandardised code system was used for nearly all environmental data. That providedpossibilities for sharing data and combining them across data-bases and fields ofexpertise.
• most of the staff was familiar with the use of computers, and there was a growing
awareness of the importance of having and using environmental data • when it came to data contents the selection was often too limited and often too much
defined by 'local' interest, viz. the interests of individual staff members ordepartments rather than the EPA as a whole.
• the external co-operation on environmental data was often difficult and lacked co-
ordination.

6 Background
• in the EPA the co-operation between departments was often weak, and there was atendency towards what the MIDAS task force termed 'departmentalisation', viz.wanting to use data collected by other people or departments, but not being willing tolet them use your data.
• the existing data were not utilised in a satisfactory way, and often they were only
accessible to a very limited number of staff members. • the approach to working with environmental data was very traditional: either you
focused on emissions or you focused on the environmental state of the recipients.Data on the behaviour of the polluters, on environmental impact, on economy, onregulation etc. were scarce.
There was an awareness of these problems in the EPA, but often in a more vague form:an awareness that things could be improved, without being able to pinpoint the exactproblems or their causes.
The organisational prerequisites.
The MIDAS project was started at a time when a new organisational set-up hadprovided important preconditions for the idea of setting up an environmental datastrategy. A new department had been formed: the Research and DevelopmentDepartment. One of its main tasks was to look into the way environmental data werehandled in the EPA. Furthermore, resources were allocated for the task in thisdepartment and in the Data and Information Department.
The management of the Danish EPA put much focus on the project and the facts thatthey fully supported the idea and that they expected the strategy report to be deliveredby the summer of 1992 were important.
To understand the background and the scope of the MIDAS project, it is important tohave in mind that environmental data is not the main raison d'être of the Danish EPA.The main task of the EPA is environmental administration. This includes advising theminister; administering environmental legislation; regulation of environmentalconditions related to domestic and commercial sectors as well as energy and transportsectors; regulation of waste deposits; tasks related to groundwater and surface water,air, climate, chemicals, pesticides, bio-technology, noise , recycling and clean technology.Tasks include making proposals for legislation; making reviews and action plans;handling authorisations and complaints; making inspections and control; advisingcounties and municipalities; dispersing information and handling subsidy schemes - and collecting and handling information and managing monitoring of the environment.
Environmental data is vital in this work as a tool for • assessing the state of the environment• pinpointing problem areas• prioritising efforts• suggesting new initiatives• forecasting development in the state of the environment and effects of new initiatives

Background 7
• assessing results of regulations
Thus, when it comes to tasks and objectives, one of the most important differencebetween the Danish EPA and the EEA is that while collecting and dispersingenvironmental data is so far the most important task of the EEA, it is only one amongmany tasks of the Danish EPA.
MIDAS: the task and the task force.
With the establishment of the Research and Development Department it was decided toset up a task force within the agency with these terms of reference:
a. evaluating the data work of the Danish EPA so far; pinpointing problems andanalysing useful, positive experience
b. setting up a strategy to ensure the best possible data basis for the work of theDanish EPA. The strategy was to devise an action plan defining what steps totake to obtain such a basis.
The task force members were staff from the Research and Development Department,the Information and Data Department, and the Department of Economics. This lastdepartment was included because of its expertise in economical data on theenvironment, and because this department was at that time responsible forEnvironmental Statistics in the EPA.

8 Background

Approach 9
3. The approach of the MIDAS strategy.
We have just looked into the background for the initiation of the MIDAS project. Thischapter describes how the project was carried out and in brief what the main componentelements were.
The overall frame of reference of the analysis.
When looking at the data work of any organisation there are four main factors to takeinto account. These factors are depicted in this figure:
Organisation Data content
Human resources
Computer anddatabaseaspects
Result in total of effortsrelated to environmentaldata
Figure 3.1: The factors deciding the outcome of data work.
These four factors are crucial for the result of the efforts related to producingenvironmental information. Therefore it is important to take all of them into accountwhen assessing the data work of any organisation and when setting up strategies andaction plans.
Organisation is the division of responsibility and competence; it is the way that theinterrelationship between different data and different persons working with data issecured; the way that resources are distributed; and the way that the organisation co-operates with other organisations on environmental data.
The computer and database aspects are related both to the hardware and softwareequipment, and to the technical development and set-up of the databases. Thedevelopment of (environmental) databases is a complicated process. It stretches fromthe hatching of the idea to the first report is produced on the basis of the data base. Itdoes not only apply to the production and use of isolated databases, but also to theoverall concept for the organisation of databases, their use and their inter-relationship.
Data contents or the subject matter of the databases must be in accordance with theneeds of the organisation to be of use as a resource. This is not as simple as it mightseem. To decide what data are relevant, you must have a clear picture of the objectives

10 Approach
for the work of the organisation. You must have an overall picture of the world in whichthe organisation operates (in casu the interrelationship between society and nature andthe problems created by it). And you must be able to analyse in some detail the problemsthat it is relevant for the organisation to look into.
Human resources are important for the quality of the environmental data work. This isespecially related to the use of data. This must based on the knowledge, expertise,experience and software tools at hand. Important is also the way we 'perceive' data -what kinds of environmental data are relevant ? How are they to be used etc. ?
This approach was a framework that was important in shaping the MIDAS report. Inthe work process focus was on organisation, data content and human resources. Thequestion of computer and database aspects was e.g. taken care of through theproduction of a short manual for making databases. It is an important point that thisaspect was in the MIDAS context mainly related to the structuring of data and theorganisation of data in levels.
The phases of the first part of the MIDAS project.
The first part of the MIDAS project was the period until the publication of the strategyreport. The work process at this stage was divided into 3 partly overlapping phases:
1. The status and problem analysing phase.2. The experience analysing phase.3. The strategy establishing phase.
The status and problem analysing phase.
The status and problem analysis phase was carried out by a series of interviews withmembers of staff in the different departments of the Danish EPA.
The aim was to establish an overview of the state of affairs in the area of environmentaldata: what computer-based data were available ? What computer-based data wereneeded ? What were the main problems and obstacles in data work ? How manyresources were used ? What were the priorities ? How were things organised ?
At this stage it was not possible to go into any detail. The interviews only provided anoverview, but it was realised that it would be necessary to go into greater detail at alater stage, cf. chapter five.
The result of this work was a list of main points describing the state of affairs. This wasonly a list of 'symptoms', and to be able to base the rest of the strategy work on this, itwas necessary to analyse the reasons behind these symptoms. The analysis of the taskforce pinpointed these main reasons:
• internal organisation - at the time of the MIDAS report, one might describe the datawork of the Danish EPA as decentralisation without co-ordination. It is important tounderline that decentralisation in itself can hold many advantages. Decentralisation

Approach 11
of responsibility is often the best way to encourage creativity and interest at the locallevel. Nevertheless, some level of co-ordination is necessary to achieve the unity thatis necessary e.g. to make sure that data can be used by more than one person and becombined with data from other databases. The crucial point is to achieve the rightbalance between co-ordination and decentralisation.
• external organisation is both related to the co-operation with the other parts of the
Ministry and with other organisations outside the Ministry. Again the problem wasto find the right level of co-ordination. Furthermore this area was much less wellstructured: there was a great number of stakeholders with very varying interests.
• demand for data decides supply of data. The analysis clearly demonstrated that the
areas with an expressed external and / or top-down demand for data had most high-quality data. This was e.g. the effect of the Danish Aquatic Action Plan: it entailed anarticulated demand for data to assess the state of affairs and the effects of the actionplan. - Data were supplied in large amounts and furthermore used actively in theannual reporting. This was facilitated by the accompanying allocation of resources, cf.below.
In other areas where the same demand did not exist the supply of environmental
data was typically more scarce. In a situation with a limited amount of resources, theproducts that are in clear demand get the highest priority. Where data products werenot in high demand, few data were produced.
• training and attitudes. Training programmes were typically focused on individual
software tools and their use. This meant that there was no general training availablein the production and use of environmental data. Furthermore, the time for tryingout the possibilities of the different software tools was limited. This factor wasimportant as the soft-ware tools were at that time fairly complicated to use. Thecomputer system was terminal-based and the software tools were less user-friendlythan they generally are today.
This also meant that there was a general feeling that working with environmental
data was complicated. Furthermore, there was a lack of knowledge of the potentialsof working with environmental data, e.g. the possibilities for documenting andforecasting.
• resources. Because of the way tasks were prioritised, there was a fairly limited
amount of resources for data related work. This meant that the hatching of new ideaswas very limited and that there were problems with the quality of the data relatedprojects.
Experience analysing phase.
The experience analysing phase was based on a couple of useful examples: the DanishAquatic Action Plan and its monitoring programme and the work on environmental datain the Netherlands.
The Danish Aquatic Action Plan was well known to the members of the task force as theDanish EPA was the main agent in setting up the plan and the monitoring programme.

12 Approach
The Dutch experience was examined through a visit to the relevant ministries inHolland where key persons were interviewed and computer programmes demonstrated.
Some of the main points from these two examples of successful data work were theimportance of these factors:
ON ORGANISATION:Basing your work on a co-operation between organisations / departments with complementary expertisethat in combination constitutes the best available knowledge on the relevant subjectHaving some level of decentralisation / allocation of tasks to ensure involvement and flexibilityRegulating the co-operation through clear agreements and an active co-ordinating body to supplement thedecentralised organisationRegulating through well-defined ideas and concepts that helps ensure co-ordination and unityHaving clear, top-down defined (or defined from outside the organisation) objectives and expectations fordata work. This is important as an incentive for this kind of work Making sure that such clearly defined objectives are well known to all involvedLocating databases with the people that are the primary users of them and distributing responsibilities in away that is clear to all involved
ON DATA CONTENT ETC.:Basing your data work on a common ‘view of the world’ (or data model) defining the relevant objects andtheir interrelationshipsUsing standards and paradigms when collecting, exchanging and reporting data to make sure that datawork at all levels is coherent and comparableBasing work on a definition of outputs, and planning with the aim of providing the relevant products. Thisis the best way to focus your work and make sure that you do not waste time collecting and handling datathat are not really relevantUsing data as a tool for politicians and other decision makers. Using data in the political process foridentifying objectives, and prioritising and monitoring effects of regulations. This helps focus data work andgive the necessary priority to it.Using experience from the use of data in other sectors, e.g. the economic sectorUsing data in models, forecasting etc. and using GIS tools for the presentation and analysis of data
ON HUMAN RESOURCES:Having the necessary resources available and having a realisation of the necessity of providing adequateresourcesHaving inventive 'front-runners' that are able to act as initiators, resource persons and driving forces in thework related to environmental data in the organisation.
Many of these points were important as sources of inspiration for the MIDAS report.
The objectives and the strategy establishing phase.
The strategy establishing phase combined the symptom-and-cause analysis with theanalysis of useful examples and with the general knowledge of the MIDAS task force ondata work. Another important element was an analysis of the data-needs of the DanishEPA based on an examination of the tasks of the EPA, of the agenda for environmentalpolicy and of different user interests.
The overall objective of inventing and implementing the MIDAS strategy was toestablish a collection of environmental data that is coherent, consistent, quality ensuredand easy to access. The data were to fulfil the needs of the organisation with a minimumof resources required.

Approach 13
Some of the main sub-objectives were:
Objectives on organisation:Data must support everyday workClear statements and demands from management on data workData-work must be connected across departments, areas of work etc.Decentralisation and co-ordinationResponsibility for databases must be placed with the people working with the relevant dataAccess to all data for all staff membersAccess to inventories of databases for all staff members
Objectives on data content etc.:Data must be usable in a strategic context (trends, causes, consequences, priorities)Data content must reflect overall priorities in the work of the Danish EPA and develop according to themAll data work must be related to products (reports etc.)Rather few high-quality data than large quantities of data that are not usedUse of data in models etc. is important
Objectives on human resources etc.:Realism in relation to the outputs of data work in a situation where resources are scarce
The final report containing the strategy and action plan was presented in the summer of1992.
Main elements of the strategy.
For the Danish EPA itself the central part of the MIDAS report was the establishmentof a set of objectives and an action plan. For outsiders the means and methods (thetoolbox) are the most important elements, as they are the parts from which most can belearned from their point of view.
Seen from this perspective, the most important component elements are these:
The conceptual framework defines the main categories of data relevant for most datawork in the Danish EPA. It can be used as a sort of checklist when made into a formwith a number of blanks to be filled in. The form is meant as an aid in the process ofanalysing the data needs. The idea is to make sure that any given environmentalproblem is described and analysed on the basis of a comprehensive set of data. Sectors insociety are an important feature in the form. This is because they are important inenvironmental regulation as they are the target groups for most environmental policy.Other important elements of the framework are:
• data on the state of the environment related to the relevant environmental problem(quality indicators and defined objectives)
• data on the sources of pollution. Here the sectors in society are important. Especially
emissions and behavioural patterns causing the pollution are relevant. • data on regulation and administration in relation to the problem.
The conceptual framework is explained in detail in chapter 4.

14 Approach
The idea of having data in different levels to make it easier to combine data and inthis way make better use of the existing stock of data. In the MIDAS report thisinvolved the development of a hierarchy of data according to level of detail and form ofpresentation. And it involved having a computer based catalogue of databases and adatabase of common data - data used in more than one data base and codified in auniform way.
The idea of data organised in levels is presented in chapter 6.
The concept of thematic analyses was developed because it was impossible to go intodetail with the problems and data-gaps in the different areas during the first phase ofthe MIDAS project. It was decided to go through the different areas one by one to makedetailed strategies for each with the aim of improving the data quality in each area. Anarea is e.g. production and treatment of solid waste.
Chapter 5 supplies an example of a thematic analysis.
An environmental key data system was suggested in order to have a computer basedtool for combining, structuring and presenting environmental information for decisionmakers. The system was to combine map-based data and graphic presentations of data(pie-charts etc.)
The environmental key data system is presented in chapter 7.
Guidelines and procedures for environmental data projects were important tomake sure that the same concepts were applied for all the different databasedevelopment projects in the Danish EPA. Main points were:
• focusing on products when developing databases, viz. defining the output in the formof e.g. reports or map-based presentations when developing the database. This was away to make sure that the data were used for practical purposes and not justcollected because somebody thought it might be useful.
• making it possible for all interested departments to join in the projects. This was to
make sure that the data produced fulfilled the needs of all parties with an interest inthe relevant area.
• technical standards for the development of databases to ensure a high and uniform
database-technical quality and to provide the possibility for combining data acrossdatabases.
• the obligation to give a presentation to the staff of the EPA of the finished database
so that all potential users know about its existence and know how to get informationon the access to and use of the database.
Clear definition of responsibilities in the EPA when it comes to environmental data.The main principles here were 'co-ordinated decentralisation' and a combination ofbottom-up and top-down approaches in bringing forth ideas for data projects.

Approach 15
The MIDAS strategy report also set down the responsibility for different specific tasksfor the different departments in the Danish EPA.
Standard agreement with data suppliers to make sure that you do not have to gointo complicated negotiations each time you want new data to be delivered. This part ofthe MIDAS strategy is at present (1996) carried out for the Danish Ministry ofEnvironment and Energy as a whole.
Training courses aimed not at specific software tools but at the general concepts forworking with environmental information: what are the phases of an environmentaldatabase project ? How do you get the data to put into your database ? What are thepossible sources of data ? What are the important considerations when setting up adatabase ? How can data be presented ? How do you apply the conceptual framework ofthe MIDAS strategy ?
Strengthening the data co-ordinating group in the ministry. This proved to be avery important part of the implementation (cf. below) as it supplied a forum forimplementing ideas together with some of the most important partners for co-operationon the area of environmental information.
Past part one of the MIDAS project - after the strategy report.
In the autumn of 1992 the strategy report was delivered to the management of theDanish EPA together with a memorandum summing up the recommendations anddescribing the way to carry out the action plan. This memorandum was endorsed by themanagement and phase 2 of the MIDAS project was begun by the turn of the year 1992 -93.
The responsibility for the implementation of the strategy was shared between twodepartments of the Danish EPA: the then Department of Data and Information, and thethen Department of Research and Development.
The first stages of the implementation was the carrying out of some pilot projects and -on the basis of these projects - an evaluation and adjustment of the strategy.

16 The conceptual framework

The conceptual framework 17
4. The conceptual framework.
In the previous chapters we have described the state of affairs regarding the collectionand use of environmental data in the Danish EPA before the MIDAS project. The mainpoints were firstly that we had many data on various subject areas, but that the overalldegree of coverage was not high enough taking into account the very large range ofneeds for information in the EPA. And secondly that the possibilities for combining andpresenting data across the different subject areas were generally poor.
From these conclusions the next question was how to perform a top-down analysis of thedata needs of the Danish EPA.
The basis for analysis.
The basis of a top-down analysis should be a clear identification of the objectives andtasks of the organisation in question. The objectives define the criteria to be used whenevaluating the progress of our efforts. In the case of the Danish EPA the primaryobjective could be defined as 'protection of the environment (against pollution)' - as theacronym EPA indicates. To reach this objective it is necessary to haveinformation/knowledge/data concerning at least the following issues:
• development of the state of the environment (including pressure on the
environment)• environmental problems• sources of pollution and their emissions• administrative aspects such as legislation and societal economy
This chapter describes how these issues were handled in the MIDAS project, includingsuggestions for a conceptual structure. Finally the issues are combined in an overallpicture of the world.
Data on the state of the environment
Data on the state of the environment are the kind of data usually referred to whenspeaking of environmental data. That is, data primarily describing quality aspects of therecipient in question. E.g. the concentration of oxygen in the sea, the amount of nitratein groundwater, the concentration of CO2 in the air etc.
The identification of a relevant set of parameters related to the various recipients is acontinuos project which is often carried out under the headline 'environmentalindicators'. The idea is to select among the numerous possible objects for measurementone or more parameters which are significant for the description of environmentalquality. It is of course also crucial that the choice of parameters is realistic, viz. that it ispossible to set up a monitoring programme producing the required time series of data.
Parameters / indicators are needed at many different levels of detail. At the mostgeneral level one could speak of indicators on the quality of air, water, nature and soil.Depending on your definition of the term 'environmental' it might also be relevant to

18 The conceptual framework
include indicators on urban areas and e.g. human health. At the more detailed level youmay have indicators describing the water quality of every lake and stream based onmeasurements concerning the biological, physical and chemical state of the recipient inquestion.
The level of detail for indicators depends on your policy needs. The question is, at whatspatial and temporal level do you need to document the state and trend of the recipient.In this context an important question is how to aggregate data from one level ofresolution to another.
The most important use of data on the state of the environment - at least seen from anadministrative and policy oriented view - is to get an overview of the developmentwithin the relevant area. Is the quality of the recipient getting worse or better?
For policy oriented purposes it is also useful to have data on the objectives for thevarious types of recipients and their different levels in the hierarchy. This information isused in combination with the indicators to survey whether the development of the stateof the environment is satisfactory or not.
The possibility of combining these information types in a meaningful way presupposesthat the objective and the indicator(s) are substantially equivalent or at leastcomparable.
If the trend deviates significantly from the objective, it is important to put some effortinto the identification of the reasons for this, and if possible to take new actions to alterthe development.
The pressure on the environment is another important aspect: what is the actual ‘load’of various pollution-causing substances to the recipient in question?
The total pressure is of course identical with the total amount of emissions from allsources of pollution; but for any specific recipient, the actual pressure may very welldiffer from the summed-up emissions of the local sources of pollution. E.g. the imissionof nitrogen to a specific lake can not be calculated just as the sum of nitrogen emissionsfrom farming, sewage cleaning plants, air-borne depositions etc. Chemical, physical andbiological processes influence the amount actually carried to the lake.
Our suggestion for structuring the relevant data on the state of the environment is foreach type of recipient in question and for the different levels of detail:
Qualityparameters/indicators
Defined objectives forenvironmental quality
Pressure (type andquantity)
Data on environmental problems.
In the formulation of environmental policy it is necessary to have detailed and sufficientdata on the various environmental problems which threaten us both at local, regionaland global level.

The conceptual framework 19
In one way data on environmental problems may be viewed as a subset of the datadescribed in the former paragraph. Seen from this point of view an environmentalproblem is nothing more than a deviation from some state of normality or balance.However, in many contexts it seems reasonable to draw a distinction between generaldata on the state of the environment and data on environmental problems. And so wehave chosen to do in this data model.
Data on environmental problems basically comprises two dimensions: location andgravity. Where are the problems located and how severe are they? The first partincludes locating the problem in time and space (where and when/for which period), andthe second dimension presupposes a set of parameters describing the problem.
As described earlier the identification of relevant parameters is not a simple task.Taking eutrophication as an example, one may choose to describe the problem asmeasured concentrations of oxygen in sea waters below a certain limit-value; or as theobservation of widespread occurrences of dead fish in specific areas. The first parameteris in one sense the cause of the other as occurrences of dead fish may be caused by thelow concentrations. Both parameters can equally well be said to describe relevantaspects of the problem.
Data on environmental problems are necessary for at least two reasons. Firstly, theygive you the possibility of identifying the location and extent of the problem in question.Combined with knowledge of the causes of the problem (cf. the following section) thissupplies you with an instrument for defining a set of regulatory initiatives.
Secondly, data on environmental problems should also be used to get an overview of theproblem field as a whole. Sometimes the agenda of environmental policy is influencedmore by the mass media focusing on conspicuous environmental catastrophes than bylong-term, well-considered assessments of the gravity of the various problems. A solidbasis of data on these matters might contribute to aiming the efforts in the rightdirection.
As was the case with data on the general state of the environment it is also in this caserelevant to include information on quality objectives defined in existing legislation,international conventions or other types of regulation oriented towards environmentalproblems.
In this way the data needs in this area includes the following elements:
Location and extent of the environmentalproblem
Defined objectives for quality
Data on the sources of pollution
Seen from the point of view of a policy-oriented agency such as the Danish EPA thiskind of data is of very high importance.

20 The conceptual framework
The task of formulating environmental regulation has over time been based on changingassumptions/views of the world. Focus has been shifting from cleaning up pollutedareas, to using filtration techniques, to focusing on the sources of pollution, on humanbehaviour and on cleaner technologies1.
To be able to define and implement regulation oriented towards change of 'behaviour' itis necessary to know a lot about the internal structure and existing patterns for activityrelated to the various sources of pollution, e.g. industry, agriculture, energy production -but also households, sewage cleaning plants and waste management.
The analysis of which set of parameters is the most important for each societal sectoretc. should be based on a relationship between the various environmental problems anda relevant set of pollution sources. This relationship is based on knowledge of whichemissions are causing the pollution problems in question.
Taking industry as an example, different sorts of industrial activities may contribute todifferent environmental problems, such as hazardous substances in water, air pollutionand waste production. The task is to identify where and how the relevant emission-producing activity is taking place, and transforming this knowledge into datarequirements. Sometimes it is possible to transform activity descriptions from onedimension to another, e.g. by setting up an equivalence between production and somesort of economic indicator.
Thus the relevant set of data describing sources of pollution encompasses aspects onstructure and behaviour, socio-economic data, as well as estimations or measurementsof emissions.
As was the case with data on the state of the environment and on environmentalproblems, information on existing regulatory objectives is also relevant here. E.g. it isimportant to be able to combine data on emissions of phosphorus from waste watertreatment plants with the objectives for this kind of emission. Relevant data on sourcesof pollution can be categorised as follows:
Structural/behaviouralaspects
Emissions (type &amount)
Defined objectives
Data on regulation.
There are many kinds of environmental regulation. As described above regulation maysometimes be oriented directly towards specific recipients and their level ofenvironmental quality; towards specific environmental problems; or towards specificsources of pollution, e.g. societal sectors. Sometimes legislation comprises all theseaspects.
1 Although focus has been changing between the different strategies for pollution prevention all of them may of course be taken into use where helpful.The use of filtering techniques may well be used together with legislation on emission limits and the use of cleaner technologies.

The conceptual framework 21
Another way of viewing regulation could be based on a classification of the type of theregulation. Is it e.g. a law, a Government Order, a directive from the EU Commission oran action plan?
A third way of describing regulations is the spatial/geographical point of view: is itintroduced at and oriented towards a local (municipal), a regional (county), a national oran international level.
Information on different kinds of regulatory actions may in this way be used and viewedfrom several relevant points of view. In connection with the MIDAS strategy we havechosen to focus on the substantial aspects of regulation more than on the formal ones. Away of characterising regulation in a useful way (at least for the Danish EPA) includesanswering the following questions:
• which are the specified environmental objectives• which measures are to be taken to reach these objectives• what is the time schedule (when is the objective to be achieved)• what are the estimated costs of the initiatives
An environmental objective may be to (re)establish a certain level of environmentalquality; to reduce emissions (as a whole or from a specified set of pollution sources) to awell-defined quantity; or to try to impact societal activities in order to reduce anenvironmental problem.
Information on environmental objectives together with time schedules and estimates ofexpenditures constitutes a basis for evaluating the progress of efforts in the field ofenvironmental regulation. Using a buzz-word from the management world an importantcritical success factor for these activities can be defined as: fulfilling the environmentalobjectives within the time limit and without exceeding the economic limitations.
Obviously it is very difficult to make such evaluations in practice, primarily because theproblem area in itself is very complex. For example it may prove to be extremelyexpensive to make the necessary monitoring.
Based on an objective-oriented view a relevant sub-structuring of data on regulationcould be:
Specifiedobjective
Measures to betaken
Estimated time limit Estimated expendi-tures
Data on economy
Just as in the case of regulation, economy may be viewed both in connection withenvironmentally oriented themes and as a set of data in itself.
Regarding the first point of view one might wish to connect societal and privateexpenditures and income with the treatment of specific pollution problems and also withdifferent sources of pollution. E.g. it may be useful to know the societal expenditures

22 The conceptual framework
used for monitoring and cleaning up oil spill at sea. Or the expenditure on sewagecleaning plants at different levels of administration.
On the other hand viewing data on e.g. societal expenditures and incomes (taxes, fees)related to environmental protection as a whole may be interesting, especially if it is com-bined with knowledge of the different environmental problems and their severity, and ofthe sources of pollution. Are we using our economic capacity in this area in the rightway, or are we e.g. using a lot of money trying to cope with a minor, but easily regulatedproblem?
Other kinds of economic data are of course also relevant. One way of describing theactivity level of the private sector is to put economic figures on the specific trades e.g.gross domestic product at factor cost.
Another relevant set of figures concerns the EU subsidising in different fields ofproduction, especially in the agricultural sector. Subsidising one specific crop or way ofproduction may in this area have much more influence on the degree of pollution thanmany national action plans and legislative initiatives.
In the MIDAS concept we do not at present work with a general further structuring ofeconomic data, apart from the connection to the other types of relevant data which hasbeen described earlier.
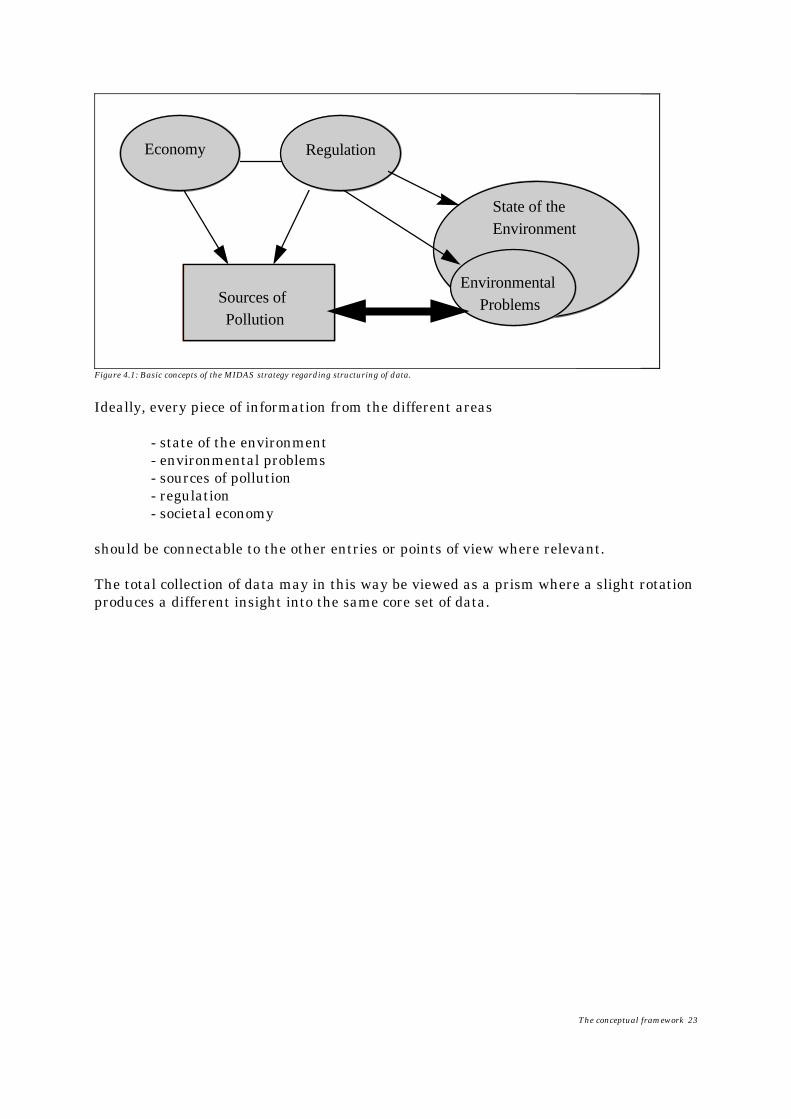
The whole picture: a core set of data and a relevant set of views of the world.
A basic idea in the MIDAS strategy is that establishing collections of data on thedifferent subject fields described above is not sufficient. Data are not put into real use(and made into relevant information) before they are viewed as a whole. That is, beforea given subset of data (e.g. data on regulation) can be connected to and viewed from theother entries (e.g. environmental problems and sources of pollution).
Looking at e.g. regulation through a sector entry there is a set of laws, action plans etc.for reducing the pollution problems imposed by industry. Seen as an environmentalproblem entry such as solid waste, a subset of these regulatory data may be connected tothe waste issue. But there will also be other relevant regulations connected to othersources of pollution, e.g. households and sewage cleaning plants.
Put together the basic concepts of the MIDAS strategy regarding data-structuring canbe described as follows:
The conceptual framework 23
Economy
State of theEnvironment
EnvironmentalProblems
Regulation
Sources ofPollution
Figure 4.1: Basic concepts of the MIDAS strategy regarding structuring of data.
Ideally, every piece of information from the different areas
- state of the environment- environmental problems- sources of pollution- regulation- societal economy
should be connectable to the other entries or points of view where relevant.
The total collection of data may in this way be viewed as a prism where a slight rotationproduces a different insight into the same core set of data.

24 The conceptual framework

The conceptual framework 25
5. Thematic analyses.
In Denmark there is a saying: 'What is the best way to eat an elephant ? - One bit at atime !'
This in a way is the idea behind having thematic analyses: they are a way of dealingwith the problem that there are so many aspects of environmental management andthus also of environmental data. The idea is to look at subject areas one by one, but stillwithout loosing the links between the different areas.
The objective of a thematic analysis is to assess the state of affairs in the relevant area;to pinpoint the problems and data gaps; and to set up recommendations or an actionplan to remedy any short-comings. In a way it is a mini data strategy for a specific fieldof work. By going through the areas one by one you will eventually have covered thewhole field in a way that allows you to go into detail with each subject.
To be able to do this it is important to have a framework for doing it. When making thefirst thematic analysis the MIDAS working group set up some rules of thumb for theirwork:
1. Look at environmental problems/themes, not at organisational departments.
2. Do not look at the object of analysis as an isolated issue - remember the datalinks to other environmentally relevant areas. E.g. data on chemical wastedeposits are relevant to both industry (industry is one of the sources of chemicalwaste) and to ground water quality.
3. Base your analysis both on interviews, existing data bases and writtenmaterial. Remember to ask both the users and the producers of data on therelevant problem.
4. When defining data needs and pinpointing shortcomings use the conceptualframework (cf. chapter 4).
5. Have a clear strategy when interviewing users and producers of data.
6. Put focus not on needs for databases but on products. Asking: "What databasesdo you need ?" does not lead to the same answer as "What products is itnecessary for you to supply ?"
7. Use the methodology and line of action that was used in the general MIDASstrategy (cf. table 11.1, chapter 11).

26 Thematic analyses
An example: production and treatment of solid waste.
It was decided that the first subject for thematic analysis was to be the environmentaltheme: production and treatment of solid waste. This area had high political priorityand it was realised that not all the relevant data were available.
Several departments in the Danish EPA had interests in data related to solid waste:especially the department working with the industrial sector and the departmentsworking with recycling and waste production from industry and households.
The working method was simple: relevant persons in the different departments wereinterviewed and written material on the solid waste area was collected and scanned.The information was assessed against the conceptual framework (chapter 4); differentaction plans (one on waste and a more general one); the EU directive 91/156/EØF andagainst the general knowledge of the MIDAS task force on environmental data work.
The result was a brief 12 page report with the aim of consolidating and improving theaccess to and use of environmental data on solid waste etc. The report contained anassessment of the state of affairs; an analysis of the data needs not met and a set ofconclusions and recommendations.
The report also included an analysis of the needs for data and the objectives of datawork within the area of solid waste. This is important to be able to assess the state ofaffairs and pinpoint relevant areas of priority. It is also important that there is a clearconnection between the objectives of data work and the general objectives forenvironmental management within the area. If for instance an increase in recycling hashigh political priority, high priority should accordingly be given to collection of data andestablishment of a database on e.g. the development in the level of recycling of differentproducts.
Data needs and objectives of data work.
The analysis of data needs and objectives for the data work centred around a model ofthe main component elements of environmental management (and accordingly data) inthe waste area.
It is important to have knowledge and information on the regulatory tools themselves.And it is important to have information on the factors this regulation is aimed at: thewaste itself and the import, production and consumption causing the production ofwaste; collection and treatment of waste; and the emissions caused by the treatment ofwaste.
The model in figure 5.1 supplies at one and the same time a depiction of the regulationand its objects and a description of the main categories of data needs.

Thematic analyses 27
REGULATION:
• the management tools, follow-up and results of the solid waste Government order• industrial sector agreements and their indicators / criteria of success• taxes (e.g. on packaging and waste)• environmental impact assessment of different treatment methods• waste treatment plans for the counties, their follow up, local regulations• clean technologies• information campaigns etc.
IMPORT /PRODUCTION /CONSUMPTION
• sources ofwaste
• behavioural patterns
• prognoses
• import / export of waste
WASTE
• amount• type• content
• prognoses
COLLECTION ANDTREATMENT OFWASTE
• treatment (recycling, incineration, depositing)
• location of treatment plants
• (spare) capacity of treatment plants
• amount of recyclable matter
• degree of recycling
• economy and costs of treatment
POLLUTION
• emission from treatment plants (residue and air pollution)
• emission from deposits (methane + leaking)
• emissions from waste transport
Figure 5.1: Regulation and main categories of data needed.
State of affairs.
This model was important when assessing the state of affairs and pinpointing the areaswhere data were needed. The existing data were described in their main categories,main external data sources were described and the main internal parties of co-operationwere summarised. A main finding was that many reports contained importantinformation, but that there was a need for more computer based information to makedata more easily accessible, to ensure updating of relevant time series and make iteasier to work with data.
Data needs not met.
Based on the two first parts of the analysis, a description was made of the data stillneeded. This was summed up in a table along these lines2:
2 The column 'coverage' is not filled in as the information from the original analysis is no longer valid.

28 Thematic analyses
DATA FIELD PRIORITY COVERAGE COMMENTS
MAPPING OF PROBLEM
Amount of waste, types, composition, origin,treatment
1 ISAG database
Collected amounts of recyclable material, degree ofrecycling
1
Waste production prognosis 2 Prognosis model needs dataon industries
Data on packaging 2
Composition of renovation 2
Amounts and composition of industrial waste 2 Pilot study going on
2
TREATMENT
Localisation and type of treatment plant /deposition site, economy and cost of treatment
1 New data will be coming inevery 4th year
Emission from treatment plants 2 Taken care of via emissionproject
Environmental and economic assessment ofalternative ways of treatment
1
REGULATION / ADMINISTRATION
Collocation of the waste treatment plans ofcommunities and their regulations
2 Okay for 1st generation ofwaste plans
Behavioural patterns of producers and consumersi.a. seen in the light of:
2
Different types of regulation, their costs and effects(e.g. industrial sector agreements, information,agreements on collecting waste
2
Environment-economical analysis (in progress onorganic waste, paper and beer cans)
1
Economical data on collection and treatment ofwaste
2
Effects of taxes 2
Table 5.2: result of analysis of data needs.
Use of the conceptual framework.
An important part of the background analysis was the use of the conceptual framework.It was used to provide examples of relevant data; to describe data in connection /context; and to pinpoint areas where data were still needed.
A very simplified version of the result is this:

Thematic analyses 29
SOCIETY/SECTORS: REGULATION:SECTOR: STRUC-
TURE:BEHAVI-OUR:
CONTRIBUTIONTO ENVIRON-MENTALPROBLEM
OBJECTIVE REGULATION EF-FECT
COSTS
1: DOME-STIC
Number ofhouseholds
Wasteproduction
Patterns ofconsump-tion
Participa-tion incollectionarrange-ments
Garbage fromhouseholds
x % recycling (Compulsory)collectionarrangements
'Green' systems forrecycling
Subsidies:x mill. DKKEstablishment: xmill. for greensystems, x mill.recycling of gardenwaste, x mill.recycling of largesized garbage
Large sizedgarbage
x % recycling
Garden waste x % compostChemical waste Prevention Clean technology
Recycling
Establishment ofreceiving stations
x - y DKK prhousehold.
2: INDU-STRYINCL.TRADE
...
3: CON-STRUC-TION
...
4: ENER-GY
...
5:TRANS-PORT ...6: AGRI-CUL-TURE
...
7:RECYC-LING(PLANTS)
...
8: INCIN-ERATION ...9: DEPO-SITS ...Table 5.3: Background analysis based on conceptual framework.
In the original form, the areas with no data were marked. The state of affairs haschanged since then, so that the marking is no longer relevant. With many otherenvironmental problems, there would of course also have been a column forenvironmental quality at the far left. In this context this was not included as waste is soclosely related to sectors and to regulation. The way that waste affects environmentalquality is included in the column ‘contribution to environmental problem’.

30 Thematic analyses
Conclusions and recommendations of the thematic analysis on waste.
The conclusions centered on the use of report-based data versus computer-based data;on the use of resources for data work; on the potentials of the ISAG-database(production and treatment of waste); and on the main categories of data needed.
Some of the most important recommendations were:
• the establishment of a database on spare capacity of treatment plants• the establishment of a recycling database• use of data on waste in a key data system• identification of relevant economical data• high priority to ISAG database• clarification of relationship to important suppliers of data• clarification of internal channels for co-operation on waste data in the EPA• focus on publication of data
These recommendations were presented to the management of the Danish EPA and onthe basis of them, an action plan was set-up for the waste data area.

Organising data in levels 31
6. Organising data in levels.
One of the findings of the MIDAS project was that the existing databases were seldomused in connection with each other. They were typically used as separate sources ofinformation and they were usually very closely tied to the department/the experts whohad the responsibility for updating and maintaining data.
Knowledge on the existence of databases as well as accessibility of databases acrossdepartments were low. Furthermore, it was difficult to get an overview of the DanishEPA's collection of data as a whole.
These problems were not primarily caused by technical limitations. They existedbecause the organisational set-up did not support a better knowledge of and access tothe databases.
This chapter describes the strategy chosen to cope with these problems. The primaryobjective was to put data to better use seen from an organisational perspective.
A catalogue of databases
In order to provide an overview of existing databases it was decided to establish acatalogue of databases. This would give experts from different departments thepossibility of searching and finding relevant sources of information in the organisationas a whole.
It was recommended that
• the catalogue should be accessible to everybody in the Danish EPA • all existing and future databases within the scope of the MIDAS project should
be registered • the catalogue should for each database comprise both environmentally relevant
information about the contents and some administrative information concerningownership, accessibility, frequency of updating etc.
• the department responsible for an actual database should also be responsible
for providing the required information about this database to the cataloguesystem
• updating data or modifying a database should immediately be reflected in the
descriptions of the catalogue. • a search in the catalogue system should at least be possible from four different
points of view: administrative information (e.g. updating frequency), a thematicentry (e.g. solid waste), the general contents of the database and finally a morespecific description of the contents3.
3One could e.g. choose to get an overview of the databases connected to a specific department; or to find all databases relevant for the theme "solidwaste"; or to locate the database comprising all "waste water treatment plants" in Denmark; or finally to use a search word such as "cadmium" to

32 Organising data in levels
The kind of catalogue system described above merely provides "data on data". It doesnot give the possibility to directly require data from the actual database when a matchto a search has been found. A feature like this would of course be very useful, but itwould also be quite expensive to develop. So it was decided to regard it as a futurepossibility for further development.
A common set of codifications/code lists.
If you want freely to combine data from different databases it is necessary that objectsand properties of the same character are identified and codified in the same unique andunambiguous way. That is, if a sewage cleaning plant appears in two databases, thisplant should be referred to in both databases by the same unique identifier (key).
On the attribute level some important common variables are substances and units ofmeasurement. If data on these parameters are codified in the same way it becomespossible to sum up e.g. emissions of the substance from various sources of pollution.
Establishing a common set of code lists covering the relevant pieces of information inthe field of environmental data is not a straight-forward and simple task.
Firstly, many data relevant for the Danish EPA are already collected, codified andstored somewhere else, e.g. in the municipalities or counties. The chance of a commonset of code lists being used at this level of data collection is very small. The best solutionof this problem is to ask the local collectors of data to make a conversion of their data toa "global" format before delivering them to the central database. The first couple oftimes this manoeuvre requires a close dialogue concerning specific conversion problems.But after a period of time there is a possibility that local data collectors may adopt the"global" nomenclature, if not for any other reason then because this will spare them thetrouble of converting data.
Secondly, it is in it self not easy to introduce generally accepted unique identifiers refer-ring to objects and qualities of the real world. The set of appropriate characteristics maydiffer quite a lot depending on your point of view and the tasks you are supposed tocarry out.
Furthermore the world is not static. If for example a specific industrial production ismoved from one geographical location to another, should the unique identifier of thisplant then be substituted with a new one or should it be kept?
In the Danish EPA we have worked for several years with the problems of datamodelling and generation of common code lists in the context of STANDAT4. We havechosen to use the code list system of STANDAT as the basis of a set of commonreferences. In this way the most urgent requirements for codification are covered.
locate databases having data on this specific substance.4 STANDAT is described in detail in the report "STANDAT - the Danish format for exchange of environmental data", Danish EPA, February 1996.

Organising data in levels 33
Presentation of data in levels.
As mentioned before the Danish EPA is an organisation with a very wide-ranging fieldof expertise. This implies that the educational background and areas of knowledge of theprofessional staff varies a lot. There are many biologists, engineers, chemists and otherpersons educated within the field of natural science. But there are also manyeconomists, legal experts and others skilled in social sciences. Furthermore the level ofknowledge concerning use of computer based systems differs very much.
To make environmental data usable for such a heterogeneous group of people requiresseveral levels of presentation and tools.
One sort of user is the person responsible for maintaining and using the data of a speci-fic expert database. This person probably knows in detail the expert field concerned.His or her primary needs are to be able to make a quality assessment of new input databefore updating the database; to get continual output from the database such as specificreports, graphical presentations and maps in an easy way; and if necessary to be able toproduce ad hoc analyses on data.
This is the kind of user and usage of data which was in focus during the period beforethe MIDAS project. There was a basic level of data, namely a series of mostly unrelatedexpert databases, which were rarely used in connection with each other:
Database on the Use of Fertilizers
Database on Energy production
Database on ... Database on ...Database on Industrial Plants
Figure 6.1: Level 1, expert databases.
But the analysis unveiled another sort of potential user and usage: the need of viewingdata from a thematic point of view. That is, within the scope of an environmental themeto be able to get a complete presentation of the existing relevant data. These data mayconcern any of the various angles described in chapter 4. E.g. when analysing data onbathing water quality it may be very relevant also to include data on location andemissions of sewage cleaning plants, as storm water effluents are an important source ofpollution in this context.
A natural "tie" between different types of environmental data is the geographicaldimension, that is the geo-references connecting data to specific locations in space. Andthe obvious tool for presenting thematic data of this kind is of course GIS.
This brings forward another conceptual layer of presentation:

34 Organising data in levels
Database on the Use of Fertilizers
Theme: Surface WaterQuality
Theme: Solid Waste
Database on Energy production
Theme: Air Quality
Database on ... Database on ...
Theme: ...
Database on Industrial Plants
Figure 6.2: Level 1 and 2, expert databases and themes.
Different strategies may be chosen for establishing thematic presentations. Onestrategy would be to define a theme, e.g. eutrophication and produce a specially madeGIS-application including only the thematically relevant sets of data. This would resultin a series of dedicated presentations and leave no possibility for viewing data in new,user-defined connections.
Another strategy could be to use the GIS as a general frame for acquisition andpresentation of data, connecting every geo-referenced collection of data with the system.This provides the user with the possibility of combining data freely. A possible drawbackof this kind of solution may be that as the set of different data collections grows, it maybecome difficult to keep an overview of the system as a whole.
The final part of the data presentation hierarchy concerns the key data. This concept isdescribed in detail in chapter 7.
The key data and the key data system are to be conceived as a possibility of getting anoverview of (aggregated) environmental data relevant to the Danish EPA as a whole,and selecting and presenting these data in a structured and user-friendly way. Datamay concern e.g. trends in the state of the environment and key figures showingrelevant development parameters related to e.g. societal economics.
Key data should be used in strategic planning, e.g. by using data as input to simplemodels calculating future trends and economic/environmental consequences of variousscenarios. Key data are also useful in the work of developing and calculatingenvironmental indicators and to some degree environmental statistics.
In the MIDAS report it is recommended to develop a key data system according to thefollowing guidelines:
• there was to be a general read-only access for all staff of the Danish EPA • the department of Development and Data, and the Department of Economics
were to co-ordinate the collection of key data

Organising data in levels 35
• key data based on expert data bases were still to be the responsibility of the relevant departments • key data were as far as possible to be retrieved and aggregated directly from
existing expert databases in the Danish EPA • key data may also be required from sister institutions in the Ministry, from the
Danish Statistical Bureau and from other sources • the accessibility, flexibility and general user-friendliness of the key data system
were of the utmost importance. It should be easy to find data via the system andto produce relevant presentations on the basis of them.
On the overall level one of the MIDAS strategy recommendations was to organise datain the following conceptual hierarchy:
Database on the Use of Fertilizers
Theme: Surface Waters
Theme: Solid Waste
Database on Energy production
Theme: Air Quality
Database on ... Database on ...
Theme: ...
Key data
Database on Industrial Plants
Figure 6.3: The three conceptual levels of data.

36 Environmental key data

Environmental key data 37
7. A presentation system for environmental key data.
In the previous chapter an organisation of data in levels was described. The top levelwas the so-called key data level. This chapter outlines design considerations anddecisions concerning the Danish EPA’s prototyping of a computer based system forpresenting environmental key data.
Key data and user groups.
The interpretation of the notion 'key data' does not exclusively depend on the subjectarea in question. Also the organisational level of the potential user group has influenceon how a relevant set of data is to be selected. For example the top management hasother, typically more aggregated information needs than the expert responsible for aspecific subject area.
In the case of the key data system of the Danish EPA the group of users is veryheterogeneous. At first hand the system may be seen as an executive informationsystem. But the user group at management level is very small and it is generally notusing computer based information systems a lot in its day-to-day work. So, apart fromthe executives the most important target group for a key data system is the expert staff.This group of persons has highly varying educational background, very different areas ofexpertise and different levels of training in the use of computers.
User requirements for a key data system.
The range of both the subject area and the user group makes severe claims on thedesign and implementation of the key data system:
• the system must be easy to use, also for the untrained user• data must be structured in a way that makes it easy to find the relevant set of data
and to move around in the system • the scope of data must be large enough to cover all the main topics of interest for the
Danish EPA• the level of detail of data must be low enough to satisfy the needs for surveying
trends, and high enough to supply the necessary basic information• it must be easy to move up and down in aggregation level (i.e. to ‘drill’) concerning
temporal, spatial and other types of hierarchical resolution• production of different types of presentation such as data on maps and in various
graphic formats must be easy and the results must be of high quality• source identification, update specification and remarks on data quality must be
present for every set of data in the system.
It is described below how we have tried to cope with these demands in the process ofdesigning and developing a key data system for the Danish EPA. Firstly, oursuggestions for structuring data are presented. Next, the choice of software fordeveloping the key data system is described. The third and final issue concerns designconsiderations.

38 Environmental key data
Structuring of data
In chapter 4 we described a general framework for structuring data of relevance for aninstitution like the Danish EPA. This framework consisted of 5 main entries, namely
• environmental problems• the state of the environment• sources of pollution and their emissions• legislation, conventions etc.• societal economy
A more detailed level of structuring for each of these entries was also suggested. For an overview of the complete view of the world please refer to figure 4.1, chapter 4.
It is our assumption that having these five headlines it is possible to organise most ofthe data that may be relevant for a key data system5 in an adequate way.
In the prototyping project we have decided to restrict the subject area to surface water.
Choice of software tool
At first it seemed obvious that the software tool should be one of the existing EIS-tools.Many software-houses provide these tools which include facilities for developing aWindows-oriented presentation system with business graphics, drill-down-functions,traffic lights etc. But at that time most of the EIS-software packages lacked a veryimportant facility for presenting environmental data: the possibility of showing data onmaps and to make simple manipulations of such presentations.
Another possibility would have been to choose a GIS-tool. But an investigation of thesoftware available in this area at the time of decision proved that these tools did notoffer of the more general EIS-facilities needed.
Therefore, it was decided to make the development software ourselves. MicroSoft VisualBasic was used for this because it a. o. reasons was presentation oriented, inexpensive,easy to use and already in use at the Danish EPA. Furthermore it allowed for extensionsin the form of so called Custom Controls. In our case the required extensions wereprimarily oriented towards GIS-like functionality. A detailed specification ofrequirements was elaborated, and a software house contracted to develop the necessaryCustom Controls.
Today the trend is that EIS-tools and data warehouse oriented products (and also othertypes of software such as e. g. spread sheets) comprise map-presentation features, and
5 Subject areas such as chemistry and biology does not fit into this structure as stand-alone entries. But much valuable information from thesegeneral areas of expertise may be part of the information supplied in other entries. E.g. information on toxic and eco-toxic qualities of specificsubstances may be connected to the emission part of data on sources of pollution. This is one kind of solution based on the assumption that this kind ofinformation is supplementary and not to be regarded as key data in itself. If on the other hand another view of the world is taken, one might include asixth entry in the key data system, comprising these subsets of data.

Environmental key data 39
that end-user oriented GIS-tools include more general presentation facilities. If thedecision were to be made today these factors would have to be taken into account.
Design considerations
Design considerations concern four main aspects of the key data system:
• the menu flow• • the possibilities for presenting data• • the features for manipulating data in a presentation• management and control of flow and presentations
Regarding the main menu, the ordering and flow follow the principles for structuringdata described in the beginning of this chapter. That is, the sequence of possible menu‘steps’ reflects the picture of the world that the key data system is based on.
The main entries are: Recipients, Environmental Problems, Sources of Pollution,Regulation and Economy.
Besides this rather rigid path through the system, there is a need for establishing linksbetween different parts of the system. For example by connecting data on recipientssuch as streams and lakes with data on relevant legislation.
In this context the interpretation of the term ‘relevant’ defines the actual designspecification. E.g. the legislation relevant for a Danish stream such as ‘Gudenåen’ maybe defined at a very general level as every piece of legislative information related tosurface waters as a whole. Or, in the other extreme relevance may be restricted tolegislative documents related to Gudenåen at the precise time (year) defined in theactual context. Depending on the interpretation, more or less meta data6 will benecessary.
Concerning the question of facilities for making different presentations of data, this hasfrom the beginning been an important feature of the key data system. There are threeobvious ways of presenting environmental data: on maps; in various graphical forms;and as ‘raw data’, typically in a table.
We have chosen to implement these choices as buttons in the frame of the presentationwindow. This makes it easy to choose a new way of presenting your selection of data.
Obviously the user should be allowed to utilise as many as possible of the optionsavailable for designing and modifying a presentation. For map presentations thisincludes zooming in and out; moving around the map; adding and removing variousthematic layers such as administrative regions, forests, cities etc.; deciding on legends(number, size of symbols, colours). Concerning graphics the features of the businessgraphic tool in use should be available for the user. And regarding table-orientedpresentation it should be possible to use data in a spread sheet.
This set of features allows the user to adapt her presentation fairly freely.Working with data in a presentation window comprises two aspects:
6 This concept is explained later in this chapter.

40 Environmental key data
a. making a selection of data on basis of the variables available in the actual data
setb. making a further selection of data on basis of data values.
Ad a.: Data on live stock are relevant in Denmark as agriculture is an important sourceof pollution. Data describing live stock can for example be outlined by three variables,viz. year, county and type of live stock (cattle, sheep, chickens etc.). And the numberscounted may relate to either the number of animals or the number of farms having thisspecific type of live stock.
You are free to choose a specific combination of these parameters for presentation, e. g.the year of 1994, all counties and sheep. And to choose a presentation showing thenumber of animals.
Figure 7.1: Example of data presentation in key data system.
Ad b: You may also want to restrict your selection of data to comprise only the countieswhere the number of sheep exceeded 10.000 in the year of 1994. This may be relevante.g. when working on an action plan concerning the production of manure.
In the prototype this kind of selection is described in a specific button-activated windowas showed in figure 7.2.
Finally the sub-selection of data may be presented as e.g. a map, cf. figure 7.3.

Environmental key data 41
Figure 7.2: Example of selection of data.
Figure 7.3: Example of result of data selection.

42 Environmental key data
The future may reveal further user requirements for data manipulation of this kind.
Lastly, but in no way less important comes the question of controlling menu flow andpresentations in the key data system.
At first our idea was to make a straightforward application of the prototype, of coursehaving an overall design strategy but adding a new window for each new type of data tobe presented. After making an initial estimate of the number of windows necessary justfor the prototype theme surface water, it became clear that to be able to keep anoverview of data and to manage addition of data and system developments it wasnecessary to choose another strategy.
So we decided to base the application on a meta data approach. That is, to make theapplication data-driven in the sense that flow and presentations are generated at runtime on the basisof meta data on structural aspects and data contents.
The prerequisites for this approach are at least that
• • one or more templates for presentations of data and further menu selections etc. areestablished.
• the menu structure is described as data matching the menu template• • the connections/links between different parts of the system are described as data
matching the connection template• • each set of environmental data are described according to the specifications of a
presentation template• • an application for generating a series of presentations on the basis of the above data
and user selections is developed.
In this way the application becomes a kind of ‘presentation system generator’ in thesense that if the overall design elements of another key data system equals those of theprototype and the necessary set of meta data are elaborated, then the application shouldbe able to generate a presentation system for another view of the world/another set ofdata.
Apart from the elements mentioned above it is crucial for the usability of the systemthat one more application is developed to maintain and add new meta data, This isnecessary when expanding the key data system with new or revised data sets, links ormenu elements. If such an application is not available the possibility for keeping trackand overview of meta data is poor. And with the huge field of data potentially beingincluded in an environmental key data system, the question of overview and precision isof utmost importance.

The implementation process 43
8. The implementation process.
The previous chapters explained the main component elements of the MIDAS strategy.This chapter describes the implementation process after the issuing of the originalMIDAS report.
The process.
In the first phase of the implementation process the focus was on the thematic analysesof the waste area (described in chapter 5) and on the development of a key data system.
Especially the development of the key data system became a prolonged process. Thiswas mainly caused by the want of adequate software tools. At first, it was tried to set-upthe key data system by combining a GIS7-tool and an EIS8-tool. At that time no softwaretool existed that combined these two ways of presenting data in a satisfactory way. Thetest was made with data that were partly real data and partly invented data.
The resulting prototype was a success - apart from one important point: it was notpossible to integrate the two software tools, so you had to change software tool if youwanted to change from one way of looking at data to another. The incompatibilityproblems were so critical that the two parts of the prototype had to be presented withthe use of different types of hardware: one on a PC, the other on a terminal.
For this reason it was decided to try another tactic: to develop a software tool thatcombined the two ways of presenting data. This process was described in chapter 7.
It was important when launching the MIDAS project to have a method of ensuring thatthe process was iterative. This was done partly by making pilot-projects for some of themost important component elements of the MIDAS report. And partly by having anevaluation of the strategy after a period of one year.
This led to an adjustment of the strategy with a slightly different focus. Problems in theimplementation process had been discovered that made it necessary to introducecounter-measures if success was to be ensured.
Pilot projects and other projects.
An important point of the MIDAS report was to improve the co-operation with otherorganisations in the area of environmental data.
One of the most important partners for co-operation was NERI, the NationalEnvironmental Research Institute. Together with the counties and GEUS (theGeological Survey of Denmark and Greenland), NERI is probably the most importantdeliverer of data to the Danish EPA and an important user of data from the EPA. But
7 GIS means geographical Information System and is a way of analysing and presenting data on maps.8 EIS means Executive Information System and is a way of presenting data - typically data on trade, production and sales - using graphics.

44 The implementation process
the process of accessing and using data from NERI and vice versa was not always easy.This was regarded as an important impediment to data work in the two institutions.
For this reason it was decided to carry out a pilot project to uncover prospects for andimpediments to using each other’s data. The idea was to use the experience and know-how gained on other areas at a later stage.
The pilot project confirmed the experience gained from the MIDAS analysis: thatorganisational impediments are often more important in data work than purelytechnical problems.
The first thematic analysis was also carried out at this time. The process and outcome isdescribed in chapter 5.
The key data system and the concept of data organised in levels took its early start asdescribed in chapters 3, 6 and 7. The development processes were prolonged severaltimes. Both because the amount of staff dedicated to these tasks was small. But alsobecause especially in the case of the key data system innovative thinking was required -and this takes time.
The evaluation report and its results.
The evaluation report was issued about a year after the publication of the originalMIDAS report. The idea was to assess the methods and results after a year and afterthe completion of the pilot projects mentioned above.
The first part of the evaluation report was a recapitulation of the scope of the MIDASproject. This was necessary because myths had been forming in the period since the firstMIDAS report. It was especially important to emphasise what the MIDAS project wasnot and what things were not the responsibility of the MIDAS task force. It wasimportant to avoid the belief that the MIDAS project was some sort of magic wand thatcould supply data, databases, data-presentations and reports on the spot. Hard workwas needed, and even more important: hard work was necessary also outside theMIDAS task force.
The report also contained an assessment of the success of each of the MIDAS componentelements: the key data system, the idea for structuring data, the problems of obtainingdata, the thematic analyses, etc.
For each component element a set of recommendations was presented, and the reportfinally introduced a revised set of recommendations for the future organisation of datawork in the Danish EPA.
Together with recommending the continuation of the thematic analyses and the keydata system, important proposals were:
• fast decisions on software tools for thematic databases and key database
The implementation process 45
• better co-ordination between legislative / advisory work and data work to ensure thatthe collection of data needed for e.g. monitoring of the results of legislation can besanctioned in e.g. legislation
• start of project for creating a catalogue of databases• a special budget for data projects to make sure that the funds are available when
needed• improvement of standard contracts for data projects• postponement of several projects for resource-reasons• continuation of the principles of central storage of databases and common concepts
for design of databases and user interfaces
Much later ...
Especially for resource related reasons several of the recommendations of the originalMIDAS report were not implemented until much later. This goes for the appointment ofa data manager whose primary task was to provide a full overview of the databases ofthe Danish EPA and to establish a framework for maintaining this survey. It alsoapplies to the appointment of an extra database development co-ordinator.
An important vehicle for data strategic development was the Data Co-ordinatingCommittee of the Ministry of Environment and Energy. This group had been givenrelatively low priority for a long period, and existed as a fairly informal working group.In the early spring of 1995 it was re-formed under the chairmanship of the Danish EPA.Some of the tasks taken up were closely related to the ideas of the MIDAS report:having a catalogue of databases (at present this is made part of an Internet Homepage).Assessing and restructuring the organisational structure for co-operation on data. Andmaking a formal agreement on how to access and use data across institutional borders,cf. the pilot project mentioned above.
An element of the original MIDAS report that has not yet been implemented was theidea of arranging seminars or training sessions for staff in the Danish EPA workingwith environmental data.
To summarise, the establishment and use of a common pool of high-qualityenvironmental data is an important strategic element in an institution such as theDanish EPA. The process of defining and implementing the MIDAS strategy hasnevertheless demonstrated how difficult it is to make this idea part of the organisationalidentity.
To fully integrate data work it is necessary to envisage data as part of the workingprojects of the organisation in general - and not only as a sort of cumbersome effort orextra task to be accomplished after having finished the ‘real’ work. Confusing data workwith pure computer technical matters is a common mistake. The use of computers andsoftware as tools in the work with data is of course of utmost importance. But the toolsshould not be confused with the tasks.
Changing dogmas such as these is part of an educational process which should not beunderestimated.

46 The implementation process

Using experience from other organisations 47
9. Using experience from other organisations.
In this chapter differences and parallels between the EEA and the Danish EPA will bebriefly reflected on before discussing the way parts of the environmental administrativesystem in the United States has worked strategically with data. Lastly somepreconditions for working strategically with data will be summed up.
Differences and parallels.
Using experience from other organisations is not always as simple as it might seem atthe face of it. Trying directly to transfer experience from one organisation to anotherwill often lead to difficulties. Organisations work in different ways, they function indifferent environments, they have different set-ups, objectives etc.
Therefore it is important to get an overview of the differences and parallels between therelevant organisations.
There are some important differences between the Danish EPA and the EEA, some ofwhich have been briefly mentioned in previous chapters9.
One important difference is the fact that while the collection and presentation ofenvironmental data is so far the main task of the EEA, it is only one among many tasksof the Danish EPA. This means that it is natural for the EEA to put a very large part ofits resources into data work and some of these into long-term data strategic work.
Nevertheless, the resources available for long-term strategic data work seem at presentto be relatively larger in the EPA than in the EEA. This has to do with several facts.Firstly the EEA is still a new organisation that has to use many resources on capacitybuilding, establishing work routines etc. Secondly, many of the resources available tothe EEA are scattered throughout the extremely decentralised EIONET-organisation.These resources are an important basis for the work of the EEA, but they are not readilyavailable for the EEA in the same way that the staff in the Copenhagen headquarters is.Thirdly, the central EEA in Copenhagen has a staff of only sixty, and of these only feware in functions that are closely related to overall data co-ordination, standardising etc.
Another difference is the apparent need of the EEA to produce noticeable outputs. Thisagain has to do with the fact that the EEA is a new organisation with a great need fordemonstrating its usefulness. Long-term, strategic data work does not quickly generatespectacular products and is therefore likely to loose in the contest for resources in anyorganisation that gives very high priority to such issues.
One last important difference is that the EEA does not have any means of enforcementof its own when it comes to making the member countries follow strategies, collect dataor apply standards. The standard means of enforcement of the EU are directives, butthe EEA does not have any power to issue directives. Instead the EEA has to rely on thestrength of the argument, on the idea of common interests and on the competitive aspect - the fact that it would be embarrassing for many countries not to be able to deliver thenecessary data and not be mentioned in the different pan-European surveys.
9 In chapter 2, cf. also ‘STANDAT - a standardised format for exchange of environmental data’, report for the EuropeanEnvironment Agency. Danish EPA, 1996 - especially chapter 11.

48 Using experience from other organisations
There are of course also important parallels between the two organisations. Perhaps themost important parallel is that both the EEA and the Danish EPA collect data for use inthe administrative and political decision processes. Data are collected for the use ofdecision makers and for the use of the public, so that the state and the development ofthe environment can be assessed, results can be compared to objectives, problem areascan be pinpointed etc.
To sum up, the most important differences between the two organisations are that theEEA has a more scattered organisation in its EIONET structure; that the EEA hasfewer means of enforcement; and that the EEA has a more focused task. The mostimportant similarity is the way that data are used in the two organisations.
Environmental data in the United States.
In the following some main points and projects related to the work on environmentaldata in the United States are described. The United States are interesting because ofthe parallels in scale and because of some relevant individual projects.
The federal EPA has an Information Resource Manager function, and over time therehave been several attempts to standardise data collection and presentation. But theseinitiatives have mainly focused on separate environmental issues (typically a single-media approach), not attempting to integrate information across subject areas.
Furthermore, the degree of success of these projects has been low. For example thestrategy of developing and providing common software for registration of data hasgenerally had limited success. The reason is that at state level facilities of this kindhave either already been available or the individual states have preferred to developsolutions of their own. The differentiation is increased by the fact that focus on andresources for environmental management varies greatly from state to state.
Despite these problems, attempts at standardising data registration continues. A re-engineered version of the so called STORET system is under development. STORET wasoriginally developed back in the 1960s to store monitoring data on water quality. Manydata have been collected over time, but the quality of these data has generally beenuncertain.
A budget of 2-3 million $ has now been allocated to try to cope with this problem, andalso to move the STORET application from a mainframe to a client-server application.The strategy is to expand the registration part of the system with facilities forregistering meta data such as the purpose of data collection; organisational aspects(associated people and projects); and quality control standards applied when collectingdata.
A widespread use of a system such as the new STORET at state level would of courseimprove the quality of data considerably, also at federal level. But it is not possible totell whether the federal task force working with the project will succeed in getting theirsystem generally adopted.
The only project concerning integration of environmental information at federal levelthat we actually met during our stay at the United States was the ENVIROFACTSsystem. ENVIROFACTS is a collection of nation-wide data concerning many differentenvironmental issues, related to specific facilities/sites. The idea of ENVIROFACTS is tostandardise and consolidate basic identification information (key identifiers) on the

Using experience from other organisations 49
regulated facilities/sites, so that one may enter the database via these identifiers.Entries may be e.g. permits, chemicals (emissions), facility identification numbers orpostal codes.
The concept of the system is that of a data warehouse: provide the user with a metadata description of the data available and a toolbox of routines for searching, combiningand outputting the relevant data, based on the user’s selection of a specific set of metadata values. The success of this approach depends both on the range and quality of dataavailable in the system, and on how far is has been possible to actually ‘clean’ data. Inthe data warehousing terminology this means that you make it possible to combine databy using a standardised set of identifiers for all your data. This is not a simple task,especially not when the initial collection and quality of data is not well-known and well-described.
ENVIROFACTS is available at the WWW-home page of the US EPA(http:\\www.epa.gov/enviro/html/ef_home.html).
Initiatives such as STORET and ENVIROFACTS are important, but still they can not belabelled as general data strategies. More to the point is a set of recommendations forIRM (Information Resource Management) that the EPA developed some years ago10. Themain points are that EPA must:
• develop, immediately implement and enforce data standards• develop data integration policies and tools• define data requirements and identify gaps in the data inventory• reduce the burden on providers of information.
As a consequence of these recommendations EPA established a Key Identifiers Initiativein early 1995, to identify common data elements (termed key identifiers) widely usedthroughout the Agency and by State partners in the project. A guiding principle of thisinitiative is to be able to locate all environmental data related to the same place. Areport on this project has been launched in May 1996, and it is this approach which hasbeen used in connection with the ENVIROFACTS system.
So, although the long-term perspective is clear, there is still not a fully elaborated datastrategy at federal level. Maybe these are easier to find at state level, possibly becauseof the smaller scale. We have been made aware of relevant initiatives in the states ofWashington, Massachusetts, Texas and Oregon.
Looking a bit deeper into the efforts of Washington, there has recently been developed a5 year Information Strategy Plan. The goals of initialising such a planning process werein short to
• meet current and emerging information needs• examine the overall approach to data collection and management• develop a plan for improving the existing information infrastructure and information
systems.
The four main approaches identified during the planning process were
• multi-media information integration (across program areas)
10 ‘Using Information Strategically to Protect Human Health and the Environment’, Report of the IRM Strategic Planning Task Force, August 1994.The task force is a subcommittee of the National Advisory Council for Environmental Policy and Technology, which included representatives of allmajor groups concerned with EPA policy, from industry to States and local governments.

50 Using experience from other organisations
• cross-functional integration of information (e.g. between enforcement and releasedata)
• linking expenditures to activities which again are linked to environmental conditionsand results
• geographic-based analysis.
The plan furthermore comprises a schedule for the first five years of business areaanalysis projects.
So far, a general facilities database of hazardous waste sites including basic informationon latitude, longitude and regulatory contracts has been developed, and facilityinformation on wastewater discharge permits are being added. The system is developedwith ArcView as an end-user tool.
The creation of the integrated information system is estimated to cost at least $7million.
In at least one important way the organisational set-up of the EEA is very similar to theset-up of the American environmental administration: both have a central institution(the EEA / the US EPA) that is responsible for overall co-ordination in an organisationalstructure that is decentralised to a great extent, and at the same time huge in scale.
It was a general impression from a brief visit to different institutions in the Americanenvironmental administration that it is quite difficult with this organisational set-up tohave any large scale strategic projects that cover the whole country.
We have tried to sum-up some main points related to the IRM project and the MIDASproject in the following table. The idea is not to make a systematic comparison, or tomake an evaluation, but to highlight some main aspects of the two projects.
MIDAS (Denmark) Recommendations for ComprehensiveIRM
Responsible agency Danish EPA US EPAScope Danish EPA and the national data that
are the responsibility of the EPA.Especially production, organisation andpresentation of data.
Nation-wide
Objective(s) High-quality data to fulfil the needs of theorganisation with a minimum ofresources
Support of a comprehensive approach toenvironmental protection
Approach Problem analysis + valuable experience ->objectives + tool box + strategy.Implementation of overall strategycombined with thematic analyses forspecific areas.
Focus on integration of environmental dataacross the traditional single-media approach
Important componentelements / tools
• Conceptual framework• Data in levels• Key data system• Thematic analyses
General recommendations on data standards,data integration, data inventory and reductionof the burden of information providers
Special (e.g. software) tools Key data system ENVIROFACTSIn work since ... 1992 Recommendations launched in August 1994Table 9.1: Some main aspects of the IRM project and the MIDAS project.
Preconditions and rules of thumb for working strategically withenvironmental data.

Using experience from other organisations 51
To round off this chapter we would like to try and generalise on some of thepreconditions that are necessary for working strategically with environmental data.This is not only based on the MIDAS project, but also on what we have learned fromlooking at other projects.
First of all a realisation of the situation and of the need to act is of course necessary. Inthe MIDAS case this was facilitated by a new organisational set-up that included adepartment with the clearly defined task of looking into the strategic questions ofenvironmental data. Important in this context was also the willingness of all relevantmembers of staff in the many different departments to co-operate towards the objectiveof analysing the situation and setting up a strategy.
Secondly adequate resources are an absolutely necessary precondition. It is not just aquestion of quantity but also of quality: the resource base should be qualified not just inthe area of computer science, but also in the area of environmental science (biology,geology, chemistry etc.) and organisational issues. These three aspects are all vital forthe success of the strategic work. Furthermore, it is essential to have the necessaryresources at both the central level but also in the other relevant units of theorganisation.
An institutional anchoring for the strategy is important, preferably via some kind ofwritten statement. This might e.g. be in a work programme, where a special unit shouldbe assigned to the task and where it should be clearly communicated that the task isvital to the organisation and that it will need resources and commitment.
The commitment of the management of the organisation is extremely important. Theirsupport is material not only to ensure staffing and resources, but also to make sure thatthere is a general appreciation in the organisation of the importance of the project.
Focus in the whole organisation is necessary because a task force might be able to set upa strategy without assistance (though a less qualified strategy in that case) - but itwould not be possible to implement the strategy without the support and commitment oflarger segments of the organisation.
A group of dedicated supporters for the strategy and its implementation is also vital.Most important is of course the core group or task force that is responsible for the set-upand implementation of the strategy. But it is almost equally important to havesupporters outside the task force - people that believe in the strategy and are able topromote the ideas in the organisation.
The necessary hardware and software platform must of course be available. It must bewell-functioning, reliable and easy to use and supply the necessary range of user-friendly software tools. It is also important that a well-functioning ‘intra-net’ andpreferably access to Internet facilities are available.
The time factor is important - the project must not loose momentum if enthusiasm is notto disappear. To keep up the feeling of success it is important to have a range ofindividual milestones and to reach a couple of these per year.
The organisational side of the question should not be underestimated. Surprisingly oftenthe problems that have to be solved are in their essence not technical but organisational(e.g. the problem of having a clear division of competence, the problem of allocations ofresources, the problem of setting up procedures etc.) Another important factor is thequestion of attitudes to e.g. sharing data and using time for environmental data projects- this is often even more difficult to change than the other organisational aspects.

52 Using experience from other organisations
Organisationally it was an advantage that the implementation of the MIDAS strategywas the responsibility of a department that was also responsible in the Danish EPA forindicators, overall environmental strategies and general reporting on development inthe state of the environment and the pressures on it. This provided possibilities forsynergetic effects and for links and interplay between the different kinds of strategicwork. Furthermore a common problem was avoided: when data-strategic work is placedin the same department as tasks related to software and hardware it often becomesdifficult to maintain the resources for the long-term data strategic tasks.
Making the process iterative is the way to make sure that you have a mechanism forproviding the necessary adjustments through the implementation process. This can bedone through evaluations of results and reformulating of action plans etc. on the basis ofthese evaluations. In the same way prototyping is a good way of establishing aconstructive dialogue with the potential users of a system in the software developmentrelated to implementation of a strategy. Here it is important to be aware that if toomany resources are used for prototyping, there is a tendency to make the prototype thefinal system.
It is important to decide on a method. The MIDAS method has been to try and workalong the lines of a traditional planning method: analysing problems, setting downobjectives, setting up a tool-box, setting up an action plan - while still putting specialattention to organisational issues and hindrances. In other organisations it might workto use other, less structured, more bottom-up methods. The important point is to matchthe method to the organisation and make sure that the general objectives are clear aswell as the way to reach them.
Whatever method is applied it is a good idea to try to learn from the experience ofothers. This was an important aspect of the first MIDAS strategy report and suppliedimportant inspiration for both objectives, tools and implementation.
Counter-productive conditions.
Finally we would like to mention some of the things that can be counter-productive toattempts at working strategically with environmental data. We will not go into detailwith the circumstances that are negations of the preconditions just mentioned. Theyare:
• lack of resources,• no institutional anchoring,• no management commitment,• no organisational focus,• no dedicated task-force,• no adequate hard-ware and soft-ware• no attempts at using the experience of others• no awareness of method. One important organisational condition that can be difficult to combine with attempts atstrategic work is too much focus on immediate results and spectacular products.Strategic work need not stop all short-term product-oriented work. On the other hand if

Using experience from other organisations 53
all resources are employed in short-term tasks it will be difficult to find time for themore long-term work, that often has few immediate results.
To overcome this problem management realisation of the problem and managementdedication also to long-term projects is material.
Another important barrier to attempts at working strategically is organisationalresistance to attempts at co-ordination and standardisation - such resistance can bealmost ideological in its form.
The best way to overcome this is probably to try and make sure that the long-termefforts are combined with short-term projects that are valuable to key segments of theorganisation. It may however be necessary to combine this strategy with managementsupport to make relevant persons participate in the necessary projects.
Too large organisational scope can be difficult to handle because there will be moredetails, more stakeholders, more interests and more needs for projects to take intoaccount. The MIDAS idea of having an overall strategy and supplement it with thematicanalyses for specific parts of the organisation might be a solution for this.
Main points concerning preconditions and counter-productive conditions are summed upin this table:
PRECONDITIONS COUNTER-PRODUCTIVE CONDITIONSAdequate resources Too scarce resources / wrong kind of resourcesInstitutional anchoring Lack of institutional anchoringManagement commitment Lack of management commitmentFocus in the organisation Lack of focus in organisationDedicated supporters No supportAdequate software and hardware platform available No adequate software and hardware platformAn adequate method No coherent methodUse of the experience of others No attempts at using the experience of othersLong term perspective is accepted Too much focus on immediate results and productsAwareness of organisational aspects No awareness of organisational aspects
‘Psychological’ resistance to attempts at co-ordinationToo large organisational scope
Table 9.2: Helpers and hindrances in data strategic work.

54 Ideas for further development

Ideas for further development 55
10. Ideas for further development - and somedifferent approaches.
This chapter focuses on the future work on environmental data both in the Danish EPAand the EEA. Important questions are: based on the experience described in part one ofthe report, what further or revised elements might be added to the MIDAS-toolbox? Andwhat approaches might it be relevant for the EEA to apply in its data work ?
MIDAS II ?.
At the time being there are no plans for revising the MIDAS strategy: focus is onimplementing the ideas and projects described in the original report. But if we were tostart all over again, the experience we have made would prompt us to take some newelements into consideration. The most important of these are discussed in the followingparagraphs.
Visibility.
Visibility is one of the key words in this context. After the first period of enthusiasmabout the project in the organisation there is a tendency towards declining awareness ofand interest in the implementation process.
To avoid or merely diminish this, any strategy should comprise a specific set of actionsto be taken regularly in order to communicate the progress of the process. This could e.g.have the form of describing progress via articles or newsletters for internal information.Or via demos showing the latest milestones reached in software development
Deciding on how to keep people committed to the cause one should however be verycareful not to overdo the information effort, and not to announce a successfulachievement before it has actually been attained.
Motivation and resources.
Another aspect which is very important, but also very difficult to cope with is thequestion of how to convince your expert colleagues of the benefits of joining andcontributing to the implementation of a long-term strategy. Often they will feel thatthey have no spare-time available for new actions to be taken.
In this situation of scarce resources there is a natural tendency to always try to dealwith the most acute problems and tasks at first. People often realise the long-termperspectives in a top-down approach, but do not feel that they have the time for dealing with it. And even though the top management agrees on the objectives etc. of a strategy,it can also for them be a problem to allocate the necessary man-power.
One way to deal with this organisational problem is of course to make the managementforce people to co-operate on the implementation process. But the use of force is seldoman appropriate or effective solution.

56 Ideas for further development
The best solution is to convince people that there are also short-term advantages ofparticipating in the development and implementation process. E.g. that acquisition ofdata needed in their daily work will become much easier and take less time. Or that thepossibilities for producing more valuable and convincing presentations of data in theform of maps or graphics will be much better. But again it is necessary to be able tosatisfy such expectations once they have been nurtured.
A way of trying to include this element in a strategy might be to carry out some pilotprojects, where a small group of persons get special support in their work with data.Although some resources are in this way withdrawn from the overall implementationprocess, the effect of having small successes along the way may prove to be veryvaluable.
Software tools.
Another human resource related issue to be taken into account is the very varyingpreconditions among the staff for using information technology based tools. Theimportance of offering a broad selection of tools is quite evident. For example fewpersons in the Danish EPA will be able to fully use the facilities of a full-scale GIS-toolsuch as ArcInfo for analysing purposes etc. A larger group would be able to use thepresentation tool ArcView. But most people will - at least in the beginning - be satisfiedwith a much simpler and more dedicated tool for presenting data on maps.
The success of the tool-oriented part of a data strategy depends on the ability to offer asufficient selection of ways of accessing, selecting and producing presentations of data.
The outside world.
One last point is that it is vital to include strategy elements dealing with the worldoutside your own organisation. This is obviously relevant when speaking of datacollection: satisfying your data needs are rarely done be merely integrating data alreadyexisting within the organisation. So the formulation of procedures for achieving andupdating data from external sources is extremely important. This includes makingagreements on the questions of costs and time schedules for updating.
Another important fact to be included in a strategy is the growing demand for makingdata accessible to the public. This includes both the public in a broad sense, but alsoother institutions, private enterprises, international organisations etc. Both at nationaland at EU level the right of public access to environmental data collected by publicinstitutions have been legally stated.
This indicates that considerations concerning presentation of data on e.g. an existingInternet WWW home page for the organisation should be included as an important datastrategic element. Updating procedures and development of an appropriate userinterface are important issues in this context.

Ideas for further development 57
The rôle of the EEA
As described in part one of this report, it is crucial to be precise on the objectives andoutput requirements of an organisation when planning to make a data strategy. - Whatare the objectives, which products are expected and how are the success criteria for theorganisation defined?
It is not the task of this report in detail to answer these questions concerning the EEA.But in order to be able to discuss some potential directions of development, it isnecessary to outline some general considerations.
According to the Regulation 1210/90 on the establishment of the EEA some of the maintasks of the EEA are (according to Article 2)
• to provide the Community and the Member States with the objective information atEuropean level necessary for framing and implementing sound and effectiveenvironmental policies
• to record, collate and assess data on the state of the environment, to draw up expertreports on the quality, sensitivity and pressures on the environment within theterritory of the Community, to provide uniform assessment criteria for environmentaldata to be applied in all Member Countries
• to help ensure that environmental data at European level are compatible and, ifnecessary, to encourage by appropriate means improved harmonisation of methods ofmeasurement.
Output requirements include a report on the state of the environment every three years.
Until now some of the main outputs from the EEA have been the publication of theDobrís report (1995) and a review of the Fifth Environmental Action Programme(‘Environment in the European Union’, 1995). These publications are to be followed in1998 by the so called ‘Aarhus report’ and the first ordinary state of the environmentreport.
Input data for this reporting are collected from many different sources, a. o. frommember countries, via the ETCs and from Eurostat and the OECD.
It is obvious that success/failure of the EEA and the EIONET to a large extent dependson the ability to collect, harmonise, analyse and present the relevant set ofenvironmental data at European level.
An important question related to data work in the EIONET system concerns to whatextent environmental data are to be transferred to, managed and used by the EEA itself.
One possible development could be that only the ETCs collect, store and manage data,and that the EEA in Copenhagen acts merely as an overall co-ordinator and editor oftextual input from the ETCs and other contractors when producing state of theenvironment reports etc.
In this case there will be a need for supporting editorial functions at the EEA level byestablishing procedures and software support for e.g. document handling. Furthermore

58 Ideas for further development
it will be relevant for the EEA to offer some general guidelines on data work for theETCs. These should include a minor set of standards for registration of data (uniformidentifiers, code lists) and meta data (where, how, for what purpose, by whom, whenwere data collected etc.) in order to ensure a certain level of comparability and commonquality description.
If it on the other hand is decided that the EEA shall maintain a collection ofenvironmental data of its own, the question of how to select, collect, store, update andaccess these data becomes an important issue.
In the following it is assumed that the EEA decides to establish a data collection of itsown. If the most decentralised model is chosen instead, some relevant recommendationson how to cope with data standardisation may be found in a formerly published report11.
Some approaches for the data work of the EEA
Considering the pressure on the EEA concerning output expectations it is realistic toassume that focus in the organisation will be on meeting these demands. That implies a.o. tasks that much effort will be put in producing the expected reports on e.g. the stateof the environment of Europe.
Taking into account the very limited resources available for the more strategic datawork at the EEA, a possible consequence might be that data collection and analysis areclosely tied to the individual reporting processes. That is, data requirements are definedand data are collected and stored according to the specific preconditions and needs ofe.g. producing the next state of the environment report.
In cases where data work is very closely tied to the repeated publishing of reports thereare generally speaking three or four possible directions for development. One is theultimate ad hoc-solution, where data work starts from the beginning for eachreporting process. A possible consequence of this approach would be that the resultingcollections of data would become ‘islands’. That is, re-use of data and combination ofdata over time or across the various thematic entries would become difficult - or in theworst case: impossible. This way of dealing with data should only be chosen in the casewhere it is obvious that data demands vary so much over time and thematic entries,that e.g. maintaining time series is of no use.
If it is recognised, however, that the thematic scope of data needed to produce therelevant reports varies only to a certain degree from time to time, it might be preferableto choose a report-oriented approach. This implies that data needs are identified bymaking a more general analysis of the expected contents of the reporting in question,and that data are collected and stored according to the results of this analysis. With thisapproach it becomes possible to establish and maintain time series on core data in amore continuous way. And although it requires some initial resources to generalise thedata analysis and standardise data collection and storage, it will usually be proved thatless resources are required in the long run.
11 ‘STANDAT - a standardised format for exchange of environmental data’, report for the European Environment Agency, Danish EPA, 1996.

Ideas for further development 59
A further step towards a general approach would be to go through a report-orientedanalysis for the main output-requirements of the organisation, and combine theresulting data models where possible and feasible. That is, if e.g. data on emissions toair are required in several contexts, differing only in e.g. the level of detail regarding thesources of pollution, it would be more effective to collect these data at the lowest level ofdetail and make the necessary aggregations yourself, if possible. Furthermore thisstrategy should minimise the risk of having inconsistent data sets on the same subject.This approach is a generalised output-driven approach.
The last step towards generalisation is to combine this bottom-up approach (based onoutput requirements) with a top-down analysis, resulting in a more global data model.Speaking in the terms of general data analysis, it is a question of identifying therelevant ‘business areas’ of the organisation, and by step-wise refinement modelling thedata requirements of these areas in more and more detail, without loosing the globalview. Having defined this general framework, it should be possible to organise your datain a comprehensive and consistent way which is robust enough to handle the addition ofnew types of data.
Still, there are other aspects of data strategic work, and no matter which approach theEEA decides to base its data work on, the following questions should be considered:
• how can data be collected and stored in a standardised way ?• how are the responsibilities of the different participants to be defined ?• which tools should be supplied for accessing and working on data at different levels of
complexity and integration ?
Answers and solutions will vary in their degree of generality, depending both onresources available and on organisational culture. The MIDAS approach describes oneway of answering these questions; as it has already been pointed out any attempts atstrategic data work should be carefully adjusted to the organisation in question.
In any case it is recommendable to think carefully about how to organise the workconnected with environmental data. Otherwise many resources may be spent on copingwith day-to-day requirements and ad hoc-solutions, missing the long-term perspective ofestablishing a sound and adequate basis for the work of the EEA.

60 Ideas for further development

Conclusions and recommendations 61
11. Conclusions and recommendations.
In this chapter we would like to present our conclusions and some recommendations forthe future data strategic work of the EEA.
The most important conclusions of the data strategic work of the Danish EPA can berelated to the four component elements that were presented in chapter three -organisation, data content, human resources and computer and database aspects. Butthere are also some conclusions that have a more general scope.
The recommendations for the data work of the EEA is presented in boxes by the end ofthe five first sections of this chapter.
General conclusions.
One obvious question when presented with an environmental data strategy like MIDASis whether it is really worthwhile to work with data in this way ?
The answer is yes. It is worthwhile for several reasons, the most important ones ofwhich are that it provides a necessary overview of the whole field of your data work; itgives you the opportunity to pinpoint important problems and find the reasons behindthem; it ensures that you have a long-term perspective in your data-work; it guaranteesthat your perspective is not lost in the minor day-to-day problems; it forces you to clarifyyour objectives; it gives you a heightened awareness of the means available (and itforces you to define them !); it gives you an opportunity to involve important decisionmakers at management level in the data work of the organisation, and it can be a tool toensure that projects are defined also for areas where data work is ailing for staff-relatedreasons or the like.
But it is also important to keep in mind that experience from one organisation shouldnot be used undiscriminatingly in other organisations. The EEA already workingstrategically and on a long-term basis with its data in many ways. Nevertheless it wouldprobably be worthwhile for the agency to consider doing it also on a larger scale. Thiscould be done both by using the MIDAS methodology and in a more ad-hoc way, asdescribed in the box below and by the end of this chapter.
It has not been part of the terms of reference for this report to make any detailedanalyses of the needs for data strategic work of the EEA. In general, such needs can beestimated by considering the answers to questions such as these: are all the necessarydata available to the organisation ? Are data easily accessible to all users ? Is the out-put of the data work of the organisation satisfactory, i.e. are data published and used inreports in an adequate way ? Is the organisation of data work adequate, i.e. is thedivision of responsibility clear to all parties involved, is the work co-ordinatedsatisfactorily and are there no organisational barriers to data work ?
If the answer to one or more of these questions is ‘no’, it would be worthwhile for theorganisation to take a closer look at its data work.

62 Conclusions and recommendations
The EEA should consider working on a larger scale with data strategic issues. Depending on this decision, it shouldfirst of all be settled whether the EEA wants a proper data strategy or to work on a more ad-hoc basis. Depending onthis decision, either• define a project that will lead to an environmental data strategy in the MIDAS terminology (problem analysis,
use of experience from elsewhere, objectives, tool-box and action plan), put it in the work programme and makesure to get management support or
• define a range of individual projects based on a quick assessment of problem areas. These projects should all beable to contribute to data strategic objectives. The range of projects would of course depend on the resources thatthe organisation is willing to use, but on the basis of the experience of the authors and their knowledge of theEEA at least these aspects should be taken into consideration:
• presentation of data for management (and general public) purposes in an integrated system• common standards, guidelines and procedures for data work, including a common view of the world (cf.
the ongoing thesaurus work) and a model for all data related to the work of the EEA (cf. below) • organisational aspects including strengthening of co-ordinating procedures
Conclusions related to computer and database aspects.
There are two important conclusions here: that it is useful to use resources on a systemfor integrating and presenting your data. Apart from the obvious effects - that you get abetter structure and a better way of presenting your data - you will get many otherbeneficial side-effects. The different parts of the organisation are obliged to worktogether on the presentation system and this co-operation often leads to a synergy effect.The areas with no data are made visible to everybody in the organisation. The workprocess often leads to valuable discussions on objectives and methods in data work.Furthermore, the process and the product provides focus on the data work in theorganisation.
The second important conclusion is that it can be valuable to define an overall structurefor all databases of the organisation. In this way the hierarchy of data is made clear andthe way that all the different databases are interrelated is made explicit.
The EEA should consider whether it would be relevant to develop a system for structuring and presenting the mostimportant of its data for the use of decision makers and especially for the public. Made available on the Internethome page of the EEA it would be a very useful way to present key data and make them easily accessible.
The EEA should also consider trying to define an overall structure for the environmental databases in the EEA andin the EIONET structure.
Conclusions related to human resources.
The most important conclusion based on the experience of the MIDAS project is thathaving enough resources and the right resources for data strategic work is absolutelyessential. This might sound banal, but is often underestimated. Strategic data workneeds many resources, and they are often difficult to get because the results of this workare long-termed and sometimes do not take the form of one specific product.

Conclusions and recommendations 63
Another point is that the data strategic work should lead to the development of humanresources that are capable of working strategically with data in the organisation: peoplethat have the background and experience related to e.g. designing a data model for anorganisation and providing guidelines for database structuring.
If the EEA wants to work strategically with its data it is extremely important to allocate the necessary resources andthe right resources. It is also important to work determinedly with human resource development.
Conclusions related to organisation.
Perhaps the most important overall point related to organisation is that this aspectmust not be underestimated. It is often tempting to concentrate your energy oncomputer technical issues, software systems, technical aspects of monitoring andreporting, but without the formal and informal organisation to handle these aspects, youwill not achieve much.
With any fairly scattered organisational set-up, some kind of co-ordination becomesimportant. Not co-ordination in the form of a large bureaucratic organism. Butprocedures for co-ordination that ensure the necessary consistency in the organisation.This becomes especially relevant in an organisation of which the most important outputis data, and data that it should be possible to combine and link in many ways.
Co-ordination can take many forms: in can be taken care of via formal committees; itcan happen in more informal and ad hoc ways; it can be done through specific projectsthat involve several parts of the organisation and it can be done through common viewsof the world. Usually some kind of combination of different methods of co-ordination isthe most adequate.
For the EEA with the very dispersed EIONET set-up co-ordination is an important issue that needs closeconsideration. Today different formal bodies exist for this purpose (i.e. the ITTAG-group and the National FocalPoint group). That this work is efficient is important and it should be subject to a continuos informal evaluation andadjustment if necessary.
But apart from this other tools for co-ordination should be applied, e.g. common guidelines and formats.
It is also important to consider if the responsibility of all involved in the EIONET organisation is clear and explicit.And the role of the EEA itself in this context should be considered carefully. There is no other unit in the networkthat is naturally obliged to take care of overall co-ordination, common guidelines etc. Therefore it is important thatthe EEA takes the responsibility for such tasks despite the drain of resources that this might lead to. The effect oftaking care of these tasks are long-term - and so are the effects of not doing it.
Lastly, it might be useful to consider the internal organisation of data-strategic work in the EEA, cf. chapter 9.
Conclusions related to data content.
There are two important points here: working with MIDAS has demonstrated that it isuseful to define an overall structure and picture of the world for all your data. This isrelevant in order to get an overview, to be able to pinpoint data needs and to make theway that data are interrelated explicit. It is also valuable as a way of unifying the datawork in a large and diversified organisation - by working along the lines of some kindof common view of the world, some level of unity is obtained.

64 Conclusions and recommendations
Another point from the MIDAS project is that it is valuable to have some kind ofmechanism to ensure that there is a systematic method for evaluating the availabledata in detail and pinpoint needs and lacunas. In the implementation of the MIDASstrategy this is done by ‘thematic analyses’ on a rotation basis, looking at one subjectarea at a time.
The agency should consider the importance of having a common view of the world for its data to unify the data workin the very large organisational set-up that surrounds the agency.
Lines of action.
It is probably not possible to define one course of action that is ideal for allorganisations. Never the less the method of the MIDAS project can be summed up insomething close to a recipe that can be adjusted according to the needs of the users:
1. Preparations ! This is vital for your chances of succeeding. Make sure to have the necessary resources andthe necessary time, ensure the necessary institutional anchoring (e.g. make sure it gets into your workprogramme), ensure management back-up.
2. Set up your task force, agree on the course of action and a precise set of terms of reference.3. Problem analysis. Pinpoint the symptoms of problems, and analyse the problems behind the symptoms. Do
not be content with a mere identification of symptoms. Involve all relevant departments of yourorganisation through a series of interviews. Look for needs, for ideas, for objectives and for ideas for tools inyour talks with colleagues.
4. Analyse the experience of other organisations and pick out the ideas that are relevant to your organisation and to the mending of the problems you have identified
5. Define your tool box on the basis of 4 and 5. Make sure that you have tools that will cover all the relevantproblem areas
6. Define your objectives. These can usually be identified on the basis of the general functions and objectivesof the organisation and on the basis of the problems identified. Involve relevant departments of yourorganisation, remember the management.
7. Set up the strategy - a report or paper where you describe the problems, objectives and tools in theircontext.
8. Set up an action plan, preferably incorporated into the strategy. The action plan is very important as itdefines how the implementation process is to be carried out
9. Make sure that you have some mechanisms to ensure that the process is iterative and new requirementscan be incorporated into the framework of the strategy - e.g. evaluations and adjustments
10. Now the trouble starts: you have to implement the strategy. Make sure that the resources do not disappear,hold on to the institutional anchoring and the back-up of the management. You have to concentrate on eachof the different elements of the strategy, but you also have to keep an eye on thecontext. And you have to involve large parts of your organisation.
Please note that the order of the phases is not totally rigid. It can e.g. be debated atwhat stage of the process it is most adequate to define the objectives of the strategy.
There are of course a number of short-cuts that can be made. These are especially usefuland relevant if you decide to define a couple of individual data strategic projects ratherthan having a comprehensive data strategy. The most recommendable short-cut is toshorten the analysis phase by having a one-day or two-day seminar or workshop withkey persons from all the relevant segments of the organisation. The idea is to comprisethe phases three to eight into one short process. There are several well-tried methods touse in such a seminar. One of these is the Logical Framework Analysis method that isdistinguished by including problem analysis, objectives, outputs, activities and anassessment of resources needed in one coherent and logical analytic process.

Conclusions and recommendations 65
Furthermore this method is very suitable for group-oriented processes i.e. at a seminarwith important decision-makers and stockholders.
Whatever is determined it is important from the outset to decide on a method and nottry to go through the process in a more haphazard way.
Whether the EEA wishes to follow the path described here - or to follow part of it - isup to the organisation itself to decide. No matter what decision is made, it is importantnot to forget the long-term, strategic aspects of data work.

66 Conclusions and recommendations

Executive summary 67
12. Executive summary.
This chapter provides a quick overview of main points from the whole report. Thefigures in the left column refer to chapters, pages and figures in the report where therelevant information is elaborated and explained in more detail.
Chapter 1, p.1
Chapter 2, p.5
What is MIDAS ?
The name ‘MIDAS’ is used by the Danish EPA as an acronym for itsenvironmental data strategy. This strategy was initiated in 1991 and is nowunder continual implementation. A data strategy in the MIDAS concept of theword requires a problem analysis; an analysis of valuable experience madeelsewhere; the set-up of a range of objectives; a tool-box with a set of tools forachieving these objectives; and a strategy combining the tools and theobjectives in an action plan.
Chapter 1, p.1
Objectives of the report.
The present report is part of a package of project launched by the DanishMinistry of Environment and Energy for the support of the EuropeanEnvironment Agency (EEA). The main objective is to transfer knowledge andexperience of the MIDAS project to the EEA. The idea is not the adoption of theMIDAS strategy by the EEA, but to enable the EEA to use the MIDAS projectas an inspiration in its data strategic work.
Chapter 3, p.10f
Figure 3.1,chapter 3, p.9
The starting point.
The starting point of the MIDAS project was a problem analysis - an attempt topinpoint not just the immediate problems, but the reasons behind them. Fivemajor problem areas were identified:
1. Problems related to internal organisation of data work in the Danish EPA- there was decentralisation without co-ordination where it should be co-ordinated decentralisation
2. Problems in relation to the co-operation with other bodies outside theEPA mainly in the collection of environmental data
3. There was not enough demand for data and focus on data from the toplevel of the organisation and from the outside world
4. There was a lack of practical training - not in the use of specific softwaretools but in the general production and use of environmental data
5. Resources for environmental data work were scarce.
In establishing objectives, tool-box and strategy focus was on four aspects ofenvironmental data work: organisation, data content, human resources anddatabase aspects.
The tool-box.
After describing the background and problem analysis of the original MIDASreport, the present report looks into the tool-box of the MIDAS project. Some of

68 Executive summary
Chapter 4
the most important tools are presented in more detail, among them:
The conceptual framework - which is a tool for defining the main categories ofdata relevant when describing and analysing any field of environmental work.The objective is to ensure that the available data are comprehensive. Theconceptual framework can be put into a form and in this way work as a kind ofchecklist (see table below). Data on environmental problems are of courserelevant, and sectors in society are important, as they are the target groups formost environmental policy. Other important aspects are data on the state ofthe environment; data on regulation; and data on environmental economy.
State of theEnvironment
Env.Problem
Sources of pollution Regulation
State Pressure Locationand extent
Structural/behaviouralaspects
Contributiontoenvironmentalproblem
Objec-tives
Measuresto betaken
Timelimits/expenditure
Chapter 5 Thematic analyses - which is a way of dealing with a large subject area bydividing it into smaller bits. In the original MIDAS report it was not possible togo into any detail with the problems and data needs related to the manydifferent areas of work of the Danish EPA. Therefore it was decided to gothrough the different areas one by one with the double aim of pinpointingproblems and providing strategies for improvement. A set of rules for this workwas defined, and the conceptual framework was used for the definition of datagaps and data needs.
Chapter 6 Organisation of data - another idea of the original MIDAS report was to havedata in different levels to make it easier to combine data and use them in morethan one context. This involved a hierarchy of data according to their level ofdetail and to the way they were to be presented. The levels were expert data(the most detailed level); thematic data combining data from the differentexpert databases that were relevant to the theme in question (presented in aGIS-system); and keydata. This was completed by the idea of having acomputer based catalogue of data to supply overview and the idea of having adatabase of common data (data used in more than one database).
Chapter 7 The key data system - the idea of the key data system was to have a tool forstructuring, combining and presenting environmental data at the highest levelof aggregation to decision makers. The system was supposed to combinegraphic presentations and map-based presentations, and a special tool waslater developed for this purpose. In the actual implementation process thedistinction between key data, thematic data and expert data was dissolved sothat the key data system ended up including data down to a fairly high level ofdetail.
Chapter 4, p.14 ff. Some of the other tools recommended in the original MIDAS strategy are:Guidelines and procedures for environmental data projects; clear definitions ofresponsibilities related to data work; standard agreement with data suppliers;specialised training courses; strengthening of the data co-ordinating group inthe Danish Ministry of Environment and Energy.

Executive summary 69
Chapter 8
The implementation of the MIDAS strategy.
In the implementation process pilot projects and proto-typing were importantmethods. At the overall level, the whole MIDAS strategy was subject to anevaluation and reformulating after a period of a year. This was done to makesure that the strategy was up-dated and experience made useful.
Chapter 9
Using experience from other countries and agencies.
To broaden the perspective of the report a little, experience from the UnitedStates is discussed. Main points are summed up in table 9.1.
Preconditions etc. aresummed up in table9.2, p.53
An important point when discussing experience is the preconditions forinitiating data strategic projects and carrying them out. Important is also thediscussion of counter-productive conditions. When starting and implementingdata strategies it is vital to be aware of these conditions and to try to neutralisethem.
Chapter 10
Conclusions and recommendations.
Another way of summing up your experience is by discussing what you wouldchange in your approach if you had the chance. In the MIDAS context, morefocus would have been put on visibility and user-oriented intermediaryproducts to ensure continuous involvement by the whole organisation. Alsomore focus would be put on the range of software tools available and on aspectsconcerning the outside world, e.g. making data available to the public.
When your data work is very closely tied to the production of specific reportsthere is a span of approaches to collection, storage and retrieval of data rangingfrom an ad-hoc-model approach to a global data model approach.
Chapter 11 When you are going to decide whether data strategic work is relevant for yourorganisation, there are some questions that can be used as guidelines, e.g. areall the necessary data available to the organisation ? Are data easily accessibleto all users ? Is the out-put of the data work of the organisation satisfactory ? Isthe organisation of data work adequate, i.e. are there no organisationalbarriers to data work ? If the answer to one or more of these questions is ‘no’, itis worthwhile to take a closer look at the data work of the organisation.
The MIDAS method issummarised in thetable at the very endof chapter 11.
A suggestion for amethod for initiating
If a need for data strategic work is recognised there are basically two ways ofdoing it: the MIDAS method, comprising a comprehensive data strategy, or amore ad-hoc way. Basically it is a question of resources and time that decideswhich approach is most adequate. In the report it is recommended that theEEA considers its need for data strategic work. If it is agreed that there is sucha need the EEA could either define a project that will lead to an environmentaldata strategy or define a range of individual projects based on a quickassessment of problem areas. These projects should all be able to contribute todata strategic objectives. The range of projects would of course depend on theresources that the organisation is willing to use, but at least these aspectsshould be taken into consideration:

70 Executive summary
a more ad-hoc set ofprojects is presentedat the very end ofchapter 11.
• presentation of data for management (and general public) purposes in anintegrated system
• common standards, guidelines and procedures for data work, including acommon view of the world (cf. the ongoing thesaurus work) and a modelfor all data related to the work of the EEA
• organisational aspects including strengthening of co-ordinatingprocedures
Other recommendations concern:
• development of a system for structuring and presenting key data.
• allocation of the necessary resources and human resource development.
• co-ordination within the EIONET - apart from formalised co-ordinatingbodies e.g. common guidelines and formats can be used as mechanisms forco-ordination.
• organisation and especially division of responsibilities and the role of theEEA itself in relation to overall guidelines etc.
• a common view of the world for data to unify the data work in the very largeorganisational set-up that surrounds the agency.