Mid-Range Streamflow Forecasts for River Management in the Puget Sound Region Richard Palmer Matthew...
44
Mid-Range Streamflow Forecasts for River Management in the Puget Sound Region Richard Palmer Matthew Wiley Department of Civil and Environmental Engineering March 21, 2005
-
date post
20-Dec-2015 -
Category
Documents
-
view
217 -
download
2
Transcript of Mid-Range Streamflow Forecasts for River Management in the Puget Sound Region Richard Palmer Matthew...

Mid-Range Streamflow Forecasts for River Management in the Puget Sound Region
Richard Palmer
Matthew WileyDepartment of Civil and Environmental Engineering
March 21, 2005
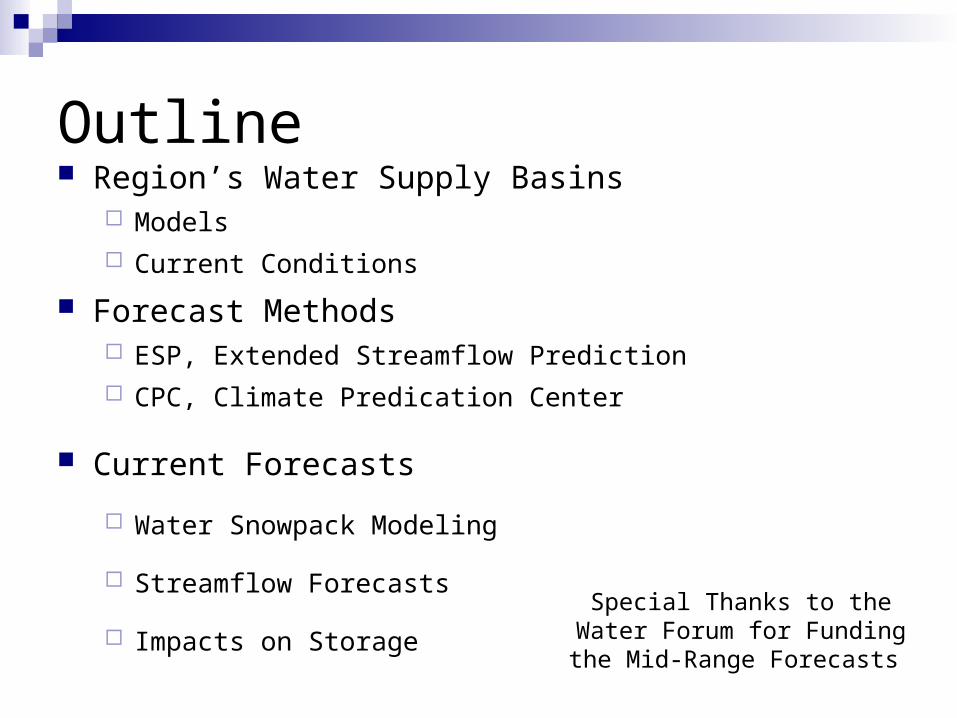
Outline Region’s Water Supply Basins
Models Current Conditions
Forecast Methods ESP, Extended Streamflow Prediction CPC, Climate Predication Center
Current Forecasts
Water Snowpack Modeling
Streamflow Forecasts
Impacts on Storage
Special Thanks to the Water Forum for Funding the Mid-
Range Forecasts
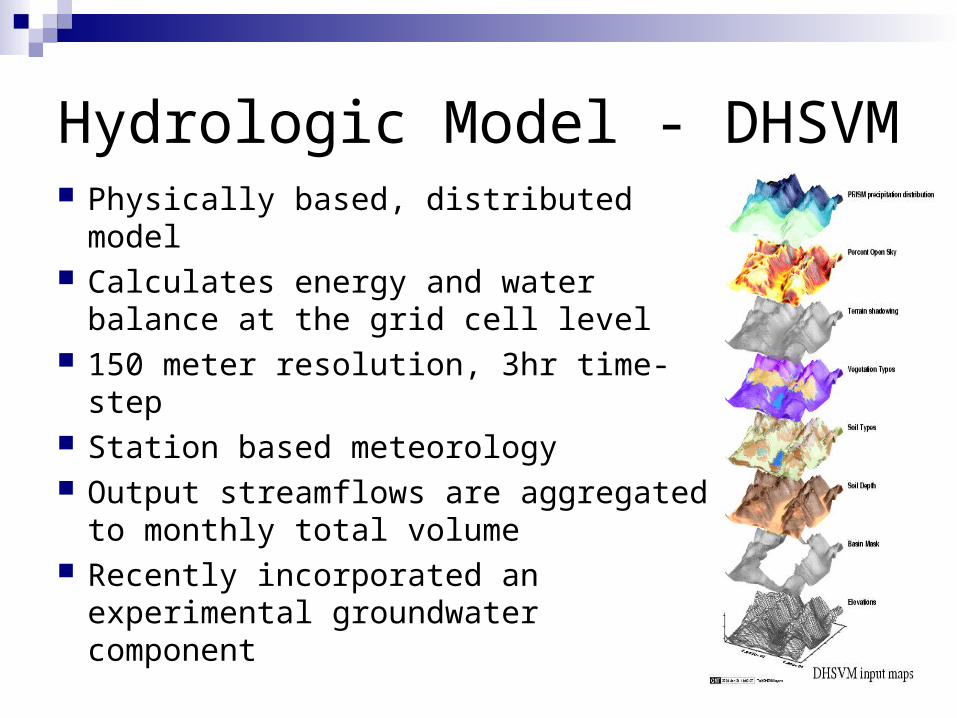
Hydrologic Model - DHSVM Physically based, distributed model Calculates energy and water balance
at the grid cell level 150 meter resolution, 3hr time-step Station based meteorology Output streamflows are aggregated
to monthly total volume Recently incorporated an
experimental groundwater component
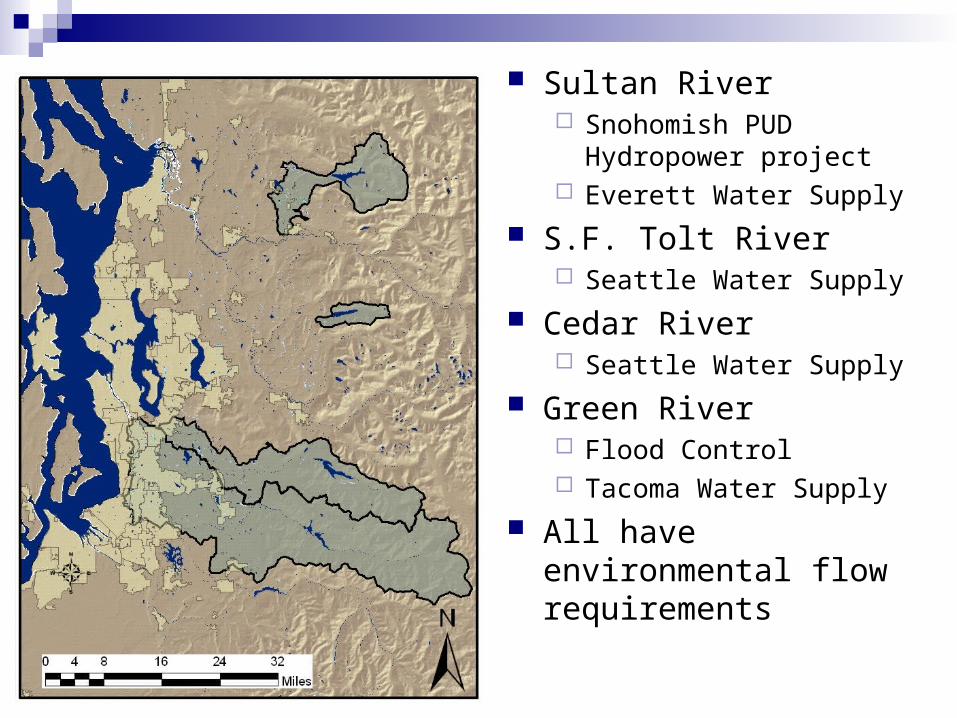
Sultan River Snohomish PUD
Hydropower project Everett Water Supply
S.F. Tolt River Seattle Water Supply
Cedar River Seattle Water Supply
Green River Flood Control Tacoma Water Supply
All have environmental flow requirements
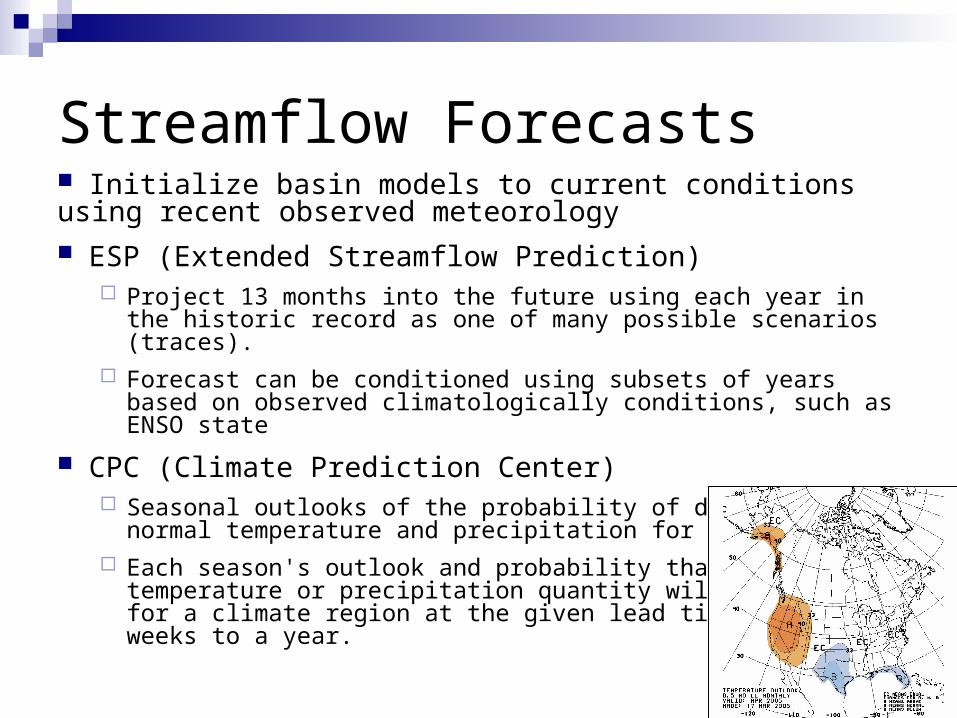
Streamflow Forecasts Initialize basin models to current conditions using recent observed meteorology ESP (Extended Streamflow Prediction)
Project 13 months into the future using each year in the historic record as one of many possible scenarios (traces).
Forecast can be conditioned using subsets of years based on observed climatologically conditions, such as ENSO state
CPC (Climate Prediction Center) Seasonal outlooks of the probability of deviations from normal
temperature and precipitation for 13 months Each season's outlook and probability that a temperature or
precipitation quantity will be exceeded for a climate region at the given lead time of two weeks to a year.
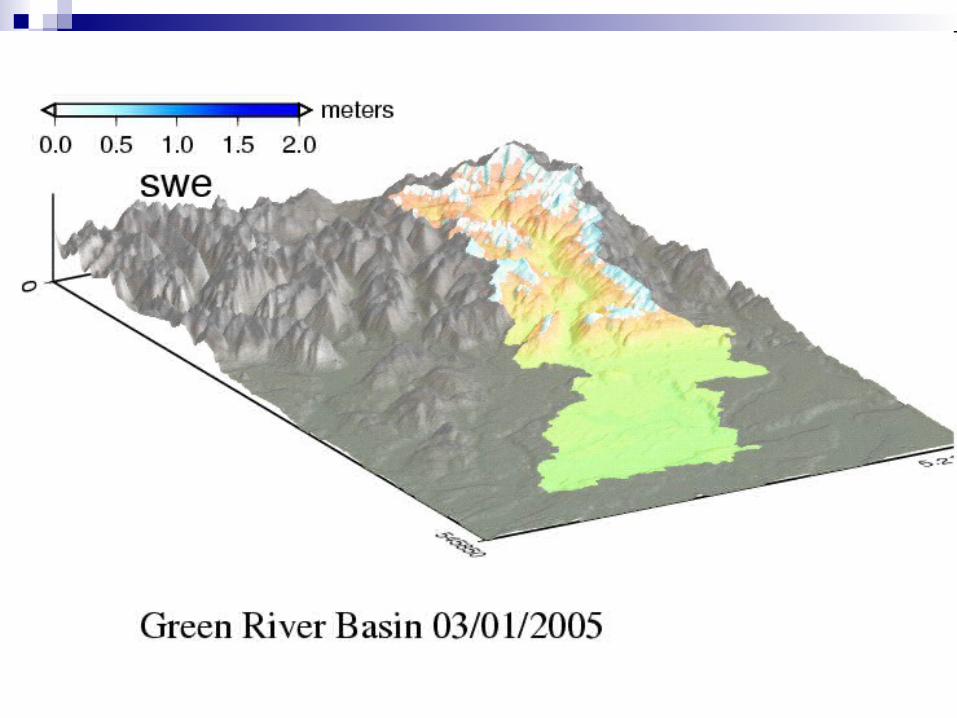
Modeling Snowpack
DHSVM allows evaluation of snowpack conditions over time
Provides graphical presentation of basin state Estimate of total water storage as snow Essential for evaluating the future based on
current conditions Provide spatial information to complement
Snotel and Snow Course information

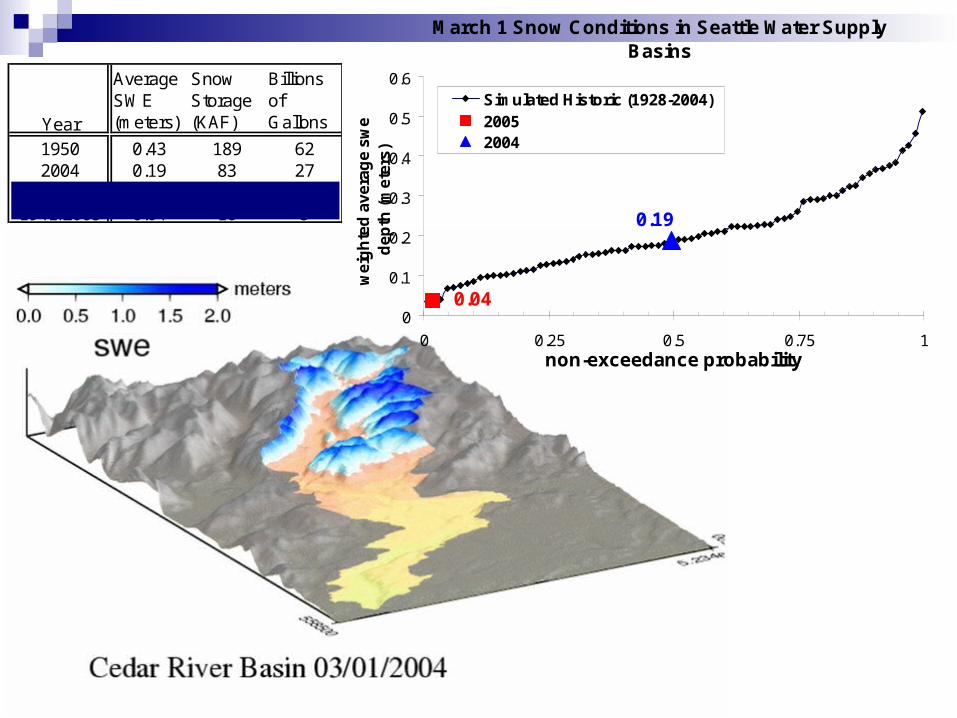
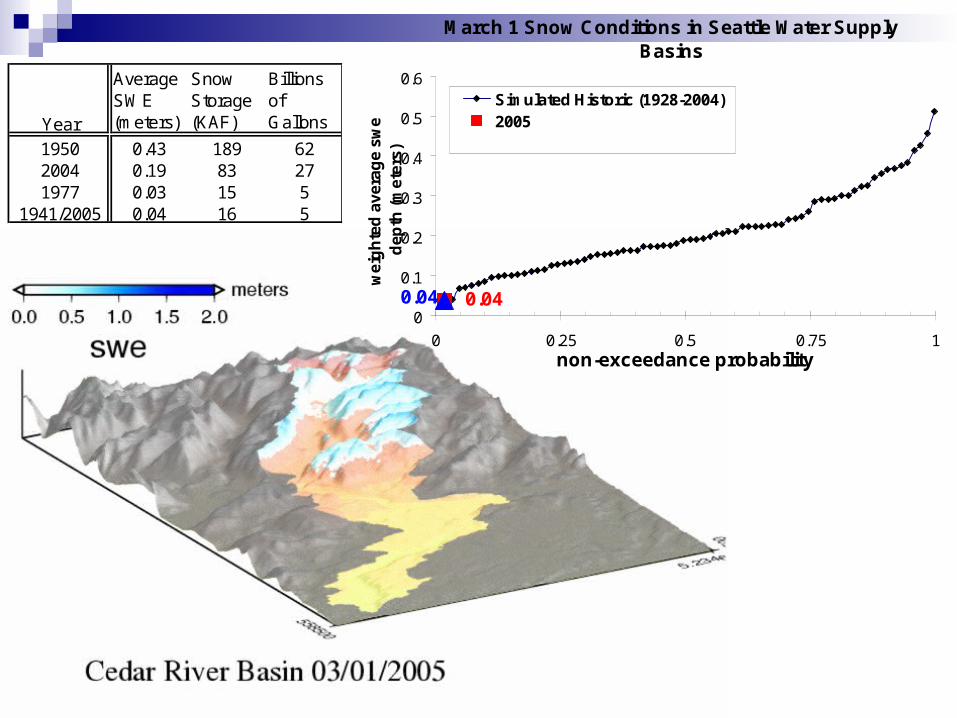
March 1 Snow Conditions in Seattle Water Supply Basins
0.04
0.43
0
0.1
0.2
0.3
0.4
0.5
0.6
0 0.25 0.5 0.75 1non-exceedance probability
we
igh
ted
av
era
ge
sw
e
de
pth
(m
ete
rs)
Simulated Historic (1928-2004)20051950
Year
Average SWE (meters)
Snow Storage (KAF)
Billions of Gallons
1950 0.43 189 622004 0.19 83 271977 0.03 15 5
1941/2005 0.04 16 5
March 1 Snow Conditions in Seattle Water Supply Basins
0.04
0.19
0
0.1
0.2
0.3
0.4
0.5
0.6
0 0.25 0.5 0.75 1non-exceedance probability
we
igh
ted
av
era
ge
sw
e
de
pth
(m
ete
rs)
Simulated Historic (1928-2004)20052004
Year
Average SWE (meters)
Snow Storage (KAF)
Billions of Gallons
1950 0.43 189 622004 0.19 83 271977 0.03 15 5
1941/2005 0.04 16 5

March 1 Snow Conditions in Seattle Water Supply Basins
0.040.030
0.1
0.2
0.3
0.4
0.5
0.6
0 0.25 0.5 0.75 1non-exceedance probability
we
igh
ted
av
era
ge
sw
e
de
pth
(m
ete
rs)
Simulated Historic (1928-2004)20051977
Year
Average SWE (meters)
Snow Storage (KAF)
Billions of Gallons
1950 0.43 189 622004 0.19 83 271977 0.03 15 5
1941/2005 0.04 16 5
March 1 Snow Conditions in Seattle Water Supply Basins
0.040.040
0.1
0.2
0.3
0.4
0.5
0.6
0 0.25 0.5 0.75 1non-exceedance probability
we
igh
ted
av
era
ge
sw
e
de
pth
(m
ete
rs)
Simulated Historic (1928-2004)20052005
Year
Average SWE (meters)
Snow Storage (KAF)
Billions of Gallons
1950 0.43 189 622004 0.19 83 271977 0.03 15 5
1941/2005 0.04 16 5


Forecasts Results USGS 12137290 SULTAN1: Inflow to Spada
USGS 12147600 TOLT1: Inflow to SFT TOLT2: Below SFT
USGS 12115000 USGS 12117000 CEDAR1: Inflow to CM CEDAR2: Below CM
HH_INFLOW: Inflow to Howard Hansen
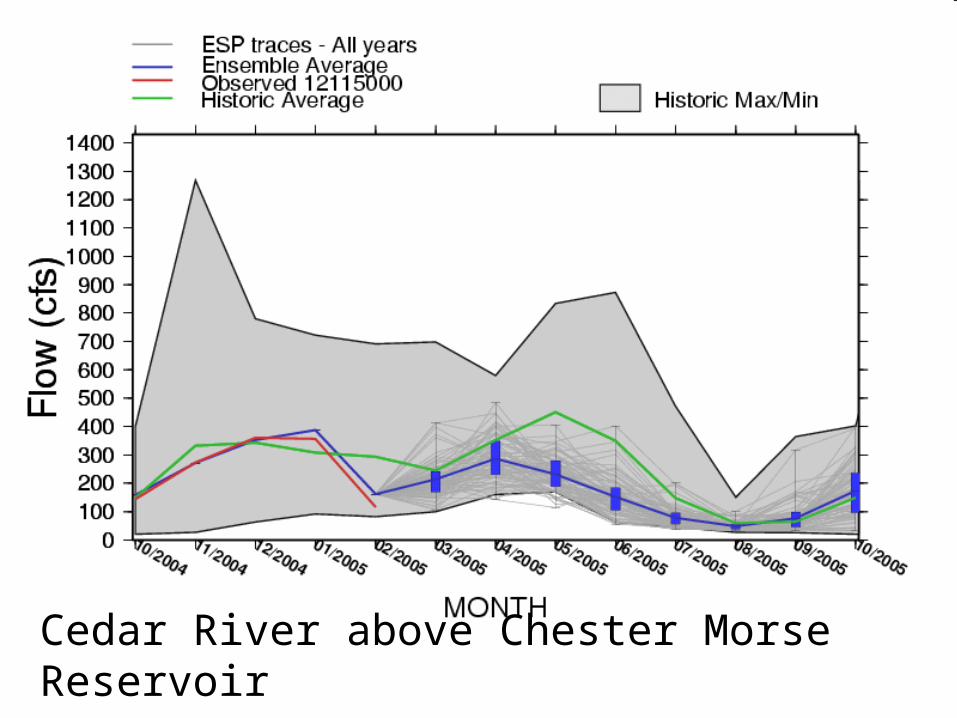
Cedar River above Chester Morse Reservoir

Historic probability of forecast value, MAMJJA reservoir inflows
6%
0
100
200
300
400
500
600
700
800
900
1000
0 0.1 0.2 0.3 0.4 0.5 0.6 0.7 0.8 0.9 1
Non-exceedence probability
Cu
mu
lati
ve
Infl
ow
s (
KA
F)
12115000
WY2005
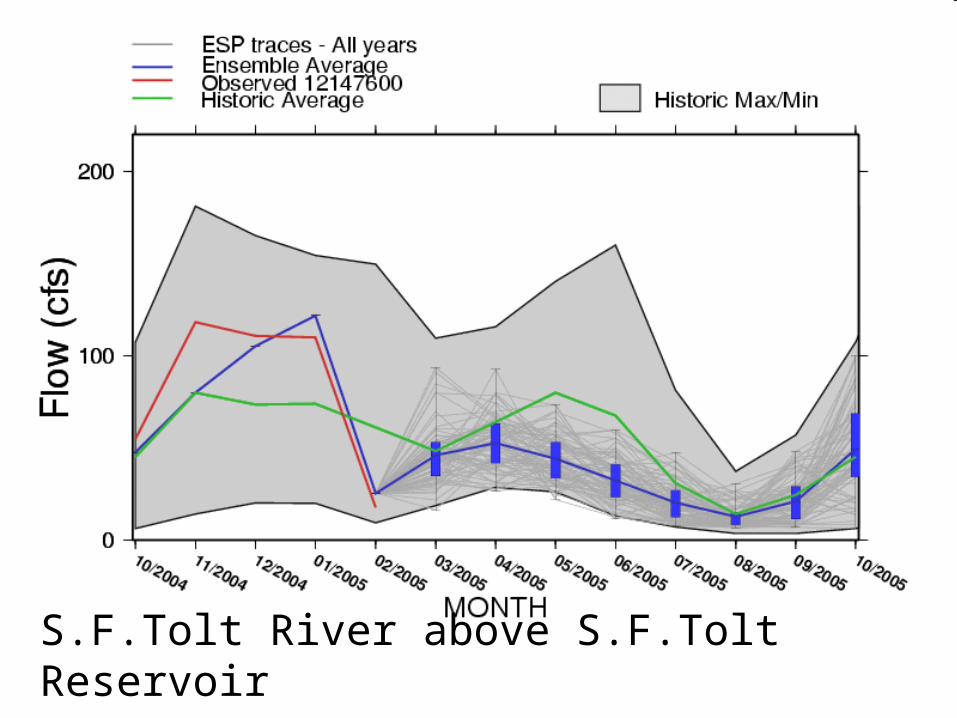
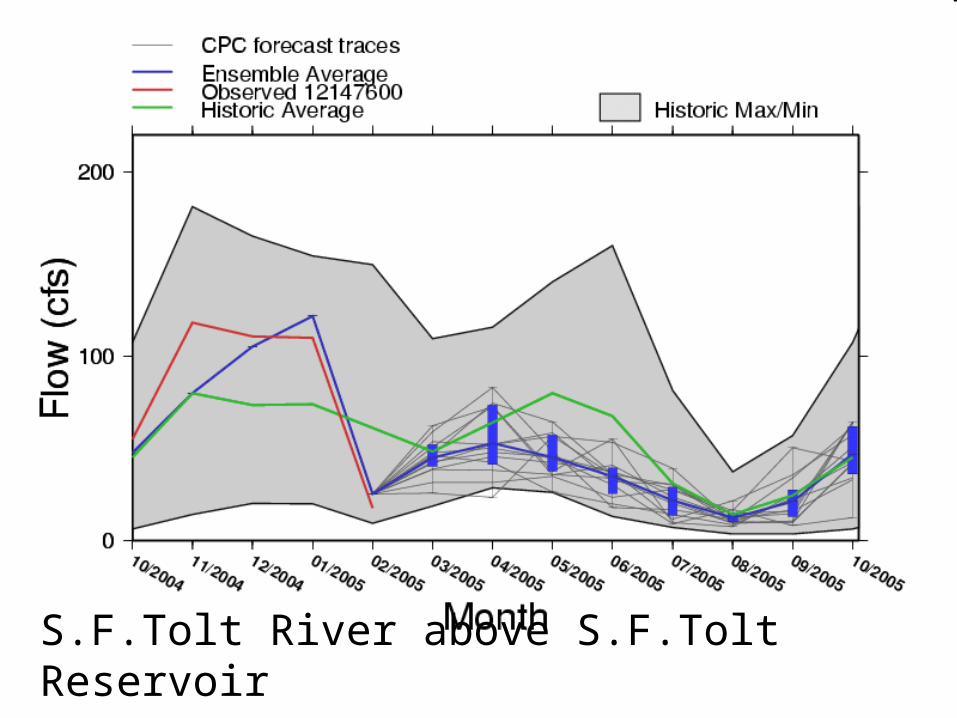
S.F.Tolt River above S.F.Tolt Reservoir

Historic probability of forecast value, MAMJJA reservoir inflows
4%
0
20
40
60
80
100
120
140
160
180
200
0 0.1 0.2 0.3 0.4 0.5 0.6 0.7 0.8 0.9 1
Non-exceedence probability
Cu
mu
lati
ve
Infl
ow
s (
KA
F) 12147600
WY2005

Green River into Howard Hansen Reservoir
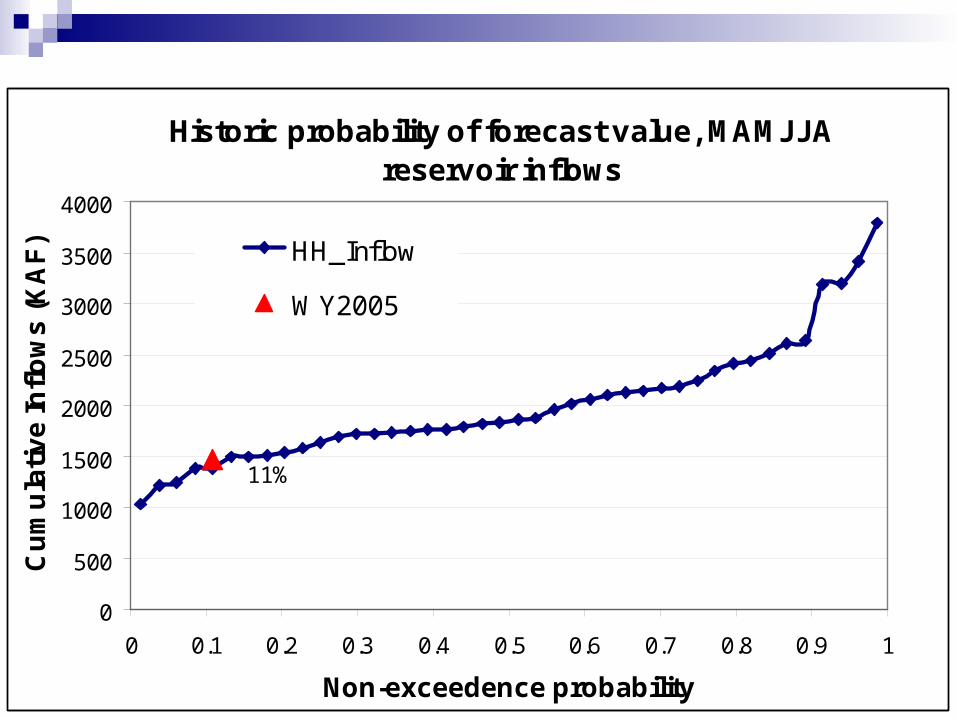
Historic probability of forecast value, MAMJJA reservoir inflows
11%
0
500
1000
1500
2000
2500
3000
3500
4000
0 0.1 0.2 0.3 0.4 0.5 0.6 0.7 0.8 0.9 1
Non-exceedence probability
Cu
mu
lati
ve
Infl
ow
s (
KA
F) HH_Inflow
WY2005
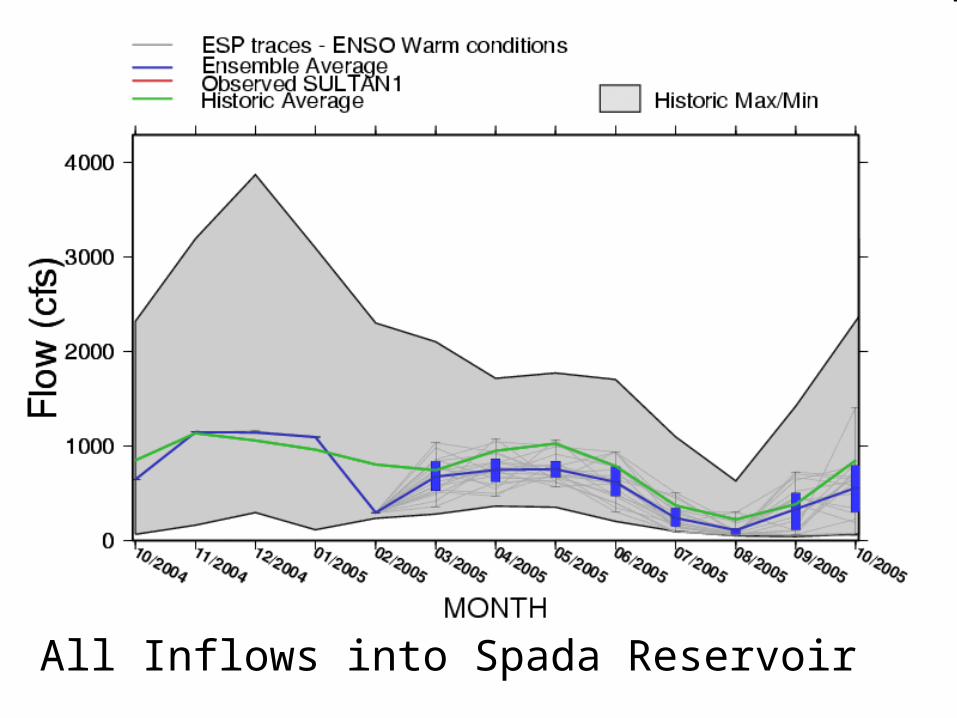
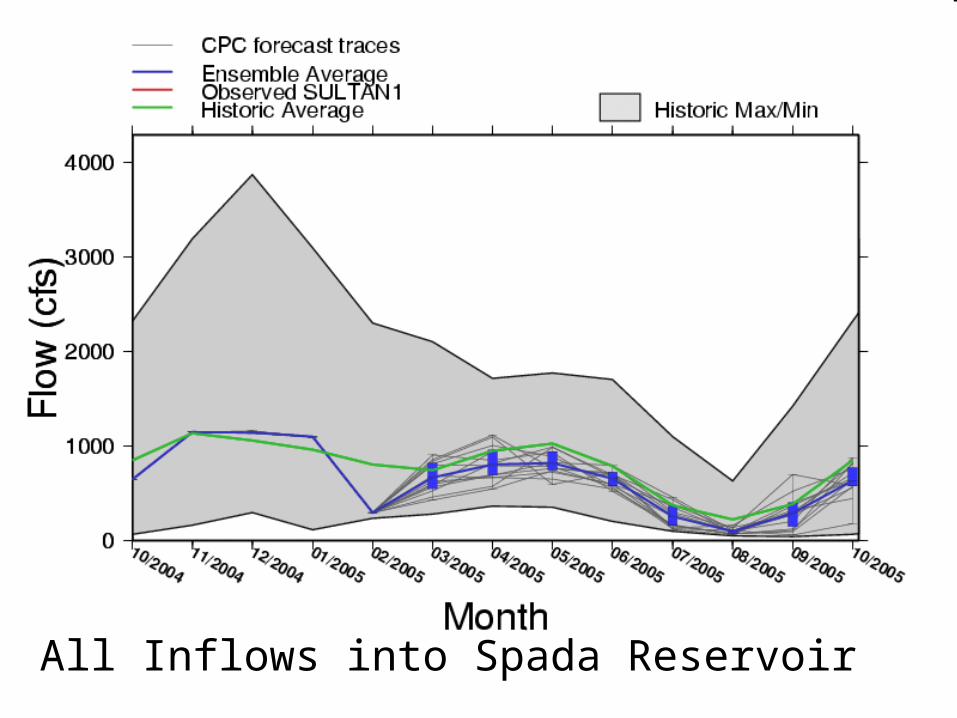
All Inflows into Spada Reservoir

Historic probability of forecast value, MAMJJA reservoir inflows
22%
0
500
1000
1500
2000
2500
3000
0 0.1 0.2 0.3 0.4 0.5 0.6 0.7 0.8 0.9 1
Non-exceedence probability
Cu
mu
lati
ve
Infl
ow
s (
KA
F) SULTAN1
WY2005

Implications to Water Supplies Factors to Consider
Current storage Inflows to reservoirs Inflows below reservoirs that contribute to fish
requirements Average demand and effect of conservation Availability of supplemental groundwater supplies “Normal” versus “Low” versus “Critical” instream flows
Examined Seattle and Tacoma systems

Potential System Storage Forecast
0
5
10
15
20
25
30
35
40
10/1
/200
4
11/1
/200
4
12/1
/200
4
1/1/
2005
2/1/
2005
3/1/
2005
4/1/
2005
5/1/
2005
6/1/
2005
7/1/
2005
8/1/
2005
9/1/
2005
Bill
ion
s o
f G
allo
ns
Historic Maximum
Historic Minimum
Historic Average
Initial Condition
FC_avg
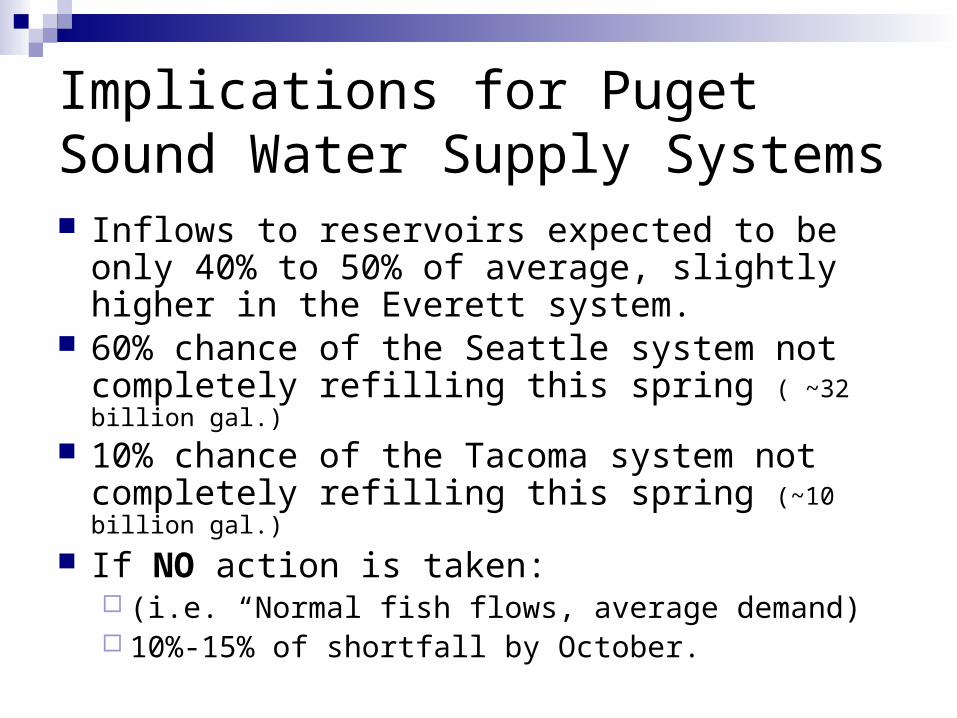
Implications for Puget Sound Water Supply Systems Inflows to reservoirs expected to be only 40% to
50% of average, slightly higher in the Everett system.
60% chance of the Seattle system not completely refilling this spring ( ~32 billion gal.)
10% chance of the Tacoma system not completely refilling this spring (~10 billion gal.)
If NO action is taken: (i.e. “Normal fish flows, average demand) 10%-15% of shortfall by October.
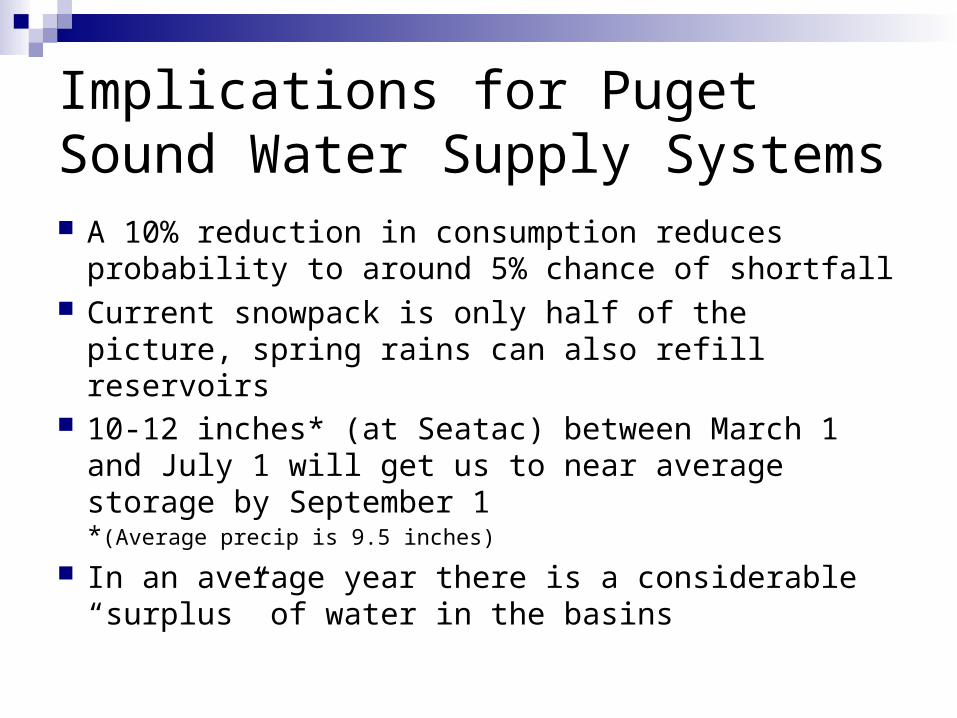
Implications for Puget Sound Water Supply Systems A 10% reduction in consumption reduces
probability to around 5% chance of shortfall Current snowpack is only half of the picture,
spring rains can also refill reservoirs 10-12 inches* (at Seatac) between March 1 and
July 1 will get us to near average storage by September 1 *(Average precip is 9.5
inches)
In an average year there is a considerable “surplus” of water in the basins
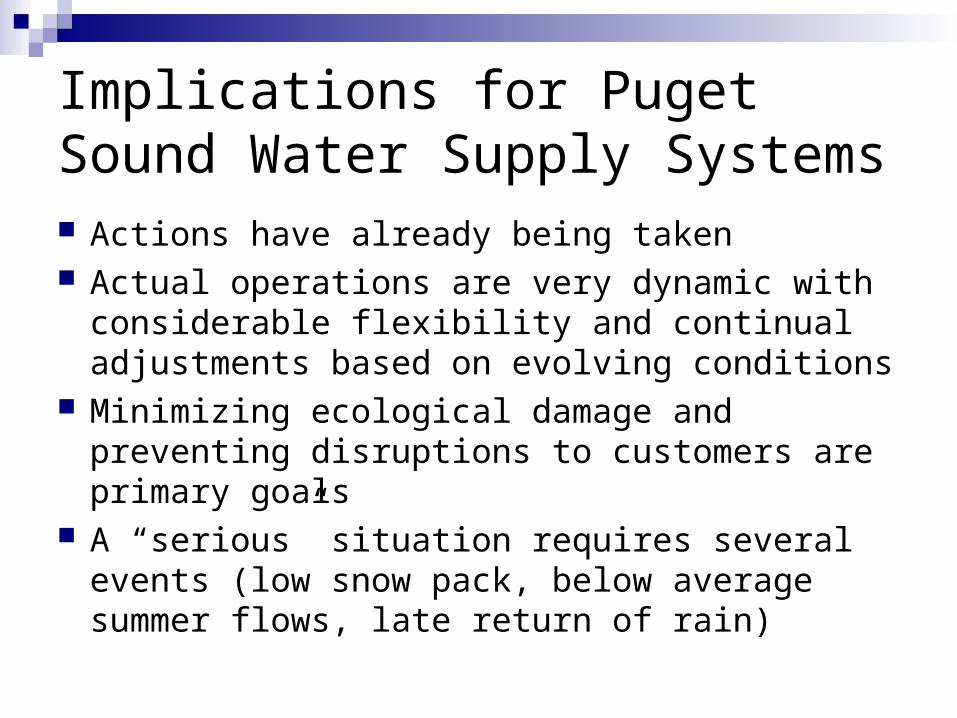
Implications for Puget Sound Water Supply Systems Actions have already being taken Actual operations are very dynamic with
considerable flexibility and continual adjustments based on evolving conditions
Minimizing ecological damage and preventing disruptions to customers are primary goals
A “serious” situation requires several events (low snow pack, below average summer flows, late return of rain)

Questions ?

CPC forecast: MAM

CPC forecast: MJJ

CPC forecast: JJA
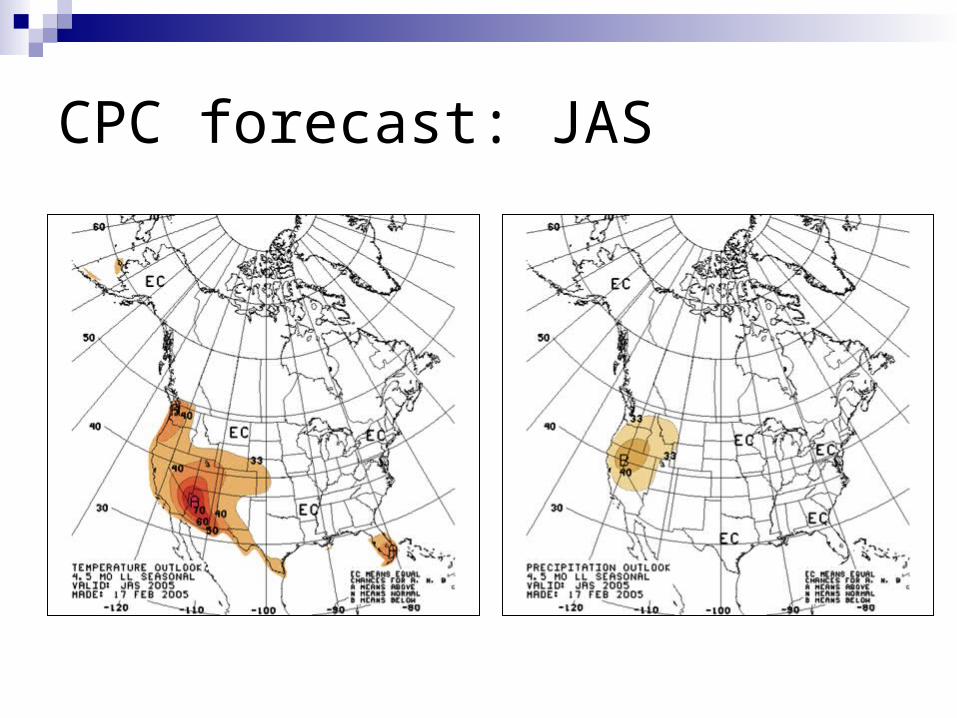
CPC forecast: JAS

CPC forecast: ASO
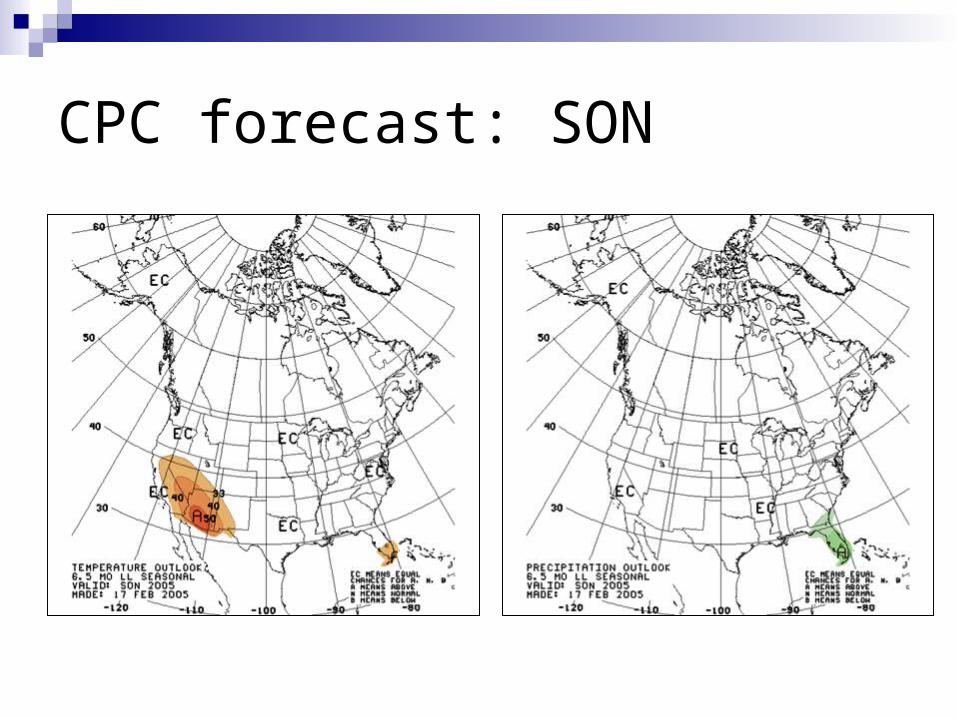
CPC forecast: SON

Cedar River above Chester Morse Reservoir

S.F.Tolt River above S.F.Tolt Reservoir

All Inflows into Spada Reservoir

Cedar River above Chester Morse Reservoir
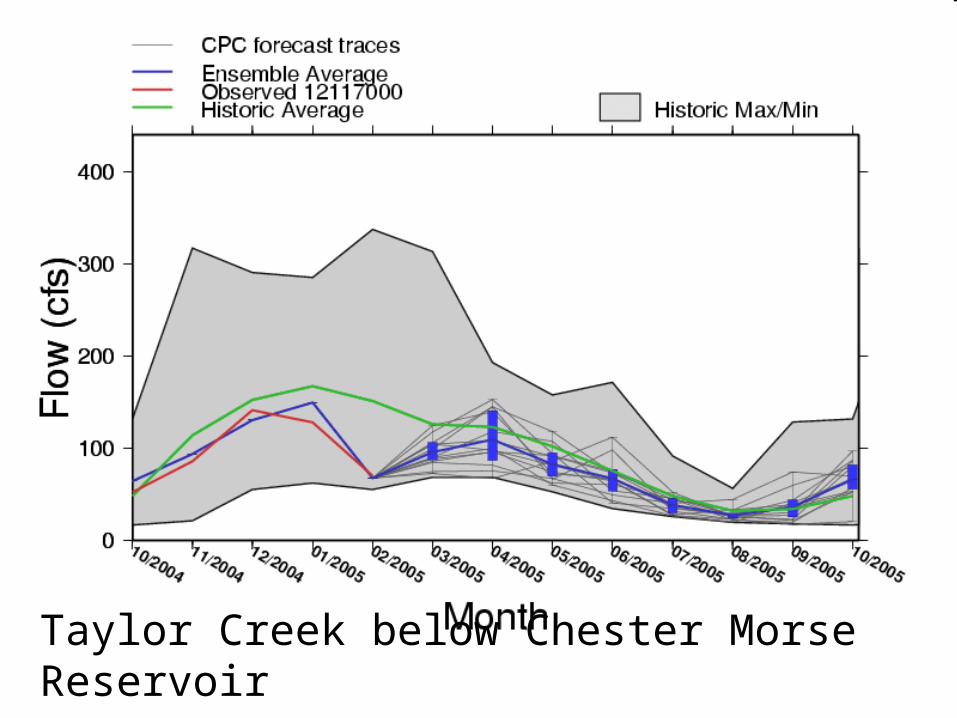
Taylor Creek below Chester Morse Reservoir
S.F.Tolt River above S.F.Tolt Reservoir

S.F.Sultan River above Spada Reservoir


Green River into Howard Hansen Reservoir
All Inflows into Spada Reservoir