Microwave Temperature Profiler (MTP)Microwave Temperature Profiler (MTP) MTP Science Team MJ...
9
Microwave Temperature Profiler (MTP) MTP Science Team MJ Mahoney, PI, JPL/Caltech Bruce L. Gary, Consultant SOLVE-2 Science Team Meeting Dryden Flight Research Center December 11, 2002
Transcript of Microwave Temperature Profiler (MTP)Microwave Temperature Profiler (MTP) MTP Science Team MJ...

Microwave Temperature Profiler (MTP)
MTP Science TeamMJ Mahoney, PI, JPL/Caltech
Bruce L. Gary, Consultant
SOLVE-2 Science Team MeetingDryden Flight Research Center
December 11, 2002
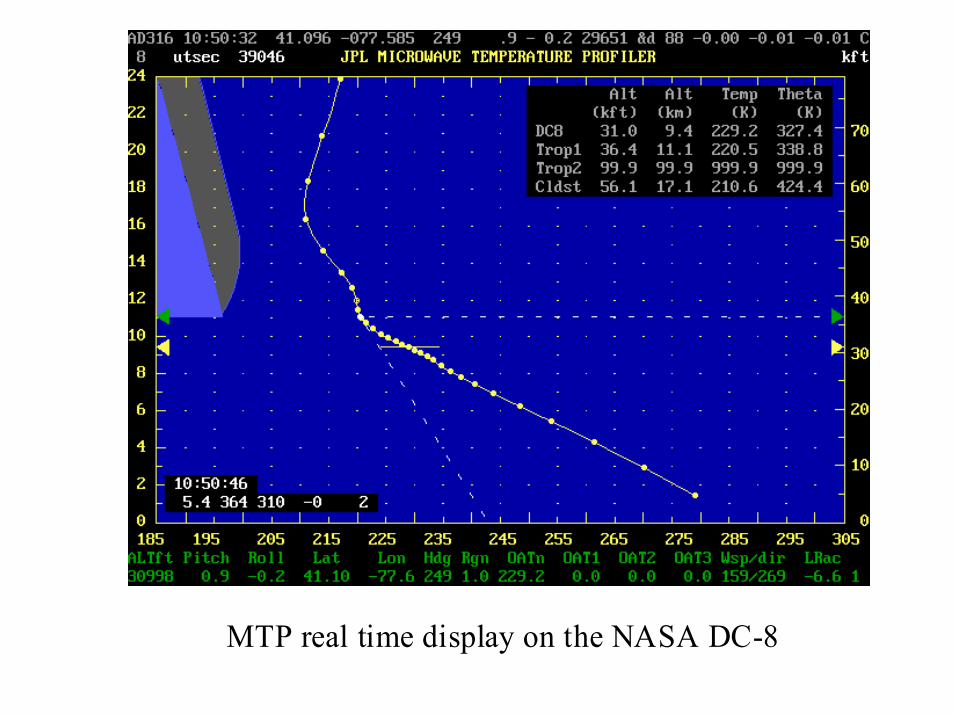
MTP real time display on the NASA DC-8
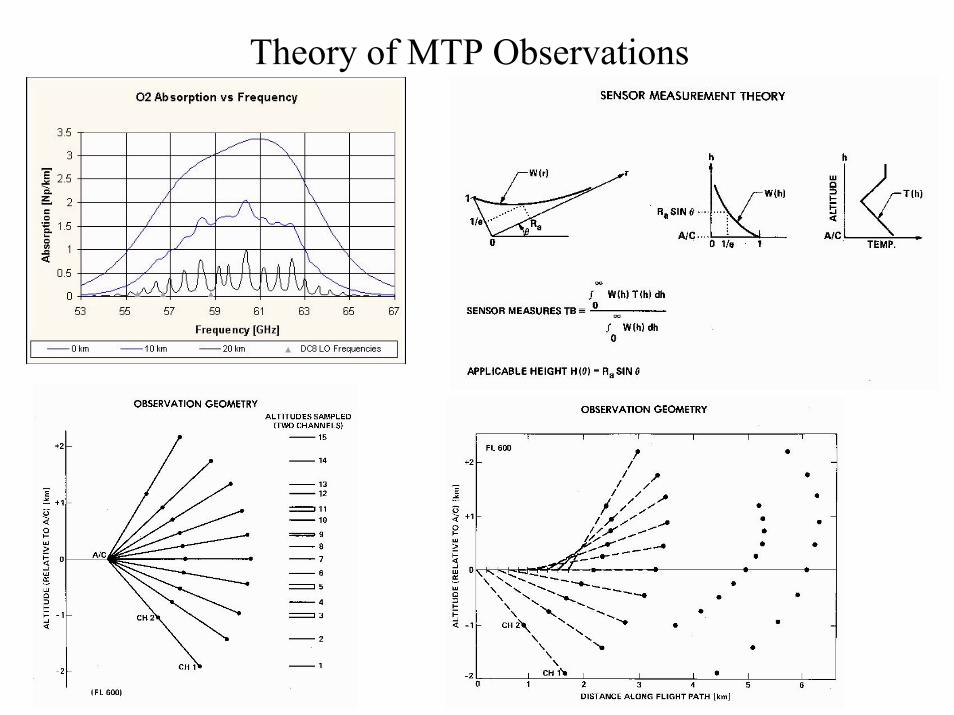
Theory of MTP Observations

DC-8 Microwave Temperature Profiler (MTP)
• MTP scanning mirror is enclosed in a fairing and views forward through a grooved, high-density-polyethylene window
• It is oriented 15 degrees with respect to the direction of flight to avoid sidelobe pickup
• Mirror scans 10 positions from near-zenith to near-nadir at 3 frequencies (55.51, 56.655, 58.79 GHz) to generate 30 observables for ATP retrieval
• Data system is now located on window with sensor unit

M-55 Geophysica Microwave Temperature Profiler
• Campaign: EU Polar Stratospheric Cloud & Lee Wave Experiment (EUPLEX)
• We will fly the ER-2 MTP, but using three frequencies instead of two
• There is some risk as the first integration and test flights will occur in Kiruna
• May also support the ENVISAT Validation campaign after EUPLEX

Temperature Curtains along Aircraft Flight Track
70
76
65
59
(Left) MTP temperature curtain with superimposed isentropes (lowest is 300 K). Black trace is DC-8 altitude and white dots are the tropopause height. The 300 K surface drops at 65 ks and 76 ks when the DC-8 leaves the vortex. (see yellow numerals in right panel). (Right) Ertel's Potential Vorticity (EPV) at 37 kft (217 hPa, 10.3 km) based on DAO/GEOS-3 1 deg x 1 deg grid analysis data; the continuous magenta trace is the DC-8 flight track. Red trace is tropopause location (assuming EPV=3.25) at 37 kft. (EPV plot courtesy of the NASA Ames meteorological support group and NASA Goddard Code 916.)

•Re-analyzed assimilation data is used extensively by modelers, but there is no estimate either of its accuracy or of the impact ofignoring mesoscale temperature fluctuations on back trajectory analysis.
•By comparing SOLVE MTP ER-2 & DC-8 data with DAO re-analyzed data interpolated to flight level, we f ind that assimilationdata in the Arctic had an accuracy of ~2 K rms at altitudes >6 km . Note the ~10 K peak-to-peak errors above (green curve).
•These mesoscale temperature fluctuations must be taken account of in micro-physical and chemical models, and have beenparameterized as a function of altitude, latitude, season and topography using more than 10 years of MTP data. The full-width athalf-maximum of these fluctuations is given by the mesoscale fluctuation amplitude (MFA) expressed in meters. The topographyvaries from 0 over oceans to 1.2 over continental mountains, DOY is day of year, Latitude is in degrees, and pressure P is in mb.
MTP Data Used to Parameterize Mesoscale Temperature Fluctuations
2001.03.26 mjm

MTP Observations of Mountain Lee Waves During SOLVE
•MTP observations are important forunderstanding the role of lee waves inproducing temperature anomolies coldenough to form Type II PSCs -- even thoughsynopt ic scale temperatures are notsuf ficient ly cold.
•Because lee wave PSCs are localized, theyallow the microphysics responsible for theformat ion and dissipation of cloud particlesto be studied.
•Lee wave observations allow the verif icationof various mountain wave forecast models(MWFMs), and their reliability for researchflight planning. (During SOLVE the MWFMwas able to correctly predict all lee waveact ivity on the ER-2 flight tracks.)
•In general, MTP observat ions providemeteorological context for in situmeasurements. For example, is sampled airtropospheric, t ransitional, or stratospheric?What was the environment for st ratospheric“rocks” before they reached flight level? Isthere evidence for synopt ic scale wavesresponsible for stratospheric warmings?
•The figure above illustrates DC-8 observations of a dramat ic mountain lee wave which occurred over the Norwegian Mountainson January 25, 2000. The lower panel shows the terrain cross-sect ion, while the middle panel and upper panels show MTPisentropes (red t races) and LaRC/DIAL aerosol measurements superimposed on MM5 model isentropes (black t races).
2001.03.26 mjm

Relationship of MTP Measurements to the SOLVE-2 Science Goals
• MTP data will be used to validate SAGE III temperature and pressure profile retrievals, and their tropopause determinations, which are a priority 1 measurement for the SOLVE-2 campaign.
• The MTP data can be used to calculate molecular number density profiles, which will improve the accuracy of remote ozone mixing ratio determinations, which is also a priority 1 measurement for SOLVE-2.
• Through collaborations with European and Japanese scientists, the MTP data will also contribute to the validation of SCIAMACHY and MIPAS measurements made on ENVISAT, and the ILAS-II measurements made on ADEOS II.
• Finally, MTP data can be used to derive isentrope surfaces, or the streamlines on which air parcels flow. This will help address the role of lee waves in chlorine activation and ozone loss, which is a primary objective of the European Union’s EUPLEX campaign.