
Microwave-assisted carboxymethylation of cellulose ...hotmail.com (A.d.L. Bukzem),...
9
Carbohydrate Polymers 131 (2015) 125–133 Contents lists available at ScienceDirect Carbohydrate Polymers j ourna l ho me page: www.elsevier.com/locate/carbpol Microwave-assisted carboxymethylation of cellulose extracted from brewer’s spent grain Danilo Martins dos Santos ∗ , Andrea de Lacerda Bukzem, Diego Palmiro Ramirez Ascheri, Roberta Signini, Gilberto Lucio Benedito de Aquino Unidade de Ciências Exatas e Tecnológicas, Universidade Estadual de Goiás, Br 153, Fazenda Barreiro do Meio, 3105, 75132-903 Anápolis, Goiás, Brazil a r t i c l e i n f o Article history: Received 12 January 2015 Received in revised form 17 May 2015 Accepted 20 May 2015 Available online 3 June 2015 Keywords: Brewer’s spent grain Agro-industrial residue Microwave Carboxymethylation of cellulose a b s t r a c t Cellulose was extracted from brewer’s spent grain (BSG) by alkaline and bleaching treatments. The extracted cellulose was used in the preparation of carboxymethyl cellulose (CMC) by reaction with monochloroacetic acid in alkaline medium with the use of a microwave reactor. A full-factorial 2 3 central composite design was applied in order to evaluate how parameters of carboxymethylation process such as reaction time, amount of monochloroacetic acid and reaction temperature affect the average degree of substitution ( DS) of the cellulose derivative. An optimization strategy based on response surface method- ology has been used for this process. The optimized conditions to yield CMC with the highest DS of 1.46 follow: 5 g of monochloroacetic acid per gram of cellulose, reaction time of 7.5 min and temperature of 70 ◦ C. This work demonstrated the feasibility of a fast and efficient microwave-assisted method to synthesize carboxymethyl cellulose from cellulose isolated of brewer’s spent grain. © 2015 Elsevier Ltd. All rights reserved. 1. Introduction Carboxylmethylcellulose is the most widely used cellulose ether today, with applications in paper, textile, pharmaceutical, food exploration and paint industries (Singh & Khatri, 2012). Produc- tion of carboxymethyl cellulose is carried out commercially on a large scale, by the slurry process and includes two steps; first, cellulose fibers are swollen in concentrated NaOH solution then, still under conditions, the hydroxyl groups of cellulose react with the monochloroacetic acid (MCA) (Bhandari, Jones, & Hanna, 2012; Heinze & Koschella, 2005). The etherification processes commonly employed for the pro- duction of carboxymethyl cellulose require temperature between 40 and 80 ◦ C and long reaction time (1–6 h) (Cheng & Biswas, 2011; Heinze & Koschella, 2005; Singh & Khatri, 2012). Under these conditions, the occurrence of side reactions, such as depolymeriza- tion of cellulose and the formation of sodium glycolate, negatively affect both the yield of the process and the characteristics of the derivatives obtained, and the development of conversion processes ∗ Correspondence to: Unidade de Ciências Exatas e Tecnológicas, Universidade Estadual de Goiás, Br 153 no. 3.105 - Fazenda Barreiro do Meio, P.O. Box 459, Anápolis, GO, Brazil, Postal Code 75132-903. Tel.: +55 16 34190656. E-mail addresses: danilomartins [email protected] (D.M.d. Santos), andrea [email protected] (A.d.L. Bukzem), [email protected] (D.P.R. Ascheri), [email protected] (R. Signini), [email protected] (G.L.B.d. Aquino). that minimize the occurrence of side reactions, the reaction time and amount of reagents employed and energy is very impor- tant. In recent years, microwave chemistry has become increasingly popular within the organic synthesis (Gawande, Shelke, Zboril, & Varma, 2014; Moseley & Kappe, 2011). Compared with con- ventional heating, microwave-assisted heating, under controlled conditions, has been shown to be an advanced technology in reducing reaction time besides increasing product yield and purity (Caddick & Fitzmaurice, 2009; Nuchter, Ondruschka, Bonrath, & Gum, 2004; Zhu & Chen, 2014). Microwave irradiation–assisted synthesis and modification has been widely used in chemical functionalization of polymer materials. It has been developed for cellulose modification processes including acetylation (Li et al., 2009) and carboxymethylation (Biswas, Kim, Selling, & Cheng, 2014). Therefore, microwave irradiation is a promising method to modify the physical–chemical properties of cellulose. Most of the sources of cellulose that were modified to car- boxymethyl cellulose are wood and cotton (Singh & Singh, 2013). However, many others resources could be used such as corn cobs (Singh & Singh, 2013), rice straw (Ragheb, Nassar, Abd El-Thalouth, Ibrahim, & Shahin, 2012), cotton by-products (Cheng & Biswas, 2011), cavendish banana pseudo stem (Adinugraha, Marseno, & H, 2005), however none of them uses the brewer’s spent grain (BSG) as a cellulose source. Brewer’s spent grain is the main solid by-product generated in the brewing process. Approximately 15–20 kg of BSG is produced http://dx.doi.org/10.1016/j.carbpol.2015.05.051 0144-8617/© 2015 Elsevier Ltd. All rights reserved.
Transcript of Microwave-assisted carboxymethylation of cellulose ...hotmail.com (A.d.L. Bukzem),...
Mb
DRU
a
ARRAA
KBAMC
1
tetlcstH
d42ctad
EA
a((
h0
Carbohydrate Polymers 131 (2015) 125–133
Contents lists available at ScienceDirect
Carbohydrate Polymers
j ourna l ho me page: www.elsev ier .com/ locate /carbpol
icrowave-assisted carboxymethylation of cellulose extracted fromrewer’s spent grain
anilo Martins dos Santos ∗, Andrea de Lacerda Bukzem, Diego Palmiro Ramirez Ascheri,oberta Signini, Gilberto Lucio Benedito de Aquino
nidade de Ciências Exatas e Tecnológicas, Universidade Estadual de Goiás, Br 153, Fazenda Barreiro do Meio, 3105, 75132-903 Anápolis, Goiás, Brazil
r t i c l e i n f o
rticle history:eceived 12 January 2015eceived in revised form 17 May 2015ccepted 20 May 2015vailable online 3 June 2015
a b s t r a c t
Cellulose was extracted from brewer’s spent grain (BSG) by alkaline and bleaching treatments. Theextracted cellulose was used in the preparation of carboxymethyl cellulose (CMC) by reaction withmonochloroacetic acid in alkaline medium with the use of a microwave reactor. A full-factorial 23 centralcomposite design was applied in order to evaluate how parameters of carboxymethylation process suchas reaction time, amount of monochloroacetic acid and reaction temperature affect the average degree of
eywords:rewer’s spent graingro-industrial residueicrowave
arboxymethylation of cellulose
substitution (DS) of the cellulose derivative. An optimization strategy based on response surface method-ology has been used for this process. The optimized conditions to yield CMC with the highest DS of 1.46follow: 5 g of monochloroacetic acid per gram of cellulose, reaction time of 7.5 min and temperatureof 70 ◦C. This work demonstrated the feasibility of a fast and efficient microwave-assisted method tosynthesize carboxymethyl cellulose from cellulose isolated of brewer’s spent grain.
. Introduction
Carboxylmethylcellulose is the most widely used cellulose etheroday, with applications in paper, textile, pharmaceutical, foodxploration and paint industries (Singh & Khatri, 2012). Produc-ion of carboxymethyl cellulose is carried out commercially on aarge scale, by the slurry process and includes two steps; first,ellulose fibers are swollen in concentrated NaOH solution then,till under conditions, the hydroxyl groups of cellulose react withhe monochloroacetic acid (MCA) (Bhandari, Jones, & Hanna, 2012;einze & Koschella, 2005).
The etherification processes commonly employed for the pro-uction of carboxymethyl cellulose require temperature between0 and 80◦ C and long reaction time (1–6 h) (Cheng & Biswas,011; Heinze & Koschella, 2005; Singh & Khatri, 2012). Under theseonditions, the occurrence of side reactions, such as depolymeriza-
ion of cellulose and the formation of sodium glycolate, negativelyffect both the yield of the process and the characteristics of theerivatives obtained, and the development of conversion processes∗ Correspondence to: Unidade de Ciências Exatas e Tecnológicas, Universidadestadual de Goiás, Br 153 no. 3.105 - Fazenda Barreiro do Meio, P.O. Box 459,nápolis, GO, Brazil, Postal Code 75132-903. Tel.: +55 16 34190656.
E-mail addresses: danilomartins [email protected] (D.M.d. Santos),ndrea [email protected] (A.d.L. Bukzem), [email protected]. Ascheri), [email protected] (R. Signini), [email protected]. Aquino).
ttp://dx.doi.org/10.1016/j.carbpol.2015.05.051144-8617/© 2015 Elsevier Ltd. All rights reserved.
© 2015 Elsevier Ltd. All rights reserved.
that minimize the occurrence of side reactions, the reaction timeand amount of reagents employed and energy is very impor-tant.
In recent years, microwave chemistry has become increasinglypopular within the organic synthesis (Gawande, Shelke, Zboril,& Varma, 2014; Moseley & Kappe, 2011). Compared with con-ventional heating, microwave-assisted heating, under controlledconditions, has been shown to be an advanced technology inreducing reaction time besides increasing product yield and purity(Caddick & Fitzmaurice, 2009; Nuchter, Ondruschka, Bonrath, &Gum, 2004; Zhu & Chen, 2014). Microwave irradiation–assistedsynthesis and modification has been widely used in chemicalfunctionalization of polymer materials. It has been developed forcellulose modification processes including acetylation (Li et al.,2009) and carboxymethylation (Biswas, Kim, Selling, & Cheng,2014). Therefore, microwave irradiation is a promising method tomodify the physical–chemical properties of cellulose.
Most of the sources of cellulose that were modified to car-boxymethyl cellulose are wood and cotton (Singh & Singh, 2013).However, many others resources could be used such as corn cobs(Singh & Singh, 2013), rice straw (Ragheb, Nassar, Abd El-Thalouth,Ibrahim, & Shahin, 2012), cotton by-products (Cheng & Biswas,2011), cavendish banana pseudo stem (Adinugraha, Marseno, & H,
2005), however none of them uses the brewer’s spent grain (BSG)as a cellulose source.Brewer’s spent grain is the main solid by-product generated inthe brewing process. Approximately 15–20 kg of BSG is produced

1 rate Polymers 131 (2015) 125–133
pdtCmtf
(MTbp(B(n
bncwclm
2
2
(8tsmwa
2
2
hfmmaas
2
ts1afi1os
2
a
Table 1Uncoded and coded levels of the independent variables of the carboxymethylationprocess.
Independent variables Symbol Levels
−1 0 1
Time (min.) X1 2.5 5 7.5
26 D.M.d. Santos et al. / Carbohyd
er every hectolitre of beer, which corresponds to an annual pro-uction of more than 34 million tons of wet BSG (8.5 millionons of dry BSG) (Mussatto, Dragone, & Roberto, 2006; Xiros &hristakopoulos, 2012). This material is composed of the barleyalt residual constituents and includes the barley grain husk in
he greatest proportion, and also minor fractions of pericarp andragments of endosperm (Forssell et al., 2008).
BSG is rich in cellulose (16–21%), hemicellulose (15–29%), lignin19–28%) and proteins (24–39%) (Meneses, Martins, Teixeira, &
ussatto, 2013; Mussatto, Rocha, & Roberto, 2008; Pires, Ruiz,eixeira, & Vicente, 2012). Some recent studies suggest the possi-ility of reusing this material for industrial applications such as theroduction of activated carbon (Poerschmann et al., 2014), ethanolForssell et al., 2008) and xylitol (Mussatto & Roberto, 2008), butSG is still traditionally used as a relatively low value cattle feedNiemi, Martins, Buchert, & Faulds, 2013). So, there is a need to findew value-added end-uses for this by-product.
The aim of this work was to increase the economic value ofrewer’s spent grain by the extraction of the cellulosic compo-ent from this by-product through chemical methods. The obtainedellulose was used in the preparation of carboxymethyl cellulose,hich has many important industrial applications. Carboxymethyl
ellulose was obtained through reaction of the extracted cellu-ose with monochloroacetic acid in alkaline medium employing
icrowave reactor.
. Materials and methods
.1. Materials
Brewer’s spent grains (BSG) were supplied by Ambev, S.A.Anápolis, Goiás, Brazil). As soon as obtained, the material (approx.0% moisture content) was dried at 105 ◦C to 94% dry matter. Thenhe dried BSG was milled using a knife mill fitted with a 1 mm-ized grating and used in all experiments. Sodium chlorite (NaClO2),onochloroacetic acid (MCA), sodium hydroxide and isopropanolere obtained from Sigma-Aldrich. All of the other reagents were
nalytical grade and were used without further purification.
.2. Cellulose extraction from Brewer’s spent grains (BSG)
.2.1. Alkaline treatmentInitially, the dried BSG was treated with a 2% (w/w) sodium
ydroxide aqueous solution in a solid:liquid ratio of 1:20 (w:v)or 2 h at 90 ◦C, as reported by Mussatto et al. (2006b) with some
odifications. The obtained black slurry was filtered and the solidaterial was washed several times with distilled water until the
lkali was completely removed, and dried at 50 ◦C for 12 h in anir-circulating oven. The yield was calculated based on the driedolid product weight and the starting weight.
.2.2. Bleaching processAfter the alkali treatment, the fibers were treated with a solu-
ion made up of equal parts (v:v) of acetate buffer and aqueousodium chlorite (2 wt% NaClO2 in water) in a solid:liquid ratio of:50 (w:v) for 4 h at 80 ◦C. Then the mixture was allowed to coolnd was filtered using excess distilled water until the pH of thebers became neutral. The bleached fibers were dried at 50 ◦C for2 h in an air-circulating oven. The bleaching process was carriedut in a single step. The yield was calculated based on the driedolid product weight and the starting weight.
.3. Preparation of carboxymethyl cellulose (CMC)
Synthesis of CMC was carried out in two steps i.e., alkalizationnd etherification under heterogeneous conditions. Alkalization
MCA/celullose (g/g) X2 2 3.5 5Temperature (◦C) X3 70 80 90
was conducted into glass reaction vessels with an internal vol-ume 35 mL as follows: bleached cellulose (0.5 g) was suspendedin isopropanol (2 mL) and 2 mL of 40% (w/v) aqueous NaOH wasadded dropwise under magnetic stirring at room temperature overa period of 15 min.
The etherification was carried out in a monomode microwavereactor (Discover-SP DC-7196, CEM, USA). The desired amount ofmonochloroacetic acid (MCA) was dissolved in 2 mL of isopropanol.The mixture was subjected to microwave irradiation at 200 W upto the desired temperature (70–90 ◦C) and stirred at that temper-ature for the desired duration (2.5–7.5 min). When the irradiationwas complete, the slurry was neutralized with glacial acetic acidand then filtrated. The solid obtained as CMC was washed with70% ethanol for four times to remove undesirable by-products. Theobtained cellulose derivative (CMC) was dried at 60 ◦C in an oven.
For the purification of these derivatives, 1.5 g of the sam-ple was dissolved in 750 mL of aqueous 0.4 mol L−1 NaCl. Theresulting solution was submitted to positive filtration through0.45 �m membrane (Millipore®) and the carboxymethyl cellulosewas precipitated upon addition of ethanol. Subsequently, the car-boxymethyl cellulose was sequentially washed with ethanol/watermixtures of increasing ethanol content (70%, 80%, and 90%), withabsolute ethanol and then it was dried at room temperature. Thisprocedure resulted in purified sodium carboxymethyl cellulosesamples.
2.4. Experimental design
A full-factorial 23 central composite design was employed toanalyze the main effects and interactions of the following variables:reaction time, amount of monochloroacetic acid (MCA) per gram ofcellulose and reaction temperature on the average degree of substi-tution (DS). The independent variables and their levels are shownin Table 1. Maximum and minimum treatment levels were chosenby carrying out preliminary screening tests. Each experiment wasperformed in triplicate.
2.5. Characterization of brewer’s spent grain fibers andcarboxymethyl cellulose
2.5.1. Chemical composition of brewer’s spent grain fibersThe chemical composition of the BSG at each stage of
treatment was measured as follows: the holocellulose (�-cellulose + hemicellulose) and cellulose content were estimatedaccording to standard methods (Browning, 1967). The �-cellulosecontent was determined treating the holocellulose with potassiumhydroxide solutions (Browning, 1967). The hemicellulose contentwas found by subtracting the �-cellulose part from the holocel-lulose content. The lignin content was determined according toa standard method of Technical Association of Pulp and PaperIndustry TAPPI T222 om-88. The viscosity of pulp (cP) dissolved
in a cupriethylene-diamine solution was determined according toTappi standard (T230 om-99). An average of three measurementswas calculated for each sample.
rate P
2
a(hao5v
2
utcsi
2
Pacw
2
t(ac
2
bmant1
2
icrb
Y
wccv
uotwRivt
de Amorim, 2007). The DS is most important factor because theindustrial utility of the CMC exclusively depends on the DS (Singh& Singh, 2013) so all the optimization experiments were done withrespect to the DS and not the yield.
Table 2Chemical composition of brewer’s spent grain at different stages of treatment.
Parameter BSGa After alkali treatmenta After bleachinga
Holocelullose (%)b 45.87 ± 1.24 81.80 ± 1.16 95.68 ± 0.29Cellulose (%) 22.36 ± 0.41 66.43 ± 0.87 90.12 ± 0.71�-cellulose (%) 20.09 ± 0.86 64.71 ± 1.23 89.71 ± 1.05Hemicellulose (%) 25.78 ± 0.97 17.09 ± 1.10 5.97 ± 0.92Lignin (%) 30.48 ± 0.54 11.85 ± 0.27 3.23 ± 0.03Others (%)c 21.38 ± 1.06 4.63 ± 0.34 0.62 ± 0.04Viscosity (cP) – 16.80 ± 0.19 9.18 ± 0.06
D.M.d. Santos et al. / Carbohyd
.5.2. Determination of average degree of substitution (DS)The average degree of substitution of CMC was determined
ccording to the methodology proposed by Ho and Klosiewicz1980), with modifications. For this purpose, the CMC samples wereydrolyzed in a mixture of 25% (v/v) D2SO4/D2O (75 mg mL−1) 1.5 ht 90 ◦C. The 1H NMR spectra were obtained at room temperaturen a Bruker AVANCE III 500–11.75 Tesla spectrometer operating at00.13 MHz. The chemical shifts were expressed in dimensionlessalues (ppm) relative to an internal standard of acetic acid.
.5.3. Field emission scanning electron microscopy (FE-SEM)A field emission scanning electron microscope (LEO-440) was
sed to evaluate the surface morphology of the untreated, alkali-reated, bleached brewer’s spent grain fibers and carboxymethylellulose. The acceleration voltage was 15 kV. Prior to analysis, theamples were coated with an ultrathin gold layer in a sputter coat-ng system.
.5.4. Fourier transform infrared (FTIR) spectroscopyFourier transform infrared spectra were recorded using a
erkin-Elmer FTIR spectrophotometer. Samples were finely groundnd mixed with potassium bromide, KBr. The mixture was thenompressed into pellet form. FTIR spectral analysis was performedithin the wave number range of 400–4000 cm−1.
.5.5. X-ray diffraction (XRD)XRD patterns of samples were obtained using an X-ray diffrac-
ometer (D8 Advance, Bruker AXS) equipped with CuK� radiation� = 1.5406 A) in the 2� range 5–50◦ with a scan rate of 5◦ per mint room temperature. The operating voltage was 40 kV, and theurrent was 40 mA.
.5.6. Thermogravimetric analysis (TGA)The thermal stability of the different samples was determined
y TGA measurements carried out using a Shimadzu TGA 50 equip-ent. The amount of sample used for each measurement was
pproximately 7 mg. All measurements were carried out under aitrogen atmosphere with a gas flow of 50 mL min−1 by heatinghe material from room temperature to 600 ◦C at a heating rate of0 ◦C min−1.
.6. Statistical analysis
The statistical treatment of the experimental data consistedn fitting a polynomial function to the set of experimental dataollected from full-factorial 23 central composite design. Multipleegression analysis was used to fit Eq. (1) to the experimental datay means of the least squares method.
= ˇ0 + ˇ1X1 + ˇ2X2 + ˇ3X3 + ˇ12X1X2 + ˇ13X1X3
+ ˇ23X2X3 + ˇ123X1X2X3 + ε (1)
here, Y represents the predicted response, ˇ0, is the model inter-ept, ˇ1, ˇ2, ˇ3, and ˇ12, ˇ13, ˇ23, ˇ123, are linear and interactionoefficients respectively, and X1, X2 and X3 are the independentariables. ε corresponds to the model residue.
The statistical significance of the model was determined by eval-ating the p-value, F-value and lack of fit with 95% confidence levelbtained from the analysis of variance (ANOVA). The extent of fit-ing of the experimental results to the polynomial model equationas expressed by the adjusted coefficient of determination (R2
adj).
esponse surface was obtained by using the fitted model and keep-ng one independent variable constant and varying the other twoariables. All calculations and graphs were obtained by the Statis-ica software (Statsoft version 7.0, USA).
olymers 131 (2015) 125–133 127
3. Results and discussion
3.1. Chemical composition of fibers
The chemical composition of the BSG was determined at eachstage of treatment and the data are summarized in Table 2. The orig-inal brewer’s spent grain contained 45.87 wt% holocellulose, 22.36wt% cellulose, 20.09 wt% �-cellulose, 25.78 wt% hemicelluloseand 30.48 wt% lignin. The values found for the main constituentsof brewer’s spent grain are in agreement with literature data(Meneses et al., 2013; Mussatto et al., 2008; Pires et al., 2012).
It was found that at the end of the chemical treatment the cellu-lose and �-cellulose content increased from 22.36% to 90.12% andfrom 20.09% to 89.71%, respectively. The alkali and bleaching treat-ments were efficient in removing hemicellulose and lignin, whichdecreased from 25.78% to 5.97% and from 30.48% to 3.23%, respec-tively, following treatments. The sum of the percentage of cellulose,hemicelluloses and lignin to the brewer’s spent grain after bleach-ing stage corresponds to 99.32% of the total dry matter, thereforethe treatment not only removed hemicelluloses and lignin but alsoother components such as proteins, extractives and ash.
Viscosity was strongly decreased after bleaching (from 16.80 to9.18 cp), indicating that the average cellulose chain length (poly-merization degree) was reduced, since viscosity loss occurs due tothe cleavage of glycosidic bonds in this polysaccharide chain. Theyield after alkaline treatment was 22.96% while after the bleach-ing treatment was 66.96% (Table 2). Therefore, starting from 100 gof brewer’s spent grain was possible to obtain 15.37 g of pulp atthe end of the chemical treatments. The composition and viscosityof the fibers after bleaching is quite suitable for the production ofcarboxymethyl cellulose (Heinze & Koschella, 2005).
3.2. Preparation of CMC from cellulose
The manufacturing of carboxymethyl cellulose involved tworeaction stages. In the first stage, cellulose was treated with NaOH,in the presence of isopropanol, which acts both as a swelling agentand as a dilutant and facilitates penetration of NaOH into the cel-lulose structure. In the second stage, carboxymethyl cellulose wassynthesized by reacting monochloroacetic acid (MCA) and alkalicellulose under microwave irradiation (Gu, He, Huang, & Guo, 2012;Singh & Khatri, 2012).
The various properties of sodium carboxylmethylcellulosedepend upon three factors: molecular weight of the polymer, aver-age number of carboxyl content per anhydroglucose unit [degreeof substitution (DS)] and the distribution of carboxyl substituentsalong the polymer chains (Ruzene, Gonc alves, Teixeira, & Pessoa
Yield (%) – 22.96 ± 0.34 66.96 ± 0.99
a Values are mean ± SD of three replicates.b Hollocelulose (%) = �-celullose (%) + Hemicelullose (%).c Other components include ashes, protein and extractive.
128 D.M.d. Santos et al. / Carbohydrate Polymers 131 (2015) 125–133
Table 3Independent variables of the full-factorial 23 central composite design and the experimental results.
Assay Time (min.) MCAa/cellulose (g/g) Temperature (◦C) DS Distribuition of substituent
C2 C3 C6
1 2.50 (−1) 2.00 (−1) 70.00 (−1) 0.62 0.32 0.10 0.202 2.50 (−1) 2.00 (−1) 90.00 (+1) 0.58 0.28 0.12 0.183 2.50 (−1) 5.00 (+1) 70.00 (−1) 1.23 0.51 0.34 0.384 2.50 (−1) 5.00 (+1) 90.00 (+1) 1.22 0.50 0.33 0.395 7.50 (+1) 2.00 (−1) 70.00 (−1) 0.54 0.26 0.10 0.186 7.50 (+1) 2.00 (−1) 90.00 (+1) 0.64 0.25 0.19 0.207 7.50 (+1) 5.00 (+1) 70.00 (−1) 1.46 0.61 0.35 0.58 7.50 (+1) 5.00 (+1) 90.00 (+1) 1.42 0.65 0.33 0.449 5.00 (0) 3.50 (0) 80.00 (0) 0.93 0.48 0.17 0.2810 5.00 (0) 3.50 (0) 80.00 (0) 0.84 0.45 0.15 0.24
.00 (0)
.00 (0)
a
lpmB&pams
dFaafiStscwK
11 5.00 (0) 3.50 (0) 8012 5.00 (0) 3.50 (0) 80
MCA = monochloroacetic acid.
The previous work on the optimization of the carboxymethy-ation reaction has shown that DS depends on various reactionarameters such as reaction temperature, reaction time andonochloroacetic acid concentration (Adinugraha et al., 2005;
arai, Singhal, & Kulkarni, 1997; Pushpamalar, Langford, Ahmad, Lim, 2006; Singh & Singh, 2013). Hence, to optimize the CMCreparation conditions and the relationship between these factors,
full-factorial 23 central composite design and response surfaceethodology were applied to determine the optimal levels of the
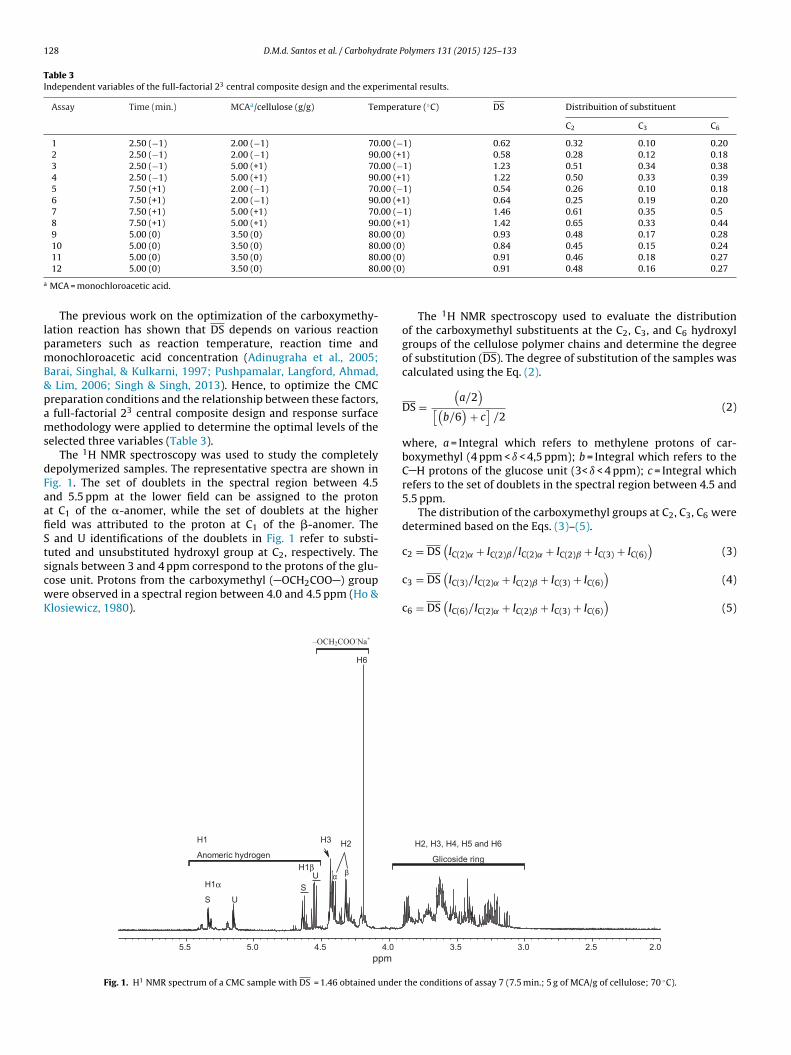
elected three variables (Table 3).The 1H NMR spectroscopy was used to study the completely
epolymerized samples. The representative spectra are shown inig. 1. The set of doublets in the spectral region between 4.5nd 5.5 ppm at the lower field can be assigned to the protont C1 of the �-anomer, while the set of doublets at the highereld was attributed to the proton at C1 of the �-anomer. The
and U identifications of the doublets in Fig. 1 refer to substi-uted and unsubstituted hydroxyl group at C2, respectively. The
ignals between 3 and 4 ppm correspond to the protons of the glu-ose unit. Protons from the carboxymethyl ( OCH2COO ) groupere observed in a spectral region between 4.0 and 4.5 ppm (Ho &losiewicz, 1980).5.5 5.0 4.5 4.0ppm
S U
H3
α β
H2
SU
–OC H2COO-Na+
H6
H1
Anomer ic hydroge n
H1α
H1β
Fig. 1. H1 NMR spectrum of a CMC sample with DS = 1.46 obtained under
0.91 0.46 0.18 0.27 0.91 0.48 0.16 0.27
The 1H NMR spectroscopy used to evaluate the distributionof the carboxymethyl substituents at the C2, C3, and C6 hydroxylgroups of the cellulose polymer chains and determine the degreeof substitution (DS). The degree of substitution of the samples wascalculated using the Eq. (2).
DS =(
a/2)
[(b/6
)+ c
]/2
(2)
where, a = Integral which refers to methylene protons of car-boxymethyl (4 ppm < ı < 4,5 ppm); b = Integral which refers to theC H protons of the glucose unit (3< ı < 4 ppm); c = Integral whichrefers to the set of doublets in the spectral region between 4.5 and5.5 ppm.
The distribution of the carboxymethyl groups at C2, C3, C6 weredetermined based on the Eqs. (3)–(5).
c2 = DS(
IC(2)˛ + IC(2)ˇ/IC(2)˛ + IC(2)ˇ + IC(3) + IC(6)
)(3)
c3 = DS(
IC(3)/IC(2)˛ + IC(2)ˇ + IC(3) + IC(6)
)(4)
c6 = DS(
IC(6)/IC(2)˛ + IC(2)ˇ + IC(3) + IC(6)
)(5)
3.5 3.0 2.5 2.0
H2, H3, H4, H5 an d H6
Glicos ide ring
the conditions of assay 7 (7.5 min.; 5 g of MCA/g of cellulose; 70 ◦C).

D.M.d. Santos et al. / Carbohydrate Polymers 131 (2015) 125–133 129
Table 4Analysis of variance (ANOVA) results.
Source of variationa Sum of square df Mean square F-value p-value
X1 0.021013 1 0.021013 13.4840 0.034950b
X2 1.087813 1 1.087813 698.0615 0.000119c
X3 0.000013 1 0.000013 0.0080 0.934279d
X1.X2 0.025313 1 0.025313 16.2433 0.027460c
X1.X3 0.001513 1 0.001513 0.9706 0.397174d
X2.X3 0.001513 1 0.001513 0.9706 0.397174d
Lack of fit 0.015317 2 0.007658 4.9144 0.113083d
Pure error 0.004675 3 0.001558Total SS 1.157167 11R2
adj. = 0.9620
a
wap
(tag
3
tsvImtiala
i
D
ecevmia(f
iaImDtccla
c
into individual fibers whose diameters were in the range 5–30 �m.These morphological changes are due to the progressive removalof the outer non-cellulosic layer composed of materials such as
X1 = Time (min.); X2 = MCA/celullose (g/g); X3 = Temperature.b = Significant at 5% probability (p < 0.05).c = Significant at 1% probability (p < 0.01).d = Non-significant.
here, I represents the integral value of the peaks of C3, C2�, C2�,nd C6, respectively (Gu et al., 2012). A summary of these data isresented in Table 3.
It can be noted that the DS varied to each condition employedfrom 0.54, assay 5, to 1.46, assay 7). It is generally observed thathere is slightly more substitution at C2 than at C6, with the leastmount at C3, indicating that the relative reactivity of the hydroxylroups is in the following order: OH(2) > OH(6) > OH(3).
.3. Statistical analysis and the model fitting
Table 4 shows the coefficients of the variables in the modelshat were calculated using the least square technique, and theirtatistical significances were analised by ANOVA. The F-value and p-alue was used as a tool to check the significance of each parameter.t can be seen from Table 4, the predominant effect on the developed
odel for the degree of substitution corresponded to the linearerm amount of monochloroacetic acid (MCA) (X2), followed by thenteraction term between time and amount of monochloroaceticcid (X1.X2) and the linear term of time(X1). Other terms, such as theinear terms of temperature (X3) and the interaction terms (X1.X3nd X2.X3) are not significant (p > 0.05).
The fitted model for DS without the non-significant terms andn uncoded form is given in Eq. (6).
S = 0.20 − 0.076X1 + 0.24X2 − 0.015X1X2 (6)
The model for degree of substitution showed a good fit with thexperimental data, as the value of adjusted determination coeffi-ient (R2
adj.) was 0.9620. This confirms that the fitted model couldxplain above 96.00% of the total variability within the range ofalues studied. The lack of fit is an indication of the failure of aodel representing the experimental data at which points are not
ncluded in the regression or variations in the models cannot beccounted for random error. The non-significant value of lack of fitp-value > 0.05) revealed that the model is statistically significantor the response.
Three-dimensional surface was generated based on Eq. (6) ands shown in Fig. 2 which present the relationship between time andmount of monochloroacetic acid on the degree of substitution.t was found that increasing the reaction time and the amount of
onochloroacetic acid results in larger values DS. The increase inS with increasing amounts of monochloroacetic acid and reaction
ime is due to the fact that there is a better reaction environmentreated (i.e., greater availability of the acid molecules at higheroncentrations) and a prolonged time available for carboxymethy-
ation. Similar findings have been reported by Barai et al. (1997)nd Singh and Singh (2013).Based on Table 3 and in Fig. 2, the optimum conditions forarboxymethylation were achieved using 5 g de monochloracetic
acid per gram of cellulose and carrying out the reaction at 70 ◦Cfor 7.5 min. Under these conditions, it was possible to obtain car-boxymethyl cellulose with DS of 1.46. In addition, microwave heatallowed obtaining CMC samples with similar DS values compared tothe obtained by conventional heat. However, the average reactiontime when using conventional heat (1–6 h) for carboximethylationis much greater than microwave heat (Biswas et al., 2014; Heinze& Koschella, 2005; Pushpamalar et al., 2006; Singh & Khatri, 2012).Microwave technology thus appears to be promising in CMC syn-thesis as a means to reduce reactions times, thereby potentiallyincreasing throughput and reducing energy cost.
3.4. Morphological analysis
The morphological changes of the brewer’s spent grain fibersafter each stage of treatment were evaluated by field emissionscanning electron microscopy (Fig. 3). The untreated BSG presentssmooth surface (Fig. 3a) and diameter in the range 150–350 �m.After alkali treatment (Fig. 3b), the fiber surface becomes rougherand the diameter decrease to 80–200 �m. The effect of bleach-ing treatment was evident from the comparison of micrographsin Fig. 3b and c. It can be seen that the BSG fiber bundles separated
Fig. 2. Response surface plot show the effect of reaction time and amount ofmonochloroacetic acid on the response variable degree of substitution DS.

130 D.M.d. Santos et al. / Carbohydrate Polymers 131 (2015) 125–133
F t graio .
hb
voabtb
3
ctsbabhfetaoocApo
2008), which appeared in all of the spectra. The increment of thesepeaks is directly related to the increase in the cellulosic componentspercentages.
ig. 3. Scanning electron micrographs (magnification: 1500×) of (a) brewer’s spenbtained under the conditions of assay 7 (7.5 min.; 5 g of MCA/g of cellulose; 70 ◦C)
emicelluloses, lignin, wax, and other impurities contained in therewer’s spent grain upon chemical treatments.
The SEM micrograph of carboxymethyl cellulose, synthesizedia chemical modification cellulosic fibers is given in Fig. 3d. It wasbserved that the carboxymethyl cellulose appear to be irregularnd relatively smooth. This morphological change as compared toleached fiber was ascribed to the heterogeneous introduction ofhe bulky carboxymethyl groups into the fiber surface after car-oxymethylation.
.5. FTIR spectroscopy analysis
Fourier transform infrared spectroscopy (FTIR) allows theharacterization of a chemical structure by identifying the func-ional groups present in each sample. Fig. 4 shows the FTIRpectra recorded for (a) untreated BSG, (b) alkali-treated BSG, (c)leached BSG and (d) carboxymethyl cellulose. The peak locatedt 1739 cm−1 that is see in the spectrum of the untreated BSG cane attributed either to the acetyl and uronic ester groups of theemicelluloses or to the ester linkage of carboxylic group of the
erulic and p-coumeric acids of lignin and/or hemicelluloses (Sunt al., 2005). This peak almost disappeared after the bleachingreatment, indicating the removal of most of the hemicellulosesnd lignin from the BSG. The peak at 1526 cm−1 in the spectrumf the untreated brewer’s spent grain represent the aromatic C Cf the aromatic rings of lignin. The peak observed at 1247 cm−1
orresponds to C O C (aryl–alkyl ether) (Sheltami, Abdullah,hmad, Dufresne, & Kargarzadeh, 2012). These two peaks disap-eared after the bleaching treatment, which suggests the removalf lignin.
n (BSG), (b) alkali-treated BSG, (c) bleached BSG, and (d) carboxymethyl cellulose
The peaks at 1053 and 895 cm−1 are associated with the C Ostretching and C H rock vibrations of cellulose (Alemdar & Sain,
Fig. 4. FTIR spectra of (a) brewer’s spent grain (BSG), (b) alkali-treated BSG, (c)bleached BSG, and (d) carboxymethyl cellulose obtained under the conditions ofassay 7 (7.5 min.; 5 g of MCA/g of cellulose; 70 ◦C).

D.M.d. Santos et al. / Carbohydrate Polymers 131 (2015) 125–133 131
Fig. 5. X-ray diffractograms for (a) brewer’s spent grain (BSG), (b) alkali-treated BSG,(a
irot(
3
tcdaaTc22isJ4Btalp
cfipbaAbtctohaA
lower decomposition temperature compared to cellulose and their
c) bleached BSG, and (d) carboxymethyl cellulose obtained under the conditions ofssay 7 (7.5 min.; 5 g of MCA/g of cellulose; 70 ◦C).
The occurrence of carboxymethylation was confirmed bynfrared spectroscopy. The IR spectra of the prepared CMC wereecorded, as displayed in Fig. 4 which shows that the appearancef the typical band at 1610 cm−1 associated with the presence ofhe carboxylate anion COO− and confirms the formation of CMCNaHeinze & Koschella, 2005).
.6. X-ray diffraction (XRD)
The X-ray diffraction patterns obtained for untreated, alkali-reated, bleached brewer’s spent grain as well as for thearboxymethyl cellulose are show in Fig. 5. It is observed that theiffractogram of brewer’s spent grain has a main peak at 2� = 21.5◦
nd a discrete peak at 2� = 34.7◦. Three peaks can be observed forlkali-treated BSG and bleached BSG at 2� = 16.0◦, 22.2◦ and 34.7◦.hey are typical of cellulose I and become more defined uponhemical treatments (Azubuike, Rodríguez, Okhamafe, & Rogers,012; Chen et al., 2011; Flauzino Neto, Silvério, Dantas, & Pasquini,013; Kumar, Negi, Bhardwaj, & Choudhary, 2012). The crystallinity
ndex (CrI) of all samples was calculated following the amorphousubtraction method proposed by Park, Baker, Himmel, Parilla, &ohnson (2010). By this method, the CrI was found to be 27.3%,6.7% and 56.5% for untreated BSG, alkali-treated BSG and bleachedSG, respectively. The higher CrI value of bleached BSG comparedo alkali-treated BSG and untreated BSG is due to the removal ofmorphous non-cellulosic compounds such as lignin and hemicel-ulose by the alkali and bleaching treatments carried out in theurification process.
The comparison of the X-ray patterns of bleached fibers andarboxymethyl cellulose revealed that the carboxymethylation ofbers provoked important changes in the arrangement of theolymer chains in the solid state. It can be seen that after car-oxymethylation all characteristic peaks for bleached fibers havelmost disappeared and transformed into an amorphous phase.lthough the diffractogram of carboxymethyl cellulose have noteen quantitatively treated to determine the CrI, it is assumed thathe carboxymethyl cellulose adopt a less ordered arrangement asompared to bleached fibers. This is attributed to the presence ofhe carboxymethyl moieties which substitute the hydrogen atomsf the hydroxyl groups of cellulose affecting the establishment of
ydrogen bonds involving these groups that are responsible for thedoption of a more ordered arrangement by the cellulose (Johar,hmad, & Dufresne, 2012).Fig. 6. (a) TG and (b) DTG curves for brewer’s spent grain (BSG), alkali-treated BSG,bleached BSG, and carboxymethyl cellulose obtained under the conditions of assay7 (7.5 min.; 5 g of MCA/g of cellulose; 70 ◦C).
3.7. Thermogravimetric analysis
Fig. 6 shows the TGA and derivative thermogravimetry DTGcurves obtained for raw brewer’s spent grain, as well as thoseobtained after alkali treatment and bleaching and for car-boxymethyl cellulose. In all cases, an initial weight loss of the fibersoccurs in the range of 35–150 ◦C, due to the evaporation of adsorbedand bound water (Flauzino Neto et al., 2013).
Degradation of hemicellulose and cellulose starts at tempera-tures 220 and 250 ◦C, respectively, while lignin degrades at a lowertemperature, 200 ◦C (Morán, Alvarez, Cyras, & Vázquez, 2008). Athigher temperatures lignin is more heat resistant than hemicel-luloses and cellulose, due to its low degradation rate. The weightloss between 200 and 300 ◦C is mainly due to hemicellulosesdecomposition and the parallel slow decomposition of lignin, whilethe weight loss between 250 and 500 ◦C is attributed to cellu-lose (250–350 ◦C) and lignin (200–500 ◦C) decomposition (Nandaet al., 2013). At temperatures higher than 400 ◦C, there is oxidationand breakdown of the charred residue to lower molecular weightgaseous products (Morán et al., 2008).
By the comparison of the untreated and alkali treated fibers,it was observed that the bleaching treatment induces an increasein the materials thermal stability. This is due to the presenceof hemicellulose and lignin in the chemical composition of theuntreated and alkali treated BSG fibers. These components have a
progressive removal improves the thermal stability of the fibers.The lower thermal stability of alkali treated compared tothe bleached fibers is attributed to the partial elimination of

1 rate P
noa
3wlbioiib
tTatta
4
bcwpgbtaaamssla
A
(a
R
A
A
A
B
B
B
B
32 D.M.d. Santos et al. / Carbohyd
on-cellulosic material. However, after 400 ◦C, the thermal stabilityrder of the materials is reversed, because lignin at higher temper-ture is more heat resistant than hemicelluloses and cellulose.
In the DTG curve for BSG, a shoulder is observed at around00 ◦C, but is no longer present after the chemical treatments,hich very likely reflects the removal of a portion of the hemicel-
ulose. The weight fraction of material that still exists after heatingetween 400 ◦C and 600 ◦C is representative of the carbon content
n the fibers. The increased residue amount at high temperature,r the char fraction, for BSG compared to chemically treated fiberss due to the presence of ash as well as lignin. As it can be seenn Fig. 6, the amount of residue at temperature around 600 ◦C inleached fibers was only 5%.
Fig. 6 shows that the introduction of carboxymethyl groups inhe cellulose chain decreased the thermal stability of the polymer.he decrease in the thermal stability of the carboxymethyl celluloses compared to the parent cellulose is justified by the presence ofhe negatively charged carboxymethyl groups and is supported byhe X-ray diffraction analyses which evidenced the less orderedrrangement of CMC.
. Conclusions
The present work shows that cellulose can be isolated fromrewer’s spent grain. Chemical treatment with alkali and sodiumhlorite removed the non-cellulosic constituents resulting in fibersith high content of cellulose and �-cellulose, hence suitable forroduction of carboxymethyl cellulose. The results obtained sug-est that BSG is an industrial by-product with great potential toe a feedstock for producing this derivative. The carboxymethyla-ion of cellulose was successfully achieved and samples of differentverage degrees of substitution (0.58 < DS < 1.46) were preparedccording to the reaction conditions employed. The use of a highermount of monochloroacetic acid and reaction time resulted in theore substituted samples but the reaction temperature did not
trongly affect the average degree of substitution. Using optimizedet of conditions: 5 g of monochloroacetic acid per gram of cellu-ose; reaction time of 7.5 min and temperature of 70 ◦C, CMC having
DS of 1.46 can be prepared.
cknowledgments
The authors would like to thank the State University of GoiásUEG) for the research stimulation grant (BIP) and revision of therticle. FAPEG, CAPES and CNPq for their financial support.
eferences
dinugraha, M. P., Marseno, D. W., & Haryadi. (2005). Synthesis and characteriza-tion of sodium carboxymethylcellulose from cavendish banana pseudo stem(Musa cavendishii LAMBERT). Carbohydrate Polymers, 62(2), 164–169. http://dx.doi.org/10.1016/j.carbpol.2005.07.019
lemdar, A., & Sain, M. (2008). Isolation and characterization of nanofibers fromagricultural residues—Wheat straw and soy hulls. Bioresource Technology, 99(6),1664–1671. DOI http://dx.doi.org/10.1016/j.biortech.2007.04.029.
zubuike, C., Rodríguez, H., Okhamafe, A., & Rogers, R. (2012). Physicochemical prop-erties of maize cob cellulose powders reconstituted from ionic liquid solution.Cellulose, 19(2), 425–433. DOI 10.1007/s10570-011-9631-y.
arai, B. K., Singhal, R. S., & Kulkarni, P. R. (1997). Optimization of a process forpreparing carboxymethyl cellulose from water hyacinth (Eichornia crassipes).Carbohydrate Polymers, 32(3–4), 229–231. DOI http://dx.doi.org/10.1016/S0144-8617(96)00166-X.
handari, P. N., Jones, D. D., & Hanna, M. A. (2012). Carboxymethylation of cellu-lose using reactive extrusion. Carbohydrate Polymers, 87(3), 2246–2254. DOIhttp://dx.doi.org/10.1016/j.carbpol.2011.10.056.
iswas, A., Kim, S., Selling, G. W., & Cheng, H. N. (2014). Conversion of agriculturalresidues to carboxymethylcellulose and carboxymethylcellulose acetate. Indus-trial Crops and Products, 60(0), 259–265. http://dx.doi.org/10.1016/j.indcrop.2014.06.004
rowning, B. L. (1967). Methods of wood chemistry. New York: John Wiley & Sons.
olymers 131 (2015) 125–133
Caddick, S., & Fitzmaurice, R. (2009). Microwave enhanced synthesis. Tetrahedron,65(17), 3325–3355. DOI http://dx.doi.org/10.1016/j.tet.2009.01.105.
Chen, W., Yu, H., Liu, Y., Chen, P., Zhang, M., & Hai, Y. (2011). Individualization ofcellulose nanofibers from wood using high-intensity ultrasonication combinedwith chemical pretreatments. Carbohydrate Polymers, 83(4), 1804–1811. DOIhttp://dx.doi.org/10.1016/j.carbpol.2010.10.040.
Cheng, H. N., & Biswas, A. (2011). Chemical modification of cotton-based natu-ral materials: Products from carboxymethylation. Carbohydrate Polymers, 84(3),1004–1010. DOI http://dx.doi.org/10.1016/j.carbpol.2010.12.059.
Flauzino Neto, W. P., Silvério, H. A., Dantas, N. O., & Pasquini, D. (2013).Extraction and characterization of cellulose nanocrystals from agro-industrialresidue—Soy hulls. Industrial Crops and Products, 42(0), 480–488. DOIhttp://dx.doi.org/10.1016/j.indcrop.2012.06.041.
Forssell, P., Kontkanen, H., Schols, H. A., Hinz, S., Eijsink, V. G. H., Treimo, J.,et al. (2008). Hydrolysis of brewers’ spent grain by carbohydrate degradingenzymes. Journal of the Institute of Brewing, 114(4), 306–314. DOI 10.1002/j.2050-0416.2008.tb00774.x.
Gawande, M. B., Shelke, S. N., Zboril, R., & Varma, R. S. (2014). Microwave-Assisted chemistry: synthetic applications for rapid assembly of nanomaterialsand organics. Accounts of Chemical Research, 47(4), 1338–1348. DOI 10.1021/ar400309b.
Gu, H., He, J., Huang, Y., & Guo, Z. (2012). Water soluble carboxymethylcellulose fibersderived from alkalization-etherification of viscose fibers. Fibers and Polymers,13(6), 748–753. DOI 10.1007/s12221-012-0748-x.
Heinze, T., & Koschella, A. (2005). Carboxymethyl ethers of cellulose and starch—Areview. Macromolecular Symposia, 223(1), 13–40. DOI 10.1002/masy.200550502.
Ho, F. F. L., & Klosiewicz, D. W. (1980). Proton nuclear magnetic resonance spectrom-etry for determination of substituents and their distribution in carboxymethyl-cellulose. Analytical Chemistry, 52(6), 913–916. DOI 10.1021/ac50056a032.
Johar, N., Ahmad, I., & Dufresne, A. (2012). Extraction, preparation and characteri-zation of cellulose fibres and nanocrystals from rice husk. Industrial Crops andProducts, 37(1), 93–99. DOI http://dx.doi.org/10.1016/j.indcrop.2011.12.016.
Kumar, A., Negi, Y. S., Bhardwaj, N. K., & Choudhary, V. (2012). Syn-thesis and characterization of methylcellulose/PVA based porous com-posite. Carbohydrate Polymers, 88(4), 1364–1372. DOI http://dx.doi.org/10.1016/j.carbpol.2012.02.019.
Li, J., Zhang, L.-P., Peng, F., Bian, J., Yuan, T.-Q., Xu, F., et al. (2009). Microwave-assistedsolvent-free acetylation of cellulose with acetic anhydride in the presence ofiodine as a catalyst. Molecules, 14(9), 3551–3566, http://www.scopus.com/inward/record.url?eid=2-s2.0-70349556803&partnerID=40&md5=e02cbf146d55cf2124e4c3e16d1149e3.
Meneses, N. G. T., Martins, S., Teixeira, J. A., & Mussatto, S. I. (2013).Influence of extraction solvents on the recovery of antioxidant phenoliccompounds from brewer’s spent grains. Separation and Purification Tech-nology, 108, 152–158, http://www.scopus.com/inward/record.url?eid=2-s2.0-84875197003&partnerID=40&md5=780402e79a46f25790f3e137b8b6c10e.
Morán, J., Alvarez, V., Cyras, V., & Vázquez, A. (2008). Extraction of cellulose andpreparation of nanocellulose from sisal fibers. Cellulose, 15(1), 149–159. DOI10.1007/s10570-007-9145-9.
Moseley, J. D., & Kappe, C. O. (2011). A critical assessment of the greenness andenergy efficiency of microwave-assisted organic synthesis. Green Chem., 13(4),794–806. DOI 10.1039/C0GC00823K.
Mussatto, S. I., Dragone, G., & Roberto, I. C. (2006). Brewers’ spent gra generationcharacteristics potential applications. Journal of Cereal Science, 43(1,), 1–14. DOIhttp://dx. doi org/10.1016/j. jcs.2005.06.001.
Mussatto, S. I., Dragone, G., Rocha, G. J. M., & Roberto, I. C. (2006). Optimumoperating conditions for brewer’s spent grain soda pulping. CarbohydratePolymers, 64(1), 22–28, http://www.scopus.com/inward/record.url?eid=2-s2.0-33745041751&partnerID=40&md5=4f844fc40fcadb87c203d70b419fd0bb.
Mussatto, S. I., & Roberto, I. C. (2008). Establishment of the optimum ini-tial xylose concentration and nutritional supplementation of brewer’sspent grain hydrolysate for xylitol production by Candida guilliermondii.Process Biochemistry, 43(5), 540–546. DOI http://dx.doi.org/10.1016/j.procbio.2008.01.013.
Mussatto, S. I., Rocha, G. J. M., & Roberto, I. C. (2008). Hydrogen peroxidebleaching of cellulose pulps obtained from brewer’s spent grain. Cellu-lose, 15(4), 641–649, http://www.scopus.com/inward/record.url?eid=2-s2.0-45949090863&partnerID=40&md5=0e7d84be260a9f56417dfc3e5442a686.
Nanda, S., Mohanty, P., Pant, K. K., Naik, S., Kozinski, J. A., & Dalai, A. K. (2013).Characterization of North American lignocellulosic biomass and biochars interms of their candidacy for alternate renewable fuels. Bioenergy Research,6(2), 663–677, http://www.scopus.com/inward/record.url?eid=2-s2.0-84876969305&partnerID=40&md5=c72e7b3a6a0d56ae56311755983c8fd9.
Niemi, P., Martins, D., Buchert, J., & Faulds, C. B. (2013). Pre-hydrolysiswith carbohydrases facilitates the release of protein from brewer’sspent grain. Bioresource Technology, 136(0), 529–534. DOI http://dx.doi.org/10.1016/j.biortech.2013.03.076.
Nuchter, M., Ondruschka, B., Bonrath, W., & Gum, A. (2004). Microwave assistedsynthesis—A critical technology overview. Green Chemistry, 6(3), 128–141. DOI10.1039/B310502D.
Park, S., Baker, J. O., Himmel, M. E., Parilla, P. A., & Johnson, D. K. (2010). Cellulose
crystallinity index: Measurement techniques and their impact on interpretingcellulase performance. Biotechnology for Biofuels, 3. DOI 10.1186/1754-6834-3-10.Pires, E. J., Ruiz, H. A., Teixeira, J. A., & Vicente, A. A. (2012). A newapproach on brewer’s spent grains treatment and potential use as
rate P
P
P
R
R
D.M.d. Santos et al. / Carbohyd
lignocellulosic yeast cells carriers. Journal of Agricultural and Food Chemistry,60(23), 5994–5999, http://www.scopus.com/inward/record.url?eid=2-s2.0-84862208224&partnerID=40&md5=81e1fa71dd5784d096021d78bf42ddbd.
oerschmann, J., Weiner, B., Wedwitschka, H., Baskyr, I., Koehler, R.,& Kopinke, F.-D. (2014). Characterization of biocoals and dissolvedorganic matter phases obtained upon hydrothermal carbonizationof brewer’s spent grain. Bioresource Technology, 164(0), 162–169. DOIhttp://dx.doi.org/10.1016/j.biortech.2014.04.052.
ushpamalar, V., Langford, S. J., Ahmad, M., & Lim, Y. Y. (2006). Optimiza-tion of reaction conditions for preparing carboxymethyl cellulose from sagowaste. Carbohydrate Polymers, 64(2), 312–318. DOI http://dx.doi.org/10.1016/j.carbpol.2005.12.003.
agheb, a. a., Nassar, S. H., Abd El-Thalouth, I., Ibrahim, M. a., & Shahin, a. a.(2012). Preparation, characterization and technological evaluation of CMCderived from rice-straw as thickening agents in discharge, discharge–resistand burn-out printing. Carbohydrate Polymers, 89(4), 1044–1049. DOI
10.1016/j.carbpol.2012.03.054.uzene, D., Gonc alves, A., Teixeira, J., & Pessoa de Amorim, M. (2007). Car-boxymethylcellulose obtained by ethanol/water organosolv process under acidconditions. Applied Biochemistry and Biotechnology, 137–140(1–12), 573–582.http://dx.doi.org/10.1007/s12010-007-9080-0
olymers 131 (2015) 125–133 133
Sheltami, R. M., Abdullah, I., Ahmad, I., Dufresne, A., & Kargarzadeh, H. (2012).Extraction of cellulose nanocrystals from mengkuang leaves (Pandanus tec-torius). Carbohydrate Polymers, 88(2), 772–779. DOI http://dx.doi.org/10.1016/j.carbpol.2012.01.062.
Singh, R. K., & Khatri, O. P. (2012). A scanning electron micro-scope based new method for determining degree of substitutionof sodium carboxymethyl cellulose. Journal of Microscopy, 246(1),43–52, http://www.scopus.com/inward/record.url?eid=2-s2.0-84857996843&partnerID=40&md5=4d62bc77c70e9695a02235776957e2ae.
Singh, R., & Singh, A. (2013). Optimization of reaction conditions for preparing car-boxymethyl cellulose from corn cobic agricultural waste. Waste and BiomassValorization, 4(1), 129–137. DOI 10.1007/s12649-012-9123-9.
Sun, X. F., Xu, F., Sun, R. C., Geng, Z. C., Fowler, P., & Baird, M. S. (2005). Characteris-tics of degraded hemicellulosic polymers obtained from steam exploded wheatstraw. Carbohydrate Polymers, 60(1), 15–26. DOI http://dx.doi.org/10.1016/j.carbpol.2004.11.012.
Xiros, C., & Christakopoulos, P. (2012). Biotechnological potential of brewers spent
grain and its recent applications. Waste and Biomass Valorization, 3(2), 213–232.DOI 10.1007/s12649-012-9108-8.Zhu, Y.-J., & Chen, F. (2014). Microwave-assisted preparation of inorganicnanostructures in liquid phase. Chemical Reviews, 114(12), 6462–6555. DOI10.1021/cr400366s.


![Index [application.wiley-vch.de] · Carbopol gels 711 carboxymethylated cellulose fibers 809 carboxymethylation 14 carboxymethyl cellulose (CMC) 144, 675, 723, 809 cardiomyocytes](https://static.fdocuments.net/doc/165x107/5e6f6f3749d7946e6c7fbc76/index-carbopol-gels-711-carboxymethylated-cellulose-ibers-809-carboxymethylation.jpg)


![Cellulose Nanofibers and Other Biopolymers for Biomedical ... · pretreatments, such as enzymatic hydrolysis [14], partial carboxymethylation [15], ... protein animal-based polymers,](https://static.fdocuments.net/doc/165x107/5f4f8508db49655ce34d6e0e/cellulose-nanofibers-and-other-biopolymers-for-biomedical-pretreatments-such.jpg)


